Fig. 1.
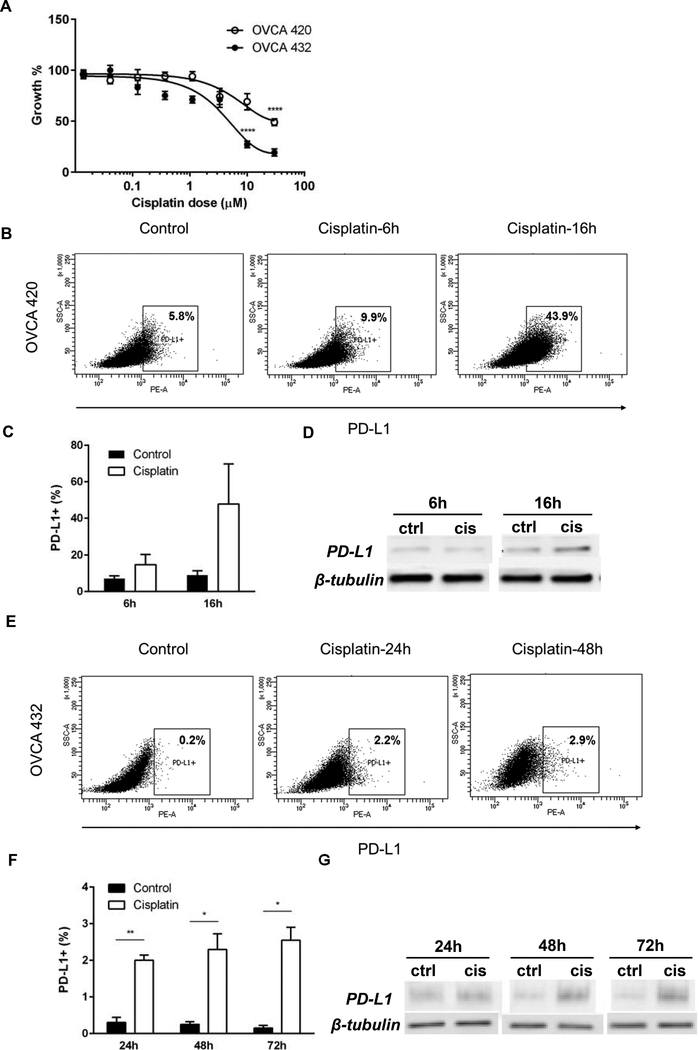
(A) Cisplatin dose response growth curves of OVCA432 (open circles) and OVCA420 human EOC cells (black circles). Measurements at 48 h were obtained via MTT assay and were performed in triplicate. SD bars are shown (**** p<0.0001, Student t test.) (B, E) PD-L1 expression in OVCA420 and OVCA432 cells (B and E, respectively), treated with cisplatin IC50 at various time points.Gates were set according to isotype control . (C, F) Percentages of PD-L1 positive OVCA420 (C) and OVCA432 (F) cells in culture, in the absence (control) or presence of IC50 cisplatin, at various time points. Averages of percentages from two separate experiments are shown. (D, G) PD-L1 detection in cell lysates from OVCA420 (D) and OVCA432 cells (G), by Western blot. Cells were treated with IC50 cisplatin, for the time shown. Beta-tubulin was used as loading control.

