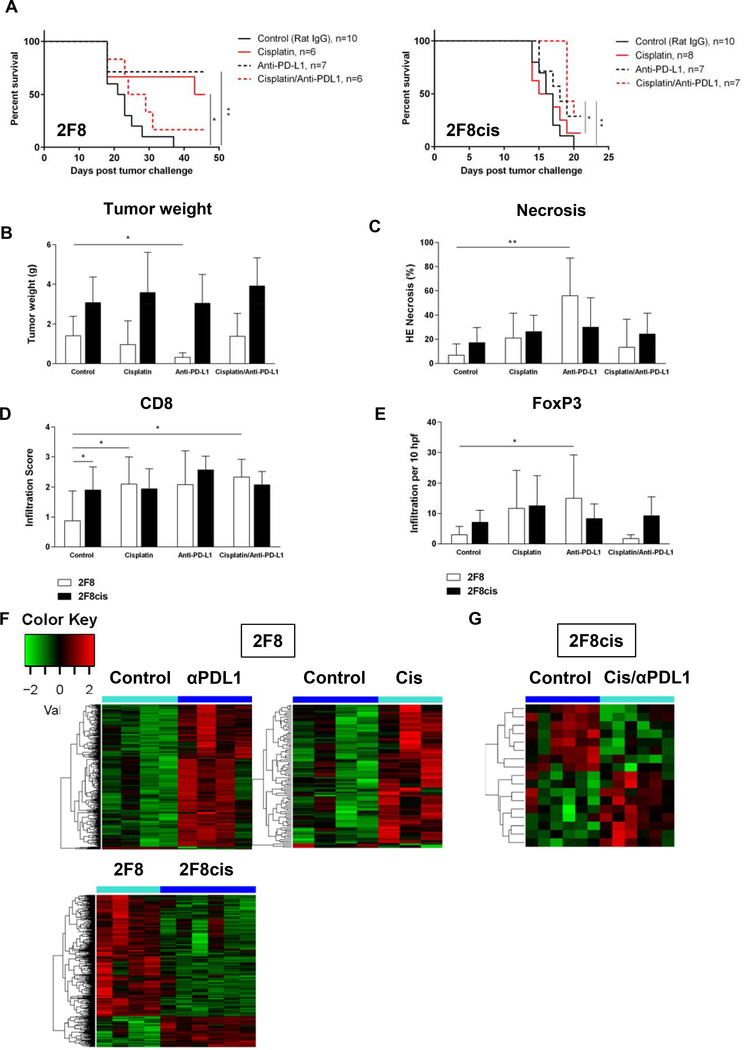
Fig. 5.
(A) Kaplan-Meier survival curves of mice injected IP with either 2F8 cells (left) or 2F8cis cells (right) and treated with either control antibody (solid black line), cisplatin (solid red line), anti-PD-L1- (dotted black line) or cisplatin/anti-PD-L1 combination (dotted red line). * p<0.05; ** p<0.005 (log-rank test). (B-E) Changes in tumor burden (B) necrosis areas (C), CD8 (D) and Foxp3 T cell infiltration (E) in mice with 2F8 (grey bars) and 2F8cis tumors (black bars). * p<0.05 Student t test. Average values for the group and SD are shown. (F, G) Heatmap of DE genes triggered by survival-increasing treatments in the 2F8 (F) and 2F8cis model (G). Up- and down-regulated genes are shown red and green, respectively. All genes shown in the heatmaps are listed in Suppl. Table 4. (H) Heatmap of DE genes in 2F8cis compared to 2F8 tumors. Genes are listed in Suppl. Table 6. All heatmaps use the scale shown in panel F.

