Abstract
Background
Primary cutaneous malignant melanoma is a cancer of the pigment cells of the skin, some of which are accompanied by BRAF mutation. Melanoma incidence and mortality rates have been rising around the world. As the current knowledge about pathogenesis, clinical and genetic features of cutaneous melanoma is not very clear, we aim to use bioinformatics to identify the potential key genes involved in the expression and mutation status of BRAF.
Methods
Firstly, we used UCSC public hub datasets of melanoma (Lin et al., Cancer Res 68(3):664, 2008) to perform weighted genes co-expression network analysis (WGCNA) and differentially expressed genes analysis (DEGs), respectively. Secondly, overlapping genes between significant gene modules and DEGs were screened and validated at transcriptional levels and overall survival in TCGA and GTEx datasets. Lastly, the functional enrichment analysis was accomplished to find biological functions on the web-server database.
Results
We performed weighted correlation network and differential expression analyses, using gene expression data in melanoma samples. We identified 20 genes whose expression was correlated with the mutation status of BRAF. For further validation, three of these genes (CYR61, DUSP1, and RNASE4) were found to have similar expression patterns in skin tumors from TCGA compared with normal skin samples from GTEx. We also found that weak expression of these three genes was associated with worse overall survival in the TCGA data. These three genes were involved in the nucleic acid metabolic process.
Conclusion
In this study, CYR61, DUSP1, and RNASE4 were identified as potential genes of interest for future molecular studies in melanoma, which would improve our understanding of its causes and underlying molecular events. These candidate genes may provide a promising avenue of future research for therapeutic targets in melanoma.
Electronic supplementary material
The online version of this article (10.1186/s12881-019-0791-1) contains supplementary material, which is available to authorized users.
Keywords: Weighted gene co-expression network analysis, Differentially expressed genes, Overall survival, Melanoma, BRAF gene
Background
Skin cutaneous melanoma (SKCM) is a malignant cancer that originates from melanocytes and exists in different forms. The main types are basal cell cancer (BCC), squamous cell cancer (SCC) and melanoma [1, 2]. Melanoma is the most dangerous type of skin cancer. The primary cause of melanoma is ultraviolet light (UV) exposure in those with low levels of skin pigment [1, 2]. The UV light may come from the sun or other sources, such as artificial light devices. Besides, about 25 % of melanoma derives from moles. Those with many moles, a history of affected family members, and who have poor immune function were at greater risk [2]. A number of rare genetic defects such as xeroderma pigmentosum also increase risk [3]. Diagnosis can be finished by biopsy of any concerning skin lesion [2].
At least 50 % of melanomas harbor a V600E mutation in the BRAF gene. Tumors with BRAF mutations could respond to BRAF kinase inhibitor vemurafenib that was approved by the FDA in 2011 for therapy of patients with advanced melanoma and late-stage (metastatic) melanoma [4, 5]. Recently, the FDA approved the other two drugs named dabrafenib and ipilimumab as therapy for patients with BRAF V600E mutation-positive in melanoma [6].
Existing research has revealed that cancer cannot be caused by only one gene or factor. It must be a network of different genes and pathways working together. Weighted gene co-expression network analysis (WGCNA) [7] is a methodology used to analyze novel gene modules co-expressing in gene expression data. Many studies have shown that WGCNA can be used to explore genes, a network of genes and correlation of genes in different cancers [8, 9]. Moreover, differentially expressed genes (DEGs) analysis method has been applied in gene expression data [10].
In this paper, the study was designed to find potential genes and correlated pathways associated with the expression level and mutation status of BRAF in melanoma samples. By analyzing gene expression data [11] from UCSC public hub with the WGCNA algorithm and DEGs analysis, significant gene modules associated with the expression level of BRAF were identified and differentially expressed genes associated with the mutation status of BRAF were screened, then overlapping genes were validated in TCGA and GTEx database.
Materials and methods
Data collection
A dataset containing the gene expression and basic phenotypes information of 95 melanoma samples was downloaded from the Cancer Browser website (https:// xenabrowser.net/datapages/?cohort=Melanoma%20 (Lin%202,008)). The gene expression information was experimentally collected through GeneChip Fluidics Station (Affymetrix), and the matrix values were log2 ratio transformed. Genes were mapped onto Affymetrix HT-HGU133A probeMAP.
Study population
Melanoma samples that had both expression data and BRAF mutation status were included for further analysis. According to this criterion, there were 67 melanoma samples (30 BRAF wild-type and 37 BRAF mutation) corresponding to our analysis requirement.
Data processing
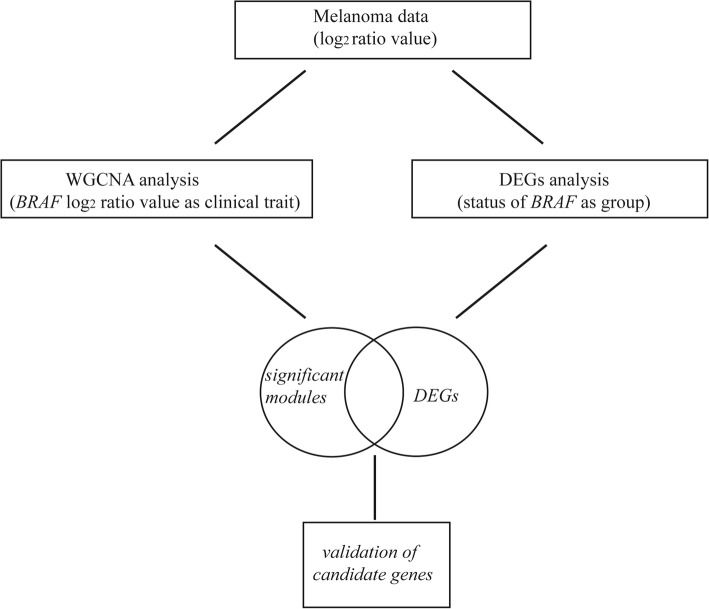
After the dataset was downloaded, probe identification numbers (IDs) were transformed into gene symbols. For multiple probes corresponding to one gene, the probe with the most significant p-value from the downstream differential analysis was retained as the gene expression value. As for DEGs analysis, we divided 67 samples into two groups (BRAF wild-type and BRAF mutation group) for screening differentially expressed genes. As for WGCNA analysis, we used BRAF gene expression values as clinical trait data. Figure 1 shows the paths of the data analysis.
Fig. 1.
Data analysis workflow
Weighted gene co-expression network construction
The full set of genes with available expression data (10,994 genes) was applied to find the scale-free gene modules of co-expression and highly correlated genes constructed by WGCNA [7]. To construct a weighted gene network, the soft threshold power β was set to 3, which was the lowest power based on scale-free topology [12]. We set the parameter maxBlockSize = 11,000, and TOMType = “unsigned”. Topological overlap matrix (TOM) was calculated by adjacency transformation, and the value (1-TOM) was designated to the distance for identification of hierarchical clustering genes and modules. The minimum module size was set to 30.
Module clinical feature associations
In order to identify modules that were significantly associated with the designated clinical trait (the expression level of BRAF), we plotted the heat map of modules-trait relationship according to the tutorial of the WGCNA package for R.
Identification of DEGs
Linear models for microarray data (limma package) is a library used for analyzing gene expression microarray data [13], especially for the assessment of differential expression and the analysis of designed experiments [14, 15]. limma package in R has been applied to identify the DEGs between BRAF mutation and wild-type (marked as control group) samples. Genes with |log2 fold change (FC)| ≥ 1 and adjusted p-value < 0.05 as the cut-off criterion were selected for subsequent analysis.
Validation of candidate genes
The overlapping genes between significant modules and DEGs were chosen as the potential genes for deep analysis and validation. GEPIA [16] (website: http://gepia.cancer-pku.cn/) is a web server for analyzing the RNA sequencing expression data of 9736 tumors and 8587 normal samples from the TCGA and the GTEx projects, using a standard processing pipeline. Survival analysis and expression consistency evaluation of potential genes were carried out in GEPIA built-in SKCM and GTEx datasets, which contain 461TCGA-SKCM tumor patients, 1TCGA-SKCM normal control, and 557 GTEx normal skin samples. For the transcriptional level validation, the criteria of significant results was set to |log2 fold change| ≥ 1 and p-value < 0.01. For the overall survival analysis in TCGA datasets, the 458 samples with available overall survival data were divided into high and low expression groups using the median TPM as a breakpoint, and significance was determined using a logrank test with p < 0.05.
Functional enrichment analysis
GenCLiP 2.0 [17] is a web-based text-mining server, which can analyze human genes associated with biological functions and molecular networks. We uploaded filtered genes to online analysis tool GenCLiP 2.0 (http://ci.smu.edu.cn/GenCLiP2/ analysis.php) to find correlated significant pathways.
Results
Expression value analysis of microarray data
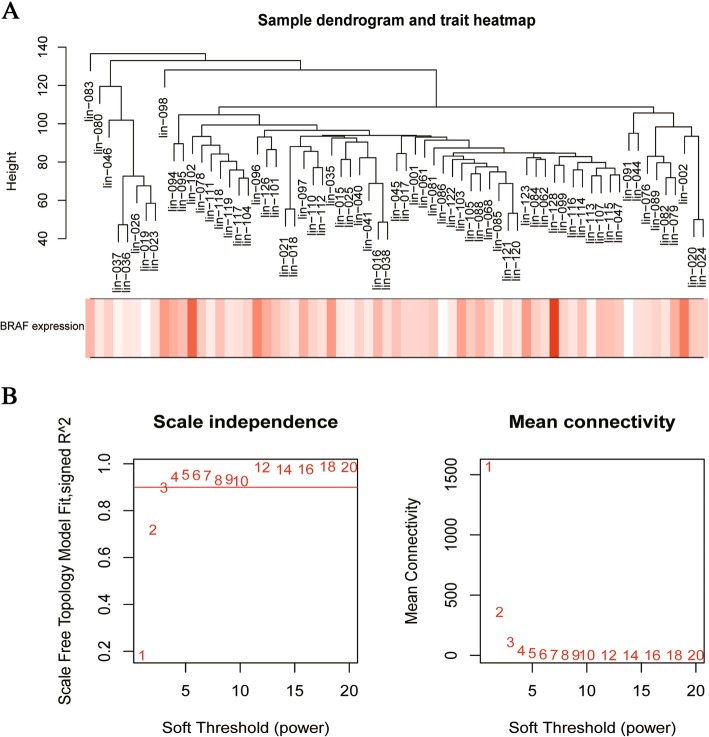
We chose 10,994 genes and 67 samples to construct the gene co-expression network by WGCNA. Figure 2a showed the relationship between the expression level of BRAF and melanoma samples.
Fig. 2.
The clustering of samples and selection of soft-thresholding power. a The clustering dendrogram of samples based on their Euclidean distance. b Analysis of the scale-free fit index for various soft-thresholding powers
Weighted gene co-expression network construction
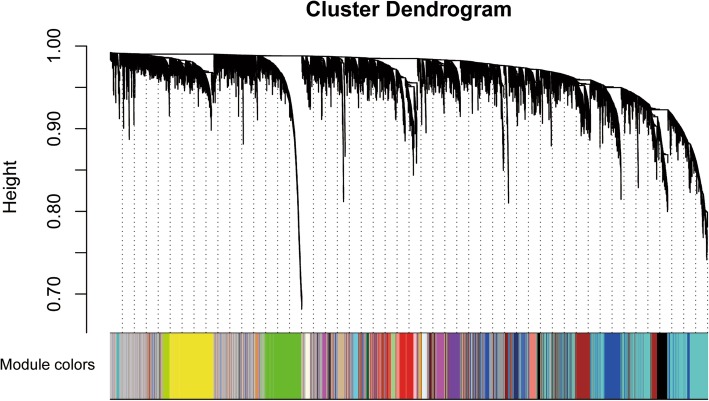
Choosing a proper soft-thresholding power is a critical step when constructing a WGCNA network. As shown in Fig. 2b, power value 3(β = 3) was selected to produce a hierarchical clustering tree (Fig. 3) with different colors representing different modules.
Fig. 3.
The clustering dendrogram of genes in melanoma, every color below represents one co-expression gene module
Module clinical feature associations
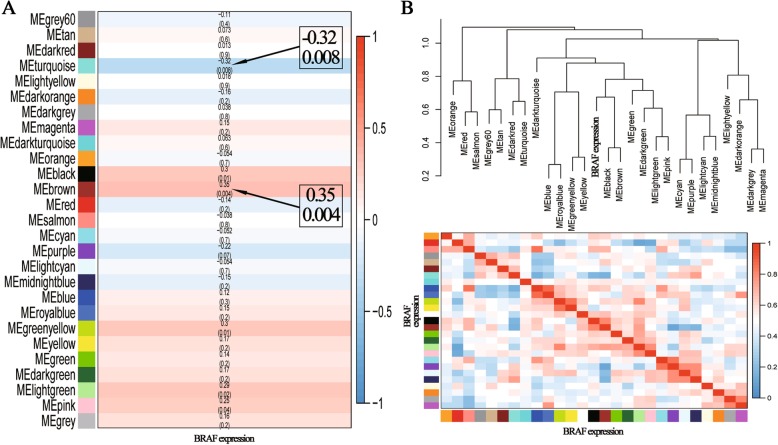
Since we had a summary profile (eigengene) for each module, we simply correlated eigengenes with external traits (marked BRAF expression) and looked for the most significant associations. It was clear that the MEbrown (1021 genes) was most positive associated with the expression of BRAF (Fig. 4a). The results also demonstrated that the MEturquoise (1858 genes) was most negative associated with the expression of BRAF (Fig. 4a).
Fig. 4.
a Heatmap of module-trait relationships. The brown module was the most positive module (correlation coefficients: 0.35, and p-value: 0.004) correlated with the expression of BRAF, and the turquoise was the most negative module (correlation coefficients: −0.32, and p-value: 0.008). b Hierarchical clustering of module and heatmap plot of the eigengene adjacencies
As shown in Fig. 4b, there were 27 eigengenes. The upper panels presented hierarchical clustering dendrograms of the eigengenes, in which the dissimilarity of eigengenes had been visualized. The bottle heatmaps presented the eigengene adjacencies for the expression of BRAF. The dendrogram indicated that brown and black modules were highly related and their correlations were stronger than their individual correlations with the expression BRAF (Fig. 4b).
Identification of DEGs
Compared with BRAF wild type group, a total of 36 genes were identified in BRAF mutation group by the threshold of |log2 fold change (FC)| ≥ 1 and adjusted p-value < 0.05, of which 9 were up-regulated genes and 27 were down-regulated genes (Table 1).
Table 1.
Thirty-six differentially expressed genes (DEGs) were identified from melanoma, including 9 up-regulated genes and 27 down-regulated genes. (The up-regulated genes were listed from the largest to the smallest of fold changes, and down-regulated genes were listed from the smallest to largest)
| DEGs | Genes |
|---|---|
| Up-regulated | MGP, ASB9, FCDH7, FXYD3, SORL1, PCSK6, MGST2, ITGB3, CORO2B |
| Down-regulated | MME, CYR61, CXCL1, MYL9, FOS, MICAL2, MFAP2, ID3, TXNIP, TNFAIP3, COX7A1, DUSP1, RNASE4, GALC, ANGPTL4, IFI6, NCRNA00312, FHOD3, ZSCAN18, PTEN, WSB1, SOD2, NID2, ANG, FERMT2, DACT1, FAM69A |
Validation of candidate genes
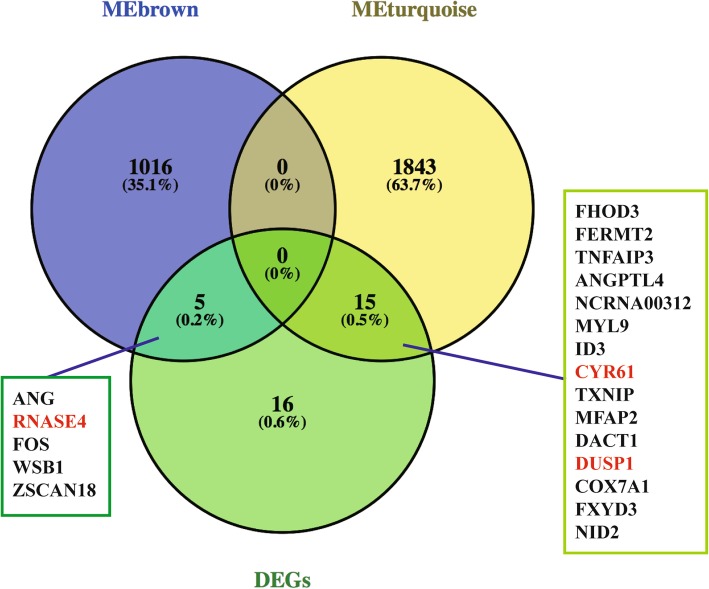
There were 1021 genes in the brown module, 1858 genes in the turquoise module and 36 genes in the DEGs (Fig. 5). As shown in Venn diagram, it had 5 genes (ANG, RNASE4, FOS, WSB1, ZSCAN18) between MEbrown and DEGs, and 15 genes (FHOD3, FERMT2, TNFAIP3, ANGPTL4, NCRNA00312, MYL9, ID3, CYR61, TXNIP, MFAP2, DACT1, DUSP1, COX7A1, FXYD3, NID2) between MEturquoise and DEGs (Fig. 5).
Fig. 5.
A Venn diagram showing the overlapping genes between modules and DEGs. Genes marked in red met the screening criteria and were chosen as the final set of candidate genes
In order to verify these 20 overlapping candidate genes, we validated on online web server GEPIA, which contained the TCGA and GTEx melanoma samples. Figure 6a-b demonstrated the expression level of 3 genes in BRAF wild-type and BRAF mutation samples of melanoma, which was in accordance with its expression level in normal and tumor patients of SKCM. It was also revealed that low expression of these three genes has a worse overall survival in SKCM patients (Fig. 6c). Besides, we had discarded the other 17 genes that did not exhibit significant differential expression in the TCGA/GTEx data concordant with that observed in the Lin et al. data, and were not associated with significantly worse overall survival compared high expression group with low expression group in the TCGA/GTEx data (Additional file 1: Figure S1, S2 and S3).
Fig. 6.
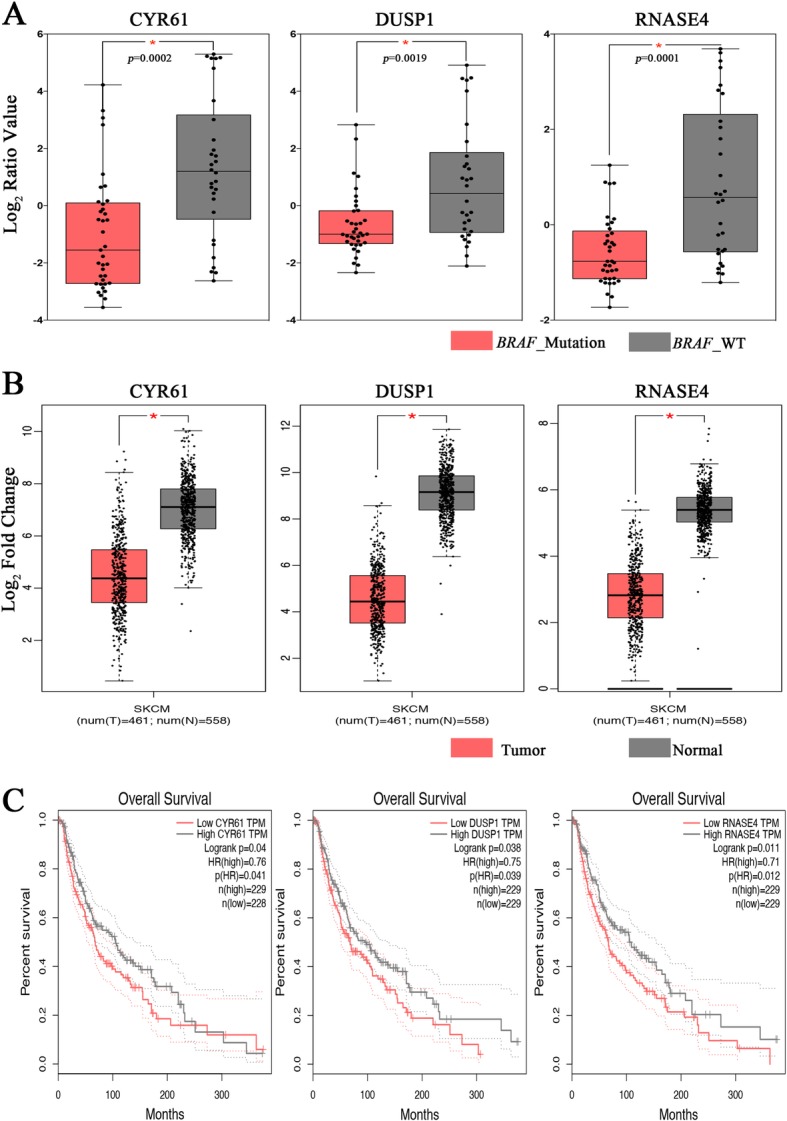
a The gene expression (log2 ratio value) of CYR61, DUSP1, and RNASE4 in melanoma samples (unpaired t test, * indicates p < 0.01). b Validation of the gene expression of CYR61, DUSP1, and RNASE4 in TCGA-SKCM (including 461 tumor patients and 1 normal control) and GTEx (including 557 normal control). The cutoff was set to |log2 fold change (FC)| ≥ 1, and p < 0.01. * indicates p < 0.01. c Overall survival analysis of the expression level of CYR61, DUSP1, and RNASE4 in TCGA-SKCM on GEPIA website
Functional enrichment analysis
We used online website GenCLiP 2.0 tools to perform the functional and signaling pathway enrichment analysis of the above three genes (CYR61, DUSP1, and RNASE4). As shown in Table 2, the potential candidate genes (CYR61, DUSP1, and RNASE4) were involved in the nucleic acid metabolic process, while CYR61 and DUSP1 were most significantly enriched in the growth factor binding, ERK1 and ERK2 cascade, and regulation of ERK1 and ERK2 cascade.
Table 2.
The gene ontology analysis of potential key genes in melanomas
| ID | Term | Count | p-value | Genes |
|---|---|---|---|---|
| GO:0016788 | hydrolase activity, acting on ester bonds | 2 | 0.00465 | CYR61, RNASE4 |
| GO:0090304 | nucleic acid metabolic process | 3 | 0.02260 | CYR61, DUSP1, RNASE4 |
| GO:0008219 | cell death | 2 | 0.03509 | CYR61, DUSP1 |
| GO:0071495 | cellular response to endogenous stimulus | 2 | 0.01713 | CYR61, DUSP1 |
| GO:0071310 | cellular response to organic substance | 2 | 0.04895 | CYR61, DUSP1 |
| GO:0009790 | embryo development | 2 | 0.008327 | CYR61, DUSP1 |
| GO:0048598 | embryonic morphogenesis | 2 | 0.00303 | CYR61, DUSP1 |
| GO:0019838 | growth factor binding | 2 | 0.00014 | CYR61, DUSP1 |
| GO:0006915 | apoptotic process | 2 | 0.03095 | CYR61, DUSP1 |
| GO:0043066 | negative regulation of apoptotic process | 2 | 0.00673 | CYR61, DUSP1 |
| GO:0060548 | negative regulation of cell death | 2 | 0.007915 | CYR61, DUSP1 |
| GO:0043069 | negative regulation of programmed cell death | 2 | 0.00688 | CYR61, DUSP1 |
| GO:0048646 | anatomical structure formation involved in morphogenesis | 2 | 0.01169 | CYR61, DUSP1 |
| GO:0016310 | phosphorylation | 2 | 0.04169 | CYR61, DUSP1 |
| GO:0043065 | positive regulation of apoptotic process | 2 | 0.00311 | CYR61, DUSP1 |
| GO:0010942 | positive regulation of cell death | 2 | 0.00354 | CYR61, DUSP1 |
| GO:0043068 | positive regulation of programmed cell death | 2 | 0.00316 | CYR61, DUSP1 |
| GO:0012501 | programmed cell death | 2 | 0.03166 | CYR61, DUSP1 |
| GO:0006468 | protein phosphorylation | 2 | 0.02993 | CYR61, DUSP1 |
| GO:0006508 | proteolysis | 2 | 0.02311 | CYR61, DUSP1 |
| GO:0070372 | regulation of ERK1 and ERK2 cascade | 2 | 0.00054 | CYR61, DUSP1 |
| GO:0043408 | regulation of MAPK cascade | 2 | 0.00578 | CYR61, DUSP1 |
| GO:0042981 | regulation of apoptotic process | 2 | 0.01902 | CYR61, DUSP1 |
| GO:0050790 | regulation of catalytic activity | 2 | 0.04813 | CYR61, DUSP1 |
| GO:0010941 | regulation of cell death | 2 | 0.02167 | CYR61, DUSP1 |
| GO:0051128 | regulation of cellular component organization | 2 | 0.04404 | CYR61, DUSP1 |
| GO:1902531 | regulation of intracellular signal transduction | 2 | 0.02427 | CYR61, DUSP1 |
| GO:0043549 | regulation of kinase activity | 2 | 0.00783 | CYR61, DUSP1 |
| GO:0019220 | regulation of phosphate metabolic process | 2 | 0.02663 | CYR61, DUSP1 |
| GO:0051174 | regulation of phosphorus metabolic process | 2 | 0.02702 | CYR61, DUSP1 |
| GO:0042325 | regulation of phosphorylation | 2 | 0.02016 | CYR61, DUSP1 |
| GO:0043067 | regulation of programmed cell death | 2 | 0.01933 | CYR61, DUSP1 |
| GO:0070371 | ERK1 and ERK2 cascade | 2 | 0.00060 | CYR61, DUSP1 |
| GO:0000165 | MAPK cascade | 2 | 0.00687 | CYR61, DUSP1 |
| GO:0009888 | tissue development | 2 | 0.02669 | CYR61, DUSP1 |
| GO:0044702 | single organism reproductive process | 2 | 0.01329 | CYR61, DUSP1 |
| GO:0023014 | signal transduction by protein phosphorylation | 2 | 0.00735 | CYR61, DUSP1 |
| GO:0009719 | response to endogenous stimulus | 2 | 0.02830 | CYR61, DUSP1 |
| GO:0022414 | reproductive process | 2 | 0.01641 | CYR61, DUSP1 |
| GO:0000003 | reproduction | 2 | 0.01646 | CYR61, DUSP1 |
| GO:0051338 | regulation of transferase activity | 2 | 0.01001 | CYR61, DUSP1 |
| GO:0030162 | regulation of proteolysis | 2 | 0.00476 | CYR61, DUSP1 |
| GO:0001932 | regulation of protein phosphorylation | 2 | 0.01783 | CYR61, DUSP1 |
| GO:0031399 | regulation of protein modification process | 2 | 0.02839 | CYR61, DUSP1 |
| GO:0045859 | regulation of protein kinase activity | 2 | 0.00701 | CYR61, DUSP1 |
Discussion
Melanoma is the most fatal form of skin cancer and strikes tens of thousands of people worldwide each year. The amount of cases is increasing faster than any other type of malignant cancer [18].
Many patients with BRAF mutation have received target treatments and therapies which activate their body’s own immune system. There is BRAF mutation in melanoma. Besides, mutation also exists in NRAS gene and PTEN gene. Some scientists have struggled to find drugs targeting the mutated NRAS protein or NRAS protein [19], while others have uncovered a mechanism of resistance of targeted therapies for melanoma and identified compounds that inhibit eIF4F and enhance the effectiveness of vemurafenib in mice with melanomas [20].
In this study, firstly we applied WGCNA to identify the two key modules in melanoma that were associated with the expression of BRAF gene (the brown module was positive, and the turquoise was negative). At the same time, we identified the DEGs in the BRAF mutation group compared with BRAF wild-type group. Then, we chose the overlapping genes between modules and DEGs. Finally, as to the gene expression level and overall survival validation, we expand the scope of comparison range to the tumor group versus the normal group in TCGA/GTEx datasets.
We found that CYR61, DUSP1, and RNASE4 were significantly related to gene expression level and survival analysis results. CYR61 (Cysteine-rich angiogenic inducer 61) is a secreted, matricellular protein [21], which is associated with a range of cellular activities, such as cell adhesion, migration, differentiation, proliferation, apoptosis [21, 22]. Beak et al. suggested that CYR61 was highly expressed in colorectal carcinomas (CRC) and CYR61 might play a role as meaningful targets for therapeutic intervention of patients with CRC [23]. D’ Antonio et al. also found that decreased expression level of CRY61 was associated with prostate cancer recurrence after surgical treatment [24]. DUSP1 (Dual specificity protein phosphatase 1) is an oncogene that is associated with cancer progression in gastric cancer as well as a negative regulator of the mitogen-activated protein kinase (MAPK) signaling pathway, has anti-inflammatory properties [25–27]. Xiaoyi et al. also found that DUSP1 phosphatase regulated the pro-inflammatory milieu in head and neck squamous cell carcinoma [28], in addition to promoting angiogenesis, invasion, and metastasis in non-small-cell lung cancer (NSCLC) [29]. RNASE4 (Ribonuclease 4) is an RNase that belongs to the pancreatic ribonuclease family and has marked specificity towards the 3′ side of uridine nucleotides [30]. Unfortunately, to date there has been no research focused on the relationship between these several genes with melanoma.
The primary purpose of the study focuses on the prediction of key potential genes in cancers via data mining and data analysis. Though we have validated results in the TCGA and GTEx datasets, results need to be confirmed through molecular and cellular experiments.
Conclusions
Firstly, we have identified overlapping genes associated with the expression and the mutation status of BRAF in melanoma through WGCNA and DEGs analysis, respectively. Then, validation was applied to these overlapping genes, and three genes (CYR61, DUSP1, and RNASE4) were screened. However, more direct evidence is needed to confirm their association with melanoma. The study may be helpful for future studies concerning melanoma with the aim of finding potential key molecule targets of melanoma.
Additional file
Figures S1-S3. Rows represent expression of 17 genes in melanoma samples (first), TCGA/GTEx (second), and TCGA (third), where genes were aligned by column. As the NCRNA00312 gene could not be retrieved, expression and survival results could not be obtained in GEPIA. Significance was determined as described in the caption of Fig. 6. (ZIP 3130 kb)
Acknowledgments
Not applicable.
Funding
This study was supported by the National Natural Science Foundation of China (No. 81770294). The funder had no role in study design, data collection and analysis, except for bioinformatics training, writing the manuscript, and decision to publish.
Availability of data and materials
The expression data associated with this article has been deposited in the UCSC public hub under the https://xenabrowser.net/datapages/?dataset=lin2008_public%2Flin2008Exp_genomicMatrix&host=https%3A%2F%2Fucscpublic.xenahubs.net.
Phenotypic data is available on UCSC public hub (https://xenabrowser.net/datapages/?dataset=lin2008_public%2Flin2008_public_clinicalMatrix&host=https%3A%2F%2Fucscpublic.xenahubs.net).
Abbreviations
- BRAF
B-Raf proto-oncogene, serine/threonine kinase
- DEGs
Differentially Expressed Genes
- GO
Gene Ontology
- UCSC
University of California Santa Cruz
- WGCNA
Weighted Gene Co-expression Network Analysis
Authors’ contributions
BZ performed comparative analysis using bioinformatics tools. YQY, ZW, YHM, YNH, HYL, YYZ, WQ, WBC, XHZ, and FJL participated in data analysis and discussion, BZ interpreted data and wrote the manuscript. YLZ organized and supervised the project. All authors read and approved the final manuscript.
Ethics approval and consent to participate
Not applicable.
Consent for publication
Not applicable.
Competing interests
The authors declare that they have no competing interests.
Publisher’s Note
Springer Nature remains neutral with regard to jurisdictional claims in published maps and institutional affiliations.
Contributor Information
Bin Zhao, Email: zhaobinxmu@163.com.
Yanqiu You, Email: youyanqiu0453@163.com.
Zheng Wan, Email: 565458630@qq.com.
Yunhan Ma, Email: 358797701@qq.com.
Yani Huo, Email: mayh186@163.com.
Hongyi Liu, Email: 517756647@qq.com.
Yuanyuan Zhou, Email: 1272904340@qq.com.
Wei Quan, Email: 1076576455@qq.com.
Weibin Chen, Email: 542518772@qq.com.
Xiaohong Zhang, Email: 806520946@qq.com.
Yilin Zhao, Email: zyllbz@gmail.com.
References
- 1.Stewart B, Wild C. World cancer report 2014: International Agency for Research on Cancer. 2014. [Google Scholar]
- 2.Version LCPP, Prevention LC. Skin Cancer Prevention (PDQ®) - National Library of Medicine - PubMed Health. National Cancer Institute 2013. https://www.cancer.gov/types/skin/hp/skin-prevention-pdq.
- 3.Azoury SC, Lange JR. Epidemiology, risk factors, Prevention, and early detection of melanoma. Surg Clin North Am. 2014;94(5):945–962. doi: 10.1016/j.suc.2014.07.013. [DOI] [PubMed] [Google Scholar]
- 4.Reports FS. FDA approves vemurafenib and companion diagnostic test for late-stage skin cancer. 2011. [Google Scholar]
- 5.Sponghini AP, Rondonotti D, Giavarra M, Giorgione R, Platini F. Safety and efficacy of vemurafenib in BRAF V600E mutation-positive metastatic melanomas. J Transl Med. 2015;13(1):2075. [Google Scholar]
- 6.Shahabi V, Hamid O, Schmidt H, Chasalow SD, Alaparthy S, Jackson JR. Assessment of association between BRAF-V600E mutation status in melanomas and clinical response to ipilimumab. Cancer Immunol Immunother. 2012;61(5):733–737. doi: 10.1007/s00262-012-1227-3. [DOI] [PMC free article] [PubMed] [Google Scholar]
- 7.Langfelder P, Horvath S. WGCNA: an R package for weighted correlation network analysis. BMC Bioinformatics. 2008;9(1):559. [DOI] [PMC free article] [PubMed]
- 8.Yang Q, Wang R, Wei B, Peng C, Wang L, Hu G, Kong D, Du C. Candidate biomarkers and molecular mechanism investigation for glioblastoma Multiforme utilizing WGCNA. Biomed Res Int. 2018;2018. [DOI] [PMC free article] [PubMed]
- 9.Zhai X, Xue Q, Liu Q, Guo Y, Chen Z. Colon cancer recurrence-associated genes revealed by WGCNA co-expression network analysis. Mol Med Rep. 2017;16(5):6499–6505. doi: 10.3892/mmr.2017.7412. [DOI] [PMC free article] [PubMed] [Google Scholar]
- 10.Rau A, Flister MJ, Rui H, Livermore Auer P. Exploring Drivers of Gene Expression in The Cancer Genome Atlas. 2018:227926. [DOI] [PMC free article] [PubMed]
- 11.Lin WM, Baker AC, Beroukhim R, Winckler W, Feng W, Marmion JM, Laine E, Greulich H, Tseng H, Gates C. Modeling genomic diversity and tumor dependency in malignant melanoma. Cancer Res. 2008;68(3):664. doi: 10.1158/0008-5472.CAN-07-2615. [DOI] [PMC free article] [PubMed] [Google Scholar]
- 12.Zhang B, Horvath S. A General Framework For Weighted Gene Co-Expression Network Analysis. Stat Appl Genet Mol Biol. 2005;4(1):Article17. doi: 10.2202/1544-6115.1128. [DOI] [PubMed] [Google Scholar]
- 13.Chen-An T, Yi-Ju C, Chen JJ. Testing for differentially expressed genes with microarray data. Nucleic Acids Res. 2003;31(9):e52. doi: 10.1093/nar/gng052. [DOI] [PMC free article] [PubMed] [Google Scholar]
- 14.Phipson B, Lee S, Majewski IJ, Alexander WS, Smyth GK. Robust hyperparameter estimation protects against hypervariable genes and improves power to detect differential expression. Ann Appl Stat. 2016;10(2):946. doi: 10.1214/16-AOAS920. [DOI] [PMC free article] [PubMed] [Google Scholar]
- 15.Smyth GK. Limma: linear models for microarray data[M]//Bioinformatics and computational biology solutions using R and Bioconductor. New York: Springer; 2005. p. 397-420.
- 16.Tang Z, Li C, Kang B, Gao G, Li C, Zhang Z. GEPIA: a web server for cancer and normal gene expression profiling and interactive analyses. Nucleic Acids Res. 2017;45 Web Server issue. [DOI] [PMC free article] [PubMed]
- 17.Wang JH, Zhao LF, Lin P, Su XR, Chen SJ, Huang LQ, Wang HF, Zhang H, Hu ZF, Yao KT. GenCLiP 2.0: a web server for functional clustering of genes and construction of molecular networks based on free terms. Bioinformatics. 2014;30(17):2534–2536. doi: 10.1093/bioinformatics/btu241. [DOI] [PubMed] [Google Scholar]
- 18.Owens B. Melanoma. Nature. 2014;515:S109. doi: 10.1038/515S109a. [DOI] [PubMed] [Google Scholar]
- 19.Posch C, Moslehi H, Feeney L, Green GA, Ebaee A, Feichtenschlager V, Chong K, Peng L, Dimon MT, Phillips T. Combined targeting of MEK and PI3K/mTOR effector pathways is necessary to effectively inhibit NRAS mutant melanoma in vitro and in vivo. Proc Natl Acad Sci U S A. 2013;110(10):4015–4020. doi: 10.1073/pnas.1216013110. [DOI] [PMC free article] [PubMed] [Google Scholar]
- 20.Boussemart L, Malka-Mahieu H, Girault I, Allard D, Hemmingsson O, Tomasic G, Thomas M, Basmadjian C, Ribeiro N, Thuaud F, et al. eIF4F is a nexus of resistance to anti-BRAF and anti-MEK cancer therapies. Nature. 2014;513(7516):105–109. doi: 10.1038/nature13572. [DOI] [PubMed] [Google Scholar]
- 21.Lau LF. CCN1/CYR61: the very model of a modern matricellular protein. Cell Mol Life Sci. 2011;68(19):3149–3163. doi: 10.1007/s00018-011-0778-3. [DOI] [PMC free article] [PubMed] [Google Scholar]
- 22.Jun JI, Lau LF. Taking aim at the extracellular matrix: CCN proteins as emerging therapeutic targets. Nat Rev Drug Discov. 2011;10(12):945–963. doi: 10.1038/nrd3599. [DOI] [PMC free article] [PubMed] [Google Scholar]
- 23.Baek M, Bae S, Jeong D. Relationship of pro-angiogenic factor Cyr61to colorectal cancer development and prognosis, vol. 29. 2011. [Google Scholar]
- 24.D'Antonio KB, Lucianna S, Roula A, Mondul AM, Platz EA, Netto GJ, Getzenberg RH. Decreased expression of Cyr61 is associated with prostate cancer recurrence after surgical treatment. Clin Cancer Res. 2010;16(23):5908. doi: 10.1158/1078-0432.CCR-10-1200. [DOI] [PMC free article] [PubMed] [Google Scholar]
- 25.Peng HZ, Yun Z, Wang W, Ma BA. Dual specificity phosphatase 1 has a protective role in osteoarthritis fibroblastlike synoviocytes via inhibition of the MAPK signaling pathway. Mol Med Rep. 2017;16(6):8441–8447. doi: 10.3892/mmr.2017.7617. [DOI] [PubMed] [Google Scholar]
- 26.Teng F, Xu Z, Chen J, Zheng G, Zheng G, Lv H, Wang Y, Wang L, Cheng X. DUSP1 induces apatinib resistance by activating the MAPK pathway in gastric cancer. Oncol Rep. 2018;40(3):1203–1222. doi: 10.3892/or.2018.6520. [DOI] [PMC free article] [PubMed] [Google Scholar]
- 27.Keyse SM, Emslie EA. Oxidative stress and heat shock induce a human gene encoding a protein-tyrosine phosphatase. Nature. 1992;359(6396):644–647. doi: 10.1038/359644a0. [DOI] [PubMed] [Google Scholar]
- 28.Xiaoyi Z, J Madison H, Hong Y, D'Silva NJ, Kirkwood KL: DUSP1 phosphatase regulates the proinflammatory milieu in head and neck squamous cell carcinoma. Cancer Res 2014, 74(24):7191–7197. [DOI] [PMC free article] [PubMed]
- 29.Moncho-Amor V, Cáceres IIED, Bandres E, Martínez-Poveda B, Orgaz JL, Sánchez-Pérez I, Zazo S, Rovira A, Albanell J, Jiménez B. DUSP1/MKP1 promotes angiogenesis, invasion and metastasis in non-small-cell lung cancer. Oncogene. 2011;30(6):668–678. doi: 10.1038/onc.2010.449. [DOI] [PubMed] [Google Scholar]
- 30.Rosenberg HF, Dyer KD. Human ribonuclease 4 (RNase 4): coding sequence, chromosomal localization and identification of two distinct transcripts in human somatic tissues. Nucleic Acids Res. 1995;23(21):4290–4295. doi: 10.1093/nar/23.21.4290. [DOI] [PMC free article] [PubMed] [Google Scholar]
Associated Data
This section collects any data citations, data availability statements, or supplementary materials included in this article.
Supplementary Materials
Figures S1-S3. Rows represent expression of 17 genes in melanoma samples (first), TCGA/GTEx (second), and TCGA (third), where genes were aligned by column. As the NCRNA00312 gene could not be retrieved, expression and survival results could not be obtained in GEPIA. Significance was determined as described in the caption of Fig. 6. (ZIP 3130 kb)
Data Availability Statement
The expression data associated with this article has been deposited in the UCSC public hub under the https://xenabrowser.net/datapages/?dataset=lin2008_public%2Flin2008Exp_genomicMatrix&host=https%3A%2F%2Fucscpublic.xenahubs.net.
Phenotypic data is available on UCSC public hub (https://xenabrowser.net/datapages/?dataset=lin2008_public%2Flin2008_public_clinicalMatrix&host=https%3A%2F%2Fucscpublic.xenahubs.net).


