Abstract
A single phase advance of the light:dark (LD) cycle can temporarily disrupt synchrony of neural circadian rhythms within the suprachiasmatic nucleus (SCN) and between the SCN and peripheral tissues. Compounding this, modern life can involve repeated disruptive light conditions. To model chronic disruption to the circadian system, we exposed male mice to more than a month of a 20 h light cycle (LD10:10), which mice typically cannot entrain to. Control animals were housed under LD12:12. We measured locomotor activity and body temperature rhythms in vivo, and rhythms of PER2::LUC bioluminescence in SCN and peripheral tissues ex vivo. Unexpectedly, we discovered strong effects of the time of dissection on circadian phase of PER2::LUC bioluminescent rhythms, which varied across tissues. White adipose tissue was strongly reset by dissection, while thymus phase appeared independent of dissection timing. Prior light exposure impacted the SCN, resulting in strong resetting of SCN phase by dissection for mice housed under LD10:10, and weak phase shifts by time of dissection in SCN from control LD12:12 mice. These findings suggest that exposure to circadian disruption may desynchronize SCN neurons, increasing network sensitivity to perturbations. We propose that tissues with a weakened circadian network, such as the SCN under disruptive light conditions, or with little to no coupling, e.g., some peripheral tissues, will show increased resetting effects. In particular, exposure to light at inconsistent circadian times on a recurring weekly basis disrupts circadian rhythms and alters sensitivity of the SCN neural pacemaker to dissection time.
Keywords: mice, PER2, bioluminescence, jetlag, adipose, thymus
Graphical Abstract
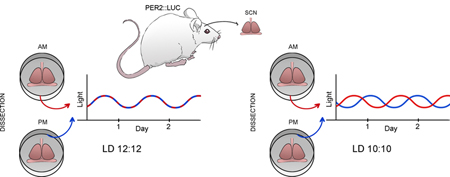
To model chronic disruption to the circadian system, we exposed male mice to more than a month of a 20 h light:dark cycle (LD10:10). Controls were housed under LD12:12. We measured rhythms of PER2::LUC bioluminescence in SCN and peripheral tissues ex vivo. Unexpectedly, we discovered strong effects of the time of dissection on circadian phase. Tissues with a weakened circadian network, such as the SCN under disruptive light conditions, shows increased resetting to dissection.
Introduction
Circadian rhythms are governed by a complex system with multiple interacting components. Central to this system in mammals is the suprachiasmatic nucleus (SCN), a tightly packed and interconnected network of neurons in the hypothalamus of the brain (Evans & Gorman, 2016). The SCN receives direct innervation from retinal ganglion cells to provide essential information about light in the external environment (Morin, 2013). The output from SCN neurons is not yet well understood but includes humoral, neural, and multiply redundant pathways to entrain circadian clocks in tissues peripheral to the SCN (Deurveilher & Semba, 2005; Dibner et al., 2010; Vujovic et al., 2015). The circadian system likely evolved to enable anticipation of predictable daily changes, requiring entrainment to reliable daily signals, with the most predominant being daily changes in light and darkness, and to track changes in day length with seasons. Entrainment is accomplished by resetting the endogenously generated rhythm of SCN neurons following exposure to light, especially when light occurs during the subjective night (Golombek & Rosenstein, 2010). Driven in part by ready availability of inexpensive electric lights, most people are now living with long “summer photoperiod” light exposure year-round. Many people also experience exposure to light during the subjective night, when light has the effect of phase delaying circadian rhythms in early subjective night and phase advancing in late subjective night (Khalsa et al., 2003; Roenneberg et al., 2013). Exposure to artificial light at night is also increasing for animals living near urban environments (Falchi et al., 2016). Thus, instead of a consistent entraining signal of regular light cycles linked to sunrise and sunset, we are now responding to artificial patterns of varied exposure to light throughout the subjective day and night.
To study the impact of circadian rhythm disruption, we housed laboratory mice in rooms with either regular daily light cycles (LD12:12 or T24) or with light cycles that induce recurring disruption of circadian rhythms. Here we used a 20h cycle (T20) of 10 h of light alternating with 10 h of dark (LD10:10) (Karatsoreos et al., 2011; Phillips et al., 2015). Mice are unable to entrain to a 20 h day, and these LD10:10 cycles repeatedly involve light exposure during the subjective night. The subjective time of lights on changes each day, so that the light sometimes phase delays and sometimes phase advances. Here we present results from an experiment that was a part of a larger project to determine impact of age and diet on negative health impact of recurrent circadian disruption. Previous studies have found that ex vivo phase measurements can reflect in vivo phase prior to dissection (Davidson et al., 2009). However, we discovered a surprisingly strong impact of T20 on resetting sensitivity of the SCN, suggesting that circadian disruption in vivo can invalidate ex vivo measures of circadian phase using PER2::LUC bioluminescence, a result with implications for interpretation of multiple prior studies. The specific changes in SCN network dynamics that underlie this sensitivity are as yet unknown, but may involve altered spatiotemporal organization that reduces the rigidity of the SCN oscillatory system, thereby increasing the magnitude of resetting in response to dissection time.
Methods:
Animals:
Male mice were used in all experiments. The mice were either young (between 3–7 mos) or aged (between 19–23 mos) at the start of the experiment and all mice were bred in our facility at Smith College. Mice carried the Per2:Luc transgene (Yoo et al., 2004) on the c57Bl6 background, generally using offspring from in-house homozygous Per2Luc/Luc mice (on c57Bl/6J background) and c57Bl/6JN mice obtained from the breeding colony of the National Institute on Aging, (n=107 Per2Luc/+) with n=16 instead being homozygous Per2Luc/Luc mice on c57Bl6J background. All mice were from our in-house animal facility accredited by AAALAC (Association for Assessment and Accreditation of Laboratory Animal Care) . Research was approved in writing by the Smith College Institutional Animal Care and Use Committee. Approximately 2 weeks before the start of the experiment, mice were implanted with intra-abdominal telemetry probes (Starr Life Sciences, model G2 emitters) to measure body temperature and locomotor activity using VitalView software. Surgery was performed under 3% isoflurane anesthesia, after preoperative injections of 0.05 mg/kg buprenorphine and 5 mg/kg ketoprofen (MWI Veterinary Supply, Elizabethtown, PA). A second injection of buprenorphine was administered within five hours post-surgery, and all animals were singly housed in cages (27 × 46 × 16.5 cm) with Tek Fresh bedding, and a motion sensor (Visonic K940) to detect general locomotor activity, acquired with ClockLab (Actimetrics, Wilmette, IL). Animals recovered with daily weight checks and soft food and apples or spinach available for five days post-surgery.
These mice were part of a larger project to determine effects of age and diet on response to circadian rhythm disruption. Mice were matched by litter and body weight and then randomly assigned to experimental conditions of light cycle and diet. Light cycles were either 12 h light: 12 h dark throughout (T24) or mice were housed under 10 h light: 10 h dark (T20) for 5–7 weeks. The light source was 40-watt full spectrum fluorescent bulbs (Sylvania F40DSGN50) mounted on custom vertical racks to provide more even light distribution to all cages. Light intensity at mid-cage ranged from 139–217 (median 176 lux). Standard diet (Teklad 2014, Envigo, South Easton, MA) contained 14.3% protein and 4.0% fat (soybean oil) and was provided to all mice prior to the start of the experiment. The high fat diet (D12451, Research Diets, Inc, New Brunswick, NJ) contained 20% protein and 45% fat (lard and soybean oil) and was offered to mice assigned to this condition starting 0–5 days (median 2 days) prior to the first day of LD10:10 or at the start of the experiment for mice assigned to LD12:12. Food was available ad libitum.
PER2::
LUC bioluminescence recordings: We prepared explant cultures for bioluminescent recordings in the Lumicycle (Yamazaki & Takahashi, 2005). Animals were overdosed with isoflurane anesthesia and tissues were collected rapidly either under room light or using an infra-red viewer if animals were taken from the dark portion of the housing light cycle. Coronal sections containing the SCN were cut at 300 um on a vibratome (Campden Istruments, Lafayette, IN) in chilled Hank’s balanced salt solution (Invitrogen, Carlsbad, CA). Sections were then trimmed by hand to the hypothalamus and placed on culture inserts (Millipore, Billerica, MA, USA). Peripheral tissues were dissected by hand to approximately 3 × 5 × 2 mm and were cultured on nylon mesh (CMN-0125-B, Small Parts, Miami Lake, FL). All tissues were placed in 35mm petri dishes (USA Scientific, Ocala, FL) containing 1.2 mL of culture media (Dulbecco’s modified Eagle’s medium; Sigma-Aldrich, St. Louis, MO) supplemented with 2% B-27 (Invitrogen), 4 mM Glutamax™ (Invitrogen), 10 mM glucose (Sigma), 4.2 mM NaHCO3 (Sigma), 10 mM HEPES (Sigma), 25 Units/mL penicillin-G sodium (Invitrogen), 34 μM streptomycin sulfate (Invitrogen), and 100 μM beetle luciferin (Promega, Madison, WI). Tissues collected from each animal were two sections of SCN (coronal, referred to as Anterior SCN and Posterior SCN; division between anterior and posterior may vary with animal), mesenteric fat, inguinal fat, abdominal fat, and thymus. Mesenteric fat was identified by its location lining the intestines, abdominal fat was collected from the epididymal fat pad, and inguinal fat was collected from its subcutaneous location in the groin. Only one sample from each peripheral tissue was collected from each mouse. Dissection procedure was timed as follows: Bring one mouse from behavioral recording room to tissue culture room (circa 5 min). Euthanize mouse and prepare explant culture samples (circa 5–10 min). Seal culture dishes (circa 5 min) and place dishes in incubator. After all dishes were collected for a given time point, dishes were placed in their individual spots within the Lumicycle (circa 2 min) and data collection begun. The Lumicycle was kept at 35.8 °C by an air incubator and bioluminescence was recorded for 60s every 10 min.
Our initial experimental design was to collect T24 tissues by dissections conducted ZT2–10, and to collect T20 tissues during the light phase on days when the mouse was maximally misaligned. Our final sample of T20 tissues was at a wide range of CTs relative to body temperature rhythms. When the pattern of results indicated a major effect of time of dissection, we conducted further data collection from mice dissected at phases not well represented in our original data set, most critically, mice under LD12:12 dissected during the dark phase.
Data analysis and accessibility
All experimental data were analyzed using RStudio (R version 3.5.0), except MATLAB (R2017b) was used to calculate period estimates using maximum entropy spectral analysis (MESA) and to prepare figures. Data files and code are posted on Open Science Framework (https://osf.io/seyhp/). If tumors were observed upon dissection, data were collected, and are available in our posted files, but are not included in this analysis. A discrete wavelet transform (DWT) was applied to detrend time series for use in calculating the autocorrelation and to obtain the circadian component for identifying peaks in the time series (used as phase markers). The 8-tap symmlet filter was used for applying the DWT to bioluminescence data (10 minute time steps), and the 12-tap symmlet for activity and body temperature (BT) data (15 minute bins). See (Leise & Harrington, 2011) for a more detailed explanation. Bioluminescence period and phase (peak time) were only reported if the sample met the rhythmicity criteria that the rhythmicity index (RI; first peak of autocorrelation of four days of the detrended time series) is at least 0.2, the cycle length (time between first two peaks in DWT circadian component) is between 20 and 28 hours, and the first peak in the DWT circadian component is at least one count/sec. The CT for each mouse was calculated posthoc based on the body temperature rhythm preceding dissection. We estimated internal circadian time (CT) using the average peak time of the body temperature rhythm for T24 animals, relative to the LD12:12 cycle, to set CT0 for each animal to be 5.7 hours after the last usable (not edge-effected) BT peak of the DWT circadian component (see Figure 1). For both T20 and T24, in vivo and ex vivo rhythms tended to be close to 24h, so counting in hours following this CT0 mark provided a reasonable extrapolation of internal time after dissection.
Figure 1.
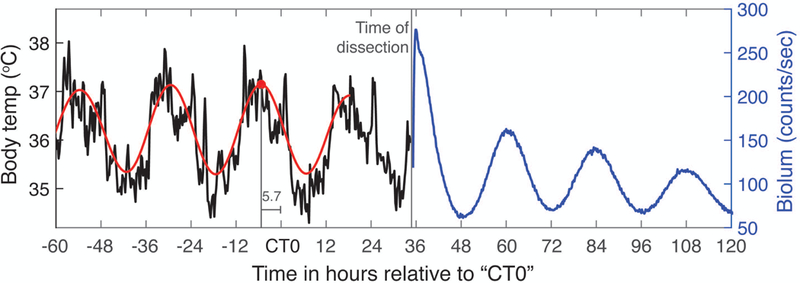
Example of how body temperature recorded in vivo was used to estimate CT time for bioluminescence measured ex vivo, allowing comparison of T20 and T24 phases. See Methods for further explanation.
Results:
Unlike mice under LD12:12 (T24), mice typically did not entrain in response to housing under LD10:10 (T20), though they did continue to exhibit circadian rhythms with a near-24 h period (see Figure 2 for an example). Mice under this T20 light cycle and intensity maintained locomotor activity and body temperature rhythms in the circadian range, with large variation in circadian period between animals (see Table 1). Locomotor activity and body temperature rhythms showed similar periods within animals (see Figure 3). We analyzed results from 92 mice using a 3-way ANOVA with age, T-cycle, and diet as factors and dependent variables taken from the body temperature and activity records. We only report effects of factors where the effect size ω2 is strong, that is, ω2 >0.14 (Lakens, 2013). The mean body temperature was higher under high fat diet than normal chow (F(1,84)=31.5, p<0.001, ω2=0.25), as was amplitude of the body temperature rhythm (F(1,84)=56.8, p<0.001, ω2=0.38). Locomotor activity was most strongly affected by age, with old animals showing lower mean activity levels (F(1,84)=17.8, p<0.001, ω2=0.15) and reduced circadian amplitude of activity, as measured by DWT (F(1,84)=39.2, p<0.001, ω2=0.29). The T20 cycle reduced the rhythmicity index of body temperature rhythms compared to T24 (T-cycle, F(1,80)=86.2, p<0.001, ω2=0.49). Rhythmicity index of locomotor activity rhythms was similarly reduced by T20 vs T24 (F(1,80)=50.9, p<0.001, ω2=0.36), and was also reduced in old animals (F(1,80)=29.3, p<0.001, ω2=0.24). Otherwise no strong effects of factors or interactions occurred.
Figure 2.
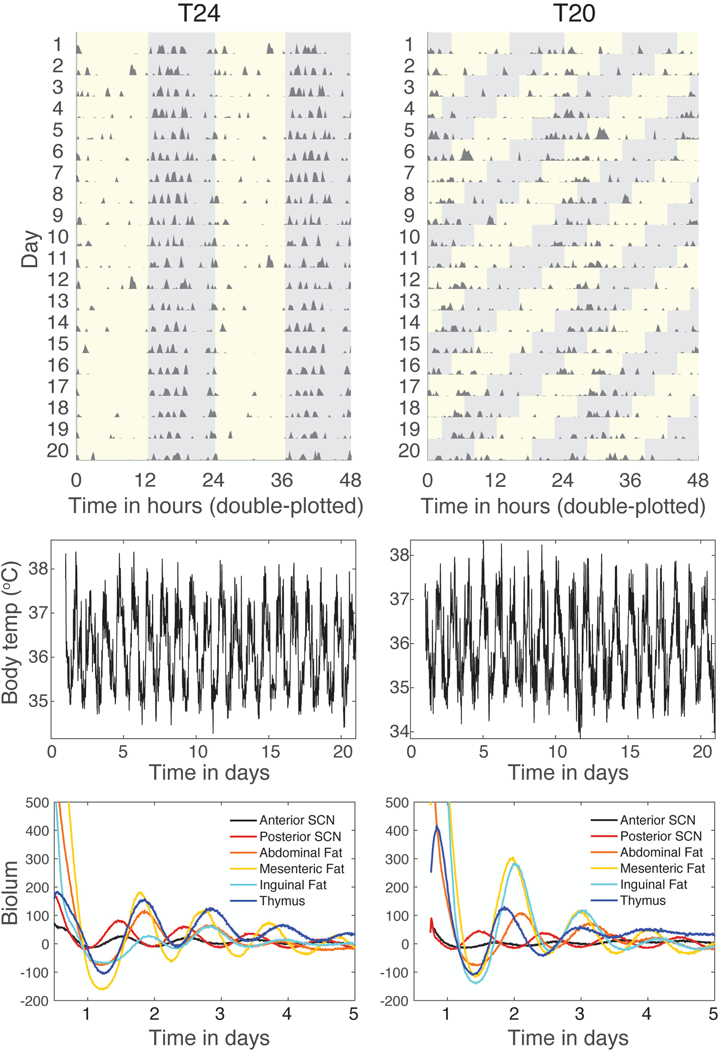
Representative traces of activity, body temperature, and tissue bioluminescence for T24 (left) and T20 (right). Traces are from one animal per lighting condition. Activity records (top graphs) are shown as double-plotted actograms, with each day’s activity plotted below and to the right of the previous day. Activity data are derived from abdominal probes monitored by telemetry. Light:dark cycles are shown on the actogram by grey regions showing times of darkness. Body temperature rhythms (middle graphs) are derived from intra-abdominal probes. Rhythms in PER2::LUC bioluminescence (lower graphs) are from explant cultures of tissues sampled from these mice post-euthanasia, in counts/sec with mean value subtracted from each record.
Table 1:
Circadian periods from maximum entropy spectral analysis (MESA) in hours (mean±SD) and percent rhythmic (percentage of mice passing rhythmicity criteria as described in Methods).
| T24 (n=53) | T20 (n=39) | |
|---|---|---|
| Body Temp | 23.98±0.15 (100%) | 23.87±0.98 (100%) |
| Activity | 23.98±0.28 (100%) | 23.65±1.08 (100%) |
| Anterior SCN | 24.10±1.91 (98%) | 23.92±1.07 (92%) |
| Posterior SCN | 24.17±1.51 (100%) | 24.31±1.17 (100%) |
| Thymus | 25.65±2.15 (91%) | 24.52±2.65 (69%) |
| Mesenteric fat | 25.97±2.19 (75%) | 26.27±2.08 (74%) |
| Inguinal fat | 26.90±1.81 (81%) | 26.62±2.21 (90%) |
| Abdominal fat | 26.92±2.18 (89%) | 27.99±2.19 (90%) |
Figure 3.
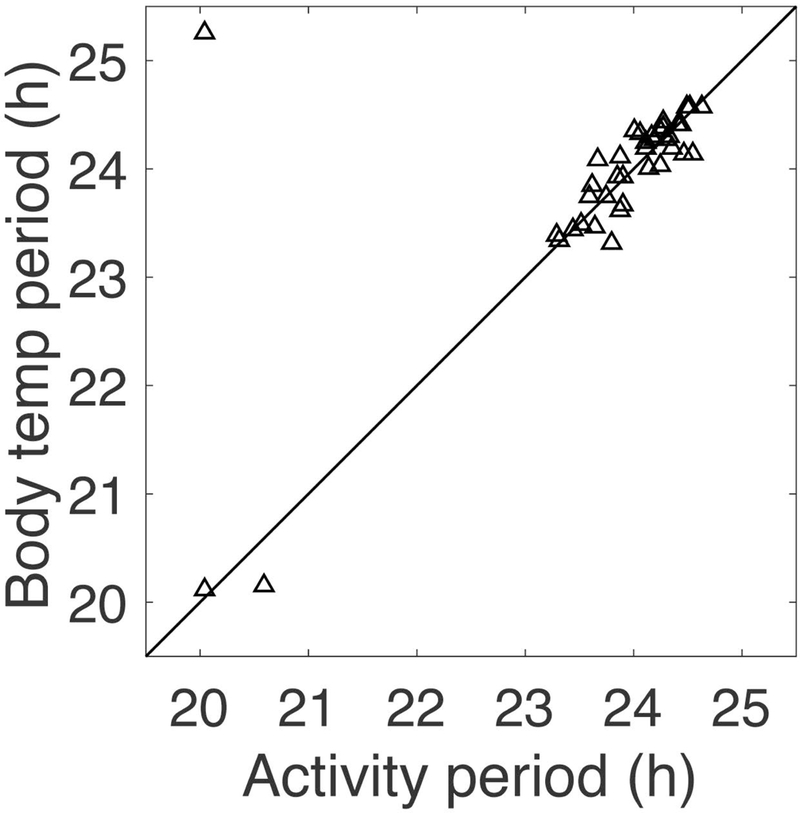
Circadian periods calculated by MESA for last 15 days of recordings for mice in T20 (LD10:10). Each animal contributes one point. Line shows the diagonal. Circadian periods of locomotor activity and body temperature have similar values, with some scatter due to noisiness of the data. Of the 39 total mice housed in T20, three mice had locomotor activity periods near 20 h (one of these had BT period 25.3 h, the outlier in the upper left corner of the graph). These 3 mice had significant 2nd periods of 23.3, 23.4, and 25.9 h; one other mouse had a dominant period of 23.9 h and a 2nd period of 20.0 h; two other mice with activity periods 23.8 and 24.0 h also had significant 2nd periods of 25.7 and 22.1 h, respectively. Only these 6 out of 39 mice displayed two periods.
Our analysis of ex vivo phase measurements led to several unexpected results. First, the phase of tissue in T24 control mice was modulated by the time of dissection, in a tissue-specific manner. SCN samples displayed weak resetting with respect to time of dissection, showing delayed phases when dissected in the early subjective night (see Figure S1). The thymus showed a minimal change in phase with dissection time, although with substantial variability around the mean phase. On the other hand, fat samples display more extreme resetting with respect to time of dissection. See Figures 4 and 5 for tissue peak times plotted with respect to Circadian Time (CT) of dissection for each tissue, and Figure S1 for peak times with respect to Zeitgeber Time (ZT) of dissection and resetting curves fit using circular-circular regression. In this context, CT refers to the phase of the animal’s internal clock, while ZT refers to the external time set by the LD cycle. For entrained animals, CT and ZT are tightly aligned, in contrast to animals who did not entrain for which CT and ZT can be quite different. We show the pattern of PER2::LUC bioluminescence rhythms from the various tissue samples grouped by time of dissection in Figure 6.
Figure 4. Mice from T24 (LD12:12) and T20 (LD10:10) showed phase of bioluminescence rhythms in SCN and thymus tissues measured ex vivo that varied with time of dissection.
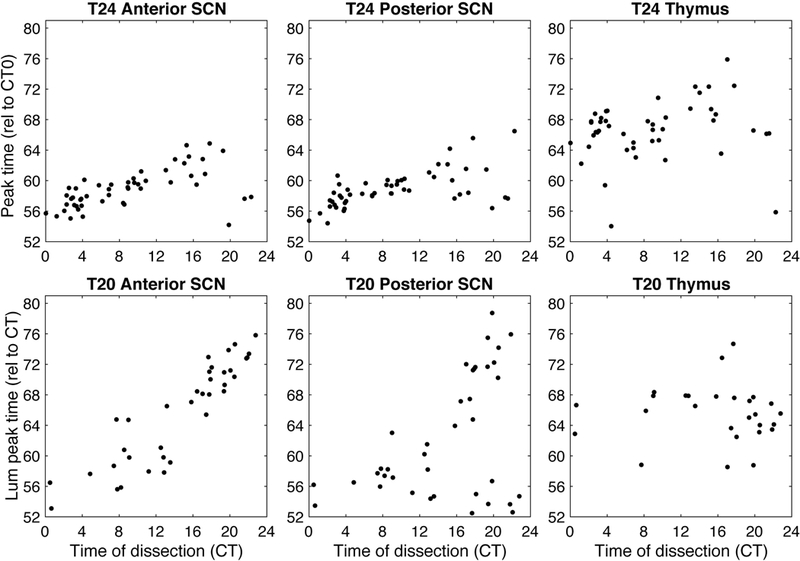
Data for different tissues is shown in separate graphs and each mouse contributes at most one point per graph (excluding samples which failed rhythmicity criterion: 1 anterior SCN, 0 posterior SCN, and 5 thymus for the T24 condition out of 53 mice; 3 anterior SCN, 0 posterior SCN, and 12 thymus for the T20 condition out of 39 mice). Time of dissection and tissue peak time are calculated relative to the body temperature rhythm of each mouse, with CT0 set to 5.7 hours after body temperature peak prior to dissection.
Figure 5.
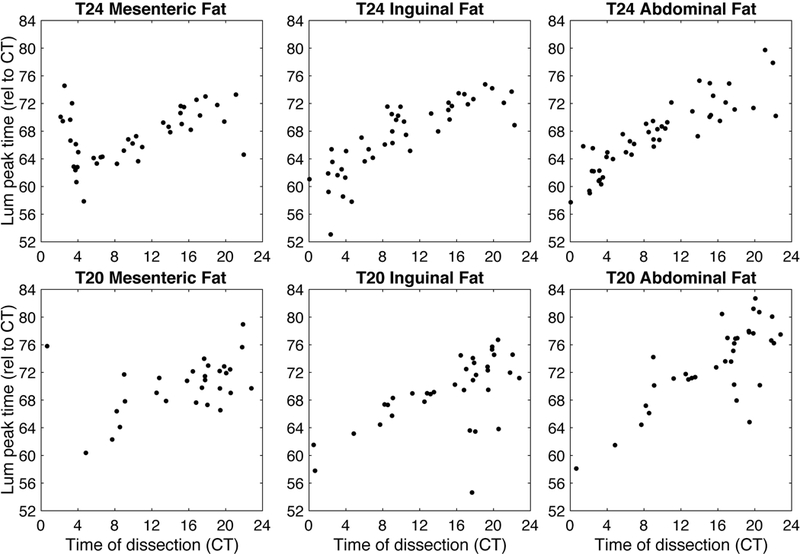
Mice from T24 and T20 LD cycles showed phase of bioluminescence rhythms in fat tissues measured ex vivo that strongly varied with time of dissection. Data for different tissues are shown in separate graphs and each mouse contributes at most one point per graph (we excluded samples which failed rhythmicity criterion: 13 mesenteric fat, 10 inguinal fat, and 6 abdominal fat for the T24 condition out of 53 mice; 10 mesenteric fat, 4 inguinal fat, and 4 abdominal fat for the T20 condition out of 39 mice). Time of dissection and tissue peak time are calculated relative to the body temperature rhythm of each mouse, with CT0 set to 5.7 hours after body temperature peak prior to dissection, as illustrated in Figure 1.
Figure 6.
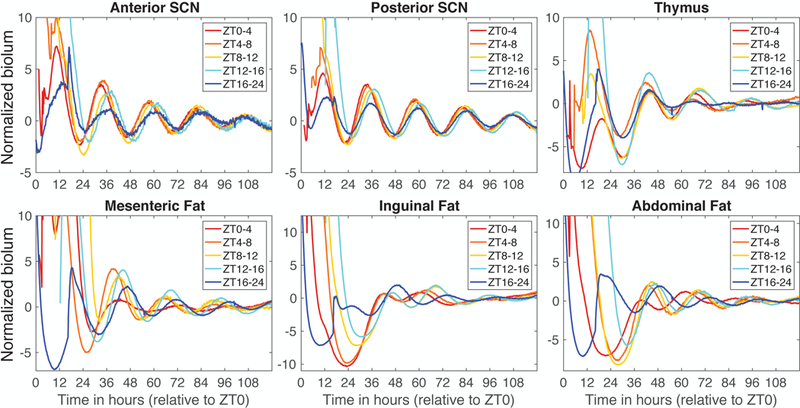
Mean PER2::LUC bioluminescence from T24 samples grouped by time of dissection. Individual traces were normalized by dividing by the standard deviation before averaging within each dissection time group. Time is measured in hours extrapolated from ZT, with time 0 coinciding with what would have been lights on. Sample size for each group: ZT0–4, n=15; ZT4–8, n=10; ZT8–12, n=11; ZT12–16, n=8; ZT16–24, n=9.
We then analyzed the tissues from mice housed under T20. Here, the results were even more surprising. In this group, not only the fat samples were reset (as seen in the T24 mice; see Figure 5), but also the SCN samples were largely reset by dissection (see Figure 4). Because these mice were not entraining to the LD cycle, the effect of time of dissection is not clear when plotted relative to ZT (see Figure S2), but the resetting pattern emerges when plotted relative to circadian time (CT, as calculated from the peak time of the body temperature, as described in the Methods; see Figure 2 for an illustration). Because locomotor activity and BT are not entrained to the T20 LD cycle, we employ CT in this way to better reflect internal or subjective time, which is not aligned with ZT. In fact, these animals are exposed to light at a different internal time (CT) on each successive day.
We looked at the SCN data as a heat map with the raster plot of individual SCN samples ordered by the time of dissection. For the control T24 mice, we first used time of dissection relative to the LD cycle (ZT; see Figure 7), and we plotted the detrended time series with time relative to the last lights on.
Figure 7.
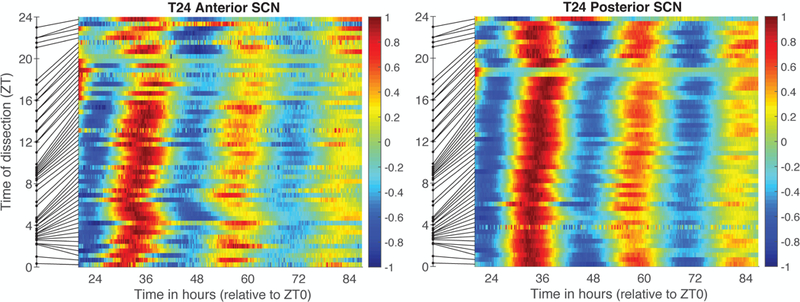
SCN samples from T24 mice ordered by time of dissection (ZT). Color reflects value of each individual PER2::LUC bioluminescence trace after linear detrending and dividing by the maximum value. Samples are ordered by the time of dissection relative to the LD cycle (where ZT0 = time of lights on). Time of dissection is shown as a dot on the y-axis and the line connects that time to the row for that sample, thus illustrating unevenness of sampling with respect to ZT. The x-axis shows time in vitro, where time 0 corresponds to last lights on (ZT0).
To compare SCN results in T20 vs. T24 mice, we adjusted measures of time of dissection and time of SCN rhythm parameters to be relative to core body temperature as shown in Figure 1. T24 mice were well-entrained to the LD cycle, with CT and ZT closely aligned. In contrast, T20 mice did not entrain, so that external and internal time do not align. In fact, for T20 mice, lights on at ZT0 occurs at different CTs each day, advancing by around 4 hours per day. This conversion to CT produced a slight increase in variability in the T24 data (compare Figure 7 with Figure 8). When we compare control T24 SCN tissue to that from mice in T20 (Figure 8), we observe greatly increased resetting following T20, especially when dissections occurred in the subjective night.
Figure 8.
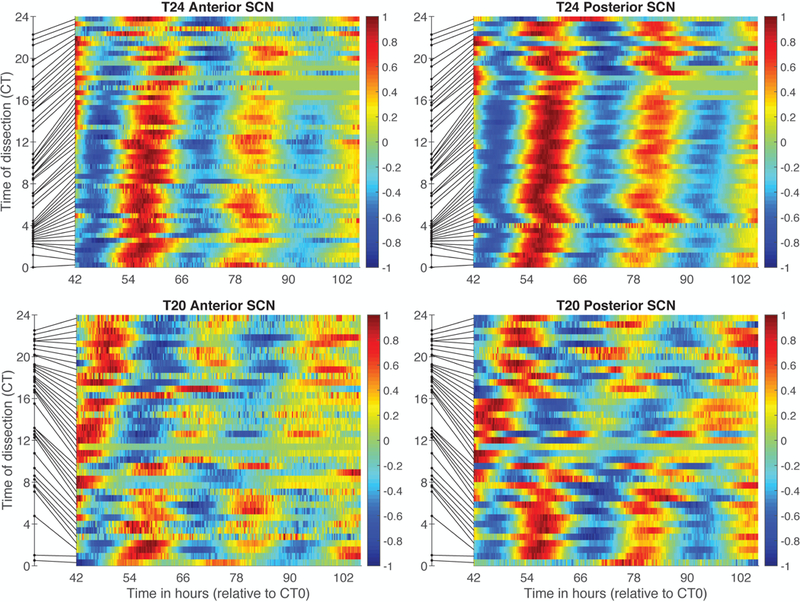
SCN samples from T24 (top) and T20 (bottom) mice ordered by time of dissection (CT). Color reflects value of each individual PER2::LUC bioluminescence trace after linear detrending and dividing by the maximum value. Samples are ordered by the time of dissection relative to the core body temperature (where CT0 occurs 5.7 hours after body temperature peak). Time of dissection is shown as a dot on the y-axis and the line connects that time to the color bar for that sample, thus illustrating unevenness of sampling with respect to CT. The horizontal axis shows time in hours following CT0 as illustrated in Figure 1.
As a measure of internal temporal order, we plotted the phase of the SCN and peripheral tissues from each animal. As seen in Figure 9, SCN samples generally phase-led thymus, but the consistency and magnitude of the phase relationship varied with time of dissection. The phase relationship between SCN and the three fats sampled displayed substantial variability due to resetting by time of dissection.
Figure 9.
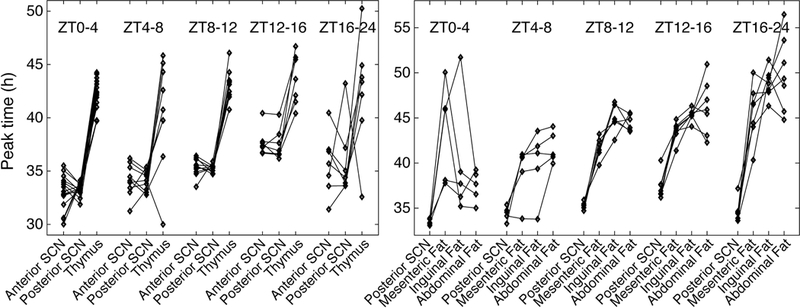
Phase relationships between SCN and peripheral tissues in T24 mice. Diamonds indicate peak times of PER2::LUC bioluminescence, with lines connecting results for tissues from the same animal. Results are grouped according to time of dissection, where ZT0 corresponds to the last time of lights on.
We did not see obvious impacts of the two ages and diets that were altered across the cohorts of mice on circadian rhythms of BT or on resetting by dissection time (see Supplementary Results and Figures S3, S4, and S5). In particular, the SCN had showed at most minor differences in the rhythmicity index of these samples between T24 vs. T20 housing (see Figure S3). We analyzed these results for the 92 mice using a 3-way ANOVA on age, diet, and T-cycle. The amplitude of posterior SCN samples was lower following T20 compared to T24 (F(1,84)=32.7, p<0.001, ω2=0.26). The rhythmicity index of posterior SCN samples was reduced under high fat diet (F(1,84)=19.3, p<0.001, ω2=0.17). Otherwise, we observed no strong effects of factors or interactions.
Discussion
Mice exposed to a disruptive cycle with 10 h of light and 10 h of dark are unable to entrain, and thus are exposed to light at constantly changing points of the circadian cycle. Exposure to LD10:10 (T20) impacts the SCN sufficiently severely that the phase is strongly reset by dissection, even though a relatively regular period of activity and body temperature rhythms near the animal’s intrinsic period is maintained for weeks in vivo. These findings suggest we must re-evaluate prior studies of phase measured ex vivo from SCN of circadian-disrupted mice. Our analysis further demonstrates weak resetting by dissection even in SCN from mice housed in LD12:12. Samples from varied white fat depots (abdominal, inguinal, mesenteric) suggest that these adipose tissues are reset by dissection regardless of prior housing conditions of the mice. Thymus samples were less impacted by time of dissection, although phase measures showed high variability.
Probably the most significant finding from our study is that SCN stability is altered by exposure to T20 so that dissection resets the phase of bioluminescent PER2::LUC measured ex vivo. Interestingly, a prior study (Yoshikawa et al., 2005) demonstrated that exposure of rats to housing under constant light also altered the SCN so that a Per1-luc rhythm was reset by dissection. Housing rats in constant light for many days leads to arrhythmic behavioral patterns, and is thought to alter SCN cell coupling such that individual cells, while rhythmic, are no longer synchronized (Ohta et al., 2005). However, even 5 days of exposure to constant light, during which rats were still showing behavioral activity rhythms, altered the rat SCN such that the Per1-luc rhythms were reset by dissection (Yoshikawa et al., 2005). More recently, it was reported that SCN from mice exposed to a bifurcated light cycle (LDLD) showed SCN was reset by time of dissection while control mice housed in LD was not (Noguchi et al., 2018). Thus, we might conclude that, while SCN taken from animals in stable control LD cycles will show weak resetting due to time of dissection, multiple means of circadian rhythm disruption can alter the SCN such that gene expression rhythms are set to a new phase dictated by the time of dissection.
This conclusion leads us to question several findings important to this field. We previously demonstrated that the SCN and four peripheral tissues showed phase resetting with different rates following a 6 h advance of the LD cycle (Davidson et al., 2009). Although time of dissection was “controlled” in this study (as in many other similar studies) by dissecting all animals between ZT6–12, such an approach does not in fact generate usable data if the treatment condition animals have an SCN made sensitive to the effects of dissection on phase. We illustrate this point by filtering our current data set to just the animals where dissection occurred between ZT6–12. Figure S6 shows the “results” if we had applied this experimental design. From this figure, one might conclude that the SCN phase was more stable in T24 than T20 while phase measures from fats were opposite; however, all tissues are being reset by dissection in the T20 case, and the fat samples are reset by dissection in both conditions, so interpretation of the data in Figure S6 would not give correct conclusions. We do not know if a single LD phase shift affects the SCN such that phase is reset by dissection, but this is important to rule out, given the high impact these studies have had on our understanding of jet lag.
Some peripheral tissues are reset by time of dissection whereas others are not. Our study demonstrates that three white adipose tissues are reset by time of dissection. One prior study (Evans et al., 2015) tested phase of PER2::LUC rhythms in multiple white adipose depots from mice dissected 8 h apart (ZT2 and ZT10) and found the phase from these tissues did not statistically differ. In our early studies using PER2::LUC mice, we tested many tissues and identified several that we thought were resilient to the effects of dissection on phase: thymus, spleen, esophagus, and lung (Davidson et al., 2009). Subsequently, our lab working with older mice and other labs have reported dissection time effects on phase of esophagus (Leise et al., 2013; Evans et al., 2015). Temperature changes can reset phase of lung, pituitary, olfactory bulb, liver, and kidney tissue (Buhr et al., 2010). While our studies have continued to support the conclusion that thymus tissue phase is not reset by time of dissection, the phase is quite variable. Altogether, it seems likely that peripheral clocks are largely susceptible to variables associated with dissection and researchers should be cautious in interpretation of the ex vivo phase measures. Studies of electrophysiological rhythms of spontaneous firing rate of SCN neurons do not report changes in phase of the peak firing when time of dissection is varied (Yannielli & Harrington, 2000; vanderLeest, Vansteensel, et al., 2009). Differences between firing rate rhythms and Per1-luc bioluminescence rhythms have been reported in one study (Vansteensel et al., 2003). Developing methods to measure phase of circadian oscillations from select tissues in vivo (e.g., Saini et al., 2013; Hamada et al., 2016; Mei et al., 2018) is necessary to move this field forward.
Dissection likely involves a host of physiological changes, and here we cannot isolate further which may be resetting phase. Prior studies demonstrate that temperature can reset phase of many tissues (Buhr et al., 2010). Changes in calcium and potassium as cells are lysed are expected to induce multiple physiological effects, as would increases in intracellular neurotransmitters such as glutamate or GABA (gamma-aminobutyric acid). Thus, this is a complex and multi-faceted stimulus for these tissues.
Modeling studies have examined a variety of factors that can alter the magnitude of resetting of an oscillator in response to perturbations. The strength of a resetting signal relative to an oscillator’s amplitude is a key factor, as is the oscillator’s rigidity, that is, how rapidly the oscillation is pulled back toward the limit cycle (Abraham et al., 2010). Coupling within a network of oscillators, such as the cells that compose the SCN (Welsh et al., 2010), can increase the rigidity through synchronization and thereby decrease the magnitude of resetting. For instance, weakening coupling in the SCN by knocking out vasopressin receptors leads to larger phase shifts in response to light (Yamaguchi et al., 2013). Phase of coupling can be as critical as strength of coupling for synchronization of the system; coupling signals sent at the wrong circadian time can desynchronize the network (Ananthasubramaniam et al., 2014) and so lead to larger resetting responses, e.g., speeding up re-entrainment following a phase shift of the LD cycle (An et al., 2013). Network coupling can also increase resistance to perturbations through amplitude expansion (Bordyugov et al., 2011; Webb et al., 2012). The strong resetting of the SCN by dissection following T20 suggests that this disruptive LD condition significantly reduced the network’s amplitude and rigidity, which could be a result of changes in the spatiotemporal organization within the network. Altered phase relationships imply that the phasing of coupling signals within and between regions of the SCN is changed from the stable T24 state, thereby reducing overall synchronization and rigidity of the network and leading to enhanced resetting.
The SCN is a complex and heterogeneous network with multiple coupling signals, rather than a single limit cycle oscillator. Details of the network can play a major role in determining the overall properties, and lead to results that appear contradictory to basic modeling precepts, which viewing the SCN as an appropriate heterogeneous network can rectify. For instance, short photoperiods can lead to higher amplitude and greater synchronization of SCN neurons, yet also yields larger phase shifts in response to light pulses, than under long photoperiods (vanderLeest, Rohling, et al., 2009). These dynamics can be explained through a combination of only a subset of SCN neurons being directly light-responsive and the network having a high coupling strength (Gu et al., 2014). (Theoretical results in modeling of coupled oscillators often assume a relatively weak coupling.) On the other hand, Gu et al. (2014) also found that having all neurons responsive to a perturbation, for any coupling strength, results in the SCN exhibiting the predicted limit cycle behavior discussed in the previous paragraph. Dissection is likely to affect all neurons, in contrast to light that only directly affects a subset in the core, and so reduced synchronization and rigidity of the network can lead to large resetting responses, as predicted by limit cycle theory.
Supplementary Material
Acknowledgements
This research was supported by a grant from NIH NIA 5P01AG009975–20. GM and SS were supported by a Clare Boothe Luce Program grant from the Henry Luce Foundation, JM was supported by an Amherst College Dean of Faculty Summer Undergraduate Research Fellowship, and AG was supported by NSF DBI-1129152 Four-College Biomathematics Consortium. We are grateful to many undergraduate research assistants, and particularly would like to thank Fortunate Chifamba, Reja Javed, Caroline Labriola, Donna Mosley, Marilyn Romero, and Ivana William. We would like to acknowledge Dr. Clif Saper for thoughtful input throughout this study, and Dr. Frank Scheer for helpful comments on a draft of this manuscript. The graphical abstract was prepared by undergraduate Nadia PenkoffLidbeck (on Twitter @npenbeck).
Footnotes
Conflicts of Interest
None to declare.
Data Accessibility
Data files from this work are available on the Open Science Framework (https://osf.io/seyhp/).
References cited
- Abraham U, Granada AE, Westermark PO, Heine M, Kramer A, & Herzel H (2010) Coupling governs entrainment range of circadian clocks. Mol. Syst. Biol, 6, 438. [DOI] [PMC free article] [PubMed] [Google Scholar]
- An S, Harang R, Meeker K, Granados-Fuentes D, Tsai CA, Mazuski C, Kim J, Doyle FJ, Petzold LR, & Herzog ED (2013) A neuropeptide speeds circadian entrainment by reducing intercellular synchrony. Proc. Natl. Acad. Sci. U. S. A, 110, E4355-4361. [DOI] [PMC free article] [PubMed] [Google Scholar]
- Ananthasubramaniam B, Herzog ED, & Herzel H (2014) Timing of neuropeptide coupling determines synchrony and entrainment in the mammalian circadian clock. PLoS Comput. Biol, 10, e1003565. [DOI] [PMC free article] [PubMed] [Google Scholar]
- Bordyugov G, Granada AE, & Herzel H (2011) How coupling determines the entrainment of circadian clocks. Eur. Phys. J. B, 82, 227–234. [Google Scholar]
- Buhr ED, Yoo S-H, & Takahashi JS (2010) Temperature as a universal resetting cue for mammalian circadian oscillators. Science, 330, 379–385. [DOI] [PMC free article] [PubMed] [Google Scholar]
- Davidson AJ, Castanon-Cervantes O, Leise TL, Molyneux PC, & Harrington ME (2009) Visualizing jet lag in the mouse suprachiasmatic nucleus and peripheral circadian timing system. Eur. J. Neurosci, 29, 171–180. [DOI] [PubMed] [Google Scholar]
- Deurveilher S & Semba K (2005) Indirect projections from the suprachiasmatic nucleus to major arousal-promoting cell groups in rat: implications for the circadian control of behavioural state. Neuroscience, 130, 165–183. [DOI] [PubMed] [Google Scholar]
- Dibner C, Schibler U, & Albrecht U (2010) The mammalian circadian timing system: organization and coordination of central and peripheral clocks. Annu. Rev. Physiol, 72, 517–549. [DOI] [PubMed] [Google Scholar]
- Evans JA & Gorman MR (2016) In synch but not in step: Circadian clock circuits regulating plasticity in daily rhythms. Neuroscience, 320, 259–280. [DOI] [PMC free article] [PubMed] [Google Scholar]
- Evans JA, Suen T-C, Callif BL, Mitchell AS, Castanon-Cervantes O, Baker KM, Kloehn I, Baba K, Teubner BJW, Ehlen JC, Paul KN, Bartness TJ, Tosini G, Leise T, & Davidson AJ (2015) Shell neurons of the master circadian clock coordinate the phase of tissue clocks throughout the brain and body. BMC Biol, 13, 43. [DOI] [PMC free article] [PubMed] [Google Scholar]
- Falchi F, Cinzano P, Duriscoe D, Kyba CCM, Elvidge CD, Baugh K, Portnov BA, Rybnikova NA, & Furgoni R (2016) The new world atlas of artificial night sky brightness. Sci. Adv, 2, e1600377. [DOI] [PMC free article] [PubMed] [Google Scholar]
- Golombek DA & Rosenstein RE (2010) Physiology of Circadian Entrainment. Physiol. Rev, 90, 1063–1102. [DOI] [PubMed] [Google Scholar]
- Gu C, Ramkisoensing A, Liu Z, Meijer JH, & Rohling JHT (2014) The proportion of light-responsive neurons determines the limit cycle properties of the suprachiasmatic nucleus. J. Biol. Rhythms, 29, 16–27. [DOI] [PubMed] [Google Scholar]
- Hamada T, Sutherland K, Ishikawa M, Miyamoto N, Honma S, Shirato H, & Honma K (2016) In vivo imaging of clock gene expression in multiple tissues of freely moving mice. Nat. Commun, 7, 11705. [DOI] [PMC free article] [PubMed] [Google Scholar]
- Karatsoreos IN, Bhagat S, Bloss EB, Morrison JH, & McEwen BS (2011) Disruption of circadian clocks has ramifications for metabolism, brain, and behavior. Proc. Natl. Acad. Sci. U. S. A, 108, 1657–1662. [DOI] [PMC free article] [PubMed] [Google Scholar]
- Khalsa SBS, Jewett ME, Cajochen C, & Czeisler CA (2003) A phase response curve to single bright light pulses in human subjects. J. Physiol, 549, 945–952. [DOI] [PMC free article] [PubMed] [Google Scholar]
- Lakens D (2013) Calculating and reporting effect sizes to facilitate cumulative science: a practical primer for t-tests and ANOVAs. Front. Psychol, 4, 863. [DOI] [PMC free article] [PubMed] [Google Scholar]
- Leise TL & Harrington ME (2011) Wavelet-based time series analysis of circadian rhythms. J. Biol. Rhythms, 26, 454–463. [DOI] [PubMed] [Google Scholar]
- Leise TL, Harrington ME, Molyneux PC, Song I, Queenan H, Zimmerman E, Lall GS, & Biello SM (2013) Voluntary exercise can strengthen the circadian system in aged mice. Age Dordr. Neth, 35, 2137–2152. [DOI] [PMC free article] [PubMed] [Google Scholar]
- Mei L, Fan Y, Lv X, Welsh DK, Zhan C, & Zhang EE (2018) Long-term in vivo recording of circadian rhythms in brains of freely moving mice. Proc. Natl. Acad. Sci. U. S. A, 115, 4276–4281. [DOI] [PMC free article] [PubMed] [Google Scholar]
- Morin LP (2013) Neuroanatomy of the extended circadian rhythm system. Exp. Neurol, 243, 4–20. [DOI] [PMC free article] [PubMed] [Google Scholar]
- Noguchi T, Harrison EM, Sun J, May D, Ng A, Welsh DK, & Gorman MR (2018) Circadian rhythm bifurcation induces flexible phase resetting by reducing circadian amplitude. Eur. J. Neurosci,. [DOI] [PubMed] [Google Scholar]
- Ohta H, Yamazaki S, & McMahon DG (2005) Constant light desynchronizes mammalian clock neurons. Nat. Neurosci, 8, 267–269. [DOI] [PubMed] [Google Scholar]
- Phillips DJ, Savenkova MI, & Karatsoreos IN (2015) Environmental disruption of the circadian clock leads to altered sleep and immune responses in mouse. Brain. Behav. Immun, 47, 14–23. [DOI] [PubMed] [Google Scholar]
- Roenneberg T, Kantermann T, Juda M, Vetter C, & Allebrandt KV (2013) Light and the human circadian clock. Handb. Exp. Pharmacol, 311–331. [DOI] [PubMed] [Google Scholar]
- Saini C, Liani A, Curie T, Gos P, Kreppel F, Emmenegger Y, Bonacina L, Wolf J-P, Poget Y-A, Franken P, & Schibler U (2013) Real-time recording of circadian liver gene expression in freely moving mice reveals the phase-setting behavior of hepatocyte clocks. Genes Dev, 27, 1526–1536. [DOI] [PMC free article] [PubMed] [Google Scholar]
- vanderLeest HT, Rohling JHT, Michel S, & Meijer JH (2009) Phase shifting capacity of the circadian pacemaker determined by the SCN neuronal network organization. PloS One, 4, e4976. [DOI] [PMC free article] [PubMed] [Google Scholar]
- vanderLeest HT, Vansteensel MJ, Duindam H, Michel S, & Meijer JH (2009) Phase of the electrical activity rhythm in the SCN in vitro not influenced by preparation time. Chronobiol. Int, 26, 1075–1089. [DOI] [PubMed] [Google Scholar]
- Vansteensel MJ, Yamazaki S, Albus H, Deboer T, Block GD, & Meijer JH (2003) Dissociation between Circadian Per1 and Neuronal and Behavioral Rhythms Following a Shifted Environmental Cycle. Curr. Biol, 13, 1538–1542. [DOI] [PubMed] [Google Scholar]
- Vujovic N, Gooley JJ, Jhou TC, & Saper CB (2015) Projections from the subparaventricular zone define four channels of output from the circadian timing system. J. Comp. Neurol, 523, 2714–2737. [DOI] [PMC free article] [PubMed] [Google Scholar]
- Webb AB, Taylor SR, Thoroughman KA, Doyle FJ, & Herzog ED (2012) Weakly circadian cells improve resynchrony. PLoS Comput. Biol, 8, e1002787. [DOI] [PMC free article] [PubMed] [Google Scholar]
- Welsh DK, Takahashi JS, & Kay SA (2010) Suprachiasmatic nucleus: cell autonomy and network properties. Annu. Rev. Physiol, 72, 551–577. [DOI] [PMC free article] [PubMed] [Google Scholar]
- Yamaguchi Y, Suzuki T, Mizoro Y, Kori H, Okada K, Chen Y, Fustin J-M, Yamazaki F, Mizuguchi N, Zhang J, Dong X, Tsujimoto G, Okuno Y, Doi M, & Okamura H (2013) Mice genetically deficient in vasopressin V1a and V1b receptors are resistant to jet lag. Science, 342, 85–90. [DOI] [PubMed] [Google Scholar]
- Yamazaki S & Takahashi JS (2005) Real-time luminescence reporting of circadian gene expression in mammals. Methods Enzymol, 393, 288–301. [DOI] [PMC free article] [PubMed] [Google Scholar]
- Yannielli PC & Harrington ME (2000) Neuropeptide Y applied in vitro can block the phase shifts induced by light in vivo. Neuroreport, 11, 1587–1591. [PubMed] [Google Scholar]
- Yoo S-H, Yamazaki S, Lowrey PL, Shimomura K, Ko CH, Buhr ED, Siepka SM, Hong H-K, Oh WJ, Yoo OJ, Menaker M, & Takahashi JS (2004) PERIOD2::LUCIFERASE real-time reporting of circadian dynamics reveals persistent circadian oscillations in mouse peripheral tissues. Proc. Natl. Acad. Sci. U. S. A, 101, 5339–5346. [DOI] [PMC free article] [PubMed] [Google Scholar]
- Yoshikawa T, Yamazaki S, & Menaker M (2005) Effects of preparation time on phase of cultured tissues reveal complexity of circadian organization. J. Biol. Rhythms, 20, 500–512. [DOI] [PMC free article] [PubMed] [Google Scholar]
Associated Data
This section collects any data citations, data availability statements, or supplementary materials included in this article.


