Abstract
Solution conditions chosen for the production of amyloid can also promote formation of significant extents of amorphous protein aggregate. In one interpretation, the amyloid and amorphous aggregation pathways are considered to be in competition with each other. An alternative conceptualization involves considering amorphous aggregation as an obligatory intermediate process of the amyloid formation pathway. Here, we review recently developed macroscopic-level theories of protein aggregation that unify these two competing models into a single paradigm. Key features of the unified model included (1) a description of the amorphous aggregate as a second liquid phase with the degree of liquid-like character determined by the mobility of the monomer within it, and (2) heterogeneous growth pathways based on nucleation, growth, and fragmentation of amyloid occurring within different phases and at their interfacial boundary. Limiting-case behaviors of the protein aggregation reaction, either singly involving amyloid or amorphous aggregate production, and mixed-case behaviors, involving competitive and/or facilitated growth of amorphous and amyloid species, are presented and reviewed in context. This review principally describes an approach developed by Hirota and Hall 2019 (Hirota, N. and Hall, D. 2019. Protein Aggregation Kinetics: A Unified Theoretical Description. Chapter 7 of ‘Protein Solubility and Amorphous Aggregation: From Academic Research to Applications in Drug Discovery and Bioindustry’ edited by Y. Kuroda and F. Arisaka. CMC Publishers). Sections of that work are translated from the original Japanese and republished here with the full permission of CMC Publishing Corporation.
Keywords: Kinetics, Protein aggregation, Amyloid, United model
Early studies of protein folding wrestled with the question of whether non-native intermediate structures (I) represented off-pathway or on-pathway intermediates (Kim and Baldwin 1982, Kuwajima et al. 1987). In simple cases, this question could be summarized by amending the two-state folding equilibrium between folded (F) and unfolded (U) states, e.g., (F ⇄ U) to one of the two forms described by Eq. 1 (Baldwin 1996; Dill and Chan 1997).
| 1a |
| 1b |
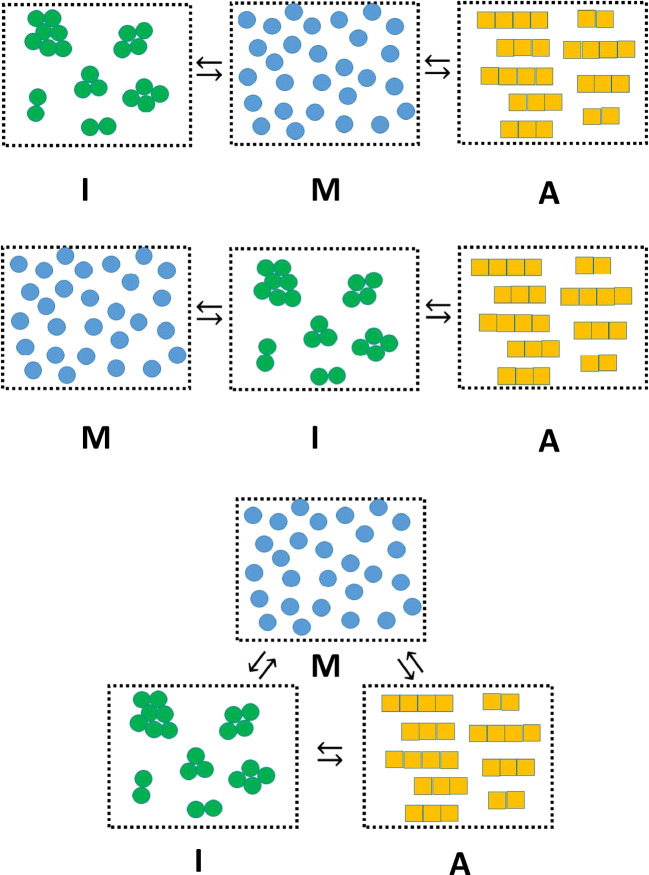
Amyloid is a type of linear protein aggregate that resembles a one-dimensional crystal and holds importance to areas of basic biology, disease and nanotechnology (Eisenberg and Sawaya 2017; Mezzenga and Fischer 2013]. An amyloid fiber can be classified as a homo-polymer due to the fact that it is constructed from repeated addition of a single type of protein monomeric unit to a growing polymer chain (Hall and Edskes 2012). In in vitro studies, solution conditions which promote amyloid formation (such as high temperature, high concentration of denaturant and altered pH (Dorta-Estremera et al. 2013; Goldschmidt et al. 2010)) also tend to promote other less-specific types of monomer-monomer interaction (Zhu et al. 2002; Qin et al. 2007; Vetri et al. 2007; Hall et al. 2015). Such non-specific protein interactions can result in the formation of amorphous irregular1 structures which may precede or coincide with the appearance of amyloid (Nguyen and Hall 2004; Cheon et al. 2007; Auer et al. 2008; Auer et al. 2012; Hall et al. 2015). As such, investigations into the mechanism of the amyloid homo-polymerization reaction face a conceptual dilemma similar to that described above for placement of intermediate structures within the protein folding mechanism (Baldwin 1996).When considering the logical sequence of formation between the monomeric protein (M), the amyloid aggregate (A), and the irregular amorphous aggregate (I), two general schools of thought are debated (Fink 1998; Hall et al. 2015 vs. Nguyen and Hall 2004; Wu and Shea 2011; Auer et al. 2012) (Fig. 1). The first is that irregular amorphous aggregate and amyloid are in direct competition for the monomer (Eq. 2a) (Fink 1998; Hall et al. 2015) while the second is that the irregular amorphous aggregate acts as an obligate intermediate in the production of amyloid (Eq. 2b) (Nguyen and Hall 2004; Wu and Shea 2011; Auer et al. 2012). Here, we review the argument advanced by Hirota et al. (Hirota and Hall 2019) for the likelihood of a third case, in which both the competitive and obligate intermediate conceptualizations represent subsets of a more general mechanism (Eq. 2c and Fig. 1).
| 2a |
| 2b |
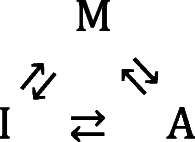 |
2c |
Fig. 1.
Three schematics describing different ways of considering the relationship between monomer, denoted by the letter M (blue dispersed circles), irregular/amorphous aggregate, denoted by the letter I (green aggregates) and amyloid, denoted by the letter A (yellow fibers). (TOP) Amyloid in direct competition with amorphous aggregate for monomer. (MIDDLE) Amorphous aggregate as an obligate intermediate in the formation of amyloid. (BOTTOM) Amorphous aggregate as a potential, but not obligatory intermediate, in the formation of amyloid. (Translated and reprinted with full permission from Hirota and Hall (2019), CMC Publishing Corporation)
In the following sections, we present an abridged version of the chemical mechanisms and mathematical models developed by Hirota et al. for these different types of aggregation processes which are able to simulate kinetic time courses for the commonly encountered laboratory situation in which the total concentration of monomer, (C1)TOT, is a conserved quantity (Hirota and Hall 2019). Key features of the modeling approach developed by Hirota et al. include an explicit inclusion of homogeneous and heterogeneous nucleation pathways and a two-phase conceptualization of liquid solution space. This latter two-phase aspect proved key to making this extremely difficult problem tractable. Although we will discuss it in detail within the main text we provide a prefatory comment so that its key role can be better appreciated. Two liquid phases are specified, with the first being the total solution (which we describe as the bulk liquid phase comprising solvent and all aggregate components within it) and the second being the internal amorphous aggregate, which is considered as a separate liquid phase of arbitrary internal fluidity, such that it may transition from essentially a frozen ‘solid’ to a liquid state. Based on the two-phase approach, Hirota et al. developed a series of kinetic equations corresponding to the variety of models presented in Eq. 2, casting their models in terms of averages, sacrificing a degree of exactness for tractability and insight into the problem (Hirota and Hall 2019).
Simple kinetic model of amyloid formation via homogeneous nucleation in bulk phase
Approaches to the mechanism-based simulation of amyloid kinetics have generally followed the helical polymerization models developed by Oosawa and coworkers to describe actin polymerization (Oosawa and Kasai 1962; Oosawa and Asakura 1975). A major step forward in the realistic description of amyloid kinetics came with the incorporation of fiber breakage into the characteristic equations by Masel, Jansen, and Nowak (Masel et al. 1999). A notable early extension to this work was the development of an approximate method for simulating the time-dependent evolution of the amyloid polymer distribution (Hall and Edskes 2004). In terms of general utility, a simpler form of these equations (dealing in average properties of the distribution rather than the whole distribution) was presented in an appendix of another paper by Hall and Edskes (2012). This model was later extended to include fiber joining and fiber bundling (Zhao et al. 2016). The minimal mechanism, written as a set of elementary steps, is shown as Fig. 2. Hirota et al. utilized the corresponding mathematical model (Eq. 3; with amyloid nucleus size, n, set to n = 2 and the dissociation rate of nucleus to monomer governed by the site scission rate constant kS°) on the grounds that it was both (i) suitably representative of the formation of amyloid via homogeneous nucleation in bulk phase solution, and (ii) simple enough to be incorporated into larger simulations inclusive of other modes of aggregation (Hirota and Hall 2019). Importantly, the model describes the rate of change in the number concentration of amyloid fibers in the bulk phase, , (Eq. 3a), the rate of change in the mass concentration of amyloid fibers in the bulk phase, , (Eq. 3b) and the average degree of polymerization of amyloid fibers in the bulk phase, , (Eq. 3c). Under the condition of monomer conservation, the free concentration of monomer, (C1)B, at any time can be solved via difference between total and mass concentrations.
| 3a |
| 3b |
| 3c |
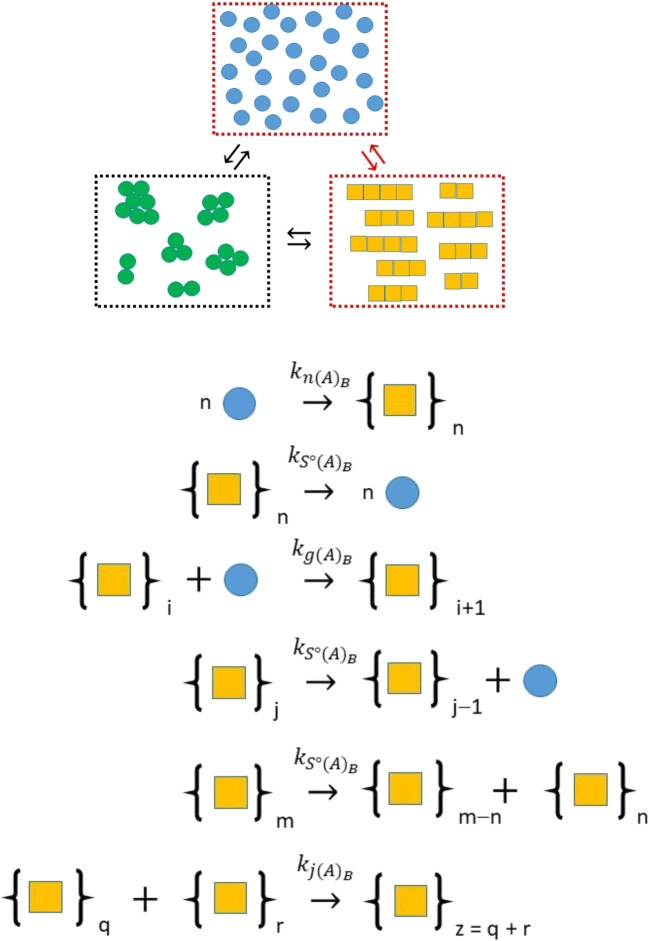
Fig. 2.
Minimal mechanism for nucleated growth of amyloid in bulk phase corresponding to Eq. 3. Nucleation is considered to occur via a bimolecular addition reaction (nucleus size n = 2) governed by a second-order-nucleation rate constant, . Fiber growth is able to occur by monomer addition and fiber end-to-end joining, respectively regulated by second-order rate constants, , and . Fiber shrinkage is able to occur by breakage (scission) of monomer from the fiber end or via fracture at some internal position within the fiber. The rate of fracture at a particular site is considered to be governed by a first-order scission rate constant, , with this site-value considered to be independent of position (as a first approximation). (Translated and reprinted with full permission from Hirota and Hall (2019), CMC Publishing Corporation)
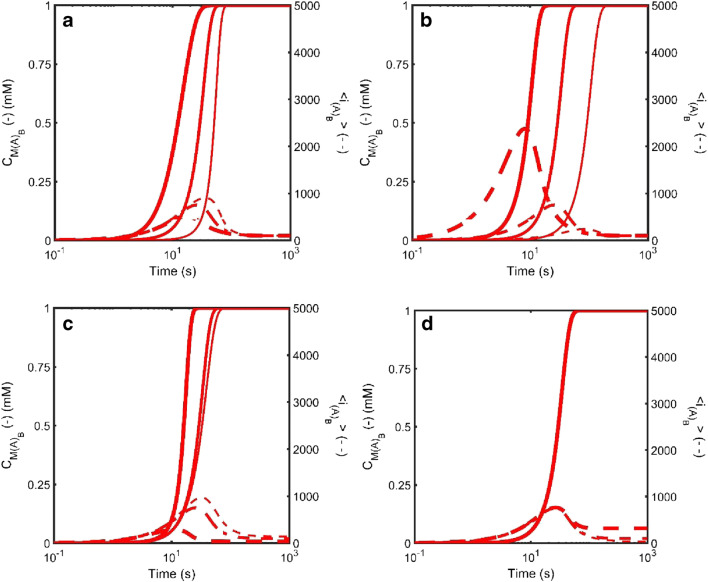
As implemented, equation set 3 describes the case of (i) unidirectional growth occurring via either monomer addition to a single fiber end or fiber end-to-end joining in a preferred orientation (Binger et al. 2008; Zhao et al. 2016), and (ii) fiber shrinkage occurring via either internal fracture (to produce two fibers) or loss of monomer at either end of the fiber (Hall and Edskes 2004, 2012). Equation set 3 is powerful in the sense that a myriad of behaviors can be described based on just four parameters—the nucleation rate constant for amyloid in the bulk phase, , the scission rate constant of an amyloid fiber intermolecular bond, , the growth rate constant for monomer addition to a fiber, , and the fiber joining rate constant, . Figure 3 describes the effects of variation in these four parameters on the amount, , and average size, , of amyloid formed in the bulk phase via homogeneous nucleation.
Fig. 3.
Simulated kinetics of amyloid formation via homogeneous nucleation in the bulk liquid phase defined according to Eqn. Set 3 and described in terms of the total mass concentration of amyloid, (solid line – left axis) and the average degree of polymerization of amyloid in the bulk phase, (dotted line – right axis). a Effect of variation in the bulk phase nucleation rate constant (units M−1s−1): Thin line - , Medium line - ; Thick line - . b Effect of variation in the bulk phase growth rate constant (units M−1s−1): Thin line - , Medium line - ; Thick line - . c Effect of variation in the bulk phase scission rate constant (units s−1): Thin line - , Medium line - ; Thick line - . d Effect of variation in the bulk phase amyloid end-to-end joining rate constant (units M−1s−1): Thin line - , Medium line - ; Thick line - . When not specifically varied all other rate constants set as follows [; ;; ]. The nucleus size is set at n = 2. (Translated and reprinted with full permission from Hirota and Hall (2019), CMC Publishing Corporation)
Simple kinetic model of amorphous aggregation in bulk phase via homogeneous nucleation
Amorphous aggregates are so defined due to the fact that the internal structure of the aggregate lacks any regular positional ordering (Bennett 1972). Over 100 years ago Marian von Smoluchowski developed an analytical solution to the kinetics of irreversible amorphous aggregation starting from an initial condition in which only monomer is present (von Smoluchowski 1917; Friedlander and Smoke 2000). For completeness, this analytical solution is shown as Eq. 4. Equation 4a describes the total particle number concentration, , as a function of time, t, in terms of a single bimolecular rate constant, kI, and the total concentration of monomer within the system, (C1)TOT. Equation 4b describes the average degree of polymerization2 of all particles in solution <iP> (including monomer) (Friedlander and Smoke 2000; Tsai et al. 2008).
| 4a |
| 4b |
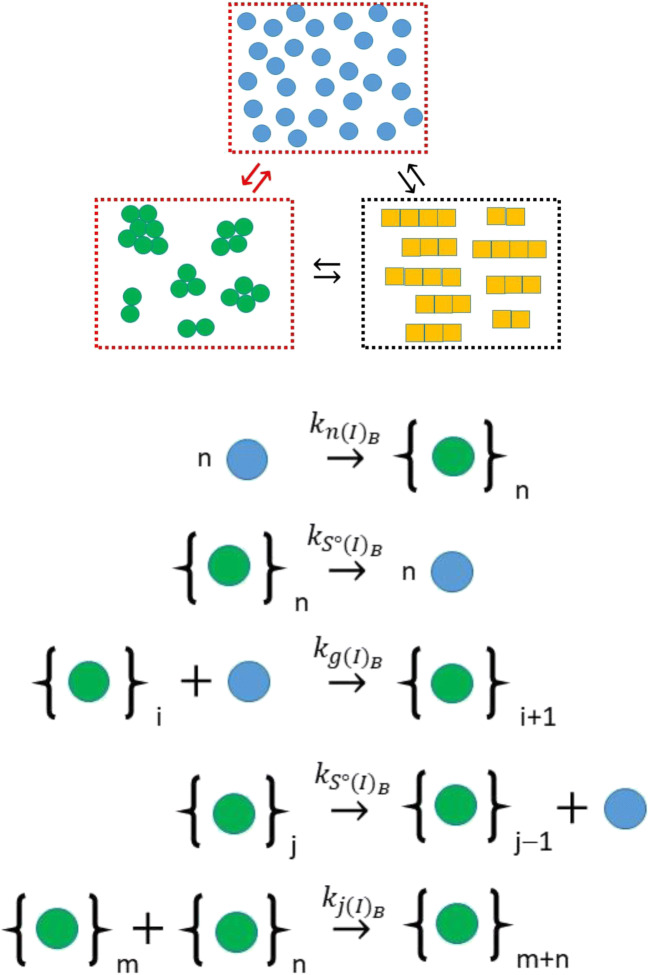
For the reversible case, obviously, a different model is required, and as opposed to the descriptions presented for the kinetics of one-dimensional fiber growth shown in the previous section, a simple description does not exist. A full kinetic description of the system in which all possible bimolecular events were explicitly described has been previously developed (Hall et al. 2015). In keeping with their development in terms of averaged quantities, Hirota et al. presented a simplified model of reversible amorphous aggregation, founded upon the mechanism described in Fig. 4, based on aggregate growth (assumed spherical) occurring by either monomer addition or aggregate-aggregate joining, and aggregate shrinkage occurring solely by monomer loss (Eq. 5a-c) (Hirota and Hall 2019). To aid in subsequent development, a corresponding geometric interpretation of the average volume, and average surface area, , of the amorphous aggregate species3 was included with this shown as Eq. 5d and e.
| 5a |
| 5b |
| 5c |
| 5d |
| 5e |
Fig. 4.
Minimal mechanism for aggregation of monomer to form amorphous irregular structures in the bulk phase corresponding to Eq. 5. Depending on the values selected for the second-order rate constants governing the initial, , and later, , monomer incorporation steps the system may/may not exhibit nucleated growth type behavior. Amorphous aggregate growth may also occur by aggregate accretion/joining governed by a second-order rate constant, . Amorphous aggregate shrinkage is considered to occur solely via monomer loss governed by a first-order rate constant . Statistical factors relating to greater chances for monomer loss as the amorphous aggregate surface area increases are specified in Eq. 5. (Translated and reprinted with full permission from Hirota and Hall (2019), CMC Publishing Corporation)
For continuity, the same nomenclature used to describe amyloid kinetics in set Eq. 3 was used for the description of amorphous kinetics in Eqn. set 5 (Hirota and Hall 2019). Of the dependent variables, describes the number concentration of amorphous aggregates in the bulk phase, describes the mass concentration of amorphous aggregates and describes the average degree of polymerization of the amorphous aggregates in the bulk solution phase. With regard to the parameters in Eq. 5, , refers to the amorphous nucleation rate constant (with nucleus size again set to n = 2), , is the bimolecular growth rate constant governing the addition of monomer to aggregate, , is the first-order rate constant describing the loss of monomer from the aggregate and is the bimolecular rate constant regulating the joining of amorphous aggregates. There are two features of particular note in Eq. 5 that mark it as a useful means for describing amorphous aggregation. The first feature of note is the exponential term regulating the change in the number concentration of amorphous aggregate, i.e., that allows an equivalent simplification for the amorphous case kinetics as the term does for the amyloid kinetics in Eqn. Set 3. For that (amyloid) case the term allows for transition4 from loss to gain in as increases from its minimum value of 2. For the amorphous case kinetics, in which aggregate shrinkage is assumed to occur only by monomer loss, a suitably chosen value5 of q ensures that the exponential term transitions from − 1 to 0 as increases from its minimum value of 2 to larger values. The second feature of note in Eq. 5 is the surface area term regulating change in . The component of this term accounts for the increase in the number of monomers able to escape the aggregate surface (presumed to be a spherical amorphous structure) while the (+1) component accounts for the fact that two monomers are lost from the aggregate per breakage event when = 2, but only one monomer is lost per breakage event as transitions to greater sizes (even though more total breakage events are likely to occur due to the larger surface area).
As for the amyloid case, there are the four principal rate parameters in Eqn. set 5 that regulate amorphous aggregation kinetics namely,, , and , with an additional two specified constants q and α that are related to the structure of the amorphous aggregate. In particular α describes the volume packing fraction of monomer in the amorphous aggregate and q describes the tendency of early simple breakage events to lead to complete dissolution of the aggregate. Figure 5 describes the effect of variation in the four principal rate parameters on the amount, , and average size, , of amorphous aggregate formed in the bulk phase via homogeneous nucleation.
Fig. 5.
Simulated kinetics of amorphous aggregate formation in the bulk liquid phase defined according to Eqn. Set 5 described in terms of the total mass concentration of amorphous aggregate, (solid line – left axis) and the average degree of polymerization of amorphous aggregate in the bulk phase, (dotted line – right axis). a Effect of variation in the bulk phase nucleation rate constant (units M−1s−1): Thin line - , Medium line - ; Thick line - . b Effect of variation in the bulk phase growth rate constant (units M−1s−1): Thin line - , Medium line - ; Thick line - . c Effect of variation in the bulk phase scission rate constant (units s−1): Thin line - , Medium line - ; Thick line - . d Effect of variation in the bulk phase amorphous aggregate joining rate constant (units M−1s−1): Thin line - , Medium line - ; Thick line - . When not specifically varied all other rate constants set as follows [; ;; ]. The nucleus size is set at n = 2. (Translated and reprinted with full permission from Hirota and Hall (2019), CMC Publishing Corporation)
Amorphous aggregation in competition with amyloid formation
As described by equation sets 3 and 5, the amyloid and amorphous aggregation processes have no way of influencing each other save for their ability to compete for monomer from the bulk phase pool. Such a situation, comporting to the direct competition schema outlined in Eq. 2a, was recently explored (Hall et al. 2015) who also examined the situation where the experimental signal was differentially sensitive to the two different aggregate forms. Figure 6 recreates the basic findings described by Hall et al. using the simplified models described in Eq. 3 and 5 of this work. Operating under the reasonable assumption that the amyloid form is more thermodynamically stable than the amorphous aggregate (Eisenberg and Sawaya 2017) Hirota et al. explored three cases of different relative rates of formation transitioning from the case of amorphous aggregate forming much faster than amyloid to the isokinetic case - whereby amorphous aggregate and amyloid would form at approximately the same rate in isolation of each other (Hirota and Hall 2019). From the three panels shown in Fig. 6, Hirota et al. noted note that in such competitive situations the kinetics of amyloid formation may be effectively controlled by the kinetics of the amorphous aggregation through its control of the free monomer concentration (Fig. 6a) (Hall et al. 2015; Hirota and Hall 2019). Appreciation of such a kinetic control situation becomes important when the competitive process is occurring in an unreported manner, as might be the case when aggregation is monitored using an amyloid-specific assay (such as thioflavin T fluorescence) which is not capable of following non-amyloid forms of aggregation (Fig. 6b) (Nilsson 2004). An alternative case might be when an aggregation assay, believed to solely reflect amyloid formation, is recorded using an assay that is particularly sensitive to the presence of amorphous aggregate (Fig. 6c). Such a situation was recently explored in relation to the monitoring of protein aggregation by turbidity assays (Hall et al. 2016; Zhao et al. 2016). In that study, it was shown that at equivalent weight concentrations, compact amorphous aggregates, at a certain size, were able to scatter significantly more light than their rod-like counterparts, and hence generate greater turbidity (Hall et al. 2016).
Fig. 6.
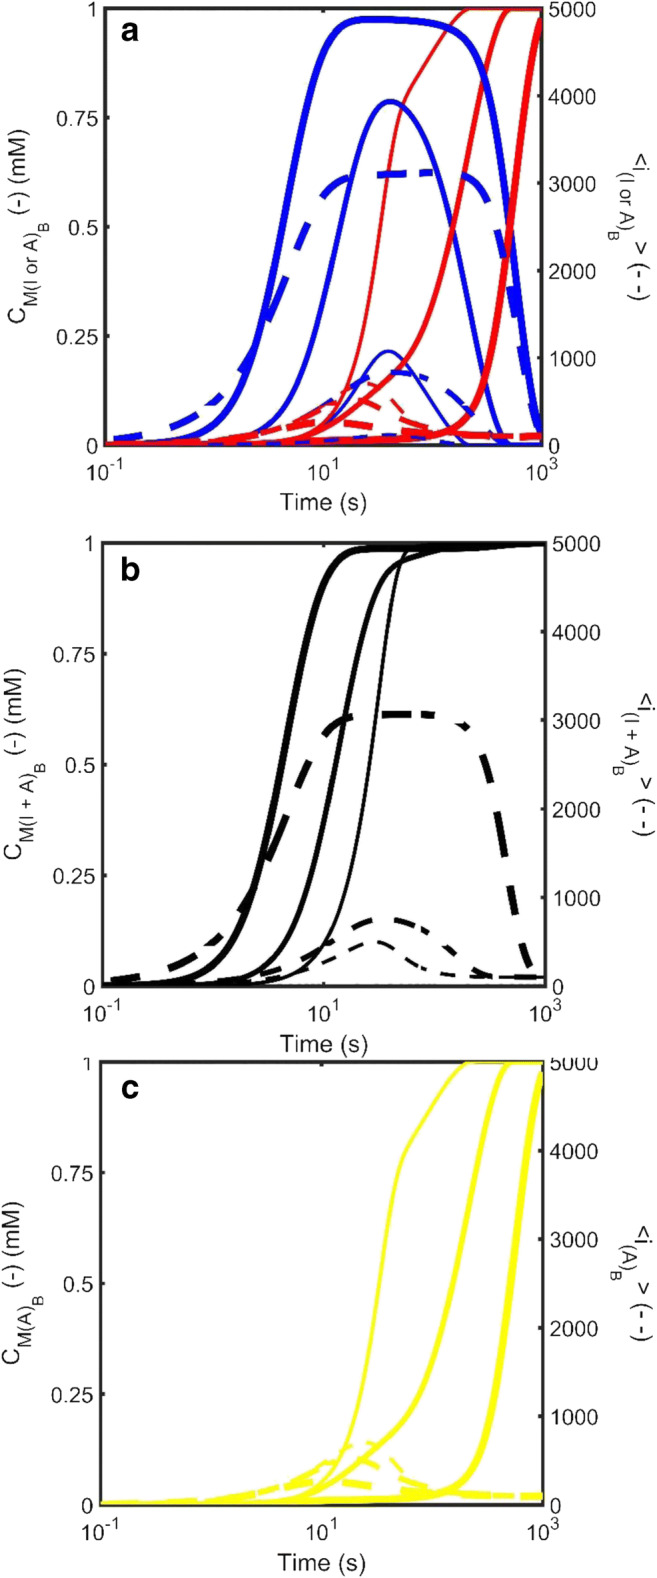
Simulated kinetics of the growth of amorphous aggregate in direct competition with amyloid for free monomer in the bulk liquid phase for three situations in which the intrinsic amyloid kinetics remain unchanged but the growth rate constant of amorphous aggregate increases (thin lines - , medium lines - , thick lines - . The three panels describe various different representations of the total mass concentration of the aggregates, and (solid line – left axis) and the average degree of polymerization of the aggregates, and (dotted line – right axis). a Species plot describing the time evolution of the properties of amorphous aggregate (blue lines) and amyloid (red lines). b Effect of measurement principle on the reported kinetics—Signal reflecting molecular weight: A common analytical procedures for measurement of protein aggregate is the pelleting assay. This assay tends to lump all forms of high molecular weight species together. Black line describes aggregate properties when amyloid and amorphous aggregate contribute equally to the signal. c Effect of measurement principle on the reported kinetics—Signal reflecting molecular amyloid only: Another common analytical procedures for measurement of amyloid is the Thioflavin T fluorescence assay which tends to not recognize amorphous aggregate. Aside from changes in all other characteristic rate constants for the amorphous system remain constant [; ; ]. Simulations were carried out by simultaneous solution of Equations 3 and 5 with the conservation relation . The amyloid kinetics were defined throughout by [; ;; ]. (Translated and reprinted with full permission from Hirota and Hall (2019), CMC Publishing Corporation)
Amorphous aggregate as an intermediate in the formation of amyloid
In contrast to the competitive case described in the previous section, some studies have indicated that amorphous aggregates may, in keeping with the model provided in Eq. 2b, facilitate the formation of amyloid, by acting as obligate an intermediate to its formation (Nguyen and Hall 2004; Cheon et al. 2007; Auer et al. 2008; Grigolato et al. 2017). A number of mechanisms have been suggested for this facilitation, with the main two being heterogeneous nucleation at the surface of the amorphous (and other types) of aggregate (Zhu et al. 2002; Fodera et al. 2008; Grigolato et al. 2017) and homogeneous nucleation within a liquid-like amorphous micro-phase (Nguyen and Hall 2004; Weber and Brangwynne 2012; Shin and Brangwynne 2017). In their 2019 publication, Hirota et al. developed simple kinetic models describing these two possibilities (Hirota and Hall 2019). To achieve this they first required a method for picturing the amorphous aggregate that was capable of smoothly transitioning from its description as a structure-less solid at one end, to that of a separate liquid phase at the other.
To achieve this, they began by considering the internal aspects of each amorphous aggregate as part of a dispersed micro-phase (L) that is distinct to the bulk liquid phase (B) (Fig. 7). The degree of internal liquid character of the amorphous L micro-phase was assigned using a transition parameter, σ, that described the mobility of the constituents within the volume confines of the aggregate. Hirota et al. empirically define this mobility parameter as the ratio of the short-time translational diffusion constant of the monomer within the confines of the amorphous aggregate, (D1)L, to that of the short-time translational diffusion constant in the bulk phase, (D1)B, (Eq.6) (Hirota and Hall 2019).
| 6 |
Fig. 7.
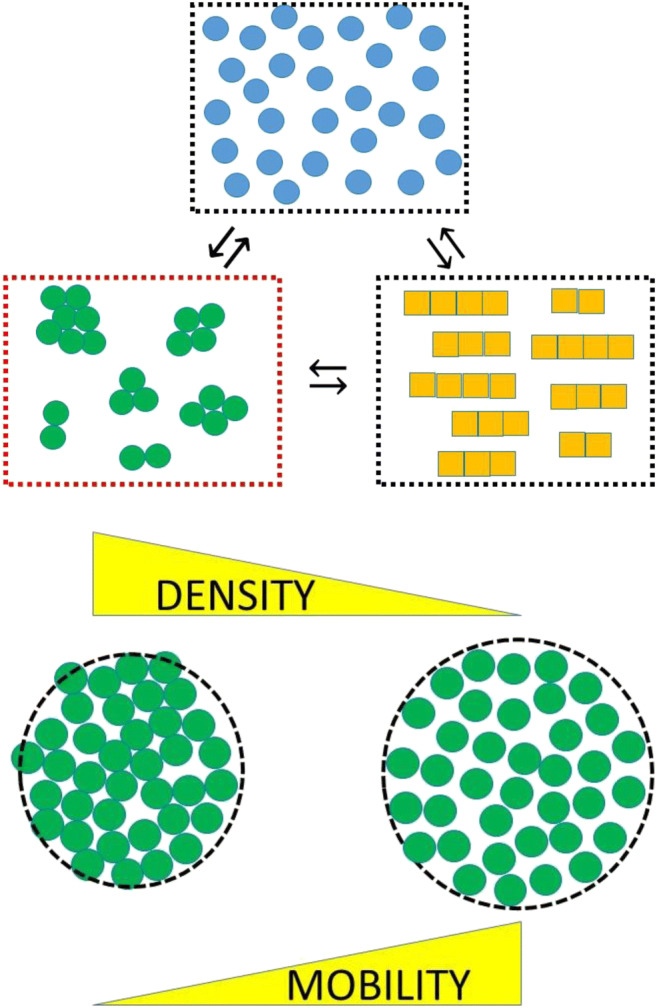
Schematic indicating conceptualization of amorphous aggregate as a separate phase whose liquid character is defined in terms of a mobility parameter, σ, and a density parameter, ρ. The monomer in the aggregate is assigned a molar concentration based on the phase volume (see Eqn. 9a) and rescaled second-order rate constants governing the rate at which this monomer can form amyloid are determined using the mobility parameter, σ as shown in Eqn. 9b-d. (Translated and reprinted with full permission from Hirota and Hall (2019), CMC Publishing Corporation)
At one limiting extreme of this model, the amorphous phase was considered as a ‘frozen’ liquid whose monomeric components have zero mobility, σ = 0, and a critical frozen density, ρ*. The alternative limiting case, was considered as the situation whereby the monomers within the aggregate are essentially as mobile as the bulk liquid, i.e., σ = 1. Due to the packing confines of the amorphous aggregate, Hirota et al. considered its density, ρ, to be less than the frozen density, but greater than the critical dispersion density, ρc at which the micro-phase dissolves (i.e., ρc < ρ < ρ*) (Gillespie and Rideal 1956; Hirota and Hall 2019). At this intermediate density, ρ, the mobility parameter was considered to exist somewhere in the range 0 < σ ≤ σc < 1 where σc is the mobility of the monomer in the amorphous aggregate at the phase dispersion point. In the next sections, we describe how Hirota et al. used this conceptualization of the amorphous phase to describe how it could facilitate the description of amyloid formation occurring within it.
Amorphous aggregate as a secondary nucleation route for amyloid—surface nucleation
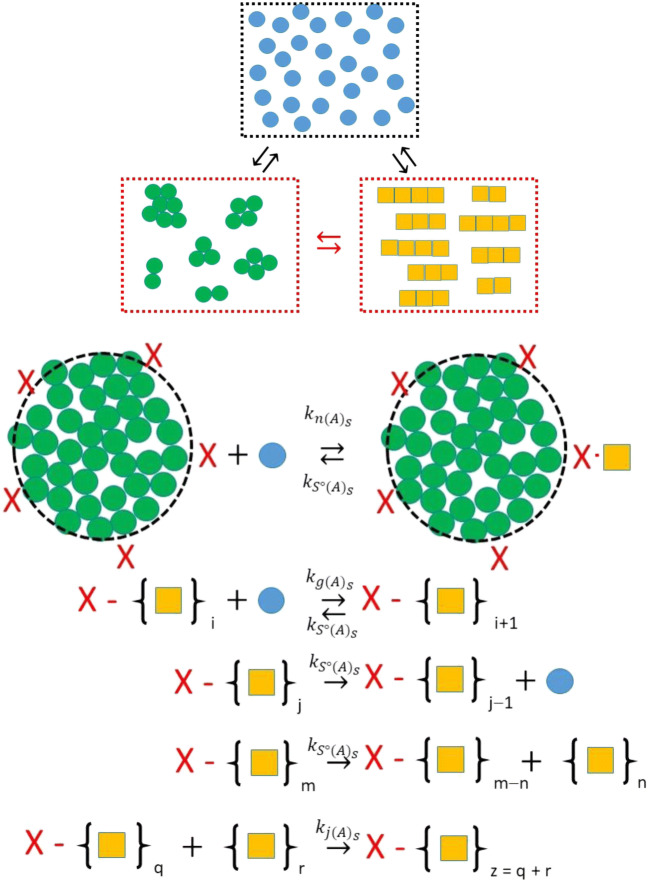
Irrespective of whether or not the amorphous aggregate is fluid or frozen, it will present a region of interface to the bulk solution. The first model considered by Hirota et al. was one in which amorphous aggregate may facilitate amyloid production by surface-induced heterogeneous nucleation (Zhu et al. 2002; Linse et al. 2007; Fodera et al. 2008; Nayak et al. 2008; Grigolato et al. 2017) (Fig. 8). This model pictures the aggregate surface as presenting a set number of sites capable of nucleating amyloid formation upon monomer adsorption to that site (Hall 2001; Hall 2008; Nayak et al. 2008; Thakur et al. 2009). The total concentration of surface nucleation sites, (CX)TOT, (Eq. 7) will depend upon (i) the surface area presented, (defined in Eq. 5e), and (ii) the number of nucleation sites per unit area of surface, (defined in turn by the nature of the surface, i.e., its chemical and structural composition).
| 7 |
Fig. 8.
Minimal mechanism for nucleation of amyloid at the surface of an amorphous aggregate. In this model the amorphous aggregate surface presents a certain number of sites (shown by an X) that are capable of binding monomer from the bulk phase to generate an amyloid structural state. This process is governed by a second-order rate constant, . This surface amyloid nucleus is itself capable of binding more monomer to grow the surface amyloid, governed by the second-order kinetic constant, . The surface amyloid is capable of shrinkage via loss of monomer from the end of the fiber or by fracture of the fiber with loss of the free fractured component to the bulk phase. For completeness, the surface amyloid is also considered able to join with bulk phase fibers governed by the second-order rate constant, . (Translated and reprinted with full permission from Hirota and Hall (2019), CMC Publishing Corporation)
A minimal set of kinetic equations accounting for the amyloid surface nucleation mechanism (Fig. 8) were developed and are shown by Eq. 8. These equations describe the rate of formation of both the number and mass concentration of amorphous aggregate, and , that constitutes the surface phase (Eqns. 8a-e) and the number and mass concentration of amyloid attached to the amorphous aggregate surface, and (Eqns. 8f-h). By necessity, they also include slightly modified equations describing the growth of amyloid in the bulk phase, ( and (, that occurs due to breakage of the amyloid attached to the amorphous aggregate surface and its release into the bulk liquid (Eqns. 8i-k) (Hirota and Hall 2019).
| 8a |
| 8b |
| 8c |
| 8d |
| 8e |
| 8f |
| 8g |
| 8h |
| 8i |
| 8j |
| 8k |
Figure 9 describes a limited examination of the role played by some of the five additional unique parameters required to introduce the surface nucleation mechanism (Hirota and Hall 2019). In particular, the effect of variation in total number of surface nucleation sites, (CX)TOT (through variation in ) and the surface amyloid scission rate, . Figure 9 also examines variation in the rate of amorphous aggregate growth (by changing ) on the rate of surface amyloid growth. Although not explored in detail, Hirota et al. noted that by varying the ability of the system to nucleate amyloid formation via either the surface-based or the bulk homogeneous mechanisms the kinetic behavior can transition from one in which amorphous aggregation and amyloid formation are in competition with each other (Eq. 2a), to one in which amorphous aggregate may be the sole mechanism for nucleation of amyloid (Eq. 2b) and finally to one in which the amorphous aggregation may both compete with, and facilitate, the formation of amyloid (Eq. 2c). This final situation would be the case where the surface and bulk nucleation and growth rate constants are both greater than zero, i.e., [ ≥ 0, ≥ 0] and [ ≥ 0, ≥ 0].
Fig. 9.
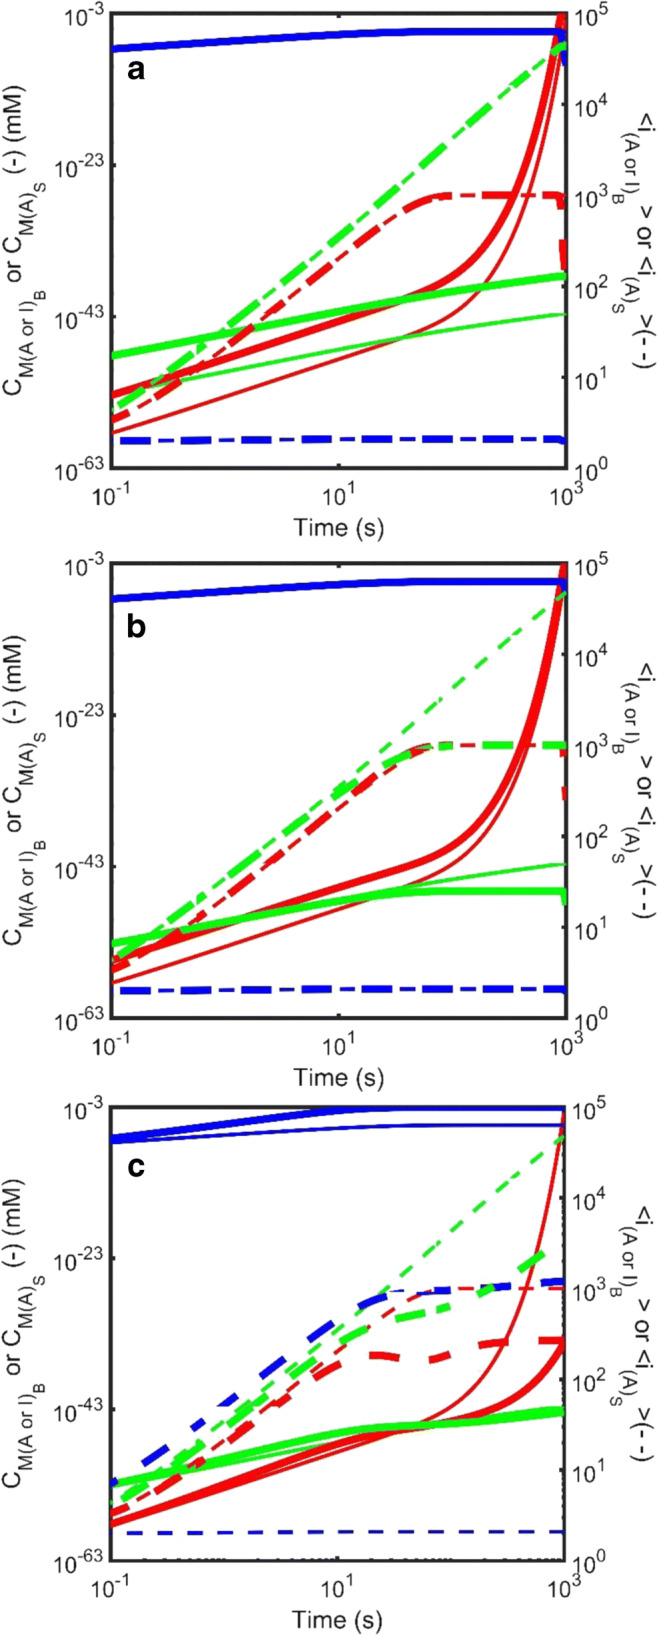
Simulated kinetics of the growth of amyloid occurring via nucleation at the surface of an amorphous aggregate (Eqn. Set 8) described in terms of the total mass concentration (solid line – left axis) and the average degree of polymerization (dotted line – right axis) for amyloid attached to the surface (green), amyloid growing in the bulk phase (red) and amorphous aggregate (blue). a Effect of variation in the number of nucleation sites per unit area of amorphous aggregate, : The parameter was varied from = 1 × 10⁻⁵ ϵmax (thin lines) to (with ϵmax defined as the inverse of the projection area of an assumed spherical adsorbing monomer, i.e., ϵmax=1/(π.R12). b Effect of variation in the scission rate of surface attached amyloid, : The scission rate constant for amyloid attached to the surface of the amorphous aggregate, , was varied from = 1 × 10⁻⁴s−1 (thin lines) to = 0.1 s−1 (thick lines). (c) Effect of variation in the rate of growth of amorphous aggregate, : The growth rate constant for amorphous aggregation was varied from (thin lines) to (thick lines). Throughout these simulations, the bulk phase amyloid kinetics remain unchanged [; ;; ] and unless specified the amorphous aggregation and amyloid surface growth kinetics were respectively defined by the following rate constant sets amorphous aggregation - [; ;; ] and amyloid surface growth - [; ;; ]. (Translated and reprinted with full permission from Hirota and Hall (2019), CMC Publishing Corporation)
Amorphous aggregate as a secondary nucleation route for amyloid—liquid phase nucleation
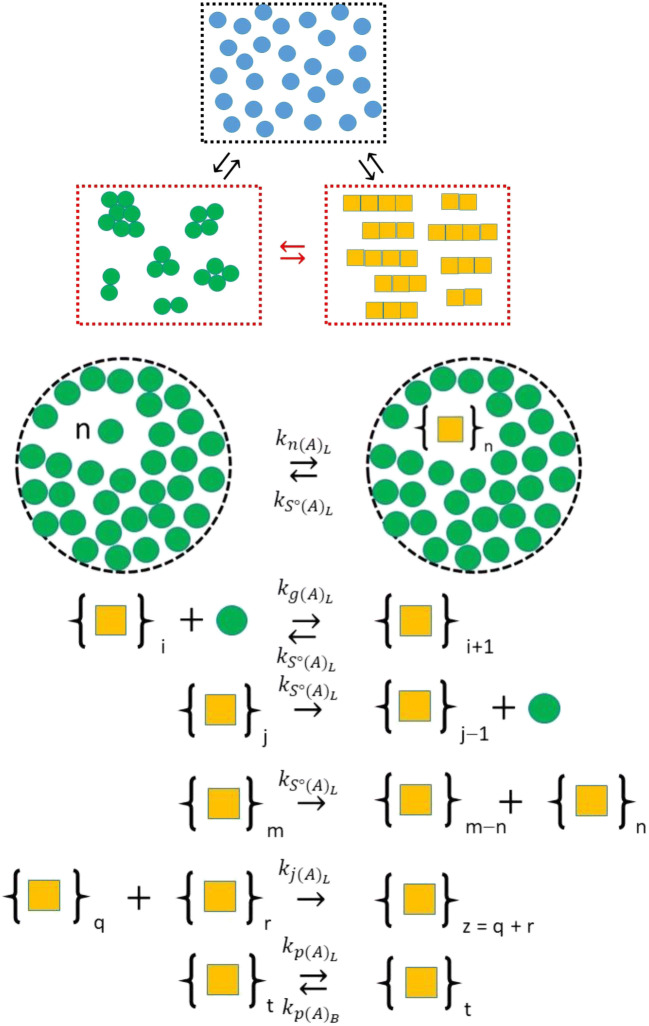
Considering the amorphous aggregate as a separate liquid phase allowed Hirota et al. to employ macroscopic kinetic equations to describe amyloid formation within it. Figure 10 is a schematic that describes the nucleation of amyloid within the amorphous liquid aggregate and also contains a mechanism for growth, fragmentation, and partition of the amyloid product (Hirota and Hall 2019). Based on the density of the monomer within the amorphous micro-phase, an effective monomer concentration, (C1)L, (units moles/L) is determined by use of Eq. 9a with a corrective term β that accounts for the differences in volume between the L and B phases6 such that . Using this terminology the concentration of free monomer in the bulk liquid phase was described by (C1)B. Based on the mobility of the components within the aggregate, Hirota et al. rescaled all bimolecular association rate constants by multiplying their bulk phase counterparts through by σ (Eq. 9b-d).
| 9a |
| 9b |
| 9c |
| 9d |
Fig. 10.
Minimal mechanism describing how amyloid may nucleate and grow within a liquid-like amorphous aggregate, designated as the L phase. The mechanism is essentially similar to that described by Eqn. 3 for bulk phase nucleated growth with nucleation considered as a bimolecular addition reaction (such that the nucleus size n = 2) governed by a second-order-nucleation rate constant, . Fiber growth is able to occur by monomer addition and fiber end-to-end joining, respectively regulated by second-order rate constants, , and . Fiber shrinkage occurs by breakage (scission) of monomer from either the fiber end or via fracture within the fiber, with the site fracture rate governed by a first-order rate constant, . Two additional partition rate constants specify the rate of transfer from the amorphous liquid phase to bulk phase, , and from the bulk phase into the amorphous liquid phase, . (Translated and reprinted with full permission from Hirota and Hall (2019), CMC Publishing Corporation)
Using these two forms of rescaling, the set of equations used for describing homogeneous nucleation in the bulk phase (Eq. 3) were recast to describe homogenous nucleation of amyloid within the amorphous liquid micro-phase with additional rate constants, and , that respectively accounted for partition of amyloid from and to the amorphous liquid phase (L) and to and from the bulk liquid phase (B) (Eq. 10 a-c) (Hirota and Hall 2019). Homogeneous nucleation of amyloid within the amorphous liquid phase required that the set of equations describing amorphous aggregate formation be redrafted (Eq. 10 d-i) with additional terms appearing in the rate equations (Eqns. 10d and e), the description of the volume of amorphous aggregate (Eq. 10g), the surface area (Eq. 10h), and a more pertinent description of the surface area in terms of the total surface of amorphous aggregate per bulk solution volume, Z, given as Eq. 10i. The equations for amyloid formation within the bulk phase (Eqn. set 3) also require correction for the additional mechanistic terms (Eq. 10 j-l). Throughout Eqn. set 10, the volume correction term β is used to balance accounts of material transfer between the bulk (B) and amorphous liquid (L) phases. As described in the paper by Hirota et al. due to the continual change in volume of the amorphous aggregate, due to both its growth and shrinkage via normal growth and internal generation of the amyloid within it, the β term needs to be evaluated at each step of the numerical integration cycle (Hirota and Hall 2019). An implicit formulation of β that assumes the total volume of the amorphous aggregate results from simple additivity of the amorphous and amyloid components is shown by Eqns. 10g and 10m. A method for calculating its analytical solution is provided by Eq. 10n. Through use of the β term, the free concentration of monomer in the bulk (B) phase can be correctly accounted for using Eqn. 10o.
| 10a |
| 10b |
| 10c |
| 10d |
| 10e |
| 10f |
| 10g |
| 10h |
| 10i |
| 10j |
| 10k |
| 10l |
| 10m |
| 10n |
| 10o |
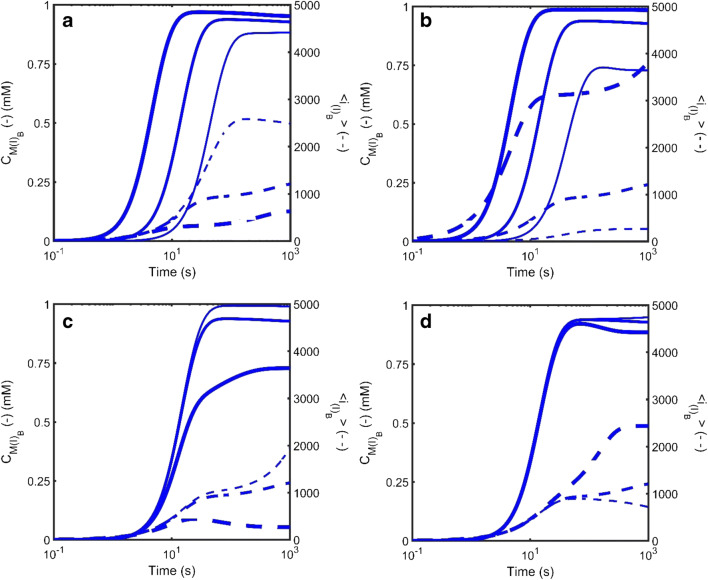
Figure 11 describes examination by Hirota et al. of the effect of variation in the three additional unique parameters required to specify an alternate homogeneous nucleation mechanism occurring within the amorphous liquid phase, namely the mobility of monomer within the amorphous phase, σ, the partition rate for passage of amyloid from the amorphous to the bulk phases, , and the partition rate for passage of amyloid from the bulk to the amorphous phases, (Hirota and Hall 2019). By decreasing the mobility of monomers within the amorphous liquid phase, the alternate homogeneous nucleation mechanism can be reduced in importance (and effectively extinguished as σ → 0) thereby making aggregate internal fluidity/mobility the key determinant regulating the system kinetic behavior from one in which amorphous aggregation and amyloid formation are in competition with each other (Eq. 2a), to one in which amorphous aggregate may be the sole mechanism for nucleation of amyloid (Eq. 2b) and finally to one in which the amorphous aggregation may both compete with, and facilitate, the formation of amyloid (Eq. 2c).
Fig. 11.
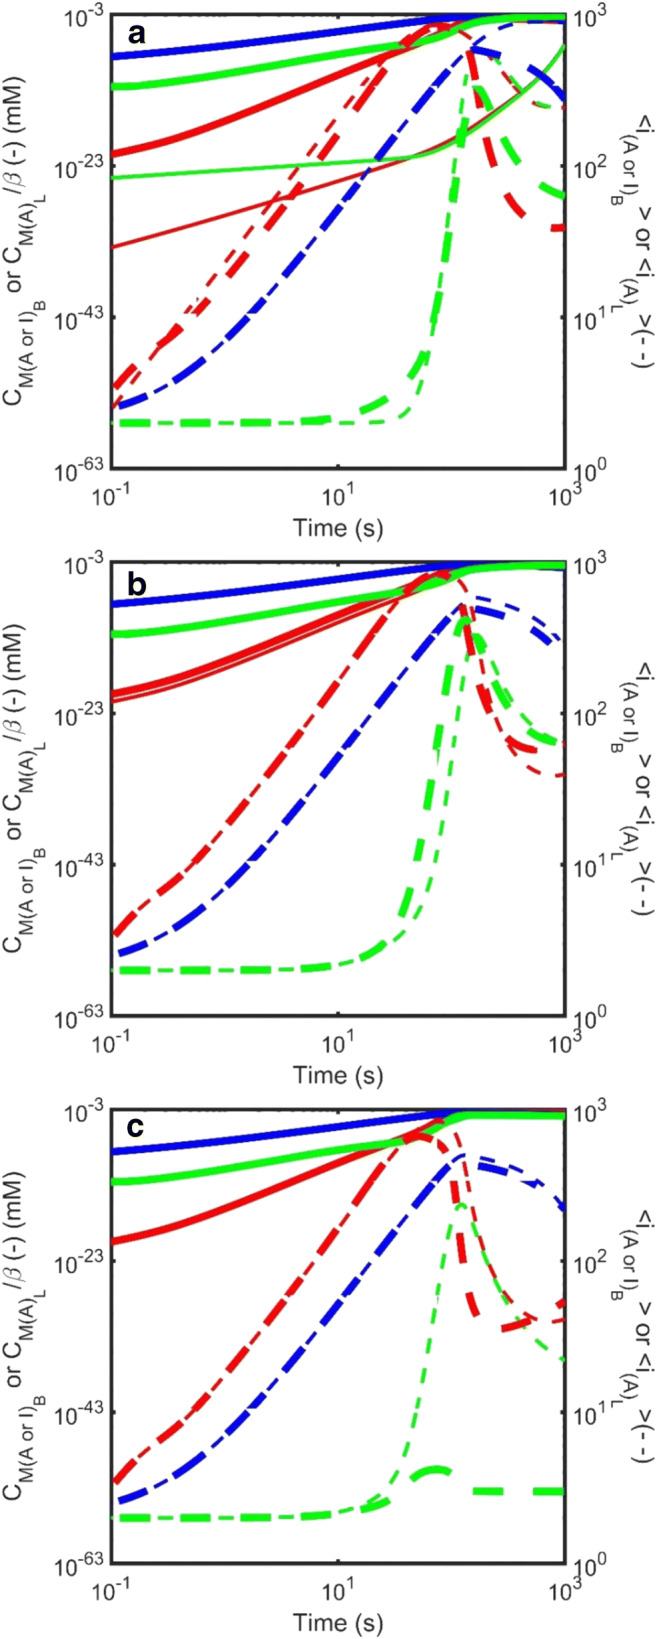
Simulated kinetics of the amyloid growth via a mechanism involving nucleation within a second liquid-like phase constituted by an amorphous aggregate (Eqn. Set 10) described in terms of the total mass concentration (solid line – left axis) and the average degree of polymerization (dotted line – right axis). Various species are depicted using different colors, with green denoting amyloid growing within the amorphous liquid phase, red denoting amyloid in the bulk phase and blue describing amorphous aggregate. a Effect of variation in the parameter describing mobility of monomer within the liquid phase, σ: The value of σ was varied between two limits, σ = 1 × 10⁻¹⁵ (thin lines) and σ = 1 × 10⁻¹⁰ (medium lines) and σ = 1 × 10⁻⁵ (thick lines). b Effect of variation in the partition rate of amyloid from the amorphous phase to the bulk phase, : The partition rate constant regulating the rate of egress of amyloid from the amorphous to the bulk phase, , was varied from 5 × 10⁻¹⁰ m.s−1 (thin lines) to 5 × 10⁻⁹ m.s−1 with 1 × 10⁻¹⁰ m.s−1. c Effect of variation in the rate of scission of amyloid growing within the amorphous phase, : The value of was varied between two limits, = 1 × 10⁻⁴ s−1 (thin lines) and 0.1 s−1 (thick lines). When not specifically varied all other rate constants set as follows – amyloid formation in bulk phase [; ;; ; n = 2]. Amorphous aggregate formation in bulk phase – [; ;; ]. Amyloid formation in the amorphous liquid phase [; ;; ; n = 2]. (Translated and reprinted with full permission from Hirota and Hall (2019), CMC Publishing Corporation)
Conclusions
Early attempts at the mechanistic description of amyloid formation kinetics adopted one-dimensional nucleated growth models used in the description and analysis of actin and tubulin assembly (Oosawa and Kasai 1962; Oosawa and Asakura 1975; Lumry and Eyring 1954; Hall and Minton 2002, 2004; Hall and Edskes 2012). Scientific justification for using these model-based mechanisms stemmed from the inherent similarity of these protein aggregation processes which both involved the spontaneous formation of protein fibrils possessing an ordered internal arrangement, from a starting pool of monomers existing above a certain critical concentration (Lomakin et al. 1996; Lansbury 1999; Carulla et al. 2005; Hall and Edskes 2012). The mechanism of amyloid nucleation in these models was set to follow a low molecularity association event occurring solely between monomers in a single bulk liquid phase (e.g., Hall et al. 2005; Hall and Hirota 2009) and due to this feature is sometimes termed homogeneous nucleation (Oxtoby 1992; Lomakin et al. 1996). In terms of fitting experimental kinetic data, the homogeneous nucleation equations exhibit extraordinary flexibility in the sense that with minimal modification (Lomakin et al. 1996; Pallitto and Murphy 2001; Xue et al. 2008; Schreck and Yuan 2013), they are able to empirically accommodate nearly any time-dependent behavior (Bentea et al. 2017). This flexibility has, in part, both encouraged and allowed quantitative studies based on non-linear regression analysis to establish the general plausibility of the homogeneous nucleation model described in terms of a set of rate constants and a critical nucleus (Lomakin et al. 1996; Pallitto and Murphy 2001; Xue et al. 2008; Schreck and Yuan 2013; Bentea et al. 2017). However, numerous experimental and particle simulation studies over the last thirty years have shown that amyloid nucleation need not be limited to the homogeneous model and that different modes of nucleation including those involving a second process, component or phase, may be possible7 (Grigolato et al. 2017). The three most commonly discussed secondary nucleation processes are (i) fiber fragmentation (Masel et al. 1999; Hall and Edskes 2004, 2012), (ii) interfacial nucleation (Zhu et al. 2002; Linse et al. 2007; Fodera et al. 2008; Nayak et al. 2008; Grigolato et al. 2017), and (iii) homogeneous nucleation occurring within a second liquid phase (Nguyen and Hall 2004; Auer et al. 2012; Weber and Brangwynne 2012; Shin and Brangwynne 2017). However, a single treatment in which all are featured (such as the models developed in the present case) has been conspicuously absent.
A novel aspect of the modeling approach developed by Hirota et al. is the description of the amorphous aggregate as a second liquid phase with the degree of liquid-like character determined by the mobility, σ, of the monomer within the aggregate (Hirota and Hall 2019). For simplicity, they modeled the amorphous liquid phase using a standard geometry (utilizing spherical geometry) and this allowed them to calculate amorphous phase surface area for subsequent evaluation of the secondary interfacial nucleation processes and amorphous phase volume for evaluation of secondary homogeneous nucleation processes. In the work by Hirota et al., they stressed that the choice of exact geometry of the amorphous aggregate was not important, and that when using their approach in practice, the geometry could be easily gotten from ultra-microscope based analysis (e.g., atomic force or transmission electron microscope images) (Hall 2012; Usov and Mezzenga 2015). Similarly, the degree of mobility, σ, could be experimentally determined through analysis of the translational diffusion constant of monomer in the amorphous aggregate using a photo-bleaching or single particle tracking experiment of fluorescent dye-labeled monomer (Hall 2012; Hall and Hoshino 2010; Shin and Brangwynne 2017). Conceptualization of the amorphous aggregate as a liquid of arbitrary fluidity also provides a suitable framework for the design and conduct of experiments to test the effect of temperature on the behavior of amorphous aggregates—for example, one potentially clinically relevant question relates to whether or not a sudden increase in local temperature might render a previously inert amorphous aggregate amyloidogenic? Such lines of inquiry are becoming increasingly germane due to recent developments in understanding the roles of condensed phases in the cell nucleus (nucleoid bodies) or cell cytosol (cytosolic bodies) (e.g., as highlighted by Michnick and Bergeron-Sandoval 2018).
Equal in importance to our consideration of what may be occurring within the separate ‘phase’ of the amorphous aggregates, are the efforts of Hirota et al. (Hirota and Hall 2019) at modeling the amorphous aggregate as a reactive surface capable of nucleating amyloid formation via an interfacial dependent process (Zhu et al. 2002; Linse et al. 2007; Fodera et al. 2008; Nayak et al. 2008; Grigolato et al. 2017). Consideration of this interfacial aspect of amorphous aggregates holds potential promise for the elucidation of a number topics literally positioned at the boundary of amyloid growth and colloidal science areas. One such crossover area is the halo effect—a phenomenon in which a less dense polymer layer surrounds a colloidal center thereby stabilizing it against colloidal flocculation (Tohver et al. 2001). In the model by Hirota et al., a form of the halo phenomenon around large amorphous aggregates is predicted to occur when amyloid nucleation at the amorphous aggregate surface is a likely occurrence. As noted in the colloidal stabilization literature, the production of such an amyloid halo surrounding an amorphous center should be visible in electron or even contrast light microscopy and indeed may have already been observed in TIRF microscopy measurements of amyloid growth on a coverslip (Ban and Goto 2006). Another area with great crossover potential is the purposeful generation of a catalytic colloidal mass (Linse et al. 2007). Figure 8 provides mechanistic insight into how a stabilized amorphous aggregate capable of supporting nucleation of amyloid fibers at its surface could act in the role of, ‘amyloid catalyst’, when exposed to a solution of free monomer, especially so under conditions promoting scission/fragmentation of the surface bound fibers (Hall and Edskes 2004).
With so many introduced parameters, some might fairly argue that the models described in Hirota et al. 2019 may not be practical in the analysis of experimental data8 which often is gained through techniques that differentially cover measurement aspects related to time resolution (Xue et al. 2008; Zhao et al. 2016), the unfolded nature of the amyloid monomer (Hall et al. 2018]; the aggregate internal structure (Tycko and Wickner 2013; Wickner et al. 2015) and aggregate size distribution (Lomakin et al. 1996; Hall 2012; Hall and Huang 2012; Hall 2017). However, to be fair to the authors, no similarly self-consistent macroscopic model has been previously applied to this problem. We hope that the present English language exposition of that work helps to frame the argument in a manner conducive to, both recognizing, and interrogating, the competitive vs. facilitation paradigms outlined in Eq. 2c. Furthermore, we believe that such macroscopic approaches, as reviewed here, will enable more realistic accounting of the behavior of amyloids in living organisms, such as the yeast amyloid model systems used to study the epigenetic aspects of amyloid prions (Edskes et al. 2017; Wickner et al. 2015; Kryndushkin et al. 2017).
Acknowledgements
NH would like to thank supporting funds from Do International Trading House. HE: This research was supported, in part, by the Intramural Research Program of the NIH, The National Institute of Diabetes and Digestive and Kidney Diseases (NIDDK). Initial and later aspects of the work of DH were respectively supported by funds and resources associated with an Australian National University (ANU) Senior Research Fellowship and an Associate Professorship at the Institute for Protein Research, Osaka University. DH would also like to express thanks to The National Institute of Diabetes and Digestive and Kidney Diseases (NIDDK) for financial support in the form of a two-month visiting fellowship in July and August of 2018.
Compliance with ethical standards
Conflict of interest
Nami Hirota declares that she has no conflict of interest. Herman Edskes declares that he has no conflict of interest. Damien Hall declares that he has no conflict of interest.
Ethical approval
This article does not contain any studies with human participants or animals performed by any of the authors.
Footnotes
By irregular, we are referring to the internal positioning of monomers within the aggregate. Crystal structures have very regular positional ordering as defined by a structure factor or distance and direction dependent distribution function. On the other hand, amorphous aggregates display negligible long-range order as they are pieced together semi-randomly.
For the condition t ≤ (N1 − 1)/[kI. (C1)TOT] where N1 is the number of protein molecules in solution.
Defined in terms of V1, the volume of the monomer, and α, a volume packing fraction within the aggregate
i.e., when the = 2 each breakage event decreases the number of fibers by 1, when = 3 there is no change in fiber number per breakage event and when the fiber number increases with each breakage event.
The value of q was set equal to 7 so that the exponential term equals − 1 when and approaches 0 when approaches and extends beyond 3.
Where L and B refer to the dispersed micro-phase (L) and the bulk liquid phase (B).
Secondary nucleation processes that occur at either the interfacial boundary or within a different phase are known as heterogeneous nucleation processes.
In relation to the multi-parameter development reviewed here [Hirota et al. 2019], it is humbling to revisit some of the apparent early successes in which amyloid formation rates were able to be predicted over order of magnitude ranges using just a few parameters related to protein sequence and solution conditions (e.g., Dubay et al. 2004). As can be appreciated from the present discussion, these early successes may have been due to the fact that the authors were simply describing amorphous aggregation of proteins.
Publisher’s note
Springer Nature remains neutral with regard to jurisdictional claims in published maps and institutional affiliations.
References
- Auer S, Meersman F, Dobson CM, Vendruscolo M. A generic mechanism of emergence of amyloid protofilaments from disordered oligomeric aggregates. PLoS Comput Biol. 2008;4(11):e1000222. doi: 10.1371/journal.pcbi.1000222. [DOI] [PMC free article] [PubMed] [Google Scholar]
- Auer S, Ricchiuto P, Kashchiev D. Two-step nucleation of amyloid fibrils: omnipresent or not? J Mol Biol. 2012;422(5):723–730. doi: 10.1016/j.jmb.2012.06.022. [DOI] [PubMed] [Google Scholar]
- Baldwin RL. On-pathway versus off-pathway folding intermediates. Fold Des. 1996;1(1):R1–R8. doi: 10.1016/S1359-0278(96)00003-X. [DOI] [PubMed] [Google Scholar]
- Ban T, Goto Y (2006) Direct observation of amyloid growth monitored by total internal reflection fluorescence microscopy. Methods in enzymology 413:91–102 [DOI] [PubMed]
- Bennett CH. Serially deposited amorphous aggregates of hard spheres. J Appl Phys. 1972;43:2727–2734. doi: 10.1063/1.1661585. [DOI] [Google Scholar]
- Bentea L, Watzky MA, Finke RG. Sigmoidal nucleation and growth curves across nature fit by the Finke–Watzky model of slow continuous nucleation and autocatalytic growth: explicit formulas for the lag and growth times plus other key insights. J Phys Chem C. 2017;121(9):5302–5312. doi: 10.1021/acs.jpcc.6b12021. [DOI] [Google Scholar]
- Binger KJ, Pham CL, Wilson LM, Bailey MF, Lawrence LJ, Schuck P, Howlett GJ. Apolipoprotein C-II amyloid fibrils assemble via a reversible pathway that includes fibril breaking and rejoining. J Mol Biol. 2008;376(4):1116–1129. doi: 10.1016/j.jmb.2007.12.055. [DOI] [PubMed] [Google Scholar]
- Carulla N, Caddy GL, Hall DR, Zurdo J, Gairí M, Feliz M, Giralt E, Robinson CV, Dobson CM. Molecular recycling within amyloid fibrils. Nature. 2005;436(7050):554. doi: 10.1038/nature03986. [DOI] [PubMed] [Google Scholar]
- Cheon M, Chang I, Mohanty S, Luheshi LM, Dobson CM, Vendruscolo M, Favrin G. Structural reorganisation and potential toxicity of oligomeric species formed during the assembly of amyloid fibrils. PLoS Comput Biol. 2007;3(9):e173. doi: 10.1371/journal.pcbi.0030173. [DOI] [PMC free article] [PubMed] [Google Scholar]
- Dill KA, Chan HS. From Levinthal to pathways to funnels. Nat Struct Mol Biol. 1997;4(1):10. doi: 10.1038/nsb0197-10. [DOI] [PubMed] [Google Scholar]
- Dorta-Estremera SM, Li J, Cao W (2013) Rapid generation of amyloid from native proteins in vitro. J Vis Exp 82:50869 [DOI] [PMC free article] [PubMed]
- DuBay KF, Pawar AP, Chiti F, Zurdo J, Dobson CM, Vendruscolo M. Prediction of the absolute aggregation rates of amyloidogenic polypeptide chains. J Mol Biol. 2004;341(5):1317–1326. doi: 10.1016/j.jmb.2004.06.043. [DOI] [PubMed] [Google Scholar]
- Edskes HK, Kryndushkin D, Shewmaker F, Wickner RB (2017) Prion transfection of yeast. Cold Spring Harb Protoc 2017(2):112–117 [DOI] [PubMed]
- Eisenberg DS, Sawaya MR. Structural studies of amyloid proteins at the molecular level. Annu Rev Biochem. 2017;86:69–95. doi: 10.1146/annurev-biochem-061516-045104. [DOI] [PubMed] [Google Scholar]
- Fink AL. Protein aggregation: folding aggregates, inclusion bodies and amyloid. Fold Des. 1998;3(1):R9–R23. doi: 10.1016/S1359-0278(98)00002-9. [DOI] [PubMed] [Google Scholar]
- Fodera V, Librizzi F, Groenning M, Van De Weert M, Leone M. Secondary nucleation and accessible surface in insulin amyloid fibril formation. J Phys Chem B. 2008;112(12):3853–3858. doi: 10.1021/jp710131u. [DOI] [PubMed] [Google Scholar]
- Friedlander SK, Smoke D. Haze: fundamentals of aerosol dynamics. New York: Oxford University Press; 2000. [Google Scholar]
- Gillespie T, Rideal EK. The coalescence of drops at an oil-water interface. Trans Faraday Soc. 1956;52:173–183. doi: 10.1039/tf9565200173. [DOI] [Google Scholar]
- Goldschmidt L, Teng PK, Riek R, Eisenberg D. Identifying the amylome, proteins capable of forming amyloid-like fibrils. Proc Natl Acad Sci. 2010;107(8):3487–3492. doi: 10.1073/pnas.0915166107. [DOI] [PMC free article] [PubMed] [Google Scholar]
- Grigolato F, Colombo C, Ferrari R, Rezabkova L, Arosio P. Mechanistic origin of the combined effect of surfaces and mechanical agitation on amyloid formation. ACS Nano. 2017;11(11):11358–11367. doi: 10.1021/acsnano.7b05895. [DOI] [PubMed] [Google Scholar]
- Hall D. Use of optical biosensors for the study of mechanistically concerted surface adsorption processes. Anal Biochem. 2001;288(2):109–125. doi: 10.1006/abio.2000.4851. [DOI] [PubMed] [Google Scholar]
- Hall D (2008) Kinetic models describing biomolecular interactions at surfaces. In: Handbook of Surface Plasmon Resonance. Royal Society of Chemistry, pp 81–122
- Hall D. Semi-automated methods for simulation and measurement of amyloid fiber distributions obtained from transmission electron microscopy experiments. Anal Biochem. 2012;421(1):262–277. doi: 10.1016/j.ab.2011.10.012. [DOI] [PubMed] [Google Scholar]
- Hall D. A composite polynomial approach for analyzing the indefinite self-association of macromolecules studied by sedimentation equilibrium. Biophys Chem. 2017;228:10–16. doi: 10.1016/j.bpc.2017.06.002. [DOI] [PubMed] [Google Scholar]
- Hall D, Edskes H. Silent prions lying in wait: a two-hit model of prion/amyloid formation and infection. J Mol Biol. 2004;336(3):775–786. doi: 10.1016/j.jmb.2003.12.004. [DOI] [PubMed] [Google Scholar]
- Hall D, Edskes H. Computational modeling of the relationship between amyloid and disease. Biophys Rev. 2012;4(3):205–222. doi: 10.1007/s12551-012-0091-x. [DOI] [PMC free article] [PubMed] [Google Scholar]
- Hall D, Hirota N. Multi-scale modelling of amyloid formation from unfolded proteins using a set of theory derived rate constants. Biophys Chem. 2009;140(1–3):122–128. doi: 10.1016/j.bpc.2008.11.013. [DOI] [PubMed] [Google Scholar]
- Hall D, Hoshino M 2010 Effects of macromolecular crowding on intracellular diffusion from a single particle perspective. Biophysical reviews, 2(1):39–53 [DOI] [PMC free article] [PubMed]
- Hall D, Huang L. On the use of size-exclusion chromatography for the resolution of mixed amyloid-aggregate distributions (I) Anal Biochem. 2012;426:69–85. doi: 10.1016/j.ab.2012.04.001. [DOI] [PubMed] [Google Scholar]
- Hall D, Minton AP. Effects of inert volume-excluding macromolecules on protein fiber formation. I. Equilibrium models. Biophys Chem. 2002;98(1–2):93–104. doi: 10.1016/S0301-4622(02)00087-X. [DOI] [PubMed] [Google Scholar]
- Hall D, Minton AP. Effects of inert volume-excluding macromolecules on protein fiber formation. II. Kinetic models for nucleated fiber growth. Biophys Chem. 2004;107(3):299–316. doi: 10.1016/j.bpc.2003.09.016. [DOI] [PubMed] [Google Scholar]
- Hall D, Hirota N, Dobson CM. A toy model for predicting the rate of amyloid formation from unfolded protein. J Mol Biol. 2005;351(1):195–205. doi: 10.1016/j.jmb.2005.05.013. [DOI] [PubMed] [Google Scholar]
- Hall D, Kardos J, Edskes H, Carver JA, Goto Y. A multi-pathway perspective on protein aggregation: implications for control of the rate and extent of amyloid formation. FEBS Lett. 2015;589(6):672–679. doi: 10.1016/j.febslet.2015.01.032. [DOI] [PMC free article] [PubMed] [Google Scholar]
- Hall D, Zhao R, So M, Adachi M, Rivas G, Carver JA, Goto Y. Recognizing and analyzing variability in amyloid formation kinetics. Anal Biochem. 2016;510:56–71. doi: 10.1016/j.ab.2016.07.013. [DOI] [PubMed] [Google Scholar]
- Hall D, Kinjo A, Goto Y. A new look at an old view of denaturant induced protein unfolding. Anal Biochem. 2018;542:40–57. doi: 10.1016/j.ab.2017.11.011. [DOI] [PubMed] [Google Scholar]
- Hirota N, Hall D (2019) Protein aggregation kinetics: a unified theoretical description. In: Kuroda Y, Arisaka F (eds) Chapter 7 of ‘Protein Solubility and Amorphous Aggregation: From Academic Research to Applications in Drug Discovery and Bioindustry’. CMC Publishers, Tokyo (original article in Japanese)
- Kim PS, Baldwin RL. Specific intermediates in the folding reactions of small proteins and the mechanism of protein folding. Annu Rev Biochem. 1982;51(1):459–489. doi: 10.1146/annurev.bi.51.070182.002331. [DOI] [PubMed] [Google Scholar]
- Kryndushkin D, Edskes HK, Shewmaker FP, Wickner RB (2017) Prions. Cold Spring Harbor Protocols, 2017(2), pp.pdb-top077586 [DOI] [PubMed]
- Kuwajima K, Yamaya H, Miwa S, Sugai S, Nagamura T (1987) Rapid formation of secondary structure framework in protein folding studied by stopped‐flow circular dichroism. FEBS letters. 221(1):115–118 [DOI] [PubMed]
- Lansbury PT. Evolution of amyloid: what normal protein folding may tell us about fibrillogenesis and disease. Proc Natl Acad Sci. 1999;96(7):3342–3344. doi: 10.1073/pnas.96.7.3342. [DOI] [PMC free article] [PubMed] [Google Scholar]
- Linse S, Cabaleiro-Lago C, Xue WF, Lynch I, Lindman S, Thulin E, Radford SE, Dawson KA. Nucleation of protein fibrillation by nanoparticles. Proc Natl Acad Sci. 2007;104(21):8691–8696. doi: 10.1073/pnas.0701250104. [DOI] [PMC free article] [PubMed] [Google Scholar]
- Lomakin A, Chung DS, Benedek GB, Kirschner DA, Teplow DB. On the nucleation and growth of amyloid beta-protein fibrils: detection of nuclei and quantitation of rate constants. Proc Natl Acad Sci. 1996;93(3):1125–1129. doi: 10.1073/pnas.93.3.1125. [DOI] [PMC free article] [PubMed] [Google Scholar]
- Lumry R, Eyring H. Conformational changes of proteins. J Phys Chem. 1954;58:110–120. doi: 10.1021/j150512a005. [DOI] [Google Scholar]
- Masel J, Jansen VA, Nowak MA. Quantifying the kinetic parameters of prion replication. Biophys Chem. 1999;77(2–3):139–152. doi: 10.1016/S0301-4622(99)00016-2. [DOI] [PubMed] [Google Scholar]
- Mezzenga R, Fischer P. The self-assembly, aggregation and phase transitions of food protein systems in one, two and three dimensions. Rep Prog Phys. 2013;76(4):046601. doi: 10.1088/0034-4885/76/4/046601. [DOI] [PubMed] [Google Scholar]
- Michnick SW, Bergeron-Sandoval LP (2018) Why does biopolymer condensation matter? Nat Rev Mol Cell Biol 19(1):613–614 [DOI] [PubMed]
- Nayak A, Dutta AK, Belfort G. Surface-enhanced nucleation of insulin amyloid fibrillation. Biochem Biophys Res Commun. 2008;369(2):303–307. doi: 10.1016/j.bbrc.2008.01.159. [DOI] [PubMed] [Google Scholar]
- Nguyen HD, Hall CK. Molecular dynamics simulations of spontaneous fibril formation by random-coil peptides. Proc Natl Acad Sci. 2004;101(46):16180–16185. doi: 10.1073/pnas.0407273101. [DOI] [PMC free article] [PubMed] [Google Scholar]
- Nilsson MR. Techniques to study amyloid fibril formation in vitro. Methods. 2004;34(1):151–160. doi: 10.1016/j.ymeth.2004.03.012. [DOI] [PubMed] [Google Scholar]
- Oosawa F, Asakura S. Thermodynamics of the polymerization of protein. London. New York: Academic Press; 1975. [Google Scholar]
- Oosawa F, Kasai M. A theory of linear and helical aggregations of macromolecules. J Mol Biol. 1962;4(1):10–21. doi: 10.1016/S0022-2836(62)80112-0. [DOI] [PubMed] [Google Scholar]
- Oxtoby DW. Homogeneous nucleation: theory and experiment. J Phys Condens Matter. 1992;4(38):7627. doi: 10.1088/0953-8984/4/38/001. [DOI] [Google Scholar]
- Pallitto MM, Murphy RM. A mathematical model of the kinetics of β-amyloid fibril growth from the denatured state. Biophys J. 2001;81(3):1805–1822. doi: 10.1016/S0006-3495(01)75831-6. [DOI] [PMC free article] [PubMed] [Google Scholar]
- Qin Z, Hu D, Zhu M, Fink AL. Structural characterization of the partially folded intermediates of an immunoglobulin light chain leading to amyloid fibrillation and amorphous aggregation. Biochemistry. 2007;46(11):3521–3531. doi: 10.1021/bi061716v. [DOI] [PubMed] [Google Scholar]
- Schreck JS, Yuan JM. A kinetic study of amyloid formation: fibril growth and length distributions. J Phys Chem B. 2013;117(21):6574–6583. doi: 10.1021/jp401586p. [DOI] [PubMed] [Google Scholar]
- Shin Y, Brangwynne CP. Liquid phase condensation in cell physiology and disease. Science. 2017;357(6357):eaaf4382. doi: 10.1126/science.aaf4382. [DOI] [PubMed] [Google Scholar]
- Thakur G, Micic M, Leblanc RM. Surface chemistry of Alzheimer’s disease: a Langmuir monolayer approach. Colloids Surf B: Biointerfaces. 2009;74(2):436–456. doi: 10.1016/j.colsurfb.2009.07.043. [DOI] [PubMed] [Google Scholar]
- Tohver V, Smay JE, Braem A, Braun PV, Lewis JA. Nanoparticle halos: a new colloid stabilization mechanism. Proc Natl Acad Sci. 2001;98(16):8950–8954. doi: 10.1073/pnas.151063098. [DOI] [PMC free article] [PubMed] [Google Scholar]
- Tsai DH, Pease LF, III, Zangmeister RA, Tarlov MJ, Zachariah MR. Aggregation kinetics of colloidal particles measured by gas-phase differential mobility analysis. Langmuir. 2008;25(1):140–146. doi: 10.1021/la703164j. [DOI] [PubMed] [Google Scholar]
- Tycko R, Wickner RB. Molecular structures of amyloid and prion fibrils: consensus versus controversy. Acc Chem Res. 2013;46(7):1487–1496. doi: 10.1021/ar300282r. [DOI] [PMC free article] [PubMed] [Google Scholar]
- Usov I, Mezzenga R. FiberApp: an open-source software for tracking and analyzing polymers, filaments, biomacromolecules, and fibrous objects. Macromolecules. 2015;48(5):1269–1280. doi: 10.1021/ma502264c. [DOI] [Google Scholar]
- Vetri V, Canale C, Relini A, Librizzi F, Militello V, Gliozzi A, Leone M. Amyloid fibrils formation and amorphous aggregation in concanavalin A. Biophys Chem. 2007;125(1):184–190. doi: 10.1016/j.bpc.2006.07.012. [DOI] [PubMed] [Google Scholar]
- von Smoluchowski M. Versuch einer mathematischen Theorie der Koagulationskinetik kolloider Lösungen. Z Phys Chem. 1917;92:129. [Google Scholar]
- Weber SC, Brangwynne CP. Getting RNA and protein in phase. Cell. 2012;149(6):1188–1191. doi: 10.1016/j.cell.2012.05.022. [DOI] [PubMed] [Google Scholar]
- Wickner RB, Shewmaker FP, Bateman DA, Edskes HK, Gorkovskiy A, Dayani Y, Bezsonov EE. Yeast prions: structure, biology, and prion-handling systems. Microbiol Mol Biol Rev. 2015;79(1):1–17. doi: 10.1128/MMBR.00041-14. [DOI] [PMC free article] [PubMed] [Google Scholar]
- Wu C, Shea JE. Coarse-grained models for protein aggregation. Curr Opin Struct Biol. 2011;21(2):209–220. doi: 10.1016/j.sbi.2011.02.002. [DOI] [PubMed] [Google Scholar]
- Xue WF, Homans SW, Radford SE. Systematic analysis of nucleation-dependent polymerization reveals new insights into the mechanism of amyloid self-assembly. Proc Natl Acad Sci. 2008;105(26):8926–8931. doi: 10.1073/pnas.0711664105. [DOI] [PMC free article] [PubMed] [Google Scholar]
- Zhao R, So M, Maat H, Ray NJ, Arisaka F, Goto Y, Carver JA, Hall D. Measurement of amyloid formation by turbidity assay—seeing through the cloud. Biophys Rev. 2016;8(4):445–471. doi: 10.1007/s12551-016-0233-7. [DOI] [PMC free article] [PubMed] [Google Scholar]
- Zhu M, Souillac PO, Ionescu-Zanetti C, Carter SA, Fink AL (2002) Surface-catalyzed amyloid fibril formation. J Biol Chem 277(52):50914–50922 [DOI] [PubMed]


