

Abstract
During development, multipotent retinal progenitor cells generate a large number of unique cell types. Recent evidence suggests that there are fate-restricted progenitor cell states in addition to multipotent ones. Here we report a transcriptomic analysis of fate-restricted progenitor cells biased to produce cone photoreceptors and horizontal cells, marked by the THRB cis-regulatory element ThrbCRM1. Comparison to a control population enriched in multipotent progenitor cells identified several genes considered to be pan-progenitor, such as VSX2, LHX2, and PAX6, as downregulated in these fate-restricted retinal progenitor cells. This differential regulation occurs in chick and in a different restricted progenitor population in mouse suggesting that this is a conserved feature of progenitor dynamics during retinal development. S-phase labeling also revealed that nuclear positions of restricted progenitor populations occupy distinct spatial niches within the developing chick retina. Using a conserved regulatory element proximal to the VSX2 gene, a potential negative feedback mechanism from specific transcription factors enriched in cone/horizontal cell progenitor cells was identified. This study identifies conserved molecular and cellular changes that occur during the generation of fate restricted retinal progenitor cells from multipotent retinal progenitor cells.
Keywords: Transcriptome, restricted progenitor, cone photoreceptor
INTRODUCTION
Seven major classes of retinal cells emerge from a pool of common retinal progenitor cells (RPCs) during development: cone and rod photoreceptors (PRs), horizontal cells (HCs), bipolar cells (BCs), amacrine cells (ACs), retinal ganglion cells (RGCs) and Muller glia (MG). Approximately 100 different morphological and physiological types of these principal cell classes (Kolb et al., 2001; Zeng and Sanes, 2017) are produced in distinct temporal windows during retinal development and organized into a well-defined, phylogenetically-conserved structure. However, the mechanisms responsible for the generation of this cell diversity are not fully understood. Several studies have described the multipotency of retinal progenitor cells (RPCs) through viral clonal composition experiments (Holt et al., 1988; Turner et al., 1990; Wetts and Fraser, 1988), where randomly labeled clones varied greatly in size and produced all possible retinal cell types, suggesting that all retinal cells derive from a pool of RPCs. Models to explain RPC fate commitment have invoked both deterministic as well as probabilistic mechanisms (Cepko et al., 1996; Chen et al., 2012; He et al., 2012).
The use of specific genetically-encoded reporters has allowed the identification of several types of RPCs that have restricted competence to form specific cell types (Brzezinski et al., 2011; Brzezinski IV et al., 2012; De la Huerta et al., 2012; Gao et al., 2014; Hafler et al., 2012; Rompani and Cepko, 2008). There is evidence that in these cell populations, daughter cells are biased to acquire certain cell fates at ratios that differ from those predicted by the number of cells in the adult or in random clonal compositions. For example, both bHLH transcription factor genes ATOH7 and ASCL1 have been reported to be expressed in restricted RPC populations (Brzezinski et al., 2011; Brzezinski IV et al., 2012; Mu et al., 2005). The ATOH7 lineage is enriched for early-born cell types including RGCs, while the ASCL1 lineage rarely produces RGCs. Another study identified a subpopulation of RPCs that express a member of the cadherin family, CDH6. These RPCs generate all major retinal classes but, when producing a daughter RGC, are biased to produce RGCs that respond selectively to vertical motion (De la Huerta et al., 2012). These studies, however, are dependent on Cre recombination, which can occur post-mitotically and therefore lead to labeling of cells that are not actually derived from the specific RPC cell population.
Another notable example of RPCs with restricted competence is a class of RPCs expressing oligodendrocyte transcription factor 2 (OLIG2). To circumvent the limitations of Cre, this study employed a knock-in allele that expresses the receptor for an avian virus tumor virus A (TVA) under the OLIG2 promoter. This type of virus allows infection only in mitotic cells expressing TVA, thereby limiting the readout to the progeny of the OLIG2 RPCs. The progeny of these RPCs is typically comprised of one or two cells, indicating a terminal division or one additional preceding cell division. In addition, these RPCs are biased towards specific cell fates at different developmental time points (Hafler et al., 2012). OLIG2 RPCs infected during early embryonic stages, produce predominantly cone PRs and HCs (Hafler et al., 2012). Recently, restricted RPC populations that preferentially generate cones and HCs have also been observed in other animal models. Using a reporter of the early cone-associated THRB gene (Ng et al., 2001, 2009), a lineage of RPCs was found to be biased to produce cones and HCs in zebrafish (Suzuki et al., 2013). A similar study reported a population of RPCs in the chick marked by a more discrete cis-regulatory element of the THRB gene, ThrbCRM1 (Emerson at el., 2013). Viral tracing studies have shown that these RPCs also preferentially produce cones and HCs, establishing this cis-regulatory activity as one of the earliest developmental events currently known in a lineage that specifically produces cone PRs in vertebrates.
While these studies provide a foothold for understanding cell fate determination in the retina at the population level, many questions relating to restricted RPCs remain. Namely, it is unknown what makes a restricted RPC molecularly distinct from a multipotent RPC and how do these RPCs become restricted to specific fates. This study addresses these questions through differential transcriptome analysis between cells labeled by the ThrbCRM1 reporter and other concurrent retinal populations, predominantly multipotent progenitors. Thus, here is reported the first trancriptomic analysis of a cell population in the retina enriched in a restricted RPC type biased towards the PR and HC fate. This study reveals that canonical RPC genes are differentially expressed in the two RPC populations. VSX2 expression is dramatically reduced in the ThrbCRM1 population as compared to its control, while LHX2 and PAX6 are expressed in spatially segregated subsets of these RPCs, indicating differences in the downregulation dynamics for these transcription factors. Using a regulatory element proximal to VSX2, we observed two distinct populations defined at a transcriptional level: multipotent, VSX2-expressing RPCs, and the ThrbCRM1 restricted RPCs. These data indicate that specific changes in transcriptional and cellular position occur during the formation of restricted RPCs such as those that generate cone photoreceptors and horizontal cells.
RESULTS
Transcriptome analysis of the ThrbCRM1-positive population
As shown previously, ThrbCRM1(+) RPCs preferentially give rise to cones and HCs and have limited mitotic potential compared to other RPCs (Emerson at el., 2013, Fig. 1 A). To investigate the molecular differences between these restricted RPCs and multipotent RPCs, we sought to compare their transcriptomes. Retinas from embryonic day 5 (E5) chick embryos were electroporated with both ThrbCRM1-GFP and UbiqC-TdTomato plasmids. TdTomato is broadly expressed under the UbiqC promoter and serves to mark the ThrbCRM1-negative electroporated cells (Fig. 1 B), which would include multipotent RPCs (Matsuda and Cepko, 2004). Transcriptomes from ThrbCRM1-GFP and UbiqC-TdTomato expressing cells were obtained after retinas were incubated 1 day ex-vivo and sorted by florescence-activated cell sorting (FACS) (Fig. 1 C). A representative illustration of the collection windows used during cell sorting is presented in Fig. 1 D. For simplicity, the two populations will be referred as ThrbCRM1 and UbiqC herein.
Figure 1 – Experimental design for ThrbCRM1 population collection and RNAseq analysis.

(A) Schematic of ThrbCRM1 activity in a restricted RPC that is biased to produce cones and HCs.
(B) Cross-section of a chick retina electroporated at E5 with ThrbCRM1-GFP and UbiqC-TdTomato and cultured for 24 hours.
(C) Workflow for collection of ThrbCRM1 and UbiqC-populations.
(D) Representative FACS plot with windows used for cell collection.
(E) Fold change and statistical significance between each transcript in the ThrbCRM1and UbiqC populations. Shown are genes involved in retinal cell fate specification.
(F) Average TPM of cell cycle genes and known retinal progenitor genes between ThrbCRM1 and UbiqC populations.
Abundance of transcripts was quantified in collected populations against Galgal5 RNA sequences using kallisto (Bray et al., 2016) and differential expression analysis was performed between the ThrbCRM1 and UbiqC group with sleuth (Pimentel et al., 2017) (Suppl. File 1). As expected, expression of THRB was enriched in the ThrbCRM1 population (Fig. 1 E) as well as the OTX2 and OC1 transcription factors, shown to occupy the ThrbCRM1 element in vivo (Emerson et al., 2013). This suggests that the ThrbCRM1 population contains the majority of Otx2 and OC1 expressing cells that are present at this developmental time, and able to be targeted by electroporation. The abundance of EGFP transcripts confirmed proper enrichment of this population. In contrast, the TdTomato target sequence was not significantly enriched in either of the two populations.
Previous viral lineage tracing experiments have suggested that ThrbCRM1 cells are biased to produce PRs and HCs. Consistent with this, enrichment of PR-specific transcripts, such as OTX5 (homologous to mouse CRX) and RCVRN (also known as Visinin), and of known HC-enriched transcripts including PTF1A, TFAP2A, and LHX1 (Fig. 1 E) were observed in the ThrbCRM1 population.
Because the ThrbCRM1 element drives reporter expression in the mouse retina during the window of cone birth at E13.5 but not at postnatal day 0, when rods are produced (Emerson et al., 2013), it’s likely that photoreceptors arising from this population are a type of cone PR. Accordingly, cone-enriched transcripts such as GNGT2 and RXRG are highly enriched in the ThrbCRM1 population (Enright et al., 2015; Roberts et al., 2005; Rodgers et al., 2016). In contrast, MAFA, a rod-specific transcript that is functionally homologous to mouse NRL (Kim et al., 2016; Ochi et al., 2004), was not significantly expressed in either population (Fig. 1 E).
To validate known and novel transcripts, a subset identified as differentially expressed between the two RPC populations were examined by RNA in situ hybridization (ISH) at E6 in the central retina. For most of the tested genes upregulated in the ThrbCRM1 population, the ISH signal was present either at the scleral or vitreal side of the retina. Signal intensity largely corresponded with the estimated number of transcripts in the RNAseq analysis (Fig. 2). Expression of RBP4 and GNGT2, known photoreceptor and cone-specific genes respectively, was restricted to the scleral part of the retina where developing PRs are located (Fig. 2 A-B), while THRB and NEUROD1 had a similar pattern but with additional scattered expression in the neuroblast layer (NBL) (Fig. 2 C-D). THRB is known to be present in a subset of RPCs (Trimarchi et al., 2008a) so it is therefore likely that this pattern is indicative of the RPC stage of ThrbCRM1 cells. A prominent layer of ThrbCRM1-GFP (+) cells is found near the vitreal surface of the embryo (see Fig. 1 B and Emerson et al. 2013), which is not observed with the Thrb RNA in situ hybridization. This discrepancy is likely due to the persistence of the GFP reporter in HC cells derived from the ThrbCRM1 population.
Figure 2 – mRNA expression of differentially expressed transcripts.

Patterns observed by hybridizing RNA probes (denoted on panel) on E6 chick retinas. A bar graph of the TPM values for the same gene in each of the samples is shown below. (A- D) Genes with PR and/or subset of progenitor pattern, (E-H) gene with HCs pattern and (I-L) genes highly expressed in UbiqC population. PR: Presumptive photoreceptor layer; NBL: Neuroblast layer; HCs: Horizontal Cells; RGCs: Retinal Ganglion Cells. Scale bar is 50 µm.
LHX1 and TFAP2A, two genes associated with HC genesis, had restricted expression in the vitreal retina (Fig. 2 E-F), whereas other HC-related genes such as FGF19 and TFAP2C also had expression in the NBL (Fig. 2 G-H). This suggests expression during mitotic stages or while the HCs are migrating postmitotically (Edqvist and Hallböök, 2004). GJA1 and CERS, genes enriched in the UbiqC population, exhibit ISH patterns spanning the whole retina, with decreasing expression outside of the NBL (Fig. 2 I-J), whereas CYP1B1 and NR2E1, also enriched in the UbiqC population, are present in a gradient of decreasing expression towards the apical part of the NBL (Fig. 2 K-L).
Taken together, confirmation of transcript enrichment and RNA presence in situ support that this dataset is enriched for ThrbCRM1 progenitor genes and the molecular profile is in accordance with the previously observed restriction to PR and HC fates of these progenitor cell types.
A subset of retinal progenitor genes is downregulated in the transcriptome of the ThrbCRM1 population
The ThrbCRM1 and UbiqC populations are expected to be predominantly composed of RPCs, because electroporation targets dividing RPCs and the short (20hrs) culture time post-electroporation in this experiment. In addition, the ThrbCRM1 element has been shown be active in a class of restricted RPCs (Emerson et al., 2013). To further test the idea that the UbiqC and ThrbCRM1 populations are comprised of comparable percentages of RPCs, expression levels of cell cycle genes were compared between the two populations. The majority of cell cycle genes examined (Liberzon et al., 2011), were not significantly differentially expressed between the two populations (Fig. 1 F) indicating that ThrbCRM1 and UbiqC populations contain similar percentages of RPCs. To further assess the percentages of RPCs in each population, a combination of 5-ethynyl-2’-deoxyuridine (EdU) labeling and 4’,6-Diamidine-2’-phenylindole (DAPI) was used to determine the percentage of ThrbCRM1 and UbiqC populations in the G0/G1, S-phase, and G2/M phases of the cell cycle (Supp. Fig. 1). Retinas were electroporated with ThrbCRM1-EGFP and UbiqC-TdTomato plasmids, cultured for 1 day and exposed to EdU for 1 hour. These retinas were then dissociated into single cells, which were fixed, labeled by DAPI and EdU detection performed, and then analyzed by flow cytometry. The ThrbCRM1-EGFP, UbiqC only population, and the not electroporated populations were analyzed with respect to their S-phase status using EdU labeling and DNA content using DAPI (Supp. Fig. 1 A). Cell populations with respect to the cell cycle were similar between all thee populations (Supp. Fig. 1 B). A statistically significant difference was only identified between the ThrbCRM1 and not electroporated populations with the percentage of cells in G2/M slightly higher in the ThrbCRM1 population. From this analysis, we conclude that the ThrbCRM1 and UbiqC populations contain similar percentages of RPCs across the major subdivisions of the cell cycle.
During early retinal development, the large majority of RPCs are multipotent and it is likely that a ubiquitous promoter will predominantly mark such RPCs. To assess the types of RPCs targeted in the UbiqC and ThrbCRM1 populations, canonical RPC genes were examined. VSX2 (Burmeister et al., 1996; Ferda Percin et al., 2000; Zou and Levine, 2012), LHX2 (Gordon et al., 2013; Roy et al., 2013), PAX6 (Marquardt et al., 2001), RAX (Furukawa et al., 1997, 2000), SOX2 (Taranova et al., 2006), SOX9 (Poché et al., 2008), and NR2E1 (Miyawaki et al., 2004) are necessary for retinal development and have been characterized as markers for RPCs at embryonic stages. Strikingly, some of these genes that are considered pan-RPC were significantly downregulated in the ThrbCRM1 population: VSX2 (2.11 b [fold change], <0.001 q), RAX (2.26 b, <0.001 q), and NR2E1 (2.8 b, <0.001 q). Other pan-RPC genes were also significantly downregulated but less differentially expressed, such as SOX2 (0.73 b, <0.001 q), SOX9 (1.22 b, <0.001 q) and LHX2 (0.45 b, <0.001 q), or in the case of PAX6 (0.26 b, >0.05 q), not significantly different at all (Fig. 1 E).
To further validate differential pan-RPC gene expression in RPCs within the ThrbCRM1 population, a short (1 hour) pulse of EdU was used along with 3 pan-RPC markers: VSX2, LHX2 and PAX6. In accordance with the transcriptome analysis, most ThrbCRM1 cells do not express VSX2 (Suppl. Fig. 2 A-C) and only a subpopulation express LHX2 or PAX6 (Suppl. Fig. 2 E-G, I-K). This data suggests that the UbiqC and ThrbCRM1 populations are composed of similar percentages of restricted and multipotent RPCs, respectively, and that pan-RPC genes are differentially expressed between these two populations.
The majority of OC1 and OTX2 expressing progenitor cells do not express VSX2 and are spatially segregated from VSX2(+) progenitors
To characterize further this differential regulation of canonical RPC genes and to ensure that differential regulation was not an artifact of prolonged culture or electroporation, retinas were harvested from E5 and E6 embryos and exposed to EdU for 1 h, to positively identify RPCs. ThrbCRM1 is activated by OTX2 and OC1, and these markers, in combination with EdU, were used to identify ThrbCRM1 RPCs. These populations likely include RPC types that only express one of the transcription factors, but should still provide insight into non-canonical RPCs. The presence of VSX2, LHX2, or PAX6 was assayed in addition to EdU and OTX2 or OC1.
At both E5 and E6 timepoints, most EdU(+) cells were VSX2(+) and were located in the neuroblast layer (NBL). In contrast, OTX2(+)/EdU(+) RPCs were found throughout the retina, and the vast majority of these RPCs did not express VSX2 (Fig. 3 A-B). OC1(+)/EdU(+) RPCs were enriched in the scleral and vitreal portions of the retina, especially at E6, and the majority of these cells also lacked VSX2 (Fig. 3 D-E). A fraction of EdU(+) cells were negative for OC1, OTX2 and VSX2 (Fig. 3 G).
Figure 3 – OTX2 and OC1 progenitors do not express VSX2 and are spatially segregated from VSX2 progenitors.

Single Z-plane images of each channel as denoted. Retinas were exposed to EdU for 1 hr and subsequently fixed.
(A-B) Retina cross- sections imaged for OTX2, VSX2 and EdU at age E5(A) or E6 (B). Edu+ cells positive for OTX2 or VSX2 are enlarged in insets, shown in all channels imaged.
(C) Scatter plot of the location in the apical-basal axis of the retina of EdU(+) cells positive for OTX2 and/or VSX2.
(D-E) Retina cross-sections imaged for OC1, VSX2, and EdU at age E5 (D) or E6 (E). Edu+ cells positive for OC1 or VSX2 are enlarged in insets, shown in all channels imaged.
(F) Scatter plot of the location in the apical-basal axis of the retina of EdU(+) cells positive for OC1 and/or VSX2.
(G) Stacked bar chart of percentages of EdU(+) cells labeled by combinations OTX2 and VSX2 or OC1 and VSX2. Error bars denote SEM. Scale bar represents 50um for (A),(B), (D), and (E). PR: Presumptive photoreceptor layer; NBL: Neuroblast layer; HCs: Horizontal Cells; RGCs: Retinal Ganglion Cells.
To visualize the spatial locations of RPC populations, a scatter plot of the distribution of these cells along the scleral-vitreal axis was generated (Fig. 3 C, F). The quantitative results are reported in Fig. 3 G and Suppl. Table 1. The location of EdU(+) cells differed between those RPCs that expressed OC1 or OTX2 and those that expressed only VSX2. At E5 and E6, all VSX2(+) RPCs cluster in the NBL in the lower middle portion of the retina along the scleral-vitreal axis. In contrast, OC1 and OTX2 RPCs extend throughout the retina and, unlike VSX2(+) RPCS, appear to form a unique population that is found near the scleral side (Fig. 3 C ,F).
At E6, a new and distinct population of OC1(+) RPCs emerges (some are observed at E5) in the vitreal 20% of the retina (Fig. E, F). HC RPCs have been reported to cell cycle arrest in G2, migrate to the vitreal side of the retina and undergo mitosis (Boije et al., 2009; Edqvist and Hallböök, 2004). It is likely that these are those same RPCs, although, given that these cells are marked by EdU, it appears that some of these RPCs are undergoing S-phase during the vitreal migration, or after their arrival. In support of this, the HC marker LHX1 is expressed in many of these OC1(+)/EdU(+) cells, both in the NBL and close to the vitreal part of the retina (Suppl. Fig. 3A) (Edqvist and Hallböök, 2004; Liu et al., 2000). This assay confirms that EdU- labeled RPC populations that express OTX2 and OC1 have differential expression of the VSX2 protein and the nuclei of these RPCs undergoing S-phase are localized in patterns that are distinct from those of VSX2 RPCs.
Retinal progenitor cells that express OTX2 or OC1 and LHX2 are spatially segregated from those that do not express LHX2
As anticipated from the known role of LHX2 in multipotent RPCs, LHX2 expression was observed in most of the RPCs at a similar proportion and location in the NBL as VSX2 (Fig. 4 A-F). As with VSX2, a population of spatially-segregated RPCs was positive for OC1 or OTX2 and negative for LHX2, although these accounted for a smaller fraction of all EdU(+) cells than was observed with VSX2 (Fig. 4 G).
Figure 4 – A population of OTX2 and OC1 progenitors do not express LHX2 and are spatially segregated from progenitors that express only LHX2.

Single Z-plane images of each channel as denoted. Retinas were exposed to EdU for 1 hr and subsequently fixed.
(A-B) Retina cross- sections imaged for OTX2, LHX2 and EdU at age E5(A) or E6 (B). Edu+ cells positive for OTX2 or LHX2 are enlarged in insets, shown in all channels imaged.
(C) Scatter plot of the location in the apical-basal axis of the retina of EdU(+) cells positive for OTX2 and/or LHX2.
(D-E) Retina cross-sections imaged for OC1, LHX2, and EdU at age E5 (D) or E6 (E). Edu+ cells positive for OC1 or LHX2 are enlarged in insets, shown in all channels imaged.
(F) Scatter plot of the location in the apical-basal axis of the retina of EdU(+) cells positive for OC1 and/or LHX2.
(G) Stacked bar chart of percentages of EdU(+) cells labeled by combinations OTX2 and LHX2 or OC1 and LHX2. Error bars denote SEM. Scale bar represents 50um for (A),(B), (D), and (E). PR: Presumptive photoreceptor layer; NBL: Neuroblast layer; HCs: Horizontal Cells; RGCs: Retinal Ganglion Cells.
The transcriptome analysis indicated that LHX2 is significantly, but not very highly, enriched in the UbiqC population. Therefore, in contrast to VSX2, a subpopulation of OC1 or OTX2 RPCs were also expected to be immunoreactive for LHX2. Indeed, OTX2 RPCs that are LHX2(+) represent 9.4% at E5 and 13.9% at E6 of the total number of RPCs and are found in a distinct spatial position from those RPCs that only express OTX2. OTX2-only RPCs are found clustered in the scleral portion of the retina, while OTX2 RPCs that also express LHX2 are found in a spatial location that overlaps that of the whole LHX2 population. OC1 RPCs that are LHX2(+) are 3.2% of all RPCs at E5 but reduced to 0% at E6. Like OTX2, there is a distinct population of RPCs located in the scleral portion of the retina that expresses OC1, but not LHX2. However, there is an additional population of OC1-only RPCs that is found in the vitreal retina. The location of LHX2 RPCs that expressed OC1 or OTX2 was still restricted to the NBL (Fig. 4 C, F). This analysis confirms that LHX2 is also differentially regulated in restricted and multipotent progenitors but in a distinct pattern from that of VSX2. Thus, there be separable genetic mechanisms that are controlling the gene expression timing of these RPC genes.
The majority of OC1 and OTX2 expressing progenitor cells do not express PAX6 and are spatially segregated to the scleral side
PAX6, like LHX2 and VSX2, is known to be expressed and required in multipotent RPCs. However, the levels of PAX6 were not found to be significantly different between the transcriptomes of the two populations. To determine if PAX6 was down-regulated in restricted RPCs, EdU-labeled populations in the E5 and E6 retinas were examined for expression of PAX6, OTX2, and OC1 (Fig 5). Unexpectedly, in a similar pattern to LHX2, RPCs that express PAX6 were predominantly scattered through the NBL, while RPCs that express OTX2 and OC1 but not PAX6 were spatially-segregated to the scleral part of the retina (Fig 5 C, F).
Figure 5 -. A population of OTX2 and OC1 progenitors do not express PAX6 and are spatially segregated from progenitors that express only PAX6.

Single Z-plane images of each channel as denoted. Retinas were exposed to EdU for 1 hr and subsequently fixed.
(A-B) Retina cross-sections imaged for OTX2, PAX6 and EdU at age E5(A) or E6 (B) with 1hr EdU pulse. Edu+ cells positive for OTX2 or PAX6 are enlarged in insets, shown in all channels imaged.
(C) Scatter plot of the location in the apical-basal axis of the retina of EdU(+) cells positive for OTX2 and/or PAX6.
(D-E) Retina cross-sections imaged for OC1, PAX6, and EdU at age E5 (D) or E6 (E). Edu+ cells positive for OC1 or PAX6 are enlarged in insets, shown in all channels imaged.
(F) Scatter plot of the location in the apical-basal axis of the retina of EdU(+) cells positive for OC1 and/or PAX6.
(G) Stacked bar chart of percentages of EdU(+) cells labeled by combinations OTX2 and PAX6 or OC1 and PAX6. Error bars denote SEM. Scale bar represents 50um for (A),(B), (D), and (E). PR: Presumptive photoreceptor layer; NBL: Neuroblast layer; HCs: Horizontal Cells; RGCs: Retinal Ganglion Cells.
At E6, however, a population of OC1(+) RPCs that expressed PAX6 were found clustered at the vitreal side of the retina (Fig 5F). These cells were not identified as VSX2 or LHX2 in the previous immunostained retinas (Fig 3F and 4F), and instead a OC1(+), EdU(+) population that specifically lacks these markers was observed under these conditions. PAX6 expression is qualitatively stronger in the vitreal cluster of cells than in PAX6-only RPCs (Suppl. Fig. 3 B). This increase in protein amount detected by immunohistochemistry could reflect a higher number of transcripts in a subpopulation of the ThrbCRM1 RPCs (mainly those at the vitreal side of the retina that are likely HCs), potentially explaining the absence of significant differential expression compared to the UbiqC population. These data indicate that like VSX2 and LHX2, PAX6 is spatially downregulated in restricted RPCs, notably those present at the scleral side of the retina.
OC1 and OTX2 restricted progenitors differentially regulate VSX2, LHX2 and PAX6 proteins at E5 and E6
To more closely examine the differences between the expression of the three pan-RPC markers relative to OTX2 and OC1, the defined RPC populations were compared directly to one another and statistical significance was assessed (Suppl. Fig. 4). This analysis included a control for ex vivo culture conditions, which was a set of E5 retinas cultured overnight to E6 and analyzed in an identical fashion to in vivo wild-type (WT) retinas (Suppl. Fig. 5). This group will be referred to as ‘E5D1’.
As expected from the differential expression analysis, OTX2 RPCs that expressed VSX2, were a significantly smaller fraction at E5 and E5D1 (E6 was not statistically significant but showed a similar trend) compared to those that express LHX2 or PAX6, while there was a concomitant increase in the number of OTX2-only RPCs (Suppl. Fig. 4 A, B).
In the group stained with OTX2 and PAX6 almost all RPCs are accounted for, unlike when VSX2 and LHX2 are used where there is a small population of RPCs negative for all markers (Suppl. Fig. 4 C). This suggests that there are RPCs that express PAX6, but not OTX2, VSX2, or LHX2 and these are seen as positively marked by OC1 (Suppl. Fig. 4 E, Fig. 5F). Thus, there is an RPC population that is vitreally located and only expresses OC1 and PAX6 out of the genes that were tested.
A comparison between the profiles of the OTX2 and OC1 groups also revealed that there was a RPC population that is likely positive for OTX2 and not OC1 or any of the pan-RPC markers, because there was a large population of unmarked RPCs when stained for OC1, but not when stained for OTX2 (Suppl. Fig. 4 C, G). This suggests that there exist OTX2-only, OC1-only, and OTX2/OC1 double-positive RPC populations that all have differential regulation of the pan-RPC markers compared to the majority of the RPC populations that are present.
To assess the effects of ex vivo culture conditions, the E5D1 group was examined for the expression of the same set of genes. In the E5D1 group, most patterns remain the same (Suppl. Fig, 5 D, I). Distinct OTX2 or OC1 RPC populations that lack VSX2, LHX2, or PAX6 were present in the scleral-adjacent portion of the retina, just as in WT retinas. One notable difference is that the percentages of these RPC populations are increased under these culture conditions. In addition, there were fewer OTX2 RPCs that expressed LHX2 than in WT retinas while OTX2-only RPCs are increased concomitantly (Suppl. Fig. 5 E, J). These OTX2-only RPCs are not solely restricted to the scleral part of the retina as in the E6 WT retinas, but also extend into the NBL. These data indicate that culture conditions have small but identifiable effects in these progenitor populations.
To analyze the spatial distribution patterns between the OTX2 and OC1 single-positive RPCs relative to VSX2, LHX2 and PAX6 expression, cumulative distributions were generated (Suppl Fig. 6 A-D). OTX2 single-positive RPCs have significantly different distributions depending on the pan-RPC marker used. OTX2(+)/VSX2(−) RPCs are spread across the retina, while OTX2(+)/PAX6(−) RPCs are more commonly found towards the scleral side and OTX2(+)/LHX2(−) RPCs almost completely segregated to the upper 20% of the retina (Suppl Fig. 6 A-B, E).
The distributions of OC1 RPCs at E5 between OC1(+)/VSX2(−) and OC1(+)/LHX2(−) or OC1(+)/PAX6(−) are also significantly different (Suppl Fig. 6 C). However, at E6 the distributions become bimodal in the VSX2 and LHX2 group due to the presence of OC1 vitreal RPCs. Distribution of OC1-only RPCs in the PAX6 group is still restricted to the scleral part of the retina since all vitreal RPCs that express OC1 also express PAX6 (Suppl Fig. 6 D). Given the known nuclear migration of RPCs in the scleral direction from S-phase to mitosis, these data support the interpretation that the OTX2 and OC1 RPC populations downregulate VSX2 expression prior to that of LHX2 and PAX6.
Restricted progenitors in the mouse differentially regulate VSX2 and LHX2 in the mouse retina at P0
We explored whether the downregulation of VSX2 and LHX2 observed in the chick retina was applicable to mouse development by using similar immunofluorescence assays, exposing the retinal tissue to EdU for 2 hours. We first investigated the embryonic mouse retina at a comparable developmental timepoint to the chick when cones and HCs are being formed and when OC1 and OTX2 expression has been observed in RPCs. At E13.5, as expected, the majority of RPCs were VSX2 or LHX2 positive. However, in contrast to the chick retina, more OTX2 and OC1 RPCs expressed VSX2 and only a small fraction was negative for VSX2. (Suppl. Fig. 7). Interestingly, we did not detect OTX2 or OC1 RPCs that were negative for LHX2. OTX2 and OC1-only RPCs are, consequently, a very small fraction of the total RPC pool at E13.5.
To assess whether a different restricted RPC type had similar differential regulation of progenitor markers, we next examined postnatal OLIG2(+) RPCs (Hafler et al., 2012). EdU labeling was performed on P0 retinas and expression of OLIG2 relative to VSX2 and LHX2 expression was assessed. At P0, the majority of RPCs were marked by the multipotent RPC markers VSX2 and LHX2. We observed a similar pattern to the chick retina when examining the expression of VSX2 and LHX2 relative to OLIG2(+) RPCs. 6.4% of RPCs express OLIG2 and VSX2, while 14.4% express OLIG2 and LHX2; 7.6% of OLIG2(+) RPCs are negative for VSX2 while only a negligible fraction (0.7%) are negative for LHX2, suggesting that OLIG2(+) RPCs negative for VSX2 are expressing LHX2 (Suppl. Fig. 7 M-P). This data suggests that at P0, VSX2 is downregulated either temporally before LHX2 or in a subpopulation of OLIG2(+) RPCs in the mouse retina. This similar gene regulation to what is observed in a different type of restricted RPC present in the chicken retina suggests that this may be an important feature of at least some restricted RPC types.
Expression of Visinin and LHX1 in OTX2 and OC1 progenitors
Given that evidence has emerged for the existence of RPC states that generate homotypic daughter cell pairs, including PRs and HCs, we explored whether some of the OTX2 and OC1 labeled RPCs could also show evidence of PR or HC gene expression indicating their final fate (Rompani and Cepko, 2008; Suzuki et al., 2013; Wong and Rapaport, 2009). To label the RPCs that are fated to become PRs, we used Visinin, an early and specific marker of PRs in the chick retina, at E6. Some OTX2(+) cells observed to be undergoing M-phase, detected by Phospho-Histone3 (PH3) immunoreactivity, also expressed Visinin (Suppl. Fig. 3 C). These Visinin(+) cells, at least in part, are presumably ThrbCRM1(+) cells since they express OC1 as well as OTX2 (Suppl. Fig. 3 D) and Visinin is highly enriched in the ThrbCRM1 transcriptome. This is in agreement with previous reports of OC1 being present in Visinin(+) cells in the chick and in postmitotic PRs in the mouse (Emerson el al., 2013, Muranishi et al., 2010).
As noted before, we also observed OC1 populations of cells at the vitreal side of the retina (and in some cells of the NBL) that express LHX1 (Suppl. Fig. 3 A). LHX1 is also highly enriched in the ThrbCRM1 transcriptome. This indicates that it is possible that OC1 and OTX2 progenitors, most of which are likely to be ThrbCRM1(+) cells, have the potential to upregulate some PR or HC genes and possibly divide one more time into their terminal fates.
ThrbCRM1 restricted progenitors and VSX2 multipotent progenitor populations are defined at a transcriptional level
To explore the molecular nature of the division between multipotent and restricted RPCs, we searched for an enhancer element that would be active only in cells positive for VSX2, because that population should have minimal overlap with restricted OTX2 and OC1 progenitors. Six evolutionarily conserved regions (ECRs) around the VSX2 locus were tested for their ability to drive reporter expression. We identified an active element 5’ of the protein coding region (Fig. 6 A). VSX2ECR4 drives reporter expression in EdU (+) cells with distinctive RPC morphology in the NBL after electroporation at E5 and 24h culture (Fig. 6 D). We verified that this element is active in VSX2(+) cells and, after 8h of culture, strong reporter expression is detected in the NBL of chick retinas. VSX2 can be found in 91.6% of VSX2ECR4(+) cells (Fig. 6 B-C). VSX2ECR4 is also active at P0 in the mouse retina in VSX2(+) cells (Suppl. Fig. 8 A). Taken together, this data indicates that VSX2ECR4 is reliably active, in the chicken and mouse retina, in a population of cells enriched for multipotent progenitors and positive for VSX2.
Figure 6 – VSX2ECR4 is a regulatory element proximal to VSX2 and is active in a multipotent progenitor population separate from the ThrbCRM1(+) population.

(A) Location of ECR4 near the VSX2 locus on hg38 genome, on the UCSC genomic browser.
(B) E5 chick retina electroporated with VSX2ECR4-GFP and CAG-βgal and cultured for 8h. Maximum projection Z-plane images of each channel as denoted.
(C) Percentage of cells at 8h positive for VSX2ECR4-GFP and VSX2 protein of all VSX2ECR4(+) cells. N=3.
(D) E5 chick retina electroporated with VSX2ECR4-GFP and ThrbCRM1-AU1, cultured for 24h. Maximum projection Z-plane images of each channel as denoted.
(E) FACS plot of retinal cells after E5 electroporation with VSX2ECR4-GFP and ThrbCRM1-Tdt and 24 h culture.
(F) Quantification of VSX2ECR4 and ThrbCRM1 overlap. Electroporated plasmids are shown along the X-axis. N=4 and experiment was replicated 3 times, one replicate displayed.
(G) Quantification of FACS analyzed E5 retinas electroporated. and cultured 24h. Constructs used were CAG-iRFP, VSX2ECR4-GFP and ThrbCRM1-Tdt, with and without CAG-OTX2 and CAG-OC1. Reporters used for Y-axis calculations are shown along the X-axis. Statistical significance determined by t-test (***: p < 0.001, two-tailed t test), n=4, experiment replicated additional 2 times.
The previous observation that VSX2 protein is downregulated in OTX2 and OC1 RPCs at both the mRNA and protein levels supports the hypothesis that this is due to a cessation of VSX2 gene transcription in these cells. To determine if the VSX2ECR4 element recapitulates the differential expression in these RPC populations, we co-electroporated a VSX2ECR4-GFP construct and a ThrbCRM1-AU1 construct. Immunofluorescence examination revealed that on a qualitative level these reporter constructs were largely active in two distinct RPC populations, though a small number of co-expressing cells were observed (Fig. 6 D). To quantitate this effect, a flow cytometry assay was used. This assay confirmed that fluorescent reporters (EGFP and TdTomato) driven by ThrbCRM1 and VSX2ECR4 are largely found in two distinct populations and, after 24h of culture, only 3% of electroporated cells were found to be double-positive for the two reporters (Fig. 6 E). The percentage of double-positive cells is similar when the fluorescent reporters were switched between these cis-regulatory elements (Fig. 6 F). Thus, VSX2ECR4 and ThrbCRM1 are targeting separate populations, corresponding to multipotent and restricted progenitors.
OC1 and OTX2 are responsible for driving at least some of the molecular characteristics of the ThrbCRM1 population and misexpression of these transcription factors can induce changes in cell fate (Emerson et al., 2013; Nishida et al., 2003). We investigated whether these transcription factors can also function to drive the transition from multipotent to restricted RPCs. Previous results have shown that in multiple contexts, OC1 and OTX2 are both necessary and sufficient to drive the activation of ThrbCRM1. To determine whether OC1 and OTX2 also influence the activation of the VSX2ECR4 element, the effects of misexpression of these factors on the number of ThrbCRM1(+), VSX2ECR4(+), and ThrbCRM1(+)/VSX2ECR4(+) cells was assessed. The number of ThrbCRM1 cells significantly increased in number with the introduction of CAG-OC1 and CAG-OTX2 as did ThrbCRM1/VSX2ECR4 double-positive cells. Notably, there was a significant decrease of VSX2ECR4 cells in the electroporated population (Fig. 6 G). The increase in double-positive cells did not reflect the same proportion as the increase in ThrbCRM1 cells, likely indicating that the addition of these two transcription factors induced an exit from the multipotent state and that it can be detected by changes in transcriptional activation. To determine if the observed decrease in VSX2ECR4 activity was simply a result of cells being driven out of the cell cycle by misexpression of OTX2 and OC1, a cell cycle analysis using DAPI and EdU, was performed as in Supp. Fig. 1 (Supp. Fig. 9 A). It was observed that misexpression of OTX2 and OC1 does in fact lead to a highly significant decrease in both S-phase and G2/M cells in electroporated cells (Supp. Fig. 9). However, the total decrease in these populations (and comparable increase in the G0/G1 population) was approximately 5%, which would not be sufficient to explain the greater than 50% reduction in VSX2ECR4 activity that was observed. The decrease in VSX2ECR4 activity is unlikely to be through direct repression of VSX2ECR4 by OTX2 or OC1, since there are no predicted binding sites for either transcription factor in the sequence. Such decrease could also be due to a downregulation of an activator of VSX2ECR4.
Flow cytometry experiments were performed to identify VSX2ECR4 subfragments that had reporter activity, and identified a 220bp subfragment that contained critical elements for reporter activation (Suppl. Fig. 10 A,B). Mutation of a highly conserved sequence within this element completely eliminated reporter expression (Suppl. Fig. 10 C). This sequence is therefore likely to be important for recruiting a transcription factor that can activate transcription in these VSX2-positive cells, but the identify of this transcription factor(s) is not yet known. Overall, this data indicates that, during early retinal development in the chicken retina, multipotent and restriction progenitor populations can be detected and differentiated at a transcriptional level and that specific factors, like OTX2 and OC1, can affect the multipotent state.
DISCUSSION
While the adult retina possesses a remarkable organization recognized by early neuroanatomists, such order is notably lacking during development. The cell bodies of RPCs and postmitotic cells are often intermixed and differentially expressed genes are found in scattered cell populations. This has hindered the identification of the molecular and cellular events that allow a pool of multipotent RPCs to generate the diverse set of retinal cell types. Only recently have examples of restricted RPCs been characterized, though these studies have been mostly limited to determining competence and possible fates of these cells. A previous study has examined the transcriptome of ATOH7 (MATH5) positive cells in the mouse retina (Gao et al., 2014). This population would be expected to include RPCs that give rise primarily to early cell types including RGCs, HCs, and cones, but also to later born cell types. However, this study used a transgenic reporter to identify and purify these cells, and whether the collected population was enriched in RPCs instead of postmitotic cells was not determined. In the current study, the technique of electroporation of a specific cis-regulatory element has allowed the first transcriptome analysis of a cell population enriched in a restricted RPC type. Enrichment in ThrbCRM1 RPCs is likely due to the temporal dynamics of electroporation and the relatively short time between electroporation and cell harvest. This novel use of electroporation to target a transient population in a developmental context for transcriptome analysis will allow for more systematic analysis of transient cell states in the retina and perhaps in other systems.
The regulation of VSX2 in ThrbCRM1 RPCs is very much consistent with a previous study of zebrafish VSX2 (Vitorino et al., 2009). Using a BAC VSX2-GFP reporter, it was shown that GFP expression was present in many RPCs but decreased in genetically-marked restricted RPCs, such as ATH5(+) or VSX1(+) RPCs. The interpretation from this study was that VSX2 is expressed in multipotent RPCs and is actively repressing the activation of lineage-restricted RPCs. Other reports have also suggested variability in VSX2 regulation within RPCs (Pacal and Bremner, 2012; Trimarchi et al., 2008b). In the present study, we support these observations in other vertebrates and extend them to other RPC types. These include OTX2 and OC1 positive RPCs in chick and OLIG2 positive RPCs in mouse, supporting the idea that this is a widespread phenomenon in vertebrates. In addition, misexpression experiments with OTX2 and OC1 show repressive effects on the VSX2ECR4 reporter, which suggests VSX2 might ultimately be a target of repression by restricted progenitor genetic networks, instead of VSX2 repressing these networks as had been previously suggested (Vitorino et al., 2009).
Previous studies have also identified differences in the spatial locations of RPC populations defined primarily by the non-apical position of where these cells undergo mitosis (Boije et al., 2009; Godinho et al., 2007; Weber et al., 2014). These studies have identified RPC populations that homotypically divide to generate HCs, BPs, and PRs. However, ThrbCRM1-labeled RPCs appear to be occurring in a developmentally earlier RPC population than these RPC types, as they generate both HCs and PRs. ThrbCRM1 RPCs also undergo mitosis apically (data not shown), though the daughter cells of these RPCs are likely to include homotypically dividing HCs and possibly homotypically dividing PRs. A previous study in zebrafish has also identified differences in the interkinetic nuclear migration patterns such that RPCs whose nucleus migrates more basally are more likely to produce postmitotic neurons upon apical mitotic divisions (Baye and Link, 2007). In addition, a graded distribution of Notch signaling has been observed across the apical-basal axis of the zebrafish retina, which would lead to increased Notch signaling in apically localized cells, increasing their mitotic potential (Del Bene et al., 2008). However, ThrbCRM1 retinal progenitor cells have less mitotic potential than the more basally located multipotent retinal progenitor cells. This suggests that there could be fundamental species differences in Notch signaling or other signaling pathways that account for this difference. Further studies are required to determine whether restricted RPCs and multipotent RPCs differ in their nuclear migration behavior and the implications for their exposure to extracellular signaling molecules during this migration.
While these previous studies have described cellular differences in the behavior of different RPC types, the molecular differences in these cells is relatively unknown. The transcriptome analysis revealed that many transcription factors considered to have pan-RPC expression are in fact differentially downregulated in ThrbCRM1 cells, including NR2E1, RAX, SOX2, SOX9, LHX2, and PAX6. Like VSX2, characterization of PAX6 and LHX2 protein expression through immunohistochemistry revealed that these proteins are down-regulated in RPCs that express OTX2, OC1, and OLIG2. However, in these populations, PAX6 and LHX2 appear to be present in greater numbers of RPCs. Part of this appears to be because of the upregulation of PAX6 in HC cells within the ThrbCRM1 population. It is not yet defined whether this collection of genes is all under the control of one or multiple gene regulatory networks.
We propose a model for the transcriptional and cellular events that occur during the formation of ThrbCRM1 restricted RPCs (Fig. 7). Given the functional role and gene expression in most RPCs, it is probable that dividing multipotent RPCs have a high likelihood of producing at least one other multipotent RPC that expresses VSX2, LHX2, and PAX6. The VSX2 expression is driven, at least in part, by the ECR4 module of VSX2 described here. The division of these multipotent RPCs could generate another multipotent RPC and a ThrbCRM1 RPC. This ThrbCRM1 RPC would begin to express OTX2 and OC1, through gene regulatory networks that have yet to be defined and OTX2 and OC1 would in turn activate the ThrbCRM1 element. The previously described OTX2ECR2 element (Emerson and Cepko, 2011) is likely to mediate some of the transcriptional activation of OTX2 in these cells, though there may be others as well. In addition, the timing of their activation is unclear, though the lack of overlap with VSX2 suggests that it does not express in the parental multipotent cell and the occurrence of robust expression during S-phase suggests that G1 could be a likely beginning point for their expression. OTX2 and OC1 could function to consolidate the formation of a restricted RPC through repression of VSX2 expression via indirect effects on the VSX2ECR4 element. The experiments presented above where the activity of VSX2ECR4 and ThrbCRM1 reporters was assessed suggest that they are not active in the same cells. This implies that either: 1) these are two distinct states or 2) the simultaneous transcriptional activity of these two elements is extremely low and this assay is not sensitive enough to capture the concurrent activity. Given the overlap at the protein level of VSX2 with OTX2 and OC1 in only a small number of EdU labeled cells, this supports the hypothesis that these are really two distinct states. The presence of OTX2 and OC1 positive cells that lack VSX2 occur throughout the extent of the retina at E5 with the greatest number near the scleral surface. In contrast, LHX2 and PAX6 are expressed in the OTX2 and OC1 positive RPCs located near the middle of the retina at E5 and are notably absent from the scleral population. Assuming that restricted RPCs follow the same nuclear kinetic movements of other RPCs and are undergoing mitosis on the scleral surface and S-phase further away from this surface, this spatial profile would suggest that VSX2 downregulation precedes that of LHX2 and PAX6.
Figure 7 –
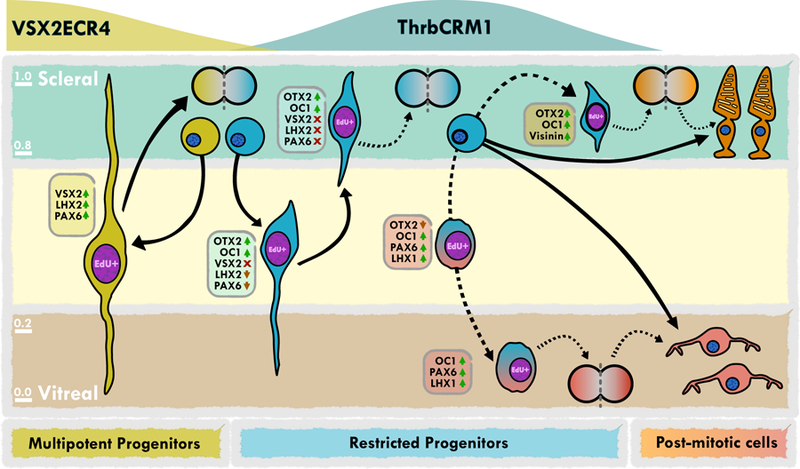
Model of the molecular and transcriptional changes in ThrbCRM1 restricted progenitors
Two major types of cells derived from ThrbCRM1 RPCs are cones and HCs, though the specific types of both cell classes are not yet known. In addition, the specific cell division patterns that lead to the formation of these cells is not identified, including whether both cones and HCs are made from the same RPC and whether there are homotypic RPC states that occur before the final formation of postmitotic cells. Previous work has shown that HC-only RPC states exist (Godinho et al., 2007; Rompani and Cepko, 2008; Zhang et al., 2003), and the population of OC1(+), PAX6(+), but OTX2(−), VSX2(−), LHX2(−) RPCs that become prominent at E6 is likely such a RPC population (see Fig. 5F). In support of this, these cells are located a few cell bodies above the vitreal layer where they have been previously described, express strong PAX6 and OC1 (both genes upregulated in HCs) and express LHX1, a dedicated marker of HCs in the retina. It is interesting to note that PAX6 has multiple phases of expression - presence in multipotent RPCs, absence in ThrbCRM1 RPCs and initiating again in the cells that will migrate vitreally to form HC RPCs. This suggests that there could be multiple gene regulatory networks controlling these two phases and in support of this, a cis-regulatory module of PAX6 has been previously described to drive expression in RPCs that only generate HCs (Zhang et al., 2003). In zebrafish, RPCs that divide homotypically to produce PRs (He et al., 2012) and, specifically, those that produce cones have been described (Suzuki et al., 2013). In mouse, a few such clones have been observed, both in random infections (Turner et al., 1990) as well as in infections of restricted RPCs (Hafler et al., 2012), although on both occasions these clones were a very small fraction of the total observed. The OTX2(+), OC1(−) RPCs could be this progenitor population given the role of OTX2 in photoreceptor development. In support of this, some OTX2(+) cells that express the mitotic marker PH3 can be observed to also express Visinin, which at this timepoint in the chick is considered to be a PR marker (Bruhn and Cepko, 1996; Fischer et al., 2008; Hatakenaka et al., 1985; Yamagata et al., 1990).
Another goal of this study was to investigate the molecular events that occur in ThrbCRM1 RPCs because of their link to cone genesis. Cone PRs are critical for high acuity vision and are often lost during retinal diseases such as retinitis pigmentosa and macular degeneration, among others. One approach to replace these cells in patients is through the production of in vitro generated cells that could be introduced into the diseased retina. Thus, our understanding of the molecular events that occur during the genesis of these cells during normal development may provide insight into strategies to induce or identify these cells during stem cell differentiation protocols. For instance, using OC1 and OTX2 as markers of the early steps of cone genesis has been useful for optimizing cone-producing stem cell protocols (Kruczek et al., 2017). The results of the current study suggest that the downregulation of multipotent RPC genes could serve as a useful biomarker to enrich for the production of restricted RPCs that will form cones. Future studies to understand the gene regulatory networks that underlie the transition from multipotent to restricted RPCs could also aid in designing protocols to enrich for cone PR production through induction of this restricted RPC state.
METHODS
Animals
All experimental procedures were carried out in accordance with the City College of New York, CUNY animal care protocols. CD-1 mice were used and provided by Charles River. Fertilized chick eggs were from Charles River, stored in a 16°C room for 0–10 days and incubated in a 38°C humidified incubator. All experiments that used animals were not sex-biased.
Cloning and DNA electroporation
The Stagia3 and AU1 reporter plasmids were previously described (Billings et al., 2010; Emerson and Cepko, 2011). VSX2 evolutionary conserved elements (ECRs) were identified using ECR Browser (Ovcharenko et al., 2004). One or both orientations of the ECR were screened for activity using the AP reporter. No difference was noted in the activity of VSX2ECR4 in the two orientations, therefore, only one was used for all experiments. The co-electroporation control plasmid UbiqC-TdT was described in (Rompani and Cepko, 2008). CAG:mOtx2 and CAG:mOC1 were described in (Kim et al., 2008) and (Emerson et al., 2013). For the CAG-iRFP plasmid, the iRFP coding sequence was cloned from piRFP670-N1 vector (Addgene plasmid #45457) into the Stagia3 backbone, from which the GFP had been removed and the CAG promoter had been cloned upstream.
To deliver the plasmids to the freshly dissected retinas, ex vivo electroporation experiments were carried out as detailed in Emerson and Cepko 2011. A BTX ECM830 electroporator was used for the cell sorting experiment. All other experiments used a Nepagene electroporator. Retinas were cultured between 8 h and 2 days, according to the experiment. The DNA mixtures used for the ex vivo electroporations were diluted in sterile 1X PBS to a final concentration of 0.16 µg/µl for reporter plasmids and 0.1 µg/µl for the co-electroporation control plasmids and misexpression plasmids.
Retinal cells dissociations and Florescence Activated Flow Sorting (FACS)
After incubation in culture, remaining retinal pigment epithelium and condensed vitreal material was removed from the retinae in HBSS (GIBCO, 14170112) and dissociated using a papain-based procedure (Worthington, L5003126) (Matsuda and Cepko, 2004). Samples used for quantitation of reporter activity were fixed in 4% paraformaldehyde for 15 minutes and washed three times in 1X PBS. Dissociated cells were collected separately into FACS tubes (BD Falcon, 352054) upon being filtered through 40µm cell strainers to ensure suspension of individual cells (Biologix, 15–1040). For cell cycle analyses, retinae were incubated in regular culture media containing 10–50µM EdU for 1 hour. After fixation, incorporated EdU was detected and cells were resuspended in a 1:10,000 DAPI solution for FACS analysis (Pozarowski and Darzynkiewicz, 2004).
Fluorescent activated cell sorting (FACS) for quantitative reporter assay was carried out with a BD FACS Aria machine, using the following lasers: 488nm, 561nm and 633nm. FACS data was analyzed using FlowJo Version 10.2. The overall duration of the dissociation and cell sorting processes is approximately 4 hours. FACS experiments were replicated at least 3 times, unless noted.
Immunohistochemistry and EdU labeling
Retinae processed for immunohistochemistry were fixed in 4% paraformaldehyde for 30 minutes at room temperature, sunk in 30% sucrose/0.5X PBS and then snap-frozen in OCT (Sakura Tissue-Tek, 4583). 20 µm vertical sections were obtained using a Leica Cryostat and collected on slides (FisherBrand, 12–550-15) in a way to collect sections from the entire retina, avoiding collecting consecutive sections on the same slide.
All immunofluorescence experiments were performed as in Emerson and Cepko, 2011. For VSX2, LHX2 and PAX6 antibodies, the percentage of Tween was raised to 0.3% and used in combinations with 0.3–0.5% Triton X-100 (AMRESCO, 9002–93-1). After a minimum of 1 h at room temperature in blocking solution, the slides were incubated at 4°C overnight with a mix of the primary antibodies (Suppl. Table 2), 5% serum and 0.1% Tween. Secondary antibodies appropriate for multiple labeling were from Jackson ImmunoResearch. Alexa 488 and 647 conjugated secondary antibodies were used at 1:400 and Cy3 at 1:250. A solution of 1:10,000 DAPI was applied on sections prior to 3 final washes of 15 minutes at room temperature in 1X PBT and slides were mounted in Fluoromount (Southern Biotech, 0100–01) with 34×60mm cover slips (VWR, 48393 106).
For EdU labeling, retinae were incubated in regular culture media containing 10–50µM EdU for 1 hour. For E13.5 mouse retinas, EdU labeling was performed by injecting pregnant dams with 150ml of 10mM EdU resuspended in 1X PBS. EdU detection was performed with a Click-iT EdU Alexa Fluor 647 imaging or flow cytometry kit (C10340, Invitrogen).
Microscopy
Confocal images were acquired using a Zeiss LSM880 confocal microscope using ZEN Black 2015 2.1 SP2 software and images were converted into picture format using the FIJI version of ImageJ (Schindelin et al., 2012). Figures were assembled using Affinity Designer vector editor. Micrographs of in-situ hybridized retinas were acquired with a Zeiss Axioplan microscope with a dry 40x objective and processed offline with ZEN software (Zeiss) and Affinity Photo editor. Images were adjusted uniformly with regards to brightness and contrast.
In Situ Hybridization
In situ hybridization used mRNA probes designed as described in Sajgo et al., 2017. Suppl. Table 3 shows the primers used for probe amplification. DNA templates were amplified from genomic DNA or chick E6 retina cDNA and probes were amplified using a high-fidelity Pfu-based DNA polymerase (Agilent, catalog #600675). cDNA was made from chick embryo total RNA extracted using a Qiagen RNEasy® Plus Mini kit (Qiagen, 74134), then reverse transcribed using SuperScript II Reverse Transcriptase® (Thermo Scientific, 18064014).
After sequence confirmation, amplicons were re-amplified with primers that included a T7 promoter reverse primer (TAATACGACTCACTATAGGG), and used as template for the RNA synthesis reaction. For the THRB probe, SP6 promoter was used (AGATTTAGGTGACACTATAGA). DIG RNA Labeling mix (Roche Applied Science, 17109820) and T7 polymerase (Roche, 13644023 10881775001) were used according to the vendor’s protocol to generate the RNA probe, that was then precipitated with LiCl and Ethanol and RNA pellets were resuspended in RNase free water (VWR, 02–0201-1000).
E6 chick retinas were fixed overnight at 4°C, processed as for immunohistochemistry, and 20 µm vertical sections were collected and stored at −80°C. Slides were air-dried for 10 minutes, fixed for 10 minutes in 4% PFA, treated with 1µg/ml proteinase K in 1x PBS for 10 minutes, fixed again for extra 10 minutes in 4% PFA and permeabilized in 0.1% Tween in 1x PBS, all at room temperature. Acetylation was carried out in 50ml RNAse-free glass jars, with 49.2 ml RNase free H2O, 625µl Triethanolamine and 125µl acetic anhydride for 10 minutes at room temperature. Slides were permeabilized post acetylation for a total of 30 minutes in 0.1% Tween in 1x PBS, then rinsed with RNase-free H2O.
The hybridization solution contained 2x Formamide (Amresco, 0314–950ML, lot# 12531C148), 5x SSC, 5x Denhart’s solution (ThermoFisher Sci., cat #750018) and 250 ug/ml baker’s yeast RNA and approximately 500ng DIG-labeled RNA probe. After probe application, a glass cover slip was applied and slides were incubated overnight in a sealed tray at 65°C in a lab oven. Slides were washed in a gradient of SSC from 5x to 0.2x, the first 3 washes being done at 65°C, followed by one at room temperature. Slides were equilibrated in a buffer containing 0.1M Tris pH7.5, 0.15M NaCl (herein called B1) for 10 minutes at room temperature, then blocked with 20% heat-inactivated normal goat serum (HINGS) (VWR, IR2430, 10152–210) in B1, for a minimum of 1 hour at room temperature. Anti-DIG-AP antibody at 1:2500 (Anti-Digoxigenin-AP, Fab fragments, Roche, 11633716001) was applied in 5% HINGS B1 buffer at 4°C overnight.
Post incubation with the primary antibody, slides were washed 3× 10 minutes in buffer B1, and incubated in 0.1M Tris pH9.5, 0.1M NaCl, 50mM MgCl2 for 10 minutes. The substrate, 250mg/ml NBT (VWR, MB1019100MG, 100270–436) and 125 mg/ml BCIP (VWR, H56265–06, AAH56265–06) in the buffer above, at a pH of 9.5, was applied on slides for 3 to 48 hours until signal was detected. Slides were then immersed in 1x PBS for 3× 10 minutes and mounted with coverslips and Aquamount (Sigma Aldrich, USA).
RNA extraction and library preparation
A minimum of 1 million cells of each sample were collected, pelleted at 800xg for 5 minutes, flash frozen on dry ice, and stored at −80°C prior to RNA extraction. Total RNA was purified using a Qiagen RNEasy kit with a genome shredder. RNA was quality controlled on an Agilent Bioanalyzer and RNA samples with RNA integrity number (RIN) values of >8.5 were selected for further processing. mRNA was polyA-selected and libraries were prepared for sequencing on the Illumina platform. Paired end sequencing of 50 base read length was performed and >20 million reads were collected for each sample. Two independent replicates for each sample were generated.
Transcriptome analysis
Reads were clipped for adapter sequences and any sequencing artifacts removed. To verify the composition of the RNAseq reads, Bowtie2 (Langmead and Salzberg, 2012) was used to map the reads to all possible target sequences (Suppl. File 1).
Transcript abundance was quantified using kallisto (Bray et al., 2016) against Galgal5 RNA transcripts as target sequences and is reported as Transcripts Per Million (TPM). The sequences for EGFP and TdTomato sequences were added. Average TPM was calculated by adding TPM for all transcripts belonging to each gene and averaging between replicates for each group (Suppl. File 1).
Differential expression was measured using sleuth (Pimentel et al., 2016) in gene aggregation mode, which produces for each gene a q-value False Discovery Rate (FDR) adjusted p-value) and b-value (analogous to fold change) (Suppl. File 1).
Data availability
The data discussed in this publication will be deposited in NCBI’s Gene Expression Omnibus (Edgar et al., 2002) and will be accessible through GEO Series accession number GSE107498.
Quantitative analysis of different markers in retina sections
For chick retinas, three single planes in adjacent areas on the central retina of three biological replicates per condition. For mouse retinas, three single planes were obtained from one Z-stack in three biological replicates. Cells were counted using Cell Counter plugin in ImageJ or Fiji (Schindelin et al., 2012; Schneider et al., 2012). All counts in the three technical replicates of each biological replicate were averaged to a single data point and used for mean and SEM calculations in each condition. Final n=3 for each condition.
Scatterplots and cumulative distribution plots
Each replicate XY pixel coordinate data was extracted from Cell Counter for each cell counted and the retina was measured in pixels for each Y coordinate. To normalize for differences in retina thickness and image acquisition, for each cell the Y location was subtracted by the bottom Y of the retina at that X coordinate, giving an adjusted-Y value for each cell. The adjusted-Y value for each cell was then divided by the full length of the retina in their respective X coordinate and a fraction from 0.0 to 1.0 was obtained. In this measurement 0.0 indicates the vitreal edge of the retina and 1.0 scleral side. For each group, all 3 technical replicates for all 3 biological replicates were pooled. For mouse E13.5, all 3 technical replicates from 2 biological replicates were pooled.
Statistical analysis
A minimum of three biological replicates was used across the study. Statistical tests were used as reported in each figure. Two-tailed student t-test for independent samples was performed in Microsoft Excel. One-way ANOVAs with a post hoc Tukey test for each timepoint using pan-RPC marker (VSX2/LHX2/PAX6) as an independent variable were calculated using the JASP software (JASP Team 2017, Version 0.8.1.2). Data run through t-test and ANOVA was verified for normal distribution using a Shapiro-Wilk test. If not normally distributed, Mann-Whitney test or Kruskall-Wallis with Dunn’s posthoc (Pohlert, 2014) test was performed using R 3.3.0. Kolmogorov-Smirnov tests were performed using R 3.3.0. RNAseq dotplots and EdU count scatterplots were created using R 3.3.0 (R Core Team, 2016) and RStudio 1.0.136 (RStudio Team, 2016) using the ggplot2 (Wickham, 2009) and ggrepel (Slowikowski, 2016) package. FACS plots were produced in FlowJo Version 10.2.
Supplementary Material
Supplemental Figure 1 - Cell cycle analysis of ThrbCRM1 and UbiqTdt population.
(A) Representative collection and cell cycle analysis plots for each population.
(B) Quantification of cell cycle analysis from E5 retinas electroporated and cultured approx. 20h. Constructs used were Ubiq-Tdt and ThrbCRM1-GFP. Cell populations used for Y-axis calculations are shown along the X-axis. Statistical significance was determined in n=7 biological replicates by Kruskal-Wallis with Dunn’s posthoc test. (*: p < 0.05).
Supplemental Figure 2 – Retinal progenitor gene expression at the single cell level and transcriptome level in ThrbCRM1(+) cells
Retinas electroporated at E5 with ThrbCRM1-GFP, cultured for 24hand exposed to EdU for 1h. Large panels are maximum intensity projections Z- stacks and small panels are single planes of the same Z-stacks.
(A-C) ThrbCRM1 cells include VSX2(−) RPCs located in the scleral side (B, white arrows). Majority of RPCs are VSX2(+) (B, red arrows). ThrbCRM1 activity seldom cross-labeled with VSX2 (C, green arrows)
(D) Transcript expression of VSX2 in each replicate.
(E-G) ThrbCRM1 cells also include LHX2(−) RPCs located in the scleral side (F, white arrows). Majority of RPCs are LHX2(+) (F, red arrows). Some ThrbCRM1cells were also positive for LHX2 (G, orange arrows).
(H) Transcript expression of LHX2 in each replicate.
(I-J) ThrbCRM1 cells also include PAX6(- ) RPCs located in the scleral side (J, white arrows). Majority of RPCs are PAX6(+) (J, red arrows). Several ThrbCRM1 cells were also positive for PAX6, sometimes strongly in the NBL and are usually located near the vitreal side (K, orange arrows). Many ThrbCRM1 cells in the NBL remained PAX6(−) (K, green arrows)
(D) Transcript expression of PAX6 in each replicate.
Supplemental Figure 3 – One population of OTX2 and OC1 progenitors upregulate Visinin and another upregulates LHX1 and migrate to the vitreal side
(A) OC1, LHX1, DAPI and EdU on E6 chick retina. White arrows point to EdU(−) cells that are OC1(+) and LHX1(+) in the NBL. Orange arrow points to an OC1, LHX1, EdU triple positive cell near the vitreal retina.
(B) E6 chick imaged for PAX6, OC1 and developed for EdU.There are cells positive for OC1, PAX6 and either positive (orange arrow) or negative (white arrow) for EdU.
(C) OTX2, PH3, Visinin, and DAPI in the E6 chick retina Single Z-plane images of each channel as denoted. Arrow points to an OTX2, PH3, and Visinin triple positive cell.
(D) Maximum intensity projection of Z-stack of an E6 chick retina imaged for OTX2, OC1, Visinin, and DAPI. Small panels are single Z-planes of the same Z-stack. Arrows point to OTX2, OC1, and Visinin triple positive cells.
Supplemental Figure 4 – Differences in proportion of OTX2 and OC1 progenitors that are positive or negative for progenitor markers
(A-D) Percentage of EdU+ RPCs expressing (A) OTX2 and progenitor markers in all EdU(+) cells, (B) OTX2(+) but not expressing progenitor markers, (C) no OTX2 or progenitor markers or (D) only progenitor markers.
(E-H) Percentage of EdU(+) progenitor cells that express (E) OC1 and progenitor markers, (F) express OC1 and do not express progenitor markers, (G) no OC1 or progenitor markers or (H) only progenitor markers. Shapes (triangle, circle and square) denote data points of 3 technical replicates per each biological replicate. Statistical significance was determined in n=3 biological replicates by ANOVA (*: p < 0.05, **: p<0.01, ***: p < 0.001).
Supplemental Figure 5 – Analysis of the distribution of OC1 and Otx2 relative to progenitor genes after 24 hours of culture
E5 chick retinas were cultured for 24h, exposed to EdU. Single z-plane images of each channel as denoted.
(A-C) Retinal sections imaged for OTX2, EdU, and (A) VSX2, (B) LHX2, (C) PAX6.
(D-F) Retinal sections imaged for OC1, EdU, and (D) VSX2, (E) LHX2, (F) PAX6.
(G, H) Scatter plot of the location of EdU+ cells along the apical-basal axis of the retina for the (G) OTX2 groups and (H) OC1 groups. Progenitor markers used denoted on top and immunofluorescence signal on the bottom.
(I-J) Stacked bar chart of percentages of EdU+ cells labeled by combinations (I) OTX2 and VSX2/LHX2/PAX6 or (J) OC1 and VSX2/LHX2/PAX6. Error bars denote SEM. Scale bar represents 50μm.
Supplemental Figure 6 – Differences in the spatial distribution of OTX2 and OC1 progenitors
(A-B) Cumulative distribution graphs of OTX2(+)|EdU(+) cells in the chick retina at (A) E5 and (B) E6.
(C- D) Cumulative distribution graphs of OC1(+)|EdU(+) cells in the chick retina at (C) E5 and (D) E6. N=3.
(E) Tables of p-values from Kolmogorov-Smirnov tests in each timepoint.
Supplemental Figure 7 – Restricted progenitors in the mouse are not spatially segregated but still regulate VSX2 and LHX2 differently at P0
(A- D) EdU-pulsed E13.5 mouse retinal sections imaged for (A) OTX2, VSX2 and EdU (B) OTX2, LHX2 and EdU, (C) OC1, VSX2 and EdU, (D) OC1, LHX2 and EdU.
(E-F) EdU-pulsed P0 mouse retinal sections imaged for (E) OLIG2, VSX2 and EdU or (K) OLIG2, LHX2 and EdU.
(G-L) Scatterplot of EdU(+) cells location in the apical-basal axis of the retina imaged the same way as in the panels to the left of the scatterplot.
(M-N) Stacked bar chart of percentages of EdU(+) cells labeled by combinations (M) OTX2 and VSX2 or (N) OC1 and VSX2. Error bars denote SEM.
(O-P) Quantitation of OC1, OTX2, or OLIG2 expressing RPCs in all EdU(+) cells (O) that also express VSX2 or LHX2 and (P) that do not express VSX2 or LHX2. Statistical significance was determined by t-test (***: p < 0.001, two-tailed t test), n=3.
Supplemental Figure 8 – VSX2ECR4 is active at P0 in the mouse retina
(A) Maximum intensity projection of VSX2 stained Z-stack of a chick retina electroporated at E5 with VSX2ECR4-GFP, cultured for 24h and exposed to EdU for 1hr.
(B) Single Z-plane of the same confocal Z-stack. White arrows point to cells that are VSX2ECR4(+) and VSX2(+).
Supplemental Figure 9. Cell cycle analysis of OTX2 and OC1 misexpression.
(A) Representative collection and cell cycle analysis plots for GFP+ population, with and without CAG:OTX2 and CAG:OC1.
(B) Quantification of cell cycle analysis from E5 retinas electroporated and cultured approx. 20h. Constructs used were CAG:GFP, with and without CAG:OTX2 and CAG:OC1. Statistical significance determined by Mann-Whitney test, n>5, (*: p < 0.05, **: p<0.01, ***: p < 0.001).
Supplemental Figure 10 - VSX2ECR4 activity is dependent on a highly conserved binding site.
(A) Graphical summary of activity levels of VSX2ECR4 and subsequent deletions.
(B) Quantification of deletion constructs by FACS in E5 retinas electroporated and cultured for 24h. Constructs used were co-electroporated with CAG-iRFP. GFP Reporters used for Y-axis calculations are shown along the X-axis.
(C) Representative multi-species alignment of 36 base pair portion of VSX2ECR4 that includes a highly conserved binding site. Asterisks denote conserved nucleotides across species. Red nucleotides indicate mutated bases in mutminECR4.
(D) Quantification of minimal and mutated constructs by FACS in E5 retinas electroporated and cultured for 24h. Constructs used were co-electroporated with CAG-iRFP. GFP Reporters used for Y-axis calculations are shown along the X-axis.
Statistical significance was determined in n=3 biological replicates by ANOVA if normally distributed and Kruskal-Wallis with Dunn’s posthoc test if not normally distributed. (*: p < 0.05, **: p<0.01, ***: p < 0.001), n=4 for (B) and n=3 for (D), both experiments replicated additional 2 times.
Supplemental Table 1 – Results of restricted and multipotent RPC quantification in chick and mouse
Supplemental Table 2 – Antibody list
Supplemental Table 3 – Primers used for the generation of the mRNA probes for ISH and amplification of VSX2 ECRs
Supplemental File 1 – Transcriptome analysis full results
KEY RESOURCES TABLE
| Reagent or resource | Source | Identifier |
|---|---|---|
| Antibodies | ||
| Rabbit PH3 – 1:500 | EMD Millipore | 06–570 |
| AB_310177* | ||
| Rabbit OLIG2 – 1:500 | EMD Millipore | AB9610 |
| AB_570666* | ||
| Rabbit OTX2 – 1:500 | EMD Millipore | AB9566 |
| AB_2157186* | ||
| Goat OTX2 – 1:500 | Novus biologicals | AF1979 |
| AB_2157172* | ||
| Rabbit OC1 – 1:500 | Santa Cruz | SC-13050 |
| AB_2251852* | ||
| Sheep VSX2 – 1:500 (mouse); 1:200 (chick) | ExAlpha | X1180P |
| AB_2314191* | ||
| Goat LHX2 – 1:500 (mouse); 1:50 (chick) | Santa Cruz | SC-19344 |
| AB_2618817* | ||
| Mouse IgG1 PAX6 – 1:10 | DSHB | Pax6-s |
| AB_2315070* | ||
| Mouse IgG1 LIM1+2 – 1:10 | DSHB | 4F2-C |
| AB_2314743* | ||
| Mouse IgG1 VISININ – 1:250 | DSHB | 7G4-s |
| AB_528510* | ||
| *RRID: Repository Resource ID, http://antibodyregistry.org/ | ||
| Bacterial and Virus Strains | ||
| Biological Samples | ||
| Chemicals, Peptides, and Recombinant Proteins | ||
| Critical Commercial Assays | ||
| Qiagen RNEasy® Plus Mini kit | Qiagen | 74134 |
| Click-iT EdU Alexa Fluor 647 imaging kit | Invitrogen | C10340 |
| Deposited Data | ||
| RNAseq data - NCBI GEO | Edgar et al., 2002 | GSE107498 |
| Experimental Models: Cell Lines | ||
| Experimental Models: Organisms/Strains | ||
| Chicken eggs, SPF, Premium, Fertile | Charles River | 10100326 |
| Oligonucleotides | ||
| Recombinant DNA | ||
| Stagia3 | Billings et al., 2010 | Addgene #28177 |
| ThrbCRM1:AU1 | Emerson et al., 2013 | N/A |
| CAG:mOTX2 | Kim et al., 2008 | N/A |
| CAG:mOC1 | Emerson et al., 2013 | N/A |
| CAG:iRFP | This paper | N/A |
| VSX2ECR4:GFP | This paper | N/A |
| Software and Algorithms | ||
| FlowJo V10.2 | FlowJo LLC | N/A |
| FIJI version of ImageJ | Schindelin et al., 2012 | N/A |
| kallisto | Bray et al., 2016 | N/A |
| sleuth | Pimentel et al., 2016 | N/A |
| JASP V0.8.1.2 | JASP Team 2017 | N/A |
| ggplot2 | Wickham, 2009 | N/A |
| Other | ||
ACKNOWLEDGEMENT
This work was supported by the National Institutes of Health (R01EY024982 to M.E. and 3G12MD007603–30S2 to CCNY). The content is solely the responsibility of the authors and does not necessarily represent the official views of the National Eye Institute, the National Institute On Minority Health and Health Disparities or the National Institutes of Health. The Pax6, 4F2, and Visinin antibodies developed by Thomas Jessell, Susan Brenner-Morton, and Suzanne Bruhn were obtained from the Developmental Studies Hybridoma Bank developed under the auspices of the NICHD and maintained by the Department of Biology at The University of Iowa. Esther Schick constructed and kindly provided the CAG-iRFP plasmid. We thank the generous support provided by Constance Cepko during the initial project development and the members of the Emerson lab for useful discussions and support for this project.
REFERENCES
- Baye LM, and Link BA (2007). Interkinetic Nuclear Migration and the Selection of Neurogenic Cell Divisions during Vertebrate Retinogenesis. J. Neurosci 27, 10143–10152. [DOI] [PMC free article] [PubMed] [Google Scholar]
- Billings NA, Emerson MM, and Cepko CL (2010). Analysis of thyroid response element activity during retinal development. PloS One 5, e13739. [DOI] [PMC free article] [PubMed] [Google Scholar]
- Boije H, Edqvist P-HD, and Hallböök F (2009). Horizontal cell progenitors arrest in G2-phase and undergo terminal mitosis on the vitreal side of the chick retina. Dev. Biol 330, 105–113. [DOI] [PubMed] [Google Scholar]
- Bray NL, Pimentel H, Melsted P, and Pachter L (2016). Near-optimal probabilistic RNA-seq quantification. Nat. Biotechnol 34, 525–527. [DOI] [PubMed] [Google Scholar]
- Bruhn SL, and Cepko CL (1996). Development of the pattern of photoreceptors in the chick retina. J. Neurosci 16, 1430–1439. [DOI] [PMC free article] [PubMed] [Google Scholar]
- Brzezinski JA, Kim EJ, Johnson JE, and Reh TA (2011). Ascl1 expression defines a subpopulation of lineage-restricted progenitors in the mammalian retina. Development 138, 3519–3531. [DOI] [PMC free article] [PubMed] [Google Scholar]
- Brzezinski JA IV, Prasov L, and Glaser T (2012). Math5 defines the ganglion cell competence state in a subpopulation of retinal progenitor cells exiting the cell cycle. Dev. Biol 365, 395–413. [DOI] [PMC free article] [PubMed] [Google Scholar]
- Burmeister M, Novak J, Liang M-Y, Basu S, Ploder L, Hawes NL, Vidgen D, Hoover F, Goldman D, Kalnins VI, et al. (1996). Ocular retardation mouse caused by Chx10 homeobox null allele: impaired retinal progenitor proliferation and bipolar cell differentiation. Nat. Genet 12, 376–384. [DOI] [PubMed] [Google Scholar]
- Cepko CL, Austin CP, Yang X, Alexiades M, and Ezzeddine D (1996). Cell fate determination in the vertebrate retina. Proc. Natl. Acad. Sci. U. S. A 93, 589–595. [DOI] [PMC free article] [PubMed] [Google Scholar]
- Chen Z, Li X, and Desplan C (2012). Deterministic or Stochastic Choices in Retinal Neuron Specification. Neuron 75, 739–742. [DOI] [PMC free article] [PubMed] [Google Scholar]
- De la Huerta I, Kim I-J, Voinescu PE, and Sanes JR (2012). Direction-selective retinal ganglion cells arise from molecularly specified multipotential progenitors. Proc. Natl. Acad. Sci 109, 17663–17668. [DOI] [PMC free article] [PubMed] [Google Scholar]
- Del Bene F, Wehman AM, Link BA, and Baier H (2008). Regulation of neurogenesis by interkinetic nuclear migration through an apical-basal notch gradient. Cell 134, 1055–1065. [DOI] [PMC free article] [PubMed] [Google Scholar]
- Edgar R, Domrachev M, and Lash AE (2002). Gene Expression Omnibus: NCBI gene expression and hybridization array data repository. Nucleic Acids Res 30, 207–210. [DOI] [PMC free article] [PubMed] [Google Scholar]
- Edqvist P-HD, and Hallböök F (2004). Newborn horizontal cells migrate bi-directionally across the neuroepithelium during retinal development. Development 131, 1343–1351. [DOI] [PubMed] [Google Scholar]
- Emerson MM, and Cepko CL (2011). Identification of a retina-specific Otx2 enhancer element active in immature developing photoreceptors. Dev. Biol 360, 241–255. [DOI] [PMC free article] [PubMed] [Google Scholar]
- Emerson MM, Surzenko N, Goetz JJ, Trimarchi J, and Cepko CL (2013). Otx2 and Onecut1 Promote the Fates of Cone Photoreceptors and Horizontal Cells and Repress Rod Photoreceptors. Dev. Cell 26, 59–72. [DOI] [PMC free article] [PubMed] [Google Scholar]
- Enright JM, Lawrence KA, Hadzic T, and Corbo JC (2015). Transcriptome profiling of developing photoreceptor subtypes reveals candidate genes involved in avian photoreceptor diversification. J. Comp. Neurol 523, 649–668. [DOI] [PMC free article] [PubMed] [Google Scholar]
- Ferda Percin E, Ploder LA, Yu JJ, Arici K, Jonathan Horsford D, Rutherford A, Bapat B, Cox DW, Duncan AMV, Kalnins VI, et al. (2000). Human microphthalmia associated with mutations in the retinal homeobox gene CHX10. Nat. Genet 25, 397–401. [DOI] [PubMed] [Google Scholar]
- Fischer AJ, Foster S, Scott MA, and Sherwood P (2008). Transient expression of LIM-domain transcription factors is coincident with delayed maturation of photoreceptors in the chicken retina. J. Comp. Neurol 506, 584–603. [DOI] [PMC free article] [PubMed] [Google Scholar]
- Furukawa T, Kozak CA, and Cepko CL (1997). rax, a novel paired-type homeobox gene, shows expression in the anterior neural fold and developing retina. Proc. Natl. Acad. Sci. U. S. A 94, 3088–3093. [DOI] [PMC free article] [PubMed] [Google Scholar]
- Furukawa T, Mukherjee S, Bao Z-Z, Morrow EM, and Cepko CL (2000). rax, Hes1, and notch1 Promote the Formation of Müller Glia by Postnatal Retinal Progenitor Cells. Neuron 26, 383–394. [DOI] [PubMed] [Google Scholar]
- Gao Z, Mao C-A, Pan P, Mu X, and Klein WH (2014). Transcriptome of Atoh7 retinal progenitor cells identifies new Atoh7-dependent regulatory genes for retinal ganglion cell formation. Dev. Neurobiol 74, 1123–1140. [DOI] [PMC free article] [PubMed] [Google Scholar]
- Godinho L, Williams PR, Claassen Y, Provost E, Leach SD, Kamermans M, and Wong ROL (2007). Nonapical symmetric divisions underlie horizontal cell layer formation in the developing retina in vivo. Neuron 56, 597–603. [DOI] [PubMed] [Google Scholar]
- Gordon PJ, Yun S, Clark AM, Monuki ES, Murtaugh LC, and Levine EM (2013). Lhx2 Balances Progenitor Maintenance with Neurogenic Output and Promotes Competence State Progression in the Developing Retina. J. Neurosci 33, 12197–12207. [DOI] [PMC free article] [PubMed] [Google Scholar]
- Hafler BP, Surzenko N, Beier KT, Punzo C, Trimarchi JM, Kong JH, and Cepko CL (2012). Transcription factor Olig2 defines subpopulations of retinal progenitor cells biased toward specific cell fates. Proc. Natl. Acad. Sci. U. S. A 109, 7882–7887. [DOI] [PMC free article] [PubMed] [Google Scholar]
- Hatakenaka S, Kiyama H, Tohyama M, and Miki N (1985). Immunohistochemical localization of chick retinal 24 kdalton protein (visinin) in various vertebrate retinae. Brain Res 331, 209–215. [DOI] [PubMed] [Google Scholar]
- He J, Zhang G, Almeida AD, Cayouette M, Simons BD, and Harris WA (2012). How Variable Clones Build an Invariant Retina. Neuron 75, 786–798. [DOI] [PMC free article] [PubMed] [Google Scholar]
- Holt CE, Bertsch TW, Ellis HM, and Harris WA (1988). Cellular determination in the Xenopus retina is independent of lineage and birth date. Neuron 1, 15–26. [DOI] [PubMed] [Google Scholar]
- Kim DS, Matsuda T, and Cepko CL (2008). A core paired-type and POU homeodomain-containing transcription factor program drives retinal bipolar cell gene expression. J. Neurosci. Off. J. Soc. Neurosci 28, 7748–7764. [DOI] [PMC free article] [PubMed] [Google Scholar]
- Kim J-W, Yang H-J, Oel AP, Brooks MJ, Jia L, Plachetzki DC, Li W, Allison WT, and Swaroop A (2016). Recruitment of Rod Photoreceptors from Short-Wavelength-Sensitive Cones during the Evolution of Nocturnal Vision in Mammals. Dev. Cell 37, 520–532. [DOI] [PMC free article] [PubMed] [Google Scholar]
- Kolb H, Nelson R, Ahnelt P, and Cuenca N (2001). Chapter 1 Cellular organization of the vertebrate retina. In Progress in Brain Research, (Elsevier; ), pp. 3–26. [DOI] [PubMed] [Google Scholar]
- Kruczek K, Gonzalez-Cordero A, Goh D, Naeem A, Jonikas M, Blackford SJI, Kloc M, Duran Y, Georgiadis A, Sampson RD, et al. (2017). Differentiation and Transplantation of Embryonic Stem Cell-Derived Cone Photoreceptors into a Mouse Model of End-Stage Retinal Degeneration. Stem Cell Rep 8, 1659–1674. [DOI] [PMC free article] [PubMed] [Google Scholar]
- Langmead B, and Salzberg SL (2012). Fast gapped-read alignment with Bowtie 2. Nat. Methods 9, 357–359. [DOI] [PMC free article] [PubMed] [Google Scholar]
- Liberzon A, Subramanian A, Pinchback R, Thorvaldsdóttir H, Tamayo P, and Mesirov JP (2011). Molecular signatures database (MSigDB) 3.0. Bioinforma. Oxf. Engl 27, 1739–1740. [DOI] [PMC free article] [PubMed] [Google Scholar]
- Liu W, Wang JH, and Xiang M (2000). Specific expression of the LIM/homeodomain protein Lim-1 in horizontal cells during retinogenesis. Dev. Dyn. Off. Publ. Am. Assoc. Anat 217, 320–325. [DOI] [PubMed] [Google Scholar]
- Marquardt T, Ashery-Padan R, Andrejewski N, Scardigli R, Guillemot F, and Gruss P (2001). Pax6 Is Required for the Multipotent State of Retinal Progenitor Cells. Cell 105, 43–55. [DOI] [PubMed] [Google Scholar]
- Matsuda T, and Cepko CL (2004). Electroporation and RNA interference in the rodent retina in vivo and in vitro. Proc. Natl. Acad. Sci. U. S. A 101, 16–22. [DOI] [PMC free article] [PubMed] [Google Scholar]
- Miyawaki T, Uemura A, Dezawa M, Yu RT, Ide C, Nishikawa S, Honda Y, Tanabe Y, and Tanabe T (2004). Tlx, an orphan nuclear receptor, regulates cell numbers and astrocyte development in the developing retina. J. Neurosci. Off. J. Soc. Neurosci 24, 8124–8134. [DOI] [PMC free article] [PubMed] [Google Scholar]
- Mu X, Fu X, Sun H, Beremand PD, Thomas TL, and Klein WH (2005). A gene network downstream of transcription factor Math5 regulates retinal progenitor cell competence and ganglion cell fate. Dev. Biol 280, 467–481. [DOI] [PubMed] [Google Scholar]
- Ng L, Hurley JB, Dierks B, Srinivas M, Saltó C, Vennström B, Reh TA, and Forrest D (2001). A thyroid hormone receptor that is required for the development of green cone photoreceptors. Nat. Genet 27, 94–98. [DOI] [PubMed] [Google Scholar]
- Ng L, Ma M, Curran T, and Forrest D (2009). Developmental expression of thyroid hormone receptor beta2 protein in cone photoreceptors in the mouse. Neuroreport 20, 627–631. [DOI] [PMC free article] [PubMed] [Google Scholar]
- Nishida A, Furukawa A, Koike C, Tano Y, Aizawa S, Matsuo I, and Furukawa T (2003). Otx2 homeobox gene controls retinal photoreceptor cell fate and pineal gland development. Nat. Neurosci 6, 1255–1263. [DOI] [PubMed] [Google Scholar]
- Ochi H, Sakagami K, Ishii A, Morita N, Nishiuchi M, Ogino H, and Yasuda K (2004). Temporal expression of L-Maf and RaxL in developing chicken retina are arranged into mosaic pattern. Gene Expr. Patterns 4, 489–494. [DOI] [PubMed] [Google Scholar]
- Ovcharenko I, Nobrega MA, Loots GG, and Stubbs L (2004). ECR Browser: a tool for visualizing and accessing data from comparisons of multiple vertebrate genomes. Nucleic Acids Res 32, W280–286. [DOI] [PMC free article] [PubMed] [Google Scholar]
- Pacal M, and Bremner R (2012). Mapping differentiation kinetics in the mouse retina reveals an extensive period of cell cycle protein expression in post-mitotic newborn neurons. Dev. Dyn. Off. Publ. Am. Assoc. Anat 241, 1525–1544. [DOI] [PubMed] [Google Scholar]
- Pimentel H, Bray NL, Puente S, Melsted P, and Pachter L (2017). Differential analysis of RNA-seq incorporating quantification uncertainty. Nat. Methods 14, 687–690. [DOI] [PubMed] [Google Scholar]
- Pimentel HJ, Bray N, Puente S, Melsted P, and Pachter L (2016). Differential analysis of RNA-Seq incorporating quantification uncertainty. BioRxiv 058164. [DOI] [PubMed] [Google Scholar]
- Poché RA, Furuta Y, Chaboissier M-C, Schedl A, and Behringer RR (2008) . Sox9 is expressed in mouse multipotent retinal progenitor cells and functions in Müller Glial cell development. J. Comp. Neurol 510, 237–250. [DOI] [PMC free article] [PubMed] [Google Scholar]
- Pozarowski P, and Darzynkiewicz Z (2004). Analysis of cell cycle by flow cytometry. Methods Mol. Biol. Clifton NJ 281, 301–311. [DOI] [PubMed] [Google Scholar]
- R Core Team (2016). R: A language and environment for statistical computing R Found. Stat. Comput. [Google Scholar]
- Roberts MR, Hendrickson A, McGuire CR, and Reh TA (2005). Retinoid X receptor (gamma) is necessary to establish the S-opsin gradient in cone photoreceptors of the developing mouse retina. Invest. Ophthalmol. Vis. Sci 46, 2897–2904. [DOI] [PubMed] [Google Scholar]
- Rodgers HM, Belcastro M, Sokolov M, and Mathers PH (2016). Embryonic markers of cone differentiation. Mol. Vis 22, 1455–1467. [PMC free article] [PubMed] [Google Scholar]
- Rompani SB, and Cepko CL (2008). Retinal progenitor cells can produce restricted subsets of horizontal cells. Proc. Natl. Acad. Sci. U. S. A 105, 192–197. [DOI] [PMC free article] [PubMed] [Google Scholar]
- Roy A, de Melo J, Chaturvedi D, Thein T, Cabrera-Socorro A, Houart C, Meyer G, Blackshaw S, and Tole S (2013). LHX2 is necessary for the maintenance of optic identity and for the progression of optic morphogenesis. J. Neurosci. Off. J. Soc. Neurosci 33, 6877–6884. [DOI] [PMC free article] [PubMed] [Google Scholar]
- RStudio Team (2016). RStudio: Integrated Development for R RStudio Inc. [Google Scholar]
- Schindelin J, Arganda-Carreras I, Frise E, Kaynig V, Longair M, Pietzsch T, Preibisch S, Rueden C, Saalfeld S, Schmid B, et al. (2012). Fiji: an open-source platform for biological-image analysis. Nat. Methods 9, 676–682. [DOI] [PMC free article] [PubMed] [Google Scholar]
- Schneider CA, Rasband WS, and Eliceiri KW (2012). NIH Image to ImageJ: 25 years of image analysis. Nat. Methods 9, 671–675. [DOI] [PMC free article] [PubMed] [Google Scholar]
- Slowikowski K (2016). ggrepel: Repulsive Text and Label Geoms for “ggplot2.” R Package Version 065 [Google Scholar]
- Suzuki SC, Bleckert A, Williams PR, Takechi M, Kawamura S, and Wong ROL (2013). Cone photoreceptor types in zebrafish are generated by symmetric terminal divisions of dedicated precursors. Proc. Natl. Acad. Sci. U. S. A 110, 15109–15114. [DOI] [PMC free article] [PubMed] [Google Scholar]
- Taranova OV, Magness ST, Fagan BM, Wu Y, Surzenko N, Hutton SR, and Pevny LH (2006). SOX2 is a dose-dependent regulator of retinal neural progenitor competence. Genes Dev 20, 1187–1202. [DOI] [PMC free article] [PubMed] [Google Scholar]
- Trimarchi JM, Harpavat S, Billings NA, and Cepko CL (2008a). Thyroid hormone components are expressed in three sequential waves during development of the chick retina. BMC Dev. Biol 8, 101. [DOI] [PMC free article] [PubMed] [Google Scholar]
- Trimarchi JM, Stadler MB, and Cepko CL (2008b). Individual retinal progenitor cells display extensive heterogeneity of gene expression. PloS One 3, e1588. [DOI] [PMC free article] [PubMed] [Google Scholar]
- Turner DL, Snyder EY, and Cepko CL (1990). Lineage-independent determination of cell type in the embryonic mouse retina. Neuron 4, 833–845. [DOI] [PubMed] [Google Scholar]
- Vitorino M, Jusuf PR, Maurus D, Kimura Y, Higashijima S-I, and Harris WA (2009). Vsx2 in the zebrafish retina: restricted lineages through derepression. Neural Develop 4, 14. [DOI] [PMC free article] [PubMed] [Google Scholar]
- Weber IP, Ramos AP, Strzyz PJ, Leung LC, Young S, and Norden C (2014). Mitotic Position and Morphology of Committed Precursor Cells in the Zebrafish Retina Adapt to Architectural Changes upon Tissue Maturation. Cell Rep 7, 386–397. [DOI] [PubMed] [Google Scholar]
- Wetts R, and Fraser SE (1988). Multipotent precursors can give rise to all major cell types of the frog retina. Science 239, 1142–1145. [DOI] [PubMed] [Google Scholar]
- Wickham H (2009). ggplot2: Elegant Graphics for Data Analysis
- Wong LL, and Rapaport DH (2009). Defining retinal progenitor cell competence in Xenopus laevis by clonal analysis. Development 136, 1707–1715. [DOI] [PMC free article] [PubMed] [Google Scholar]
- Yamagata K, Goto K, Kuo CH, Kondo H, and Miki N (1990). Visinin: a novel calcium binding protein expressed in retinal cone cells. Neuron 4, 469–476. [DOI] [PubMed] [Google Scholar]
- Zeng H, and Sanes JR (2017). Neuronal cell-type classification: challenges, opportunities and the path forward. Nat. Rev. Neurosci 18, 530–546. [DOI] [PubMed] [Google Scholar]
- Zhang X, Heaney S, and Maas RL (2003). Cre-loxp fate-mapping of Pax6 enhancer active retinal and pancreatic progenitors. Genes. N. Y. N 2000 35, 22–30. [DOI] [PubMed] [Google Scholar]
- Zou C, and Levine EM (2012). Vsx2 Controls Eye Organogenesis and Retinal Progenitor Identity Via Homeodomain and Non-Homeodomain Residues Required for High Affinity DNA Binding. PLoS Genet 8, e1002924. [DOI] [PMC free article] [PubMed] [Google Scholar]
Associated Data
This section collects any data citations, data availability statements, or supplementary materials included in this article.
Supplementary Materials
Supplemental Figure 1 - Cell cycle analysis of ThrbCRM1 and UbiqTdt population.
(A) Representative collection and cell cycle analysis plots for each population.
(B) Quantification of cell cycle analysis from E5 retinas electroporated and cultured approx. 20h. Constructs used were Ubiq-Tdt and ThrbCRM1-GFP. Cell populations used for Y-axis calculations are shown along the X-axis. Statistical significance was determined in n=7 biological replicates by Kruskal-Wallis with Dunn’s posthoc test. (*: p < 0.05).
Supplemental Figure 2 – Retinal progenitor gene expression at the single cell level and transcriptome level in ThrbCRM1(+) cells
Retinas electroporated at E5 with ThrbCRM1-GFP, cultured for 24hand exposed to EdU for 1h. Large panels are maximum intensity projections Z- stacks and small panels are single planes of the same Z-stacks.
(A-C) ThrbCRM1 cells include VSX2(−) RPCs located in the scleral side (B, white arrows). Majority of RPCs are VSX2(+) (B, red arrows). ThrbCRM1 activity seldom cross-labeled with VSX2 (C, green arrows)
(D) Transcript expression of VSX2 in each replicate.
(E-G) ThrbCRM1 cells also include LHX2(−) RPCs located in the scleral side (F, white arrows). Majority of RPCs are LHX2(+) (F, red arrows). Some ThrbCRM1cells were also positive for LHX2 (G, orange arrows).
(H) Transcript expression of LHX2 in each replicate.
(I-J) ThrbCRM1 cells also include PAX6(- ) RPCs located in the scleral side (J, white arrows). Majority of RPCs are PAX6(+) (J, red arrows). Several ThrbCRM1 cells were also positive for PAX6, sometimes strongly in the NBL and are usually located near the vitreal side (K, orange arrows). Many ThrbCRM1 cells in the NBL remained PAX6(−) (K, green arrows)
(D) Transcript expression of PAX6 in each replicate.
Supplemental Figure 3 – One population of OTX2 and OC1 progenitors upregulate Visinin and another upregulates LHX1 and migrate to the vitreal side
(A) OC1, LHX1, DAPI and EdU on E6 chick retina. White arrows point to EdU(−) cells that are OC1(+) and LHX1(+) in the NBL. Orange arrow points to an OC1, LHX1, EdU triple positive cell near the vitreal retina.
(B) E6 chick imaged for PAX6, OC1 and developed for EdU.There are cells positive for OC1, PAX6 and either positive (orange arrow) or negative (white arrow) for EdU.
(C) OTX2, PH3, Visinin, and DAPI in the E6 chick retina Single Z-plane images of each channel as denoted. Arrow points to an OTX2, PH3, and Visinin triple positive cell.
(D) Maximum intensity projection of Z-stack of an E6 chick retina imaged for OTX2, OC1, Visinin, and DAPI. Small panels are single Z-planes of the same Z-stack. Arrows point to OTX2, OC1, and Visinin triple positive cells.
Supplemental Figure 4 – Differences in proportion of OTX2 and OC1 progenitors that are positive or negative for progenitor markers
(A-D) Percentage of EdU+ RPCs expressing (A) OTX2 and progenitor markers in all EdU(+) cells, (B) OTX2(+) but not expressing progenitor markers, (C) no OTX2 or progenitor markers or (D) only progenitor markers.
(E-H) Percentage of EdU(+) progenitor cells that express (E) OC1 and progenitor markers, (F) express OC1 and do not express progenitor markers, (G) no OC1 or progenitor markers or (H) only progenitor markers. Shapes (triangle, circle and square) denote data points of 3 technical replicates per each biological replicate. Statistical significance was determined in n=3 biological replicates by ANOVA (*: p < 0.05, **: p<0.01, ***: p < 0.001).
Supplemental Figure 5 – Analysis of the distribution of OC1 and Otx2 relative to progenitor genes after 24 hours of culture
E5 chick retinas were cultured for 24h, exposed to EdU. Single z-plane images of each channel as denoted.
(A-C) Retinal sections imaged for OTX2, EdU, and (A) VSX2, (B) LHX2, (C) PAX6.
(D-F) Retinal sections imaged for OC1, EdU, and (D) VSX2, (E) LHX2, (F) PAX6.
(G, H) Scatter plot of the location of EdU+ cells along the apical-basal axis of the retina for the (G) OTX2 groups and (H) OC1 groups. Progenitor markers used denoted on top and immunofluorescence signal on the bottom.
(I-J) Stacked bar chart of percentages of EdU+ cells labeled by combinations (I) OTX2 and VSX2/LHX2/PAX6 or (J) OC1 and VSX2/LHX2/PAX6. Error bars denote SEM. Scale bar represents 50μm.
Supplemental Figure 6 – Differences in the spatial distribution of OTX2 and OC1 progenitors
(A-B) Cumulative distribution graphs of OTX2(+)|EdU(+) cells in the chick retina at (A) E5 and (B) E6.
(C- D) Cumulative distribution graphs of OC1(+)|EdU(+) cells in the chick retina at (C) E5 and (D) E6. N=3.
(E) Tables of p-values from Kolmogorov-Smirnov tests in each timepoint.
Supplemental Figure 7 – Restricted progenitors in the mouse are not spatially segregated but still regulate VSX2 and LHX2 differently at P0
(A- D) EdU-pulsed E13.5 mouse retinal sections imaged for (A) OTX2, VSX2 and EdU (B) OTX2, LHX2 and EdU, (C) OC1, VSX2 and EdU, (D) OC1, LHX2 and EdU.
(E-F) EdU-pulsed P0 mouse retinal sections imaged for (E) OLIG2, VSX2 and EdU or (K) OLIG2, LHX2 and EdU.
(G-L) Scatterplot of EdU(+) cells location in the apical-basal axis of the retina imaged the same way as in the panels to the left of the scatterplot.
(M-N) Stacked bar chart of percentages of EdU(+) cells labeled by combinations (M) OTX2 and VSX2 or (N) OC1 and VSX2. Error bars denote SEM.
(O-P) Quantitation of OC1, OTX2, or OLIG2 expressing RPCs in all EdU(+) cells (O) that also express VSX2 or LHX2 and (P) that do not express VSX2 or LHX2. Statistical significance was determined by t-test (***: p < 0.001, two-tailed t test), n=3.
Supplemental Figure 8 – VSX2ECR4 is active at P0 in the mouse retina
(A) Maximum intensity projection of VSX2 stained Z-stack of a chick retina electroporated at E5 with VSX2ECR4-GFP, cultured for 24h and exposed to EdU for 1hr.
(B) Single Z-plane of the same confocal Z-stack. White arrows point to cells that are VSX2ECR4(+) and VSX2(+).
Supplemental Figure 9. Cell cycle analysis of OTX2 and OC1 misexpression.
(A) Representative collection and cell cycle analysis plots for GFP+ population, with and without CAG:OTX2 and CAG:OC1.
(B) Quantification of cell cycle analysis from E5 retinas electroporated and cultured approx. 20h. Constructs used were CAG:GFP, with and without CAG:OTX2 and CAG:OC1. Statistical significance determined by Mann-Whitney test, n>5, (*: p < 0.05, **: p<0.01, ***: p < 0.001).
Supplemental Figure 10 - VSX2ECR4 activity is dependent on a highly conserved binding site.
(A) Graphical summary of activity levels of VSX2ECR4 and subsequent deletions.
(B) Quantification of deletion constructs by FACS in E5 retinas electroporated and cultured for 24h. Constructs used were co-electroporated with CAG-iRFP. GFP Reporters used for Y-axis calculations are shown along the X-axis.
(C) Representative multi-species alignment of 36 base pair portion of VSX2ECR4 that includes a highly conserved binding site. Asterisks denote conserved nucleotides across species. Red nucleotides indicate mutated bases in mutminECR4.
(D) Quantification of minimal and mutated constructs by FACS in E5 retinas electroporated and cultured for 24h. Constructs used were co-electroporated with CAG-iRFP. GFP Reporters used for Y-axis calculations are shown along the X-axis.
Statistical significance was determined in n=3 biological replicates by ANOVA if normally distributed and Kruskal-Wallis with Dunn’s posthoc test if not normally distributed. (*: p < 0.05, **: p<0.01, ***: p < 0.001), n=4 for (B) and n=3 for (D), both experiments replicated additional 2 times.
Supplemental Table 1 – Results of restricted and multipotent RPC quantification in chick and mouse
Supplemental Table 2 – Antibody list
Supplemental Table 3 – Primers used for the generation of the mRNA probes for ISH and amplification of VSX2 ECRs
Supplemental File 1 – Transcriptome analysis full results
Data Availability Statement
The data discussed in this publication will be deposited in NCBI’s Gene Expression Omnibus (Edgar et al., 2002) and will be accessible through GEO Series accession number GSE107498.