

Abstract
Key points
Previous studies have indicated that several weeks of strength training is sufficient to elicit significant adaptations in the neural drive sent to the muscles.
There are few data, however, on the changes elicited by strength training in the recruitment and rate coding of motor units during voluntary contractions. We show for the first time that the discharge characteristics of motor units in the tibialis anterior muscle tracked across the intervention are changed by 4 weeks of strength training with isometric voluntary contractions.
The specific adaptations included significant increases in motor unit discharge rate, decreases in the recruitment‐threshold force of motor units and a similar input–output gain of the motor neurons.
The findings suggest that the adaptations in motor unit function may be attributable to changes in synaptic input to the motor neuron pool or to adaptations in intrinsic motor neuron properties.
Abstract
The strength of a muscle typically begins to increase after only a few sessions of strength training. This increase is usually attributed to changes in the neural drive to muscle as a result of adaptations at the cortical or spinal level. We investigated the change in the discharge characteristics of large populations of longitudinally tracked motor units in tibialis anterior before and after 4 weeks of strength training the ankle‐dorsiflexor muscles with isometric contractions. The adaptations exhibited by 14 individuals were compared with 14 control subjects. High‐density electromyogram grids with 128 electrodes recorded the myoelectric activity during isometric ramp contractions to the target forces of 35%, 50% and 70% of maximal voluntary force. The motor unit recruitment and derecruitment thresholds, discharge rate, interspike intervals and estimates of synaptic inputs to motor neurons were assessed. The normalized recruitment‐threshold forces of the motor units were decreased after strength training (P < 0.05). Moreover, discharge rate increased by 3.3 ± 2.5 pps (average across subjects and motor units) during the plateau phase of the submaximal isometric contractions (P < 0.001). Discharge rates at recruitment and derecruitment were not modified by training (P < 0.05). The association between force and motor unit discharge rate during the ramp‐phase of the contractions was also not altered by training (P < 0.05). These results demonstrate for the first time that the increase in muscle force after 4 weeks of strength training is the result of an increase in motor neuron output from the spinal cord to the muscle.
Keywords: Resistance Training, Neural Adaptations, Motor Units, EMG, Decomposition
Key points
Previous studies have indicated that several weeks of strength training is sufficient to elicit significant adaptations in the neural drive sent to the muscles.
There are few data, however, on the changes elicited by strength training in the recruitment and rate coding of motor units during voluntary contractions. We show for the first time that the discharge characteristics of motor units in the tibialis anterior muscle tracked across the intervention are changed by 4 weeks of strength training with isometric voluntary contractions.
The specific adaptations included significant increases in motor unit discharge rate, decreases in the recruitment‐threshold force of motor units and a similar input–output gain of the motor neurons.
The findings suggest that the adaptations in motor unit function may be attributable to changes in synaptic input to the motor neuron pool or to adaptations in intrinsic motor neuron properties.
Introduction
The consensus evidence suggests that increases in muscle strength after a few sessions (<4 weeks) of strength training with strong voluntary contractions involve relatively minor changes of the contractile apparatus (Akima et al. 1999; Blazevich et al. 2007; Seynnes et al. 2007; Weier et al. 2012). Indeed, the twitch properties of the muscle evoked by peripheral nerve stimulation are unchanged in this time interval (Van Cutsem et al. 1998; Carroll et al. 2009; Nuzzo et al. 2017). It is therefore assumed that much of the increase in muscle force is attributable to neural adaptations. Transcranial magnetic stimulation studies (Carroll et al. 2002; Jensen et al. 2005; Weier et al. 2012; Nuzzo et al. 2017), recordings of individual motor units (Van Cutsem et al. 1998; Vila‐Chã et al. 2010) and recordings of electromyogram (EMG) activity (Hakkinen & Komi, 1983; Aagaard et al. 2002a; Balshaw et al. 2016; Del Vecchio et al. 2018b) have been used to suggest the types of neural adaptations elicited by strength training. Despite such studies, the neural changes at the motor unit level underlying the increase in muscle force after strength training are largely unknown (Duchateau et al. 2005).
Neurophysiological investigations at the single motor unit level report an increase in the discharge rate of the first four action potentials during isometric ballistic contractions (Van Cutsem et al. 1998), an increase in the discharge rate of motor units during submaximal isometric contractions (Vila‐Chã et al. 2010) and an increase in peak discharge rate during maximal but not submaximal contractions (Kamen & Knight, 2004). In these studies, however, the results were based on pooling the motor unit data across subjects together as a result of the limited number of identified motor units recorded in each subject. Critically, it was not possible to identify the specific adaptations exhibited by individual motor units because these previous studies did not track the motor units at the same relative force levels (Van Cutsem et al. 1998) and for the full recruitment range of a muscle (Vila‐Chã et al. 2010). Therefore, the influence of several weeks of strength training on the discharge characteristics of motor units at the population level is currently unknown.
It has recently been shown that the activity of large populations of motor units can be identified (Holobar & Zazula, 2007; Muceli et al. 2015; Farina et al. 2016; Negro et al. 2016; Del Vecchio et al. 2018c) and tracked over multiple sessions (Martinez‐Valdes et al. 2017) during relatively strong voluntary contractions (70% of maximum, Holobar et al. 2014; Del Vecchio et al. 2017, 2018b). Once the reliability of the tracking procedure had been confirmed, the present study aimed to quantify the change in discharge characteristics of the same motor units in tibialis anterior after a 4 week strength training intervention with the dorsiflexor muscles. It was hypothesized that the increase in muscle force produced by the training programme would be accompanied by significant adaptations in the discharge characteristics of the motor units.
Methods
Participants and ethical approval
Twenty‐eight recreationally active young men were enrolled in the study. The volunteers were free from any neuromuscular disorder and previous lower limb surgery. The study was approved by the local Ethical Committee of the University of Rome ‘Foro Italico’ (approval no. 44 680) and conformed to the standards set by the Declaration of Helsinki. An informed consent outlining experimental procedures and potential side effects was signed by all the volunteers before their involvement. After familiarization, participants were assigned to an intervention (INT, n = 14) or to a control (CON, n = 14) group, which were matched for anthropometric characteristics, physical activity habits and baseline levels of muscle strength. Volunteers were not engaged in lower‐body strength training during the 6 months prior to the study and had an overall physical activity habit that involved light aerobic exercise of maximum twice per week. Three participants dropped out due to personal reasons (e.g. time demands), which resulted in 25 participants (INT, n = 13; CON, n = 12) completing the study.
Overview of the study
Volunteers were asked to be available for 15 laboratory visits within a 7 week period. In weeks 1 and 2, participants visited the laboratory on two occasions, 3–5 days apart. The first visit involved a thorough explanation of testing procedures, protocols, and a familiarization with both maximal voluntary contractions (MVCs) and submaximal trapezoidal contractions (ramp contractions) of the dominant leg (self‐reported). No measurements were made during the first visit. The second visit was used to obtain baseline measurements, which included the recordings of ankle dorsiflexion forces during maximal and submaximal voluntary contractions and high‐density surface EMG (HDsEMG) recordings from the tibialis anterior (TA) muscle. Weeks 3–6 comprised the 4 weeks (three times a week) of unilateral isometric strength training of ankle dorsiflexors. Participants of the CON group maintained their physical activity habits during the 4 weeks. In week 7, participants repeated the baseline measurements.
Experimental procedures
The measurements were performed in the second and the seventh week within 7 days before the start of the training and 2–3 days after the final training session, respectively. The subjects were asked to refrain from strenuous exercise and caffeine consumption in the 48 and 24 h prior the testing sessions, respectively. Additionally, diurnal variability in muscle contractility was minimized by performing the two sets of measurements at the same time of day (Racinais et al. 2005). After a standardized warm‐up, the main task involved the recordings of muscle force and HDsEMG from the TA muscle of the dominant leg during isometric maximal and submaximal voluntary contractions. The warm‐up comprised eight isometric contractions with the dorsiflexors at different intensities of the perceived maximal voluntary force (4 × 50, 3 × 70, 1 × 90%), each separated by 15–30 s. As established in the familiarization session, the participants were asked to focus on the movement of the ankle dorsiflexors and to isolate the intervention/activation of TA as much as possible during the warm‐up contractions.
Subsequently, the participants performed three or four mVCs with 30 s of rest between trials. The peak force achieved in the preceding MVC was displayed on a monitor. Participants were instructed to ‘push as hard as possible’ for 3–5 s and received strong verbal encouragement to achieve the maximum during each contraction. The maximal voluntary force (MVF) was denoted as the greatest force recorded during any of the MVCs and was used as a reference to determine the target forces for the submaximal contractions. Approximately 5 min later, the participants performed trapezoidal contractions that involved a linear increase in force to a target value at a rate of 5% MVF s−1, 10 s of constant force at the target force, and a linear decrease in force back to the resting value at the same rate as the increase phase. Two trials were performed at each of the three target forces (35%, 50% and 70% of MVF). The trapezoidal contractions were performed randomly and were separated by 3–5 min of recovery.
Training protocol
To maximize neural adaptations, the training intervention combined rapid and sustained contractions, as reported previously (Balshaw et al. 2016), and similar approaches have been shown to augment the discharge rate of motor units (Van Cutsem et al. 1998; Vila‐Chã et al. 2010). The 4 week training intervention comprised 12 supervised training sessions (∼30 min each) that were separated by 48–72 hours. Each training session began with a standardized warm‐up of submaximal isometric contractions with the ankle dorsiflexors (2 × 50, 2 × 70 1 × 90% of perceived MVF) followed by three MVCs to determine the submaximal training intensities. After the MVCs, participants performed 40 maximal ballistic contractions (Van Cutsem et al. 1998) with the ankle dorsiflexors of the dominant leg (four sets of 10 repetitions). Each series lasted 60 s with 1 min of recovery between sets. Similar to the baseline measurements, participants were instructed to avoid pre‐tension or counter‐movement actions and to exceed a horizontal target on a monitor positioned at 75% of their MVF ‘as fast and as hard as possible’ for ∼1 s and rest for 5 s between contractions. Four minutes after the ballistic contractions, the participants performed 30 sustained isometric ramp contractions with the dorsiflexors of the dominant leg (three sets of 10 repetitions). Each series lasted 60 s with 2 min of recovery between sets. The target force during the sustained (ramp) contractions was 75% MVF at a rate of 37.5 mVF s−1 (2 s) and a with a steady state phase of 3 s. After the plateau phase, the subjects were instructed to relax with a 2 s rest between contractions.
Force signal recording
The experimental set‐up comprised a custom‐made ankle ergometer (OT Bioelettronica, Turin, Italy) that was fixed to an examination table with two adjustable straps. Participants were seated on the table with the dominant leg secured with straps (∼3 cm width) at the foot, ankle and knee. The hip was flexed at ∼120° (180° = supine position), the knee extended to ∼180° (supine position) and the ankle was placed at ∼100° (90° = perpendicular to the tibia) of plantar flexion. The foot and the ankle were held in place with Velcro straps on an adjustable footplate that was connected in series with a calibrated load cell (CCt Transducer s.a.s, Turin, Italy). The foot strap was placed over the distal third of the metatarsals and, similar to the ankle strap on the foot dorsum, was positioned perpendicular to the tibia. The knee strap rested above the patella. The non‐dominant leg rested on the massage table. The signal recorded with the force transducer was amplified (200×) and sampled at 2048 Hz with and external analogue‐to‐digital converter (EMG‐Quattrocento, OT Bioelettronica, Turin, Italy). The force signal was recorded with the software OTbiolab (OT Bioelettronica) and synchronized with the EMG. Feedback of the force signal was provided with a custom LabVIEW software (LabVIEW 8.0; National Instruments, Austin, TX, USA) and displayed on a monitor positioned at a distance of 1 m from the participants’ eyes. The visual gain was kept constant at 88 × 88 px/% MVF.
HDsEMG recordings
HDsEMG signals were recorded from the TA with two semi‐disposal adhesive grids of 64 electrodes each [13 rows × five columns; gold‐coated; diameter 1 mm; inter‐electrode distance (IED) 8 mm; OT Bioelettronica]. After skin preparation (shaving, light skin abrasion, cleansing with 70% ethanol), the perimeter of the muscle was identified through palpation by an expert operator, and its profile was marked with a surgical pen. The orientation of the grids was based on the recordings obtained with a dry array of 16 electrodes (silver bars 5 mm long; 1 mm thick; IED: 5 mm; OT Bioelettronica) that identified the location of the main innervation zone of TA and estimated the direction of the fibres in the distal portion of the muscle.
The distal innervation zone was identified by placing the linear array parallel to the lateral margin of the tibia, as described in Del Vecchio et al. 2017, 2018a, and by identifying the point of inversion in propagation direction of the action potentials along the electrode column. Once the innervation zone was located, the anatomical direction of the muscle fibres was estimated by confirming a clear propagation of the action potentials along the array without significant changes in the shape of the waveforms. One grid was placed over the distal portion of TA, with the fourth row of electrodes positioned over the innervation zone and the first column aligned to the direction of muscle fibres. The other grid was placed proximally over the muscle belly and covered most of the TA proximal area.
The adhesive grids were attached to the surface of the muscle by means of disposable bi‐adhesive foam layers (SpesMedica, Battipaglia, Italy). The skin‐electrode contact was optimized by filling the cavities of the adhesive layers with conductive gel (SpesMedica). A strap electrode that was dampened with water and positioned on the styloid process of the ulna was used as ground electrode, whereas two reference electrodes, one for each grid, were placed on the tibial tuberosity and on the medial malleolus of the dominant leg. To replicate the electrode position before and after the intervention, the location of the grids was marked with a surgical skin marker after each measurement and training session. The HDsEMG signals were recorded in monopolar mode and converted to digital data by means of a 16 bit multichannel amplifier (EMG‐Quattrocento, 400 channel EMG amplifier; OT Biolelettronica; 3 dB, bandwidth 10–500 Hz). The HDsEMG signals were amplified (150×), sampled at 2048 Hz and bandpass filtered (10–500 Hz) before being stored for offline analysis.
Force and high‐density EMG analysis
The force signal was converted to newtons (N) and the offset was removed by gravity compensation. The signal was low‐pass filtered with a fourth‐order, zero‐lag Butterworth filter with a cut‐off frequency of 15 Hz. Only trapezoidal contractions without any counter‐movement action or pre‐tension were analysed (Del Vecchio et al. 2018c). Before being decomposed into individual motor unit action potentials, the monopolar EMG recordings were bandpass filtered at 20–500 Hz (second‐order, Butterworth). The HDsEMG signals were decomposed with the convolutive blind source separation method (Holobar & Zazula, 2007). This decomposition procedure can identify motor unit discharge times over a broad range of forces (Holobar et al. 2014; Del Vecchio et al. 2017). An experienced investigator manually analysed all the identified motor units and retained only those characterized by a high pulse‐to‐noise ratio (Holobar et al. 2014; Negro et al. 2016). Motor units with a pulse‐to‐noise ratio <30 dB or with discharge times separated by more than 2 s were excluded from analysis (Holobar et al. 2014; Del Vecchio et al. 2018d).
The recruitment and derecruitment thresholds (force value in % MVF corresponding to the first/last motor unit spike, respectively) and the average discharge rate of each motor unit were computed from the series of discharge times identified by decomposition. The average discharge rate for each motor unit was assessed during the recruitment phase (i.e. the average of the first four action potentials), during the plateau (i.e. the average of the first 10 action potentials) and at derecruitment (i.e. the average of the last four action potentials). The interspike interval (the time between consecutive motor unit action potentials in ms) was the assessed during the plateau phase of the contraction (∼10 s). The input–output gain of the motor neurons was estimated by computing the change in motor unit discharge rate during the plateau relative to that at recruitment (∆DR) as a function of the change in force from recruitment to the plateau phase (∆F). This analysis corresponds to an estimate of the input‐output of the motor neuron pool. Modification in the ∆F – ∆DR relationship implies a change in the gain of motor neurons when the system requires force generation.
Motor units were tracked across the intervention (before and after) with the approach described in Martinez‐Valdes et al. (2017). Briefly, motor unit tracking was based on a correlation analyses of the motor unit action potential, which was extracted by spike‐triggered averaging from the HDsEMG signals at the discharge times of the motor units identified by blind‐source separation (Farina et al. 2002; Del Vecchio et al. 2017, 2018c). The motor unit action potentials with high correlation values (>0.7) were visually inspected.
Statistical analysis
The Shapiro–Wilk test was used to assess the normality of distribution of the data, before within‐group and between‐group comparisons. Similarly, when needed, the assumption of sphericity was verified by Mauchly's test and Greenhouse‐Geisser correction was applied when the assumption was violated. Most of the variables included in the study exhibited a normal distribution. When this condition was satisfied, multiple one‐way ANOVAs were conducted to examine between‐group differences at baseline. Non‐parametric independent t tests (Mann–Whitney U test) were performed when the data were not normally distributed.
Changes in maximal voluntary force, recruitment threshold and derecruitment threshold were examined with a two‐way (time: before vs. after; group: INT vs. CON) repeated‐measures ANOVA. When significant interactions were found, a Bonferroni correction was applied to account for multiple comparisons. Three‐way (time: before vs. after; group: INT vs. CON; phase of the trapezoidal contraction: recruitment, plateau, derecruitment) repeated measures ANOVAs were performed to assess relative and absolute changes in mean discharge rate. Similarly, t tests with Bonferroni correction were implemented when appropriate.
Effect sizes were calculated as partial eta squared from the ANOVA (Cohen, 1988). In addition, a Pearson product‐moment correlation was computed. The Pearson P value was used to assess the significance of the estimates of synaptic input to motor neurons. All statistical analyses were performed using SPSS, version 23.0 (IBM Corp., Armonk, NY, USA). For all statistical comparisons, P < 0.05 was considered statistically significant. In the text, the results are reported as the mean ± SD.
Results
Anthropometrics
There were no statistically significant differences at baseline between the two groups with respect to age, anthropometric characteristics, habitual levels of physical activity and peak force during a maximal voluntary contraction with the dorsiflexor muscles (Table 1).
Table 1.
Anthropometric characteristics, habitual levels of physical activity, and peak force during a maximal voluntary contraction with the dorsiflexor muscle for control and strength training groups at baseline
| Group | |||
|---|---|---|---|
| INT | CON | ||
| Variables | (n = 12) | (n = 13) | P value |
| Age (years) | 23.9 ± 2.9 | 25.1 ± 2.9 | 0.228 |
| Height (m) | 1.77 ± 0.08 | 1.78 ± 0.06 | 0.740 |
| Body mass (kg) | 74.07 ± 8.97 | 73.32 ± 8.03 | 0.828 |
| Body mass index (kg m−2) | 23.42 ± 2.17 | 22.93 ± 1.81 | 0.548 |
| IPAQ score (MET min week−1) | 2624 ± 1515 | 2161 ± 1128 | 0.542 |
| MVF (N) | 289.37 ± 63.92 | 299.20 ± 40.62 | 0.654 |
Data reported as the mean ± SD. IPAQ, International Physical Activity Questionnaires; MET, metabolic equivalent of task. Between‐group comparisons were performed with one‐way ANOVAs.
Motor unit decomposition and tracking accuracy
Figure 1 shows the force trajectory and the accompanying high‐density EMG from which two example motor unit action potentials were obtained during the decomposition analysis. In total, 2560 motor units were identified before and after the intervention from all subjects. The average number (mean ± SD across subjects and contractions) of tracked motor units per subject in each contraction before and after training was 19.5 ± 9.0. Figure 2 A and B shows the number and distribution of the identified motor units as a function of recruitment threshold for each ramp contraction (35%, 50% and 70% MVF) and testing condition (before and after training, Fig. 2 A and B) for the control and strength‐training groups. Of these identified motor units, 30% were tracked across sessions (Fig. 2 C and D). There were fewer motor units identified at 70% MVC in the training group as a result of the increase in the number of superimposed motor unit action potentials in the interference signal (see below). However, there were no significant between‐group differences in the overall number of identified motor units before and after the 4 week intervention (ANOVA, P = 0.42).
Figure 1. Experimental setup overview and motor unit decomposition.
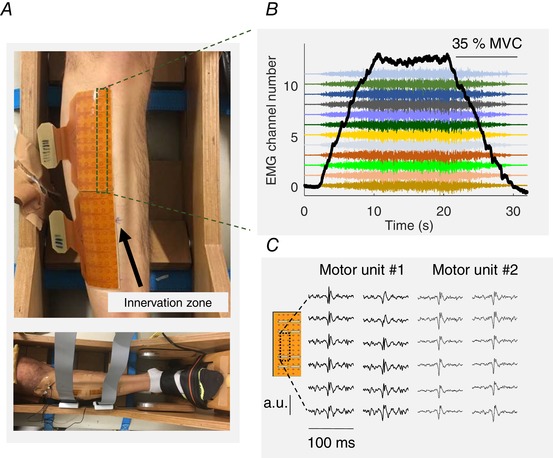
A, two high‐density grids of electrodes placed over the tibialis anterior muscle (64 electrodes in each grid). B, representative trapezoidal ramp isometric contraction (force signal in black) with the simultaneous recorded high‐density electromyogram (monopolar recordings). Only one column of the grid (indicated with a dashed rectangle) is shown. C, an example of two motor unit action potentials extracted from the decomposition analysis. The location of the motor action potential is indicated by the dashed rectangle.
Figure 2. Number of identified motor units as a function of recruitment threshold and target force.
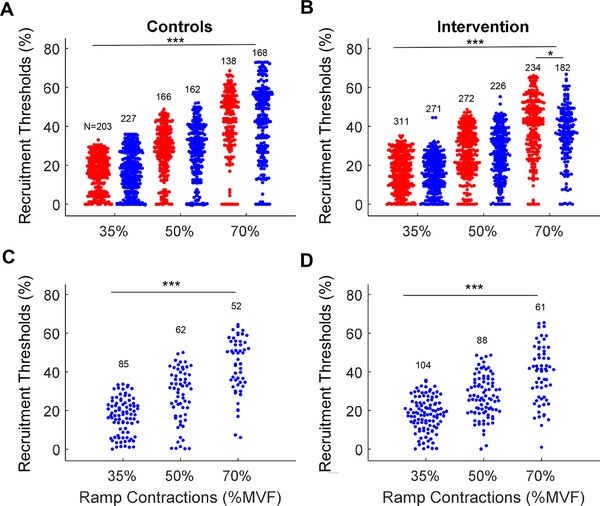
Swarm plots of all the motor units identified for the control (A) and strength‐training (B) groups. The blue and red dots represent the motor unit recruitment thresholds (y‐axis) identified at the start and end of the intervention, respectively. The three target forces (35%, 50% and 70% of maximal voluntary force, MVF) are shown on the x‐axis. C and D, the average recruitment thresholds of the motor units that were tracked at the start and the end of the intervention, for both the control (C) and strength‐training (D) groups. * P < 0.05, *** P < 0.001.
Figure 3 shows an example of the reliability of the motor unit tracking technique. This analysis is based on the correlation value of the two‐dimensional action potential waveforms (see Methods) (Martinez‐Valdes et al. 2017). The motor unit discharge times (Fig. 3 A–D) as identified by the decomposition algorithm were used as triggers for extracting the action‐potential waveforms from the interference signals (Fig. 3 E–F). The average two‐dimensional correlation for the action‐potential waveforms tracked before and after the intervention was 0.8 ± 0.1 and this was not influenced by the training programme (ANOVA, P = 0.38). The ability to identify the same motor units across sessions indicates high accuracy in the decomposition and tracking procedures.
Figure 3. Discharge times for motor units across the 4‐week intervention.
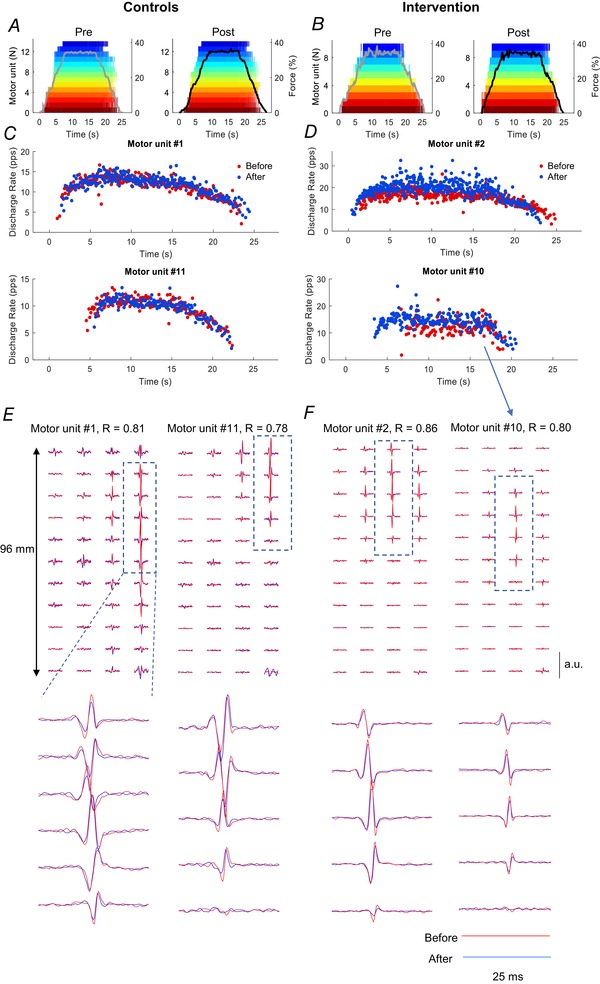
Discharge times for motor units that were tracked across the 4 week intervention in one subject from the Control group (left column) and one subject from the strength‐training group (right column). A and B, force exerted by the ankle dorsiflexors (grey and dark lines, before and after the intervention, respectively) during an isometric contraction up to 35% of maximal voluntary force. Each colour represents the discharge times of the same motor unit across sessions. Note the preservation of recruitment and decruitment order across session for the tracked units. C and D, instantaneous discharge rates for two representative motor units from the two subjects during the trapezoidal contraction. E and F, motor unit action potentials obtained from bipolar high‐density EMG signals corresponding to the motor units displayed in (C) and (D) (#1 and #11 for the control subject and #2 and #10 for the subject in the strength‐training group). The columns and rows represent the dimensions of the high‐density electrode. The motor unit signatures were extracted by spike‐triggered averaging from the discharge times shown in (A) and (B). Each trace comprising two waveforms, one from before the intervention (blue) and one after the intervention (red). The two lines are almost indistinguishable, which results in a high two‐dimensional correlation coefficients (r) both before and after the 4 week intervention.
Neuromechanical changes after strength training
After 4 weeks of strength training, the ankle dorsiflexor muscles with isometric contractions increased the maximal voluntary force from 289 ± 64 to 329 ± 61 N (interaction: time × group; P = 0.006, ηp² = 0.280), wheres no changes were observed for the control group (from 299 ± 41 to 304 ± 35 N). Based on measurements derived from all three submaximal target forces, the absolute and normalized recruitment thresholds decreased significantly after strength training when averaged across motor units and subjects (Fig. 4 A). The absolute value averaged across motor unit and subjects declined from 77 ± 24 to 71 ± 23 N (interaction: time × group; P = 0.042, ηp² = 0.131) (Fig. 4 E) and the relative value decreased from 26 ± 5 to 21 ± 5 (% MVF) (interaction: time × group; P = 0.003, ηp² = 0.321) (Fig. 4 F). Conversely, the absolute derecruitment threshold averaged across motor units and subjects increased after training from:79 ± 25 to 97 ± 31 (interaction: time × group; P = 0.017, ηp² = 0.225) (Fig. 4), although the difference in the relative value after training was not statistically significant from before training (P = 0.152) (Fig. 5).
Figure 4. Scatter plots of the recruitment thresholds.
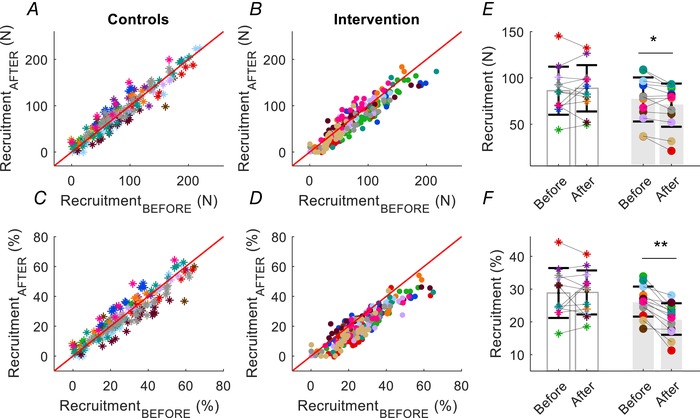
Scatter plots of the recruitment thresholds for the same motor units in each participant in the control (asterisks) and strength‐training groups (intervention, filled circles). Each subject is indicated by a different colour. The recruitment thresholds are shown before (on the ordinate) and after (on the abscissa) the intervention. A and B, upper: absolute recruitment thresholds (N) for all the identified motor units. C and D, lower: normalized recruitment threshold expressed as a percentage of maximal voluntary force (% MVF). Average values for absolute (E) and normalized (F) motor unit recruitment thresholds across all motor units for each subject for the control and strength‐training groups (grey bars). * P < 0.05, ** P < 0.01. Data are reported as the mean ± SD.
Figure 5. Scatter plots of the derecruitment thresholds.
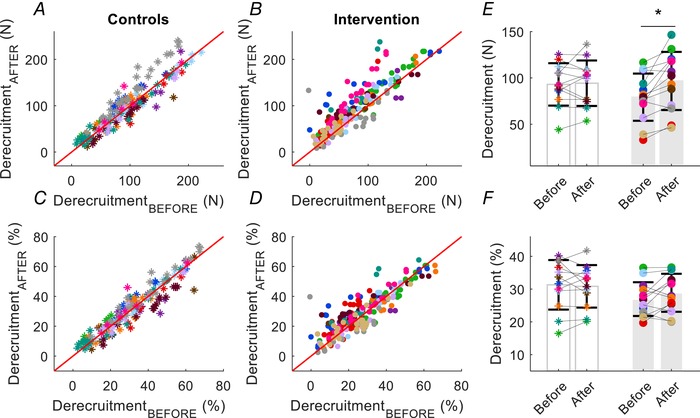
Scatter plots of the derecruitment thresholds for the same motor units in each participant in the control (asterisks) and strength‐training groups (intervention, filled circles). Each subject is indicated by a different colour. The derecruitment thresholds are shown before (on the ordinate) and after (on the abscissa) the intervention. A and B, upper: absolute derecruitment thresholds (N) for all the identified motor units. C and D, lower: normalized derecruitment threshold expressed as a percentage of maximal voluntary force (% MVF). Average values for absolute (E) and normalized (F) motor unit derecruitment thresholds across all motor units for each subject for the control and strength‐training groups (grey bars). * P < 0.05. Data are reported as the mean ± SD.
Because the ramp contractions were normalized to the maximal voluntary force, the rate of increase in force during the trapezoidal contraction was steeper after strength training. As a result of the influence of the rate of force development on recruitment threshold (Desmedt & Godaux, 1977), we assessed the association between the changes in the rate of force development and recruitment threshold force. The correlation was not statistically significant (r = 0.2, P = 0.28). Moreover, the normalized recruitment threshold decreased for all subjects (Fig. 4 D–F), even for those who exhibited small increases in maximal voluntary force.
The decrease in motor unit recruitment threshold was accompanied by an increase in the discharge rate during the plateau phase of the trapezoidal contraction (average of the first nine interspike intervals) for the strength‐training group (interaction: time × group; P = 0.0008, ηp² = 0.419). The average increase in motor unit discharge rate after training across the three submaximal target forces for all subjects was 3.3 ± 2.5 pps (Fig. 6 D). A similar result was found for the motor units that were not tracked across sessions (Fig. 6 G). By contrast, there were no statistically significant differences in the discharge rate at recruitment or decruitment for the motor units that were tracked (Fig. 6 C and E) and those that were not tracked (Fig. 6 F and H).
Figure 6. Changes in motor unit discharge rate.
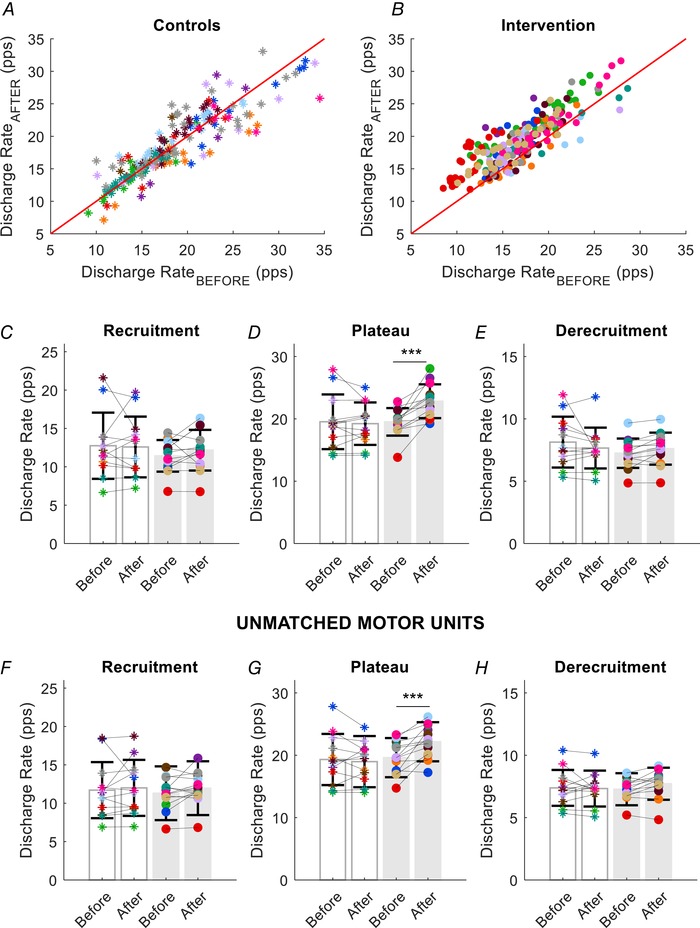
Scatter plots of the discharge rates for the same motor units in each participant in the control (A, asterisks) and strength‐training groups (B, intervention, filled circles). Each subject is indicated by a different colour in all panels. C, average discharge rate at recruitment (first three interspike intervals) for each subject and group (grey bars for the strength‐training group). D, average discharge rate (first nine interspike intervals) during the plateau phase of the trapezoidal contraction. There was a significant increase in discharge rate during the plateau after strength training. E, average discharge rate (last three interspike intervals) at derecruitment for each subject in the control and strength‐training groups. Motor unit discharge rates are shown at recruitment (F), plateau phase (G) and at derecruitment (H) for all the unmatched units. Similar to the matched units, the discharge rate for the strength‐training group increased only during the plateau phase of the ramp contraction. Data are reported as the mean ± SD. *** P < 0.001.
The strength‐training protocol increased mean discharge rate of the motor units at all three target forces: 35% MVF (main effect for time; p = 0.015, ηp² = 0.402); 50% MVF (P = 0.009, ηp² = 0.450); and 70% MVF (P = 0.001, ηp² = 0.599). Moreover, when the difference in discharge rate between the target and recruitment forces was graphed relative to recruitment threshold, the distribution was similar for low‐ and high‐threshold motor units (Fig. 7). Additionally, the distributions of interspike intervals exhibited an increase in both skewness (before: 0.397; after: 0.456) and kurtosis (before: 3.117; after: 3.253) when grouping all subjects and force levels (Fig. 8 B and C). A representative example is also shown for the motor units of one subject during a 50% ramp contraction (Fig. 8 D).
Figure 7. The difference in motor unit discharge rate (before and after 4 weeks of strength training) during the plateau phase of the trapezoidal contraction relative to normalized recruitment threshold after training (% MVF).
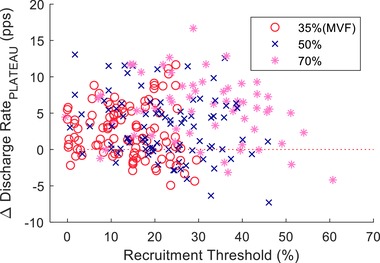
Each data point indicates one motor unit at one of the three target forces (35%, 50% and 70% MVF). The motor unit discharge rate was obtained by averaging the first nine interspike intervals at the start of the plateau phase.
Figure 8. Distribution of motor unit interspike intervals.
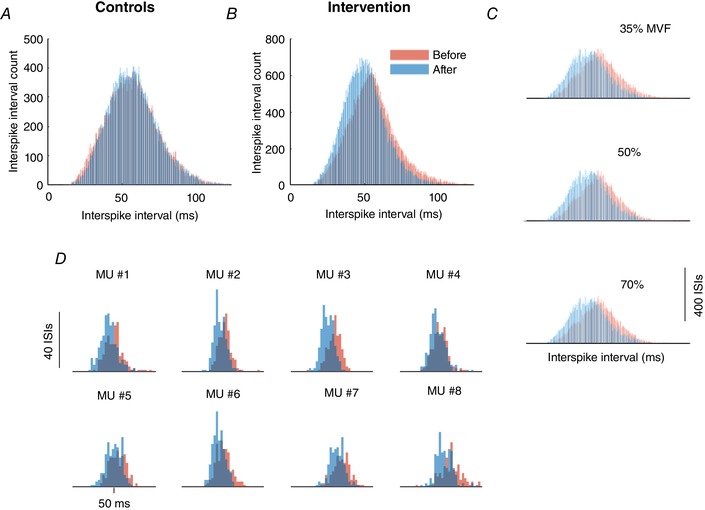
Histograms of motor unit interspike intervals (ISIs) are shown for the control (A) and strength‐training (B) groups at the start (red) and end (blue) of the intervention. C, ISI histograms for the three target forces (35%, 50% and 70% MVF) for the strength‐training group. D, ISI histograms for eight motor units in one representative subject in the strength‐training group.
To assess the influence of the 4 weeks of strength training on the excitatory input to the motor neuron pool, we examined the association between the change in discharge rate during the plateau phase relative to the change in recruitment threshold. The change in discharge rate during the plateau phase was calculated as the difference from the value at recruitment and the change in recruitment threshold force was expressed as the difference from the force during the plateau phase (Fig. 9). The rate of change in normalized discharge rate was similar after training for all motor units (P = 0.39) (Fig. 9 B and D) and when averaged for each subject (P = 0.46) (Fig. 9 E and F). The increase in discharge rate during the plateau phase was therefore not attributable to the increase in force but rather an increase in excitatory synaptic input to the motor neuron pool.
Figure 9. Scatter graphs of the differences in force and discharge rate between the plateau phase for the trapezoidal contraction and recruitment threshold during the ramp contraction.
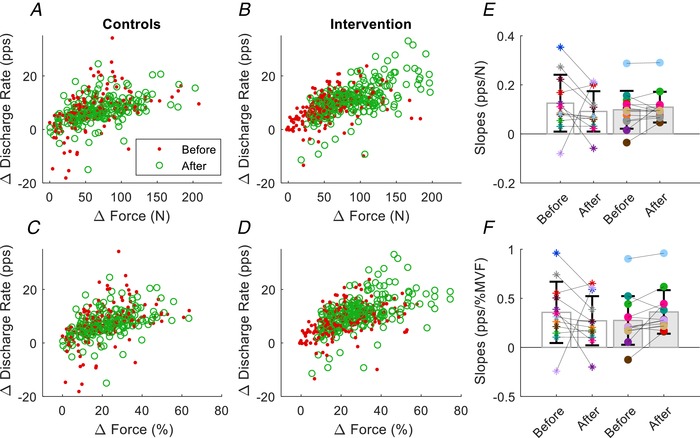
Each circle represents one motor unit. A and B, absolute recruitment thresholds for the two groups. C and D, relative recruitment threshold for the two groups. E, rate of change in absolute (pps/N) and relative (F, pps/% MVF) discharge rate for each subject (open bar for the controls). Data are reported as the mean ± SD.
Discussion
The main finding of the present study was that an increase in the maximal force for the dorsiflexor muscles during a voluntary contraction after 4 weeks of training with isometric contractions was accompanied by a decrease in the relative recruitment threshold and an increase in discharge rate during submaximal contractions for the same motor units. Moreover, the results suggest that the gains in muscle strength may be attributable to an increase in the net excitatory synaptic input or to adaptations in the properties of the motor neurons.
The force that a muscle exerts during a voluntary contraction depends on the amount of motor unit recruitment and rate coding and the mechanical properties of the muscle units. The relative contributions of these attributes to increases in muscle strength change across the course of a strength‐training programme, with initial strength gains reflecting adaptations in motor unit recruitment and rate coding (Duchateau et al. 2005). However, aside from some reports of parallel increases in muscle force and surface‐EMG amplitude during the early stage of strength training (Hakkinen & Komi, 1983; Aagaard et al. 2002a), there is little evidence on the specific adaptations in motor unit recruitment and rate coding underlying the initial gains in muscle strength.
One strategy that has been used to identify the neural adaptations associated with gains in muscle strength has been to quantify the amplitude of the responses evoked by stimulating the cortex and the corticomedullary tract (Carroll et al. 2002, 2009; Weier et al. 2012; Nuzzo et al. 2017). Although these studies have found some changes at the cortical level after several weeks of strength training, the approach does not provide information about adaptations at the motor unit level. Indeed, relatively little is known about the adaptations in motor unit recruitment and rate coding that occur during strength training. One study found that an increase in rate of force development during an isometric ballistic contraction with the dorsiflexors after 12 weeks of dynamic training was accompanied by substantial increases in the discharge rate of motor units in TA at the onset of the ballistic contraction (Van Cutsem et al. 1998). Another study similarly reported significant increases in the discharge rate of motor units in vastus medialis and vastus lateralis during submaximal isometric contractions after 6 weeks of strength training the knee extensors with dynamic contractions (Vila‐Chã et al. 2010). By contrast, another study found that the increase in discharge rate of motor units in vastus lateralis after 6 weeks of training with dynamic contractions was only evident at the maximal target force (100% MVF) and not submaximal forces (Kamen & Knight, 2004). After 2 weeks of force modulation training (contractions up to 60% MVC), Patten & Kamen (2000) reported a reduced motor unit discharge rate in the range 30–60% MVF. In another study, the discharge rate after 6 weeks of strength training at maximal force increased on average from ∼52 to 56 pps (Patten et al. 2001), which is similar to the increase in ∼3 pps found in the present study when averaged across all contraction conditions. Potential explanations for the differences in results across previous studies are the use of different training protocols and the focus on group comparisons.
In the present study, we found that the discharge rate of the same motor units in tibialis anterior was increased during submaximal isometric contractions after 4 weeks of strength training of the dorsiflexor muscles. The decomposition technique employed in the present study has been validated in the tibialis anterior muscle at forces up to 70% of maximum (Holobar et al. 2014; Farina et al. 2016; Negro et al. 2016; Del Vecchio et al. 2017). Moreover, the same set of motor units was identified after training, thus allowing a direct comparison of motor unit properties without the limitations of randomly sampling different motor units before and after training, as carried out previously (Van Cutsem et al. 1998; Vila‐Chã et al. 2010, 2012; Beck et al. 2011; Stock & Thompson, 2014). Without tracking the same motor units, comparisons of motor unit properties are based on group differences rather than at the level of individual subjects. The technical capacity to track motor units across sessions provided us with a unique perspective on the neural adaptations elicited by strength training.
The increase in discharge rate during the plateau phase of the trapezoidal contraction was exhibited by most motor units at the three target forces (Fig. 7). Although the increase in discharge rate was accompanied by statistically significant decreases in both the absolute and relative recruitment‐threshold forces of the motor units, the differences in absolute thresholds before and after training were small (Fig. 4) and may have been within the boundaries of the measurement error. Moreover, the absolute rate of force development, which influences absolute recruitment thresholds (Desmedt & Godaux, 1977; Del Vecchio et al. 2018d), was slightly different before and after training as a result of the change in maximal force. However, the change in relative recruitment thresholds was substantial and consistent across all subjects in the intervention group and most of the tracked motor units (Fig. 4). This reduction in relative recruitment‐threshold force indicates that motor units were recruited earlier during the isometric contraction relative to the maximal force to produce the prescribed force trajectory (ramp‐up during the trapezoidal contraction). Our findings of a compressed recruitment range are consistent with those of Patten & Kamen (2000) who found that motor unit recruitment thresholds were reduced after a force‐modulation training programme in a cohort of young but not older adults. Critically, the change in relative recruitment thresholds with minimal changes in absolute thresholds excludes the possibility that there was a reduction in motor unit twitch forces because similar absolute forces were reached with the same neural activation in that it was the neural activation relative to maximal force that changed with training.
Another possible contributor for the change in relative recruitment threshold would involve an increase in the time from the detection of the activation signal (motor unit action potentials) to the force being transmitted to the skeletal structures (i.e. the electromechanical delay). If this time increased, motor units would have to be recruited sooner to achieve the prescribed force trajectory. Although the latency between neural activation and force generation is considered a constant property of a muscle, we have recently shown that this delay is modulated widely during voluntary contractions as a result of differences in motor unit properties within a muscle (Del Vecchio et al. 2018d). Training at high forces and speed reduces the musculotendinous stiffness and thus the neuromechanical delay (Grosset et al. 2009; Del Vecchio et al. 2018d). The decrease in muscular stiffness may therefore account to the decrease in recruitment thresholds after training, although this possibility should be examined explicitly.
By contrast to the reduction in recruitment‐threshold force, there was an increase in the absolute force (N) at which motor units were derecruited. This meant that the prescribed force trajectory during the ramp‐down contraction was accomplished by derecruiting motor units earlier in the contraction. However, the training program did not change the relative force (% MVF) at which motor units were derecruited (Fig. 5 F). When combined with the absence of a change in discharge rate at derecruitment, these results indicate that there may have been no changes in the control of force during the ramp‐down isometric contraction after the training programme. However, these results may be the consequence of the greater number of motor units being recruited at the same relative forces. A more compressed recruitment range implies a greater number of low‐threshold motor units that can sustain the decrease in force because of the passive force contributed by the non‐contractile elastic tissues associated with the high‐threshold (derecruited) motor units. This interpretation is consistent with the change in musculotendinous stiffness after training at high forces. The decrease in muscular stiffness would increase the musculotendinous compliance by expanding the relaxation time of the motor unit twitches and thus decreasing the derecruitment thresholds.
The increase in discharge rate during the plateau phase of the trapezoidal contraction and the marked decline in the relative recruitment‐threshold force suggests that one adaptation elicited by the training programme was an increase in the net excitatory input to the motor neuron pool for the same relative forces. Consistent with this interpretation, we found that the relative increase in discharge rate during the plateau was explained by the increase in the absolute force difference between recruitment and plateau for the tracked motor units (Fig. 9). The observation that the change in force relative to the change in discharge rate were not modified by training indirectly indicates that the input–output relationship of the motor neurons did not change and that the changes in discharge rate with training were induced by a greater difference between the absolute target force and the recruitment force following training. This finding is in accordance with the observation that the responses to stimulation of the corticomedullary tract were unchanged by 4 weeks of strength training, thus suggesting more effective modulation of spinal motor neurons by the motor cortex (Nuzzo et al. 2017). The absence of a difference in the relationship between discharge rate and force suggests that intrinsic properties of motor neurons were probably not changed with training, although this relationship is only indirect and, therefore, changes at the motor neuron level cannot be excluded. Indeed, strength training increases the amplitude of the Hoffmann reflex (Aagaard et al. 2002b), which suggests adaptations in motor neuron excitability, presynaptic modulation of Ia afferent feedback, or both. Animal models also suggest changes in ionic conductances of the motor neuron and increases in their excitability after training (Gardiner et al. 2006).
We studied the adaptations of large populations of motor units after a 4 week isometric strength training programme. Strength training decreased the recruitment threshold and increased the discharge rate of the same motor units when matching the same relative force. The results from the present study demonstrate the impact of strength training on the control of motor unit recruitment and rate coding at the motor unit population level. Taken together, these results provide compelling evidence that the output from the spinal cord during prescribed actions is augmented after one month of strength training.
Limitations
Although, in the present study, we reveal for the first time the adaptations of populations of motor units tracked before and after training, it is not possible to directly infer the adaptations in the spinal/central circuitries determining these changes. For example, modifications in inputs from recurrent inhibitory/excitatory interneurons could change after training. Future studies involving the concurrent measurement of brain activity and spinal output may provide novel insights in the neural adaptations to strength training. Finally, the reliability of the motor unit tracking technique remains to be further examined during longer training interventions.
Additional information
Competing interests
The authors declare that they have no competing interests.
Author contributions
All authors contributed to the conception and design of the work. ADV, AC and MS acquired and analysed the results. ADV drafted the manuscript and plotted the figures. All authors contributed to the interpretation of the results and the revision of the manuscript. All authors have approved the final version of the submitted manuscript for publication and are accountable for all aspects of the work. All persons designated as authors qualify for authorship, and all those who qualify for authorship are listed.
Funding
This work was partly funded by the ERC Advanced grant DEMOVE (267 888) and Proof‐of‐Concept Project Interspine (737 570). F. Negro was funded by the European Union's Horizon 2020 research and innovation programme under the Marie Skłodowska‐Curie grant agreement No 702 491 (NeuralCon).
Acknowledgements
The present study has been awarded the Young Investigator Award at the European College of Sport Sciences in Dublin (2018) for best oral presentation.
Biography
Alessandro Del Vecchio is a research associate at the Department of Bioengineering, Imperial College London. He started his studies at the University of Parma at the Faculty of Medicine with a 5 year degree in Human Movement Sciences. Successively, he completed the doctoral studies at the University of Rome ‘Foro Italico’, focusing on the neural control of muscles. He is interested in the organization of neural networks determining movement and how to improve these networks in healthy and pathological conditions with the use of neurotechnology. Most of his work is currently based on in vivo recordings of motor unit activity during voluntary contractions.

Edited by: Janet Taylor & Richard Carson
Linked articles: This article is highlighted in a Perspectives article by Fuglevand. To read this article, visit https://doi.org/10.1113/JP277683.
References
- Aagaard P, Simonsen EB, Andersen JL, Magnusson P & Dyhre‐Poulsen P (2002a). Increased rate of force development and neural drive of human skeletal muscle following resistance training. J Appl Physiol 93, 1318–1326. [DOI] [PubMed] [Google Scholar]
- Aagaard P, Simonsen EB, Andersen JL, Magnusson P & Dyhre‐Poulsen P (2002b). Neural adaptation to resistance training: changes in evoked V‐wave and H‐reflex responses. J Appl Physiol 92, 2309–2318. [DOI] [PubMed] [Google Scholar]
- Akima H, Takahashi H, Kuno SY, Masuda K, Masuda T, Shimojo H, Anno I, Itai Y & Katsuta S (1999). Early phase adaptations of muscle use and strength to isokinetic training. Med Sci Sports Exerc 31, 588–594. [DOI] [PubMed] [Google Scholar]
- Balshaw TG, Massey GJ, Maden‐Wilkinson TM, Tillin NA & Folland JP (2016). Training‐specific functional, neural, and hypertrophic adaptations to explosive‐ vs. sustained‐contraction strength training. J Appl Physiol 120, 1364–1373. [DOI] [PubMed] [Google Scholar]
- Beck TW, DeFreitas JM, Stock MS & Dillon MA (2011). Effects of resistance training on force steadiness and common drive. Muscle Nerve 43, 245–250. [DOI] [PubMed] [Google Scholar]
- Blazevich AJ, Gill ND, Deans N & Zhou S (2007). Lack of human muscle architectural adaptation after short‐term strength training. Muscle Nerve 35, 78–86. [DOI] [PubMed] [Google Scholar]
- Carroll TJ, Barton J, Hsu M & Lee M (2009). The effect of strength training on the force of twitches evoked by corticospinal stimulation in humans. Acta Physiol 197, 161–173. [DOI] [PubMed] [Google Scholar]
- Carroll TJ, Riek S & Carson RG (2002). The sites of neural adaptation induced by resistance training in humans. J Physiol 544, 641–652. [DOI] [PMC free article] [PubMed] [Google Scholar]
- Cohen J (1988). Statistical power analysis for the behavioral sciences. Lawerence Erlbaum Associates, Hillsdale, NJ. [Google Scholar]
- Van Cutsem M, Duchateau J & Hainaut K (1998). Changes in single motor unit behaviour contribute to the increase in contraction speed after dynamic training in humans. J Physiol 513, 295–305. [DOI] [PMC free article] [PubMed] [Google Scholar]
- Del Vecchio A, Bazzucchi I & Felici F (2018a). Variability of estimates of muscle fiber conduction velocity and surface EMG amplitude across subjects and processing intervals. J Electromyogr Kinesiol 40, 102–109. [DOI] [PubMed] [Google Scholar]
- Del Vecchio A, Negro F, Falla D, Bazzucchi I, Farina D & Felici F (2018b). Higher muscle fiber conduction velocity and early rate of torque development in chronically strength trained individuals. J Appl Physiol 120, 1218–1226. [DOI] [PubMed] [Google Scholar]
- Del Vecchio A, Negro F, Felici F & Farina D (2017). Associations between motor unit action potential parameters and surface EMG features. J Appl Physiol 123, 835–843. [DOI] [PubMed] [Google Scholar]
- Del Vecchio A, Negro F, Felici F & Farina D (2018c). Distribution of muscle fibre conduction velocity for representative samples of motor units in the full recruitment range of the tibialis anterior muscle. Acta Physiol (Oxf) 222, e12930. [DOI] [PubMed] [Google Scholar]
- Del Vecchio A, Ubeda A, Sartori M, Azorin JM, Felici F & Farina D (2018d). Central nervous system modulates the neuromechanical delay in a broad range for the control of muscle force. J Appl Physiol 125, 1404–1410. [DOI] [PubMed] [Google Scholar]
- Desmedt JE & Godaux E (1977). Ballistic contractions in man: characteristic recruitment pattern of single motor units of the tibialis anterior muscle. J Physiol 264, 673–693. [DOI] [PMC free article] [PubMed] [Google Scholar]
- Duchateau J, Semmler JG & Enoka RM (2005). Training adaptations in the behavior of human motor units. J Appl Physiol 101, 1766–1775. [DOI] [PubMed] [Google Scholar]
- Farina D, Arendt‐Nielsen L, Merletti R & Graven‐Nielsen T (2002). Assessment of single motor unit conduction velocity during sustained contractions of the tibialis anterior muscle with advanced spike triggered averaging. J Neurosci Methods 115, 1–12. [DOI] [PubMed] [Google Scholar]
- Farina D, Negro F, Muceli S & Enoka RM (2016). Principles of motor unit physiology evolve with advances in technology. Physiology 31, 83–94. [DOI] [PubMed] [Google Scholar]
- Gardiner P, Dai Y & Heckman CJ (2006). Effects of exercise training on alpha‐motoneurons. J Appl Physiol 101, 1228–1236. [DOI] [PubMed] [Google Scholar]
- Grosset JF, Piscione J, Lambertz D & Pérot C (2009). Paired changes in electromechanical delay and musculo‐tendinous stiffness after endurance or plyometric training. Eur J Appl Physiol 105, 131–139. [DOI] [PubMed] [Google Scholar]
- Hakkinen K & Komi PV (1983). Electromyographic changes during training and detraining. Med Sci Sports Exerc 15, 455–460. [PubMed] [Google Scholar]
- Holobar A, Minetto MA & Farina D (2014). Accurate identification of motor unit discharge patterns from high‐density surface EMG and validation with a novel signal‐based performance metric. J Neural Eng 11, 016008. [DOI] [PubMed] [Google Scholar]
- Holobar A & Zazula D (2007). Multichannel blind source separation using convolution Kernel compensation. IEEE Trans Signal Process 55, 4487–4496. [Google Scholar]
- Jensen JL, Marstrand PCD, Nielsen JB, Lundbye J & Jens B (2005). Motor skill training and strength training are associated with different plastic changes in the central nervous system. J Appl Physiol 99, 1558–1568. [DOI] [PubMed] [Google Scholar]
- Kamen G & Knight CA (2004). Training‐related adaptations in motor unit discharge rate in young and older adults. J Gerontol 59, 1334–1338. [DOI] [PubMed] [Google Scholar]
- Martinez‐Valdes E, Negro F, Laine CM, Falla D, Mayer F & Farina D (2017). Tracking motor units longitudinally across experimental sessions with high‐density surface electromyography. J Physiol 595, 1479–1496. [DOI] [PMC free article] [PubMed] [Google Scholar]
- Muceli S, Poppendieck W, Negro F, Yoshida K, Hoffmann KP, Butler JE, Gandevia SC & Farina D (2015). Accurate and representative decoding of the neural drive to muscles in humans with multi‐channel intramuscular thin‐film electrodes. J Physiol 17, 3789–3804. [DOI] [PMC free article] [PubMed] [Google Scholar]
- Negro F, Muceli S, Castronovo AM, Holobar A & Farina D (2016). Multi‐channel intramuscular and surface EMG decomposition by convolutive blind source separation. J Neural Eng 13, 026027. [DOI] [PubMed] [Google Scholar]
- Nuzzo JL, Barry BK, Jones MD, Gandevia SC & Taylor JL (2017). Effects of four weeks of strength training on the corticomotoneuronal pathway. Med Sci Sports Exerc 49, 2286–2296. [DOI] [PubMed] [Google Scholar]
- Patten C & Kamen G (2000). Adaptations in motor unit discharge activity with force control training in young and older human adults. Eur J Appl Physiol 83, 128–143. [DOI] [PubMed] [Google Scholar]
- Patten C, Kamen G & Rowland DM (2001). Adaptations in maximal motor unit discharge rate to strength training in young and older adults. Muscle Nerve 24, 542–550. [DOI] [PubMed] [Google Scholar]
- Racinais S, Blonc S, Jonville S & Hue O (2005). Time of day influences the environmental effects on muscle force and contractility. Med Sci Sports Exerc 37, 256–261. [DOI] [PubMed] [Google Scholar]
- Seynnes OR, de Boer M & Narici M V (2007). Early skeletal muscle hypertrophy and architectural changes in response to high‐intensity resistance training. J Appl Physiol 102, 368–373. [DOI] [PubMed] [Google Scholar]
- Stock MS & Thompson BJ (2014). Effects of barbell deadlift training on submaximal motor unit firing rates for the vastus lateralis and rectus femoris. PLoS ONE 9, e115567. [DOI] [PMC free article] [PubMed] [Google Scholar]
- Vila‐Chã C, Falla D, Correia MV & Farina D (2012). Adjustments in motor unit properties during fatiguing contractions after training. Med Sci Sports Exerc 44, 616–624. [DOI] [PubMed] [Google Scholar]
- Vila‐Chã C, Falla D & Farina D (2010). Motor unit behavior during submaximal contractions following six weeks of either endurance or strength training. J Appl Physiol 109, 1455–1466. [DOI] [PubMed] [Google Scholar]
- Weier AT, Pearce AJ & Kidgell DJ (2012). Strength training reduces intracortical inhibition. Acta Physiol 206, 109–119. [DOI] [PubMed] [Google Scholar]