

Abstract
Background
Aerobic capacity is a powerful predictor of cardiovascular disease and all‐cause mortality, and it declines with advancing age.
Hypothesis
Since physical activity alters body metabolism, metabolism markers will likely differ between subjects with high vs low aerobic capacities.
Methods
Community‐based participants without physician‐diagnosed heart disease, stroke or cancer underwent same‐day multimodal assessment of cardiovascular function (by echocardiography and magnetic resonance feature tracking of left atrium) and aerobic capacity by peak oxygen uptake (VO2) metrics. Associations between VO2 and cardiovascular and metabolomics profiles were studied in adjusted models including standard covariates.
Results
We studied 141 participants, of whom 82 (58.2%) had low VO2, while 59 (41.8%) had high VO2. Compared to participants with high VO2, participants with low VO2 had more adverse cardiovascular parameters, such as lower ratio of peak velocity flow in early diastole to peak velocity flow in late diastole by atrial contraction of >0.8 (76% vs 35%, adjusted odd ratio [OR] = 4.1, 95% confidence interval [CI] [1.7‐9.5], P = 0.001) and lower left atrial conduit strain (11.3 ± 4.0 vs 15.6 ± 6.1%, adjusted OR = 1.1, 95% CI [1.002‐1.3], P = 0.045). High VO2 was associated with lower accumulation of wide‐spectrum acyl‐carnitines (OR = 0.6, 95% CI [0.4‐0.9], P = 0.013), alanine (OR = 0.1, 95% CI [0.01‐0.9], P = 0.044) and glutamine /glutamate (OR = 0.1, 95% CI [0.01‐0.5], P = 0.007), compared to low VO2.
Conclusion
Elderly adults with low VO2 have adverse cardiovascular and metabolic parameters compared to their counterparts with high VO2. Combined cardiac and metabolomics phenotyping may be a promising tool to provide insights into physiological states, useful for tracking future interventions related to physical activity among community cohorts.
Keywords: aerobic capacity, aging, cardiovascular, elderly, metabolomics
1. INTRODUCTION
Low aerobic capacity is a strong predictor of cardiovascular disease (CVD) and all‐cause mortality,1, 2 while increases in aerobic capacity are associated with increased survival.2 Among aged populations, poor aerobic capacity indicates closer proximity to future declines in cardiovascular and other health indices.3, 4
Physical activity is associated with many physiologic changes including increased aerobic capacity and alterations in fuel metabolism. Exercise‐associated changes in fuel metabolism can be tracked using different methodologies, including metabolomics. Metabolomics has also been used to study biochemical changes that occur in different disease states, particularly insulin resistance, type 2 diabetes and CVD.5, 6, 7, 8 However, there have been fewer studies that examine biochemical changes prior to the development of overt disease.9 While significant achievements have been made in metabolomics research, particularly in providing molecular insights into CVD pathogenesis,8, 10, 11 there is still little data on metabolomics research into physiological states prior to disease development.
We were interested in understanding the relationship between peak oxygen uptake (VO2) and markers of cardiometabolic disease in otherwise healthy elderly subjects. We surmised that levels of endogenous metabolites as well as measures of cardiovascular function may change according to VO2 in otherwise healthy older adults.
This study was designed to characterize the metabolic profile of community elderly adults with high VO2 in relation to their cardiovascular profiles obtained by detailed cardiovascular assessment. These results may help advance mechanistic understanding of how VO2 drives future CVD and mortality risks, providing translatable knowledge for future therapeutics and/or preventative treatments.
2. METHODS
The subjects were recruited from the cardiac aging study (CAS),12 a prospective study initiated in 2014 that examines characteristics and determinants of cardiovascular function in elderly adults.
The study sample consisted of men and women who participated in the baseline CAS 2014 examination who had no self‐reported history of physician‐diagnosed CVD (such as coronary heart disease and stroke) or cancer13. Written informed consent was obtained from participants upon enrolment. The SingHealth Centralized Institutional Review Board (2014/628/C) had approved the study protocol. All methods were performed in accordance with the relevant guidelines and regulations.
All participants were examined and interviewed on one study visit by trained study coordinators. Participants completed a standardized questionnaire that included medical history and coronary risk factors. Hypertension was defined by current use of antihypertensive drugs or physician‐diagnosed hypertension. Diabetes mellitus was defined by current use of antidiabetic agents or physician‐diagnosed diabetes mellitus. Dyslipidaemia was defined by current use of lipid‐lowering agents or physician‐diagnosed dyslipidaemia. Smoking history was defined as ever smokers (former or current smoking) or never smokers. Body mass index was calculated as weight in kilograms divided by the square of height in meters. Sinus rhythm status was ascertained by resting electrocardiogram. Clinical data were obtained on the same day as assessment of echocardiography, cardiac magnetic resonance (CMR) imaging, and serum collection.
2.1. Assessment of peak oxygen uptake (VO2)
We used a validated nonexercise prediction model comprising physical activity questionnaire to estimate peak oxygen uptake, VO2 milliliter/kg/minute (ml/kg/min).14, 15 This simple physical activity questionnaire consisted of age, gender, height, weight, estimated maximum heart rate, frequency of exercise, length of time for each workout, intensity of each workout, waistline diameter, and resting heart rate. The calculator is available online (https://www.worldfitnesslevel.org).
2.2. Transthoracic echocardiography imaging
Echocardiography was performed using ALOKA α10 (Hitachi Medical, Wallington, CT, USA) with a 3.5‐MHz probe. In each subject, standard echocardiography, which included 2‐D, M‐mode, pulse Doppler, and tissue Doppler imaging, was performed in the standard parasternal and apical (apical 4‐chamber, apical 2‐chamber, and apical long) views, and three cardiac cycles were recorded. The left ventricular ejection fraction, left atrial (LA) volume, and LA volume index were measured. The trans‐mitral flow E and A wave with the sample volume position at the tip of the mitral valve leaflets from the apical 4‐chamber view were recorded by Doppler echocardiography. Pulsed wave tissue Doppler imaging was performed with the sample volume at the septal and lateral annulus from the apical 4‐chamber view. The frame rate was between 80 and 100 frames per second. The tissue velocity patterns were recorded and expressed as E′ and A′. All measurements were measured by the same operator (ie, J.I.W.), and the measurements were averaged over three cardiac cycles and adjusted by the interbeat interval.
2.3. CMR imaging
Cine CMR scans were performed using balanced fast field echo sequence (BFFE). All subjects were imaged on a 3 T magnetic resonance imaging system (Ingenia, Philips Healthcare, Amsterdam, Netherlands) with a dStream Torso coil (a maximal number of channels 32). BFFE end‐expiratory breath hold cine images were acquired in multiplanar long‐axis views (2‐, 3‐, and 4‐chamber views). Typical parameters were as follows: Repetition time/ echo time 3/1 ms; flip angle, 45°; in‐plane spatial resolution, 1.0 mm × 1.0 mm to 1.5 mm × 1.5 mm; slice thickness, 8 mm; pixel bandwidth, 1797 Hz; field of view, 300 mm; frame rate, 30 or 40 per cardiac cycle. We developed an in‐house semiautomatic algorithm to track the distance (L) between the left atrioventricular junction and a user‐defined point at the mid posterior LA wall on standard CMR 2‐ and 4‐chamber views.16, 17 Both 2‐ and 4‐chamber views were used to generate the average strain and strain rate results. Longitudinal strain (ε) at any time point (t) in the cardiac cycle from end diastole (time 0) was calculated as: ε(t) = (L(t) − L0)/L0. LA reservoir strain (εs), conduit strain (εe), and booster strain (εa) were calculated at t equals left ventricular end systole, diastasis, and pre‐LA systole, respectively, and their corresponding peak strain rates (SRs) derived (Supporting Information Figure S1). Strain and strain rate (SR) parameters from both 2‐ and 4‐chamber views were averaged to obtain mean results for analysis. Using data from 20 randomly selected subjects, intra‐ and interobserver comparability was assessed. Two independent observers analyzed all cases in the evaluation of interobserver variability (Shuang Leng and Xiaodan Zhao), while intraobserver variability was assessed from a repeated analysis by the first observer (Shuang Leng) after 7 days (Supporting Information Table S1a). This technique has been validated against volumetric measurements and the strain results obtained from commercial software. Details about the technique can be found in Supporting Information Table S1b and Figure S2.
2.4. Metabolomics profiling
Antecubital venous blood samples (20‐30 mL) were taken from consenting participants in the morning; fasting was not required before blood collection. After collection, the blood samples were immediately placed on ice for transportation and were processed within 6 hours to obtain serum samples, which were subsequently stored at −80°C.
Serum metabolomic profiling analysis was performed in the Duke‐NUS Metabolomics Facility. Thawed serum samples (100 μL) were spiked with 20‐μL deuterium‐labeled amino acid/acyl‐carnitine mixture and diluted with 800‐μL methanol. After centrifugation of the mixture at 17000g for 5 minutes at 20°C, the supernatant fraction was collected and divided into two parts: one (100 μL) for acyl‐carnitine analysis and one (10 μL) for amino acid analysis. A pooled quality control sample was prepared by mixing equal amounts (10 μL) of each extracted serum sample. Extraction and measurement of acyl‐carnitine and amino acid panels were performed as previously described.18 Free and total L‐carnitine analysis was carried out as previously described19 with modifications. 10 μL of 250‐μM d3‐L‐carnitine was added to 50 μL of plasma. 20 μL of the mixture was removed for protein precipitation and further dilution using an acidified methanol‐water mixture (0.6% HCl in 80% MeOH). Free carnitine was estimated from the supernatant by analyzing on an Agilent 6430 Triple Quadrupole liquid chromatography mass spectrometry and an Agilent XDB‐C8 column (100 × 4.6 mm; particle size 1.8 μm) (Agilent Technologies, Santa Clara, California) kept at 30°C. Chromatography was performed by injecting 1 μL of the supernatant and eluting by mobile phase A (0.1% formic acid in water) and mobile phase B (0.1% formic acid in acetonitrile). The flow rate was at 0.4 mL/min at 95% A from 0 to 2 minutes, increased to 0.8 mL/min at 10% A from 2 to 2.5 minutes, held until 2.8 minutes, changed to 95% A from 2.8 to 3 minutes, and the flow rate was reduced to 0.4 mL/min at 95% A at 3.6 minutes, and kept until 5.0 minutes. Data acquisition and analysis were performed on an Agilent MassHunter Workstation B.06.00 Software (Santa Clara, CA, USA). For total carnitine analysis, 10 μL of 1‐M KOH was added to the remaining d3‐L‐carnitine and plasma mixture. Hydrolysis was performed by incubating the mixture at 65°C for 15 minutes, followed by neutralizing with 12‐μL 1‐M HCl. 20 μL of the supernatant was used for protein precipitation and dilution with acidified methanol‐water mixture (0.6% HCl in 80% MeOH), followed by analysis with mass spectrometry as described above.
3. STATISTICAL METHODOLOGY
We first examined bivariable association of subject clinical characteristics, physical activity, cardiac function, and LA function with high VO2. High VO2 was defined as a VO2 > 37 (ml/kg/min) for men or VO2 > 29 (ml/kg/min) for women14 as mean VO2 was 37 (ml/kg/min) for men and 29 (ml/kg/min) for women in our cohort.
Mean and SD were presented for continuous data and frequency and percentage for categorical data. We then used univariate logistic regression to assess the role of 83 metabolites including 65 acyl‐carnitine metabolites, 16 amino acid metabolites, and 2 carnitine metabolites, in contributing to high VO2. Metabolites with >25% of values below the lower limit of quantification were excluded from analysis (only C102 was excluded, hence a total of 83 metabolites were analyzed in the final sample). We normalized the distributions of all metabolites by logarithmic transformation.
We reduced the dimensionality of correlated metabolites (65 acyl‐carnitine metabolites and 2 carnitine metabolites) using sparse principal component analysis (SPCA), which used a penalized matrix decomposition. Compared to regular principal component analysis, SPCA is capable of producing sparse loadings, which makes it more biologically interpretable. Specifically, we set the orthogonality constraint on each component and the number of components to be 10. We reported the description on each component and the proportion of variance accounted. The association of each 10 SPCA factors with high VO2 instead of 65 acyl‐carnitine metabolites and 2 carnitine metabolites were analyzed.
Furthermore, we used multivariable logistic regression to assess the role of amino acid metabolites and SPCA factors that show an association with P < 0.05 with high VO2 in univariate analysis controlling for the significant clinical characteristics (age, body mass index [BMI], and diabetes). Heart rate was not included as it was already used to compute VO2.
All statistical analyses were performed using STATA 13 (StataCorp, College Station, Texas), while the SPCA was performed by R. For all analysis, a two‐tailed P value of <0.05 was considered significant.
4. RESULTS
We studied a total of 141 participants, of whom 82 (58.2%) had low VO2, while 59 (41.8%) had high VO2.
Compared to participants with high VO2, participants with low VO2 were older (mean age 73.8 ± 3.6 vs 66.1 ± 15.7 years, P < 0.0001), had a higher BMI (mean BMI 24.5 ± 3.0 vs 22.1 ± 2.8, P < 0.0001), and a trend toward higher likelihood of diabetes mellitus (29.3% vs 15.3%, P = 0.053). In addition, participants with low VO2 were more likely to report doing low intensity exercise (“take it easy”) (96.3% vs 81.4%) as opposed to higher intensity exercise (“heavy breath and sweat”) (3.7% vs 18.6%) (P = 0.003) (Table 1).
Table 1.
Baseline clinical characteristics and physical activity data
| VO2 low (n = 82) | VO2 high (n = 59) | Total (n = 141) | P value | |
|---|---|---|---|---|
| Age (year) | 73.8 (3.6) | 66.1 (15.7) | 70.6 (11.2) | <0.0001 |
| Female | 36 (43.9%) | 23 (39.0%) | 59 (41.8%) | 0.56 |
| Ever smoker | 20 (24.4%) | 10 (17.0%) | 30 (21.3%) | 0.29 |
| Body mass index (kg/m2) | 24.5 (3.0) | 22.1 (2.8) | 23.5 (3.1) | <0.0001 |
| Hypertension | 50 (61.0%) | 27 (45.8%) | 77 (54.6%) | 0.073 |
| Diabetes mellitus | 24 (29.3%) | 9 (15.3%) | 33 (23.4%) | 0.053 |
| Dyslipidemia | 46 (56.1%) | 25 (42.4%) | 71 (50.4%) | 0.11 |
| Heart rate (beats per minute) | 75.8 (13.2) | 70.3 (11.0) | 73.5 (12.5) | 0.010 |
| Central systolic blood pressure (mm Hg) | 141.6 (17.6) | 136.0 (17.9) | 139.3 (17.9) | 0.066 |
| Central diastolic blood pressure (mm Hg) | 76.7 (10.1) | 76.2 (11.7) | 76.5 (10.7) | 0.79 |
| Central mean arterial pressure (mm Hg) | 103.0 (12.1) | 100.4 (11.5) | 102.0 (11.9) | 0.2 |
| Central pulse pressure (mm Hg) | 64.9 (16.2) | 59.8 (18.5) | 62.8 (17.3) | 0.083 |
| Physical activity | ||||
| Frequency | 0.48 | |||
| Inactive | 15 (18.3%) | 9 (15.3%) | 24 (17.0%) | |
| Once a week | 1 (1.2%) | 3 (5.1%) | 4 (2.8%) | |
| 2 to 3 times a week | 10 (12.2%) | 5 (8.5%) | 15 (10.6%) | |
| Almost everyday | 56 (68.3%) | 42 (71.2%) | 98 (69.5%) | |
| Intensity | 0.003 | |||
| Take it easy | 79 (96.3%) | 48 (81.4%) | 127 (90.1%) | |
| Heavy breath and sweat | 3 (3.7%) | 11 (18.6%) | 14 (9.9%) | |
| Duration | 0.73 | |||
| <15 min | 20 (24.4%) | 14 (23.7%) | 34 (24.1%) | |
| 16 to <30 minutes | 24 (29.3%) | 14 (23.7%) | 38 (27.0%) | |
| 30 to 60 minutes | 17 (20.7%) | 11 (18.6%) | 28 (19.9%) | |
| >1 hour | 21 (25.6%) | 20 (33.9) | 41 (29.1) |
Compared to participants with high VO2, participants with low VO2 had more adverse cardiovascular parameters, such as lower ratio of peak velocity flow in early diastole to peak velocity flow in late diastole by atrial contraction of >0.8 (76% vs 35%, adjusted odd ratio [OR] = 4.1, 95% confidence interval [CI]: [1.7‐9.5], P = 0.001) and lower LA conduit strain (11.3 ± 4.0 vs 15.6 ± 6.1, adjusted OR = 1.1, 95% CI: [1.002‐1.3], P = 0.045) (Table 2).
Table 2.
Cardiac functions by echocardiogram and LA function by CMR
| VO2 low (n = 82) | VO2 high (n = 59) | Total (n = 141) | P value | Adjusted ORa | Adjusted P value | |
|---|---|---|---|---|---|---|
| Interventricular septum thickness at end diastole (IVSd) (cm) | 0.86 (0.18) | 0.81 (0.13) | 0.84 (0.16) | 0.096 | ||
| Interventricular septum thickness at end systole (IVSs) (cm) | 1.30 (0.26) | 1.17 (0.24) | 1.24 (0.26) | 0.004 | 0.3 (0.1‐1.8) | 0.2 |
| LVIDd (cm) | 4.50 (0.64) | 4.33 (0.74) | 4.42 (0.69) | 0.17 | ||
| Left ventricular internal diameter end systole (LVPWd) (cm) | 0.80 (0.14) | 0.74 (0.09) | 0.77 (0.12) | 0.0097 | 0.1 (0.003‐5.2) | 0.28 |
| LVPWs (cm) | 1.45 (0.24) | 1.37 (0.28) | 1.41 (0.26) | 0.087 | ||
| LVOT (cm) | 2.07 (0.16) | 2.05 (0.17) | 2.06 (0.16) | 0.64 | ||
| Ao (cm) | 3.14 (0.46) | 3.04 (0.49) | 3.09 (0.47) | 0.23 | ||
| LA (cm) | 3.81 (0.52) | 3.50 (0.55) | 3.68 (0.56) | 0.0015 | 0.8 (0.3‐2.1) | 0.71 |
| LVEF (%) | 74.44 (7.08) | 73.64 (7.63) | 74.10 (7.30) | 0.53 | ||
| LV FS (%) | 43.80 (6.32) | 42.97 (6.48) | 43.45 (6.38) | 0.47 | ||
| LVMI (grams/m2) | 83.72 (27.27) | 75.20 (18.89) | 80.12 (24.38) | 0.051 | ||
| Ratio of peak velocity flow in early diastole E (MV E peak) (m/s) to peak velocity flow in late diastole by atrial contraction A (MV A peak) (m/s) (E/A ratio) > 0.8 | 28 (35.0%) | 45 (76.3%) | 73 (52.5%) | <0.001 | 4.1 (1.7–9.5) | 0.001 |
| DT (m/s) | 210.54 (38.69) | 205.25 (36.68) | 208.30 (37.81) | 0.42 | ||
| PASP (mm Hg) | 27.27 (6.47) | 27.06 (6.61) | 27.18 (6.50) | 0.86 | ||
| PV‐S (cm/s) | 57.22 (11.50) | 58.48 (11.55) | 57.76 (11.49) | 0.54 | ||
| PV‐D (cm/s) | 47.07 (15.45) | 49.02 (12.76) | 47.90 (14.34) | 0.45 | ||
| PV‐Ar (ms) | 92.41 (16.63) | 92.42 (16.04) | 92.41 (16.32) | 1.00 | ||
| Mitral inflow duration at atrial contraciton (MV A duration (ms) | 118.45 (18.88) | 113.63 (16.75) | 116.40 (18.10) | 0.13 | ||
| Left atrial function | ||||||
| Reservoir strain (εs) % | 29.9 (7.8) | 32.8 (7.6) | 31.1 (7.8) | 0.036 | 1.0 (0.9‐1.1) | 0.9 |
| Conduit strain (εe) % | 11.3 (4.0) | 15.6 (6.1) | 13.2 (5.5) | <0.0001 | 1.1 (1.002–1.3) | 0.045 |
| Booster strain (εa) % | 16.9 (5.6) | 16.3 (3.9) | 16.6 (5.0) | 0.46 | ||
| Reservoir strain rate (SRs) (s−1) | 1.5 (0.5) | 1.6) (0.5) | 1.6 (0.5) | 0.06 | ||
| Conduit strain rate (SRe) (s−1) | −1.2 (0.5) | −1.7 (0.8) | −1.4 (0.7) | <0.0001 | 0.6 (0.2‐1.6) | 0.3 |
| Booster strain rate (Sra) (s−1) | −2.2 (0.8) | −2.2 (0.6) | −2.2 (0.7) | 0.92 | ||
| SRe/SRa | 0.6 (0.6) | 0.8 (0.4) | 0.7 (0.5) | 0.14 |
Abbreviations: Ao, Aortic diameter; BMI, body mass index; CMR, XXX; DT, deceleration time; IVSd, XXX; IVSs, XXX; LA, left atrium; LVEF, left ventricular ejection fraction; LV FS, left ventricular fractional shortening; LVIDd, left ventricular internal diameter end diastole; LVMI, left ventricular mass index; LVOT, Levt ventricular outflow tract; LVPWd, XXX; LVPWs, left ventricular posterior wall end systole; MV A, XXX; MV E, XXX; OR, odd ratio; PASP, pulmonary artery systolic pressure; PV‐Ar, pulmonary vein flow at atrial contraction; PV‐D, pulmonary vein diastolic velocity; PV‐S, pulmonary vein systolic velocity; SRa, XXX; SRe, XXX; SRs, XXX.
Age, BMI, and diabetes were adjusted.
We analyzed serum samples from study subjects for 83 metabolites comprising 65 acyl‐carnitine metabolites, 16 amino acid metabolites and 2 carnitine metabolites. The list of measured metabolites is presented in Supporting Information Tables S2.
SPCA identified 10 acyl‐carnitine factors clustering in biologically related groupings (Table 3). Univariate association between each of the 10 SPCA factors and risk of high VO2 is shown in Table 4. Factor 2, Factor 5, and Factor 8 showed significant negative association with high V02. However, after adjustment for significant clinical covariates such as age, BMI and diabetes, only Factor 8 remained predictive for high V02 (OR = 0.6, 95% CI: [0.4‐0.9], P = 0.013).
Table 3.
Factors identified by sparse principal component analysis and the associated individual components, description and variance
| Factors | Description | Components | Proportion of variance accounted |
|---|---|---|---|
| 1 | Medium and long‐chain carnitines | C8, C8‐DC, C12:1, C12, C12‐OH/C10‐DC, C14:2, C14:1, C14, C16:3, C16:2,C16:1, C18:1 | 0.11 |
| 2 | Short‐chain dicarboxyl/hydroxyl carnitines | C3, C4, C5:1, C4‐OH, C6, C5OHC3DC,C4DCC60H, C5DC, C81OHC61DC, C8OHC6DC, C103, C81DC, C8‐DC | 0.063 |
| 3 | Medium and long‐chain dicarboxyl/hydroxyl carnitines | C81OHC61DC, C122OHC102DC,C121OH,C142OH, C141OH, C163OHC143DC,C162OHC183OHC163DC, C201, C20, C201OHC181DC, C20OHC18DC, C221 C182OHC162DC, | 0.072 |
| 4 | Long‐chain carnitines | C16, C183, C182, C181, C18, C204,C203, C202, C201, C202OHC182DC,C225, C224 C223 | 0.060 |
| 5 | Medium and long‐chain dicarboxyl/hydroxyl carnitines | C4OH, C8OHC6DC, C8DC,C12OHC10DC,C141OH, C14OHC12DC, C162OH,C161OHC141DC,C18OHC16DC, C20, C201OHC181DC, C16OH,C181OHC161DC,C20OHC18DC | 0.074 |
| 6 | Wide‐spectrum carnitines including odd short‐chain carnitines | C2, C3, C51, C5OHC3DC, C101, C7DC, C121, C12, C14, C142OH, C163 | |
| 7 | Wide‐spectrum carnitines including ketone‐derived carnitine | C162OH, C16OH, C183, C182, C18, C183OHC163DC, C182OHC162DC, C204, C203, C202, C201, C203OHC183DC, C225, C223, C222, C22, free carnitine, Total Carnitine | 0.038 |
| 8 | Wide‐spectrum carnitines including odd short‐chain carnitines | C3, C51, C4DCC6OH, C5DC, C81OHC61DC, C8OHC6DC, C7DC, C81DC, C8DC, C122, C121, C12OHC10DC, C14OHC12DC, C16, C16OH, C183OHC163DC, C18OHC16DC, C204, C201, C20OHC18DC, C224, C223, C222, C221 free Carnitine, Total Carnitine | 0.022 |
| 9 | Wide‐specturm carnitines including ketone‐derived carnitine | C2, C51, C4OH, C6, C5OHC3DC, C81OHC61DC, C101, C81DC, C12, C122OHC102DC, C121OH, C14, C142OH, C14OHC12DC, C162, C183, C182, C181, C183OHC163DC, C182OHC162DC, C181OHC161DC, C18OHC16DC, C204, C203, C201OHC181DC, C20OHC18DC, C225, free Carnitine, Total Carnitine | 0.023 |
| 10 | Medium and long‐chain carnitines | C10, C143, C142, C14, C143OHC123DC, C142OH, C163, C16, C181, C18, C182OHC162DC, C204, C203, C201, C20, C221, C22 | 0.023 |
Table 4.
Differences in metabolomic patterns
| VO2 low | VO2 high | Total | OR (95% CI) | P value | Adjusted ORa | P value | |
|---|---|---|---|---|---|---|---|
| Acylcarnitines | |||||||
| Factor 1 | −0.1 (2.7) | 0.1 (2.7) | 0 (2.7) | 1.0 (0.9‐1.2) | 0.69 | ||
| Factor 2 | 0.3 (2.2) | −0.4 (1.8) | 0 (2.0) | 0.8 (0.7‐1.0) | 0.030 | 0.9 (0.8‐1.2) | 0.55 |
| Factor 3 | −0.01 (2.1) | 0.02 (2.4) | 0 (2.2) | 1.0 (0.9‐1.2) | 0.94 | ||
| Factor 4 | −0.04 (2.2) | 0.05 (1.9) | 0 (2.1) | 1.0 (0.9‐1.2) | 0.81 | ||
| Factor 5 | 0.3 (2.4) | −0.5 (2.1) | 0 (2.3) | 0.8 (0.7–1.0) | 0.038 | 0.9 (0.7‐1.1) | 0.21 |
| Factor 6 | 0.2 (1.5) | −0.2 (1.7) | 0 (1.6) | 0.9 (0.7–1.1) | 0.22 | ||
| Factor 7 | −0.1 (1.8) | 0.1 (1.8) | 0 (1.8) | 1.1 (0.9‐1.3) | 0.56 | ||
| Factor 8 | 0.2 (1.0) | −0.3 (1.4) | 0 (1.2) | 0.7 (0.5‐1.0) | 0.035 | 0.6 (0.4‐0.9) | 0.013 |
| Factor 9 | −0.1 (1.5) | 0.2 (1.0) | 0 (1.3) | 1.2 (0.9‐1.5) | 0.25 | ||
| Factor 10 | 0.05 (1.4) | −0.1 (1.2) | 0 (1.3) | 0.9 (0.7‐1.2) | 0.61 | ||
| Amino acids | |||||||
| Ala | 6.2 (0.3) | 6.1 (0.2) | 6.2 (0.2) | 0.1 (0.03‐0.7) | 0.018 | 0.1 (0.01‐0.9) | 0.044 |
| Arg | 4.7 (0.2) | 4.8 (0.2) | 4.7 (0.2) | 2.1 (0.5‐9.0) | 0.34 | ||
| Asp | 3.1 (0.3) | 3.1 (0.3) | 3.1 (0.3) | 0.5 (0.2‐1.8) | 0.31 | ||
| Cit | 3.4 (0.4) | 3.5 (0.4) | 3.5 (0.4) | 1.8 (0.8‐4.1) | 0.14 | ||
| Glu | 4.6 (0.2) | 4.4 (0.2) | 4.5 (0.2) | 0.03 (0.005‐0.1) | <0.0001 | 0.1 (0.01‐0.5) | 0.007 |
| Gly | 5.4 (0.2) | 5.5 (0.2) | 5.4 (0.2) | 10.8 (1.8‐62.9) | 0.0080 | 5.8 (0.7‐46.5) | 0.099 |
| His | 4.3 (0.2) | 4.3 (0.2) | 4.3 (0.2) | 1.8 (0.4‐8.2) | 0.46 | ||
| IleLeu | 5.0 (0.3) | 4.9 (0.3) | 5.0 (0.3) | 0.6 (0.2‐2.1) | 0.47 | ||
| Met | 3.2 (0.4) | 3.2 (0.4) | 3.2 (0.4) | 1.3 (0.5‐3.3) | 0.52 | ||
| Orn | 4.5 (0.3) | 4.4 (0.3) | 4.4 (0.3) | 0.3 (0.1‐1.0) | 0.049 | 0.4 (0.1‐1.8) | 0.24 |
| Phe | 4.3 (0.2 | 4.3 (0.2) | 4.3 (0.2) | 0.4 (0.1‐2.4) | 0.32 | ||
| Pro | 5.5 (0.2) | 5.5 (0.2) | 5.5 (0.2) | 0.3 (0.1‐1.1) | 0.069 | ||
| Ser | 4.8 (0.2) | 4.8 (0.2) | 4.8 (0.2) | 1.0 (0.2‐5.3) | 0.96 | ||
| Trp | 3.9 (0.2) | 4.0 (0.3) | 4.0 (0.3) | 3.3 (0.8‐13.2) | 0.098 | ||
| Tyr | 4.3 (0.3) | 4.2 (0.3) | 4.2 (0.3) | 0.4 (0.1‐1.2) | 0.085 | ||
| Val | 5.5 (0.3) | 5.4 (0.3) | 5.5 (0.3) | 0.7 (0.2‐2.5) | 0.63 | ||
Abbreviations: BMI, body mass index; OR, odd ratio.
Age, BMI, and diabetes were adjusted.
Univariate associations between amino acids and risk of high VO2 were significant for alanine, glutamine/glutamate, glycine, and ornithine (Table 4). Multivariate analysis adjusting for significant clinical covariates showed only alanine (OR = 0.1, 95% CI: [0.01‐0.9], P = 0.044) and glutamine/glutamate (OR = 0.1, 95% CI: [0.01‐0.5], P = 0.007) were independent predictors for high V02.
5. DISCUSSION
In this cross‐sectional study, low peak oxygen uptake was associated with potentially deleterious changes in cardiovascular structure and function as well as with higher accumulation of wide‐spectrum acyl‐carnitines and several amino acids.
Our novel study used a validated calculator of peak oxygen uptake to estimate peak oxygen uptake of a contemporary cohort of community elderly adults. We provide novel support for this method of peak oxygen uptake estimation by demonstrating that high calculated VO2 was indeed associated with better cardiovascular structure and function. In fact, due to the detailed annotation of cardiovascular structure and function obtained from CMR imaging and echocardiogram, the association between VO2 as calculated by this method could be directly linked to specific indices of CV structure and function.
In this community cohort without CVD, we provide novel evidence that VO2 was associated with better LA function as assessed by CMR feature tracking. We observed a positive association between LA reservoir and conduit strain with high VO2 in our study. In addition, LA conduit strain remained strongly associated with high VO2 after adjustment for clinical factors. To the best of our knowledge, our study is the first to clearly demonstrate the potential clinical importance of LA strain by this sensitive method of CMR feature tracking. The association between high LA strain and high VO2 suggests that impaired LA mechanics may lead to poor augmentation of cardiac output with exertion and decreased exercise tolerance.
We detected a significant negative correlation between peak oxygen uptake and metabolic profile in a cohort of aged community adults with different levels of VO2. Previous studies have recognized differences in the metabolic profile of subjects with varying levels of activity20, 21, 22, 23 or upon exposure to different levels of exercise.24, 25 In this study, we found significant differences in a wide spectrum of acyl‐carnitine species including short‐chain dicarboxyl‐carnitines as well as long‐chain acyl‐carnitines. The long‐chain acyl‐carnitines are derived from oxidation of fatty acid fuel. Elevations in long‐chain acyl‐carnitines have been previously associated with impaired mitochondrial fuel metabolism and obesity associated‐insulin resistance.26 The negative association of long‐chain acyl‐carnitines with peak oxygen uptake fits with the notion that decreased VO2 is linked to diminished mitochondrial oxidative capacity and risk for metabolic disease. The study also demonstrated a negative association between short‐chain dicarboxyl‐carnitines, VO2 and various measures of cardiac function. Previous studies have linked accumulation of dicarboxyl‐carnitines and increased risk of recurrent cardiovascular events.8
We observed a negative association between glutamine/glutamate and alanine with high VO2 in our study. Low alanine has previously been linked to higher levels of physical activity.20 Both alanine and glutamine/glutamate serve as anaplerotic substrates, which can directly feed into the tricarboxylic acid (TCA) cycle. Lower levels of these amino acids may be indicative of higher TCA cycle turnover and increased overall mitochondrial activity, which is associated with increased exercise.27
As illustrated in Figure 1, a potential explanation for our combined metabolomics findings could be that higher peak oxygen uptake is associated with increased TCA cycle activity, which leads to increase inflow of carbon fuel into mitochondrial pathways. This results in reduced accumulation of long‐chain fatty acids due to higher fuel oxidation rates and reduced build‐up of anaplerotic substrates such as glutamine/glutamate and alanine due to higher anaplerorosis. Therefore, our study provides potential mechanistic evidence as to how increasing peak oxygen uptake, through physical activity for instance, reduces cardiovascular risk by reducing long‐chain fatty acids, glutamate/glutamine and alanine.
Figure 1.
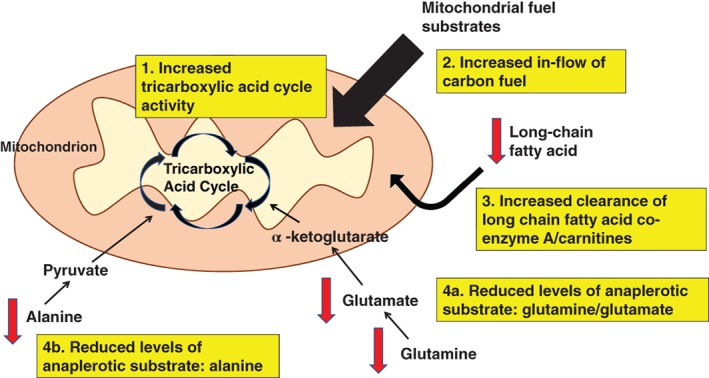
High peak oxygen uptake (VO2) may be associated with increased tricarboxylic acid cycle activity (1). This leads to increase inflow of carbon fuel into mitochondrial pathways (2). A consequence of this could include reduced accumulation of long‐chain fatty acid co‐enzyme A/carnitine fuel as a result of higher fuel oxidation rates (3) and reduced build‐up of (4a) glutamine/glutamate and (4b) alanine due to higher anaplerorosis
We acknowledge limitations in our study. Sample size was relatively small although statistically significant associations between the groups could be identified. While we corrected for available clinical factors, we cannot exclude the possibility that additional factors that were not included could have influenced our findings. The serum samples were obtained in a nonfasting state, which may potentially introduce analytic differences in postabsorptive states between the subjects studied. As a community‐based driven study, we recognize challenges in getting elderly community subjects to fast. Future studies comprising of fasting samples may provide additional insights as to the effect of fasting on similar analyses. One advantage of our study, however, was the prospective collection of blood samples at the same time as the cardiovascular measurements. Our study design is cross‐sectional and hence we cannot infer causal relationships. Future longitudinal follow‐up of these participants may provide greater insights into causality. Despite these limitations, our results highlight the clinical relevance of pursuing future clinical investigations using both a clinical imaging and a molecular approach as such an integrated approach may help identify mechanisms involved in CVDs in specific cohorts.10
6. CONCLUSION
Community elderly adults with low peak oxygen uptake have adverse cardiovascular and metabolic parameters compared to their counterparts with high peak oxygen uptake. Combined cardiac and metabolomics phenotyping may be a promising tool to provide insights into physiological states, useful for tracking future interventions related to physical activity among community cohorts.
CONFLICTS OF INTEREST
The authors declare no potential conflict of interests.
Supporting information
Appendix S1. Supplementary Data
ACKNOWLEDGMENT
The cardiac aging study has received funding support from the National Medical Research Council of Singapore (NMRC/TA/0031/2015; NMRC/OFIRG/0018/2016), Hong Leong Foundation and Edwards Lifesciences. Participants were recruited from the Singapore Chinese Health Study, which was supported by the United States National Institutes of Health (NIH R01 CA144034 and UM1 CA182876). The funder had no role in the design and conduct of the study; collection; management, analysis, and interpretation of the data; and preparation, review, or approval of the manuscript.
Koh AS, Gao F, Tan RS, et al. Metabolomic correlates of aerobic capacity among elderly adults. Clin Cardiol. 2018;41:1300–1307. 10.1002/clc.23016
REFERENCES
- 1. Kodama S, Saito K, Tanaka S, et al. Cardiorespiratory fitness as a quantitative predictor of all‐cause mortality and cardiovascular events in healthy men and women: a meta‐analysis. JAMA. 2009;301(19):2024‐2035. [DOI] [PubMed] [Google Scholar]
- 2. Blair SN, Kohl HW III, Paffenbarger RS Jr, Clark DG, Cooper KH, Gibbons LW. Physical fitness and all‐cause mortality. A prospective study of healthy men and women. JAMA. 1989;262(17):2395‐2401. [DOI] [PubMed] [Google Scholar]
- 3. Koch LG, Kemi OJ, Qi N, et al. Intrinsic aerobic capacity sets a divide for aging and longevity. Circ Res. 2011;109(10):1162‐1172. [DOI] [PMC free article] [PubMed] [Google Scholar]
- 4. Sui X, LaMonte MJ, Laditka JN, et al. Cardiorespiratory fitness and adiposity as mortality predictors in older adults. JAMA. 2007;298(21):2507‐2516. [DOI] [PMC free article] [PubMed] [Google Scholar]
- 5. Wang TJ, Ngo D, Psychogios N, et al. 2‐Aminoadipic acid is a biomarker for diabetes risk. J Clin Invest. 2013;123(10):4309‐4317. [DOI] [PMC free article] [PubMed] [Google Scholar]
- 6. Prentice KJ, Luu L, Allister EM, et al. The furan fatty acid metabolite CMPF is elevated in diabetes and induces beta cell dysfunction. Cell Metab. 2014;19(4):653‐666. [DOI] [PubMed] [Google Scholar]
- 7. Palmer ND, Stevens RD, Antinozzi PA, et al. Metabolomic profile associated with insulin resistance and conversion to diabetes in the insulin resistance atherosclerosis study. J Clin Endocrinol Metab. 2015;100(3):E463‐E468. [DOI] [PMC free article] [PubMed] [Google Scholar]
- 8. Shah SH, Bain JR, Muehlbauer MJ, et al. Association of a peripheral blood metabolic profile with coronary artery disease and risk of subsequent cardiovascular events. Circ Cardiovasc Genet. 2010;3(2):207‐214. [DOI] [PubMed] [Google Scholar]
- 9. Newgard CB, An J, Bain JR, et al. A branched‐chain amino acid‐related metabolic signature that differentiates obese and lean humans and contributes to insulin resistance. Cell Metab. 2009;9(4):311‐326. [DOI] [PMC free article] [PubMed] [Google Scholar]
- 10. Cheng S, Shah SH, Corwin EJ, et al. Potential impact and study considerations of metabolomics in cardiovascular health and disease: a scientific statement from the American Heart Association. Circ Cardiovasc Genet. 2017;10(2):e000032. [DOI] [PMC free article] [PubMed] [Google Scholar]
- 11. Shah SH, Kraus WE, Newgard CB. Metabolomic profiling for the identification of novel biomarkers and mechanisms related to common cardiovascular diseases: form and function. Circulation. 2012;126(9):1110‐1120. [DOI] [PMC free article] [PubMed] [Google Scholar]
- 12. Koh AS, Gao F, Liu J, et al. Metabolomic profile of arterial stiffness in aged adults. Diab Vasc Dis Res. 2018;15(1):74‐80. [DOI] [PubMed] [Google Scholar]
- 13. Hankin JH, Stram DO, Arakawa K, et al. Singapore Chinese health study: development, validation, and calibration of the quantitative food frequency questionnaire. Nutr Cancer. 2001;39(2):187‐195. [DOI] [PubMed] [Google Scholar]
- 14. Nes BM, Janszky I, Vatten LJ, Nilsen TI, Aspenes ST, Wisloff U. Estimating V.O 2peak from a nonexercise prediction model: the HUNT study, Norway. Med Sci Sports Exerc. 2011;43(11):2024‐2030. [DOI] [PubMed] [Google Scholar]
- 15. Nes BM, Vatten LJ, Nauman J, Janszky I, Wisloff U. A simple nonexercise model of cardiorespiratory fitness predicts long‐term mortality. Med Sci Sports Exerc. 2014;46(6):1159‐1165. [DOI] [PubMed] [Google Scholar]
- 16. Leng S, Zhao XD, Huang FQ, et al. Automated quantitative assessment of cardiovascular magnetic resonance‐derived atrioventricular junction velocities. Am J Physiol Heart Circ Physiol. 2015;309(11):H1923‐H1935. [DOI] [PubMed] [Google Scholar]
- 17. Leng S, Jiang M, Zhao XD, et al. Three‐dimensional tricuspid annular motion analysis from cardiac magnetic resonance feature‐tracking. Ann Biomed Eng. 2016;44(12):3522‐3538. [DOI] [PubMed] [Google Scholar]
- 18. Tan HC, Khoo CM, Tan MZ, et al. The effects of sleeve Gastrectomy and gastric bypass on branched‐chain amino acid metabolism 1 year after bariatric surgery. Obes Surg. 2016;26(8):1830‐1835. [DOI] [PubMed] [Google Scholar]
- 19. Stevens RD, Hillman SL, Worthy S, Sanders D, Millington DS. Assay for free and total carnitine in human plasma using tandem mass spectrometry. Clin Chem. 2000;46(5):727‐729. [PubMed] [Google Scholar]
- 20. Fukai K, Harada S, Iida M, et al. Metabolic profiling of Total physical activity and sedentary behavior in community‐dwelling men. PLoS One. 2016;11(10):e0164877. [DOI] [PMC free article] [PubMed] [Google Scholar]
- 21. Xiao Q, Moore SC, Keadle SK, et al. Objectively measured physical activity and plasma metabolomics in the Shanghai physical activity study. Int J Epidemiol. 2016;45(5):1433‐1444. [DOI] [PMC free article] [PubMed] [Google Scholar]
- 22. Wientzek A, Floegel A, Knuppel S, et al. Serum metabolites related to cardiorespiratory fitness, physical activity energy expenditure, sedentary time and vigorous activity. Int J Sport Nutr Exerc Metab. 2014;24(2):215‐226. [DOI] [PubMed] [Google Scholar]
- 23. Kujala UM, Makinen VP, Heinonen I, et al. Long‐term leisure‐time physical activity and serum metabolome. Circulation. 2013;127(3):340‐348. [DOI] [PubMed] [Google Scholar]
- 24. Siopi A, Deda O, Manou V, et al. Effects of different exercise modes on the urinary metabolic fingerprint of men with and without metabolic syndrome. Metabolites. 2017;7(1):E5. [DOI] [PMC free article] [PubMed] [Google Scholar]
- 25. Huffman KM, Slentz CA, Bateman LA, et al. Exercise‐induced changes in metabolic intermediates, hormones, and inflammatory markers associated with improvements in insulin sensitivity. Diabetes Care. 2011;34(1):174‐176. [DOI] [PMC free article] [PubMed] [Google Scholar]
- 26. Koves TR, Ussher JR, Noland RC, et al. Mitochondrial overload and incomplete fatty acid oxidation contribute to skeletal muscle insulin resistance. Cell Metab. 2008;7(1):45‐56. [DOI] [PubMed] [Google Scholar]
- 27. Befroy DE, Petersen KF, Dufour S, Mason GF, Rothman DL, Shulman GI. Increased substrate oxidation and mitochondrial uncoupling in skeletal muscle of endurance‐trained individuals. Proc Natl Acad Sci U S A. 2008;105(43):16701‐16706. [DOI] [PMC free article] [PubMed] [Google Scholar]
Associated Data
This section collects any data citations, data availability statements, or supplementary materials included in this article.
Supplementary Materials
Appendix S1. Supplementary Data