

Abstract
Objective
To test the hypothesis that, in the context of robotic therapy designed to enhance proprioceptive feedback via a Hebbian model, integrity of both somatosensory and motor systems would be important in understanding interparticipant differences in treatment-related motor gains.
Methods
In 30 patients with chronic stroke, behavioral performance, neural injury, and neural function were quantified for somatosensory and motor systems. Patients then received a 3-week robot-based therapy targeting finger movements with enhanced proprioceptive feedback.
Results
Hand function improved after treatment (Box and Blocks score increase of 2.8 blocks, p = 0.001) but with substantial variability: 9 patients showed improvement exceeding the minimal clinically important difference (6 blocks), while 8 patients (all of whom had >2-SD greater proprioception deficit compared to 25 healthy controls) showed no improvement. In terms of baseline behavioral assessments, a somatosensory measure (finger proprioception assessed robotically) best predicted treatment gains, outperforming all measures of motor behavior. When the neural basis underlying variability in treatment response was examined, somatosensory-related variables were again the strongest predictors. A multivariate model combining total sensory system injury and sensorimotor cortical connectivity (between ipsilesional primary motor and secondary somatosensory cortices) explained 56% of variance in treatment-induced hand functional gains (p = 0.002).
Conclusions
Measures related to the somatosensory network best explained interparticipant differences in treatment-related hand function gains. These results underscore the importance of baseline somatosensory integrity for improving hand function after stroke and provide insights useful for individualizing rehabilitation therapy.
ClinicalTrials.gov identifier:
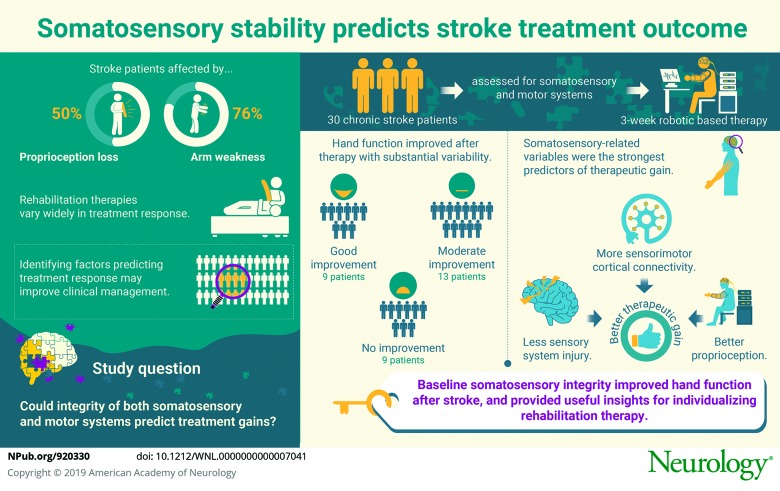
Stroke is a leading cause of human disability. Reduced arm function is a major contributor to this, with arm paresis present in 76%1 and arm proprioception deficits present in 50% of patients.2 Rehabilitation therapies can address functional deficits but show substantial variability in treatment response.3 The ability to predict treatment responders would enable clinicians to better match patients with an effective therapy, increasing statistical power in clinical trials and optimizing resource allocation in clinical practice.
In an effort to understand this variability, studies have evaluated the extent of neural injury and features of neural function before therapy,4–8 most often with a focus on the motor system. However, the somatosensory system may also be important for improving hand function.9–11
The primary goal of the current report was to determine whether the integrity of the somatosensory system, considered comprehensively, i.e., extending beyond behavioral assessments to include measures of neural injury and neural function, explains variability in treatment response. We designed a robotic rehabilitation therapy that adopted a framework based on principles of Hebbian plasticity, a model of learning12 emphasizing improved plasticity through repeated and optimally timed efferent-afferent interactions, and that provides useful strategies for enhancing poststroke motor recovery.13 Our primary hypothesis was that baseline assessments of both somatosensory and motor systems would be strong predictors of treatment gains. A secondary hypothesis was that measures of both neural injury (in gray or white matter by MRI) and neural function (by functional MRI or EEG) would be important in explaining interparticipant variability in treatment response.5–8
Methods
Robotic therapy
Patients with unilateral chronic hemiparetic stroke were recruited through community advertisements and gave informed consent to be part of a study of robotic-assisted finger therapy. A full report of clinical trial results appears elsewhere14; the current report is focused on understanding which factors explain interparticipant differences in treatment response. Inclusion and exclusion criteria (table 1) aimed to capture patients with chronic hemiparetic stroke across a wide range of motor deficits at a time point when motor status after stroke was stable. After enrollment, medical history and sensorimotor behavioral status were assessed at 2 baseline visits, with Box and Blocks (B&B) score tested at both. Next, measurements were made in 4 categories of candidate neural predictors: (1) neural injury (using structural MRI) plus 3 categories of neural function, including (2) cortical function via fMRI, (3) fMRI functional connectivity, and (4) EEG coherence. Patients then underwent a 3-week course of robotic therapy. The primary endpoint was change from baseline (mean of 2 baseline visits) to 1 month after therapy in B&B score, a measure of manual dexterity15 classified at the activities limitations level in the International Classification of Function.
Table 1.
Inclusion and exclusion criteria

During this 3-week period, patients underwent nine 1-hour treatment sessions of robotic therapy. During each session, participants played 5 songs, twice each, for a maximum total of 1,065 possible movements per session; in practice, participants completed ≈8,000 total training movements. Therapy sessions consisted of playing a game similar to Guitar Hero, the third largest video game franchise in history, wherein patients made repeated grasp movements of the index finger, middle finger, or both on the affected hand using a robotic exoskeleton, Finger Individuating Grasp Exercise Robot (FINGER). Game play required patients to play along with a song by hitting streaming notes by flexing 1 or both fingers, as specified by note color, to a desired angle and then stopping at the correct moment. This required patients to stop finger flexion inside a narrow target at the very time when the scrolling musical note was passing. After successfully hitting a note, patients were then required to extend their fingers back to a neutral position before the game gave a point. Finger movements during the task were slow and did not depend on reaction time. At the start of training, the examiner ensured that patients understood the game, walking through a practice round and confirming that patients understood and could demonstrate the task. Appropriate attention and cognitive status were confirmed by requiring the patient to repeat full task instructions aloud correctly. The robotic therapy approach used a Hebbian approach, with an active assist mode to ensure proprioceptive feedback in a narrow and physiologically appropriate time window. This included a minimum-jerk profile that was designed to move the finger from its starting position to the target position at the right time to hit the note.16 The assistive forces provided by the robot guided fingers along a physiologic spatiotemporal trajectory using a compliant position controller, thereby increasing the amount and temporal precision of proprioceptive feedback in a manner that was time correlated with motor activity. To reduce slacking, the robot provided these forces only if the participants initiated the movements themselves as determined with the resistive force sensors of the robot actuator. When the resistive forces exceeded 1.75 times their measured noise threshold (equivalent to a force of ≈6 N), the robot would generate an ideal trajectory and begin the new movement. This threshold was not so high as to be prohibitive but was high enough to create a subtle catch that made it clear that the participants themselves had triggered the movements. This precise, assist-as-needed control strategy was made possible by a high level of control fidelity, achieved by using a high bandwidth of force control and very low friction via lightweight, high-speed, ungeared linear actuators using an 8-bar mechanism, with further friction reduction achieved through feed-forward control compensation. Participants in the clinical study were randomized into 2 groups who received the same dose of therapy but with high vs low robotic assistance, but change in B&B score did not vary according to amount of assistance, so participants are combined in current analyses.
Standard protocol approvals, registrations, and patient consents
The University of California, Irvine Institutional Review Board approved the study. Written informed consent was obtained from all participants in the study between October 2013 and November 2014. The trial that generated the data used in the current analyses (understanding which factors explain interparticipant differences in treatment response) was registered as ClinicalTrials.gov (NCT02048826).
Measures of sensorimotor behavior
A single licensed physical therapist blinded to treatment and imaging details performed all behavioral assessments. In addition to B&B score, baseline measures included Action Arm Research Test, a measure of activity limitation focused at the arm17; Upper-Extremity Fugl-Meyer Scale, a measure of loss of body structure/function at the arm18 that goes from 0 to 66 points, with higher scores being better; the Nine Hole Peg Test, a measure of activity limitation and loss of body structure/function at the distal arm19; and Finger Tapping test, a measure of loss of body structure/function at the distal arm.20 Clinical sensory assessments included Upper-Extremity Fugl-Meyer Scale light touch and proprioception subscores. Handedness was determined with the Edinburgh Handedness Inventory.21
The FINGER robot not only provided therapy but also was used to assess proprioception of the index and middle fingers on the stroke-affected hand, as described previously,22 via a series of 12 nonperiodic finger-crossing movements wherein the index and middle fingers are slowly moved in opposing directions. For each finger-crossing movement, participants pressed a keyboard spacebar to indicate the moment when they perceived that their fingers were directly aligned relative to one another. Error, defined as the angular distance between the 2 metacarpophalangeal joints when the spacebar was pressed, is presented here as the average error across the 12 finger-crossing movements (table 2). This did not depend on reaction time; as in our previous study of healthy controls,22 half of the proprioception errors were made before and half were made after direct finger alignment.
Table 2.
Baseline measures and their correlation with motor gains


Measures of brain injury
On a 3T Philips MRI, high-resolution T1-weighted images were acquired with a 3-dimensional magnetization-prepared rapid gradient-echo sequence (150 slices, 1-mm3 voxels). T2 fluid-attenuated inversion-recovery image images were also acquired.
To calculate infarct volume, MRIcron (mccauslandcenter.sc.edu/mricro/mricron/index.html) was used to outline each patient's infarct on the T1-weighted MRI image, informed by the T2 fluid-attenuated inversion-recovery image, as described previously.23 After calculation of infarct volume in participant-specific space, stroke masks were transformed into Montreal Neurological Institute (MNI) stereotaxic space with the use of FSL (fmrib.ox.ac.uk/fsl/tbss/index.html).
To calculate gray matter injury measures, regions of interest (ROIs) consisting of a sphere centered at primary motor cortex (M1), primary sensory cortex (S1), and OP4 region of secondary sensory cortex (S2) were generated in each hemisphere in MNI stereotaxic space.24,25 Percent stroke mask overlap with each ROI was then calculated.
To calculate white matter injury measures, the normal corticospinal tract (CST) descending from M1 to the cerebral peduncles and the normal thalamocortical spinal tract (TST) ascending from the ventral posterolateral thalamic nucleus to S1 were generated from diffusion tensor imaging of 17 healthy controls using methods described previously26 (figure 1). Next, percent overlap between each patient's infarct and normal white matter tracts was calculated in MNI stereotaxic space26 for CST and for TST.
Figure 1. Corticospinal and thalamocortical spinal tracts.

These tracts were generated from probabilistic tractography of diffusion tensor imaging data from healthy controls.
To calculate comprehensive measures of neural system injury, these gray matter and white matter injury metrics were combined, separately for motor system and sensory systems. Thus, to quantify total motor system injury, M1 and CST injury measures for each patient were standardized (expressed as number of SDs for the current population's distribution) and then summed; for total sensory system injury, injury measures of S1, S2, and TST were standardized and then summed.
Measures of cortical function
Four runs of blood oxygenation level–dependent fMRI were acquired at baseline using a T2*-weighted gradient-echo echo-planar imaging sequence with a repetition time of 2,000 milliseconds, an echo time of 30 milliseconds, and 31 slices with 4-mm thickness/1-mm interslice gap. Each run had 48 brain volumes (96 seconds). During image acquisition, patients wore a plastic exoskeleton similar to the robotic therapy interface and played the robotic therapy Guitar Hero game. The video guided the paretic hand to alternate between rest and active 0.5-Hz index and middle finger grasp-release movements similar to those made during therapy with the FINGER robot. Patients did not receive feedback or assistance during in-scanner game play.
Preprocessing of fMRI data included realignment to the first image, coregistration to the mean echo-planar image, normalization to the standard MNI echo-planar template, and spatial smoothing (full width at half-maximum 6 mm). Subsequently, 3 measures of brain function were extracted for M1, S1, and S2 ROIs on each brain side: activation beta (contrast) estimate, activation volume, and activation volume laterality index, a measure of hemispheric dominance ranging from +1 (activation only in the ipsilesional hemisphere) to −1 (activation only in the contralesional hemisphere), calculated as described elsewhere.27
Measures of cortical connectivity
Functional connectivity was assessed from the blood oxygenation level–dependent fMRI images with the CONN toolbox28 as the temporal correlation using an ROI-ROI approach. Ipsilesional (i) and contralesional (c) ROIs were used to extract 3 Fisher-transformed correlation coefficients from iM1 (iM1-cM1, iM1-iS1, iM1-iS2) 2 from iS1 (iS1-cS1, iS1-iS2), and 1 from iS2 (iS2-cS2).
Measures of EEG coherence
Three minutes of awake, eyes-open, resting-state brain activity was acquired by dense-array scalp EEG with the 256-lead Hydrocel net (Electrical Geodesics, Inc, Eugene, OR). Data were preprocessed to remove extrabrain artifacts, as described previously.29 Resting-state connectivity was estimated from EEG coherence in the high-beta (20–30 Hz) frequency band with electrodes overlying iM1, iS1, or iS2 as the seed region.
Statistical analysis
Normally distributed data and data that could be transformed to a normal distribution were analyzed with parametric statistics; otherwise, nonparametric methods were used. Analyses were 2 tailed with α = 0.05 and used JMP-11. A paired t test evaluated the effects of robotic therapy on motor function (B&B score) from baseline to 1 month after therapy. Linear regression was used to identify behavioral measures related to ΔB&B score from baseline to 1 month after therapy.
To identify measures of neural injury and neural function that predict treatment-related motor gains, a bivariate screen evaluated each variable within the 4 neurology-based categories (brain injury, cortical function, cortical connectivity, and EEG coherence) in relation to change in B&B score. The most significant predictors from each category identified in bivariate screening (as long as bivariate screening showed p < 0.1) were advanced into a forward stepwise multivariate linear regression approach (0.1 to enter, 0.15 to leave the model) to best predict treatment-induced gains in ΔB&B score. Missing data were left blank.
Power analysis was based on a pilot study with the MusicGlove, a wearable sensor that also allows people to train finger movement using a Guitar Hero-like musical computer game.16 In that study, we measured an effect size of 1.2 with the B&B test after repetitive finger training compared to conventional tabletop training. Assuming a similar effect of robotic assistance in the current study, with a power of 90% and an α of 0.05, the power analysis predicted that a total of 30 participants would be needed.
Anonymized data not provided in this article will be shared, as reasonably possible, at the request of other investigators for purposes of replicating procedures and results.
Results
Data from 30 patients were available for analysis (tables 2 and 3). All 30 patients had 100% compliance with therapy. All completed full testing except for 4 who could not complete MRI (claustrophobia), 3 who could not complete EEG (cap incompatibility with hair accessories), and 3 who were not administered the robotic proprioception test (protocol implemented in stages). Three patients were excluded from fMRI-derived analyses due to excessive head motion during scanning, while 5 patients were excluded from white matter injury analysis due to lesion location extending into the brainstem.
Table 3.
Individual participant features


Overall, patients showed statistically significant treatment-related gains in hand function as measured by the primary endpoint, ΔB&B score from baseline to 1 month after therapy. At baseline, a wide range of deficits in hand function was seen, with B&B scores ranging from 3 to 55 blocks over 60 seconds. Measurement of B&B score at baseline was stable, with a nonsignificant difference of 0.6 ± 1.9 blocks (mean ± SD, p = 0.095) seen between the 2 baseline visits taken 6 days apart. The change from baseline to 1 month after therapy was significant with substantial variability (ΔB&B score 2.8 ± 4.7 blocks, p = 0.001), These results can be rephrased as showing that 9 patients improved by the minimal clinically important difference for B&B score (≥6 blocks),30 13 patients improved but less than the minimal clinically important difference, and 8 patients failed to show any improvement in B&B score.
Behavioral factors related to treatment-induced hand functional gains
Better proprioception at baseline was associated with larger treatment gains, as reported previously,14 such that patients with smaller proprioception error before therapy had greater hand functional gains after therapy (r = −0.60, p = 0.0008, figure 2). This relationship does not simply reflect a link between proprioception and motor status because at baseline proprioception error was not significantly related to B&B score (p = 0.2) or to other motor assessments. Furthermore, proprioception error remained a significant predictor of functional hand gains (ΔB&B score) even when specifically controlling for baseline motor status (baseline B&B score) with partial correlation (r = −0.59, p = 0.002). Intact proprioception at baseline was necessary to achieve hand functional gains; all 8 patients who failed to show any improvement in B&B score had proprioception errors at least 2 SDs greater than those measured in 25 age-matched healthy controls.22
Figure 2. Somatosensory behavior predicts interparticipant differences in treatment gains.

Better proprioception function at baseline predicted treatment-related gains in hand function (r = −0.60, p = 0.0008), defined as change in Box and Blocks (B&B) score from baseline to 1 month after therapy. Proprioception error is the number of degrees separating the index and middle fingers at the time when the patient reported them as directly aligned. Smaller error is indicative of better proprioception function.
Baseline motor status also predicted treatment-induced hand functional gains but with weaker predictive value compared to baseline proprioception status. For example, baseline score on the B&B weakly predicted ΔB&B score (r = 0.31, p = 0.09). Among the 4 secondary baseline motor assessments, only one, the Action Arm Research Test score, significantly predicted motor gains (r = 0.48, p = 0.007), although this was a weaker predictor compared to proprioception.
In secondary analyses, other behavioral measures such as depression score (r = −0.06, p = 0.7) and NIH Stroke Scale score (r = −0.21, p = 0.3) were not significantly associated with hand functional gains (table 2).
Neural factors that predict treatment-induced hand functional gains
Measures of neural injury and neural function at baseline were examined in both somatosensory and motor systems to better understand interparticipant differences in treatment-related gains and, in particular, to understand the neural basis underlying the association between proprioceptive capability and larger treatment gains. On bivariate screening, all 4 categories of neural injury/function had at least 1 variable that significantly predicted treatment-induced hand functional gains (table 2), with the most significant being total sensory system injury (r = −0.49, p = 0.03) for brain injury, S1 laterality index (r = 0.60, p = 0.01) for cortical function, iM1-iS2 functional connectivity (r = 0.46, p = 0.03) for cortical connectivity, and iS1-cS1 coherence (r = −0.46, p = 0.02), for EEG coherence. Excluding patients with ≥50% damage to cortical ROIs had no effect on these findings.
When these 4 variables were entered into a forward stepwise model, 2 survived: a measure of neural injury (total sensory system injury, p = 0.004, figure 3A) and a measure of neural function (cortical connectivity, i.e., iM1-iS2 functional connectivity, p = 0.04, figure 3B). The multivariate model containing these 2 terms explained 56% of variance in treatment-induced hand functional gains (r = 0.75, p = 0.002).
Figure 3. Neural basis of interparticipant differences in treatment gains.

(A) Smaller total sensory system injury (r = −0.49, p = 0.03) and (B) greater ipsilesional M1–ipsilesional S2 (iM1-iS2) functional connectivity (r = 0.46, p = 0.03) each significantly predicted larger treatment-related gains in hand function, defined as change in Box and Blocks score from baseline to 1 month after therapy. Total sensory system injury is an aggregate measurement of injury to thalamocortical spinal tract, S1, and S2.
Discussion
A number of rehabilitation therapies aim to improve upper extremity function. Patients show wide differences in response to such therapies, in part reflecting variability in injury and neural function,5–8 emphasizing the need to understand the basis for interparticipant differences in treatment gains to match patients with a form of rehabilitation therapy tailored to their needs. It is not surprising, therefore, that treatment gains in the current study were highly variable. Behaviorally, differences in treatment gains were best explained by proprioception status, and indeed, intact proprioception at baseline was necessary to achieve any gains in hand function. When the neural basis of interparticipant differences in treatment gains was examined, the best predictors came from somatosensory rather than motor measures and included measures of both neural injury and neural function.
Better proprioception at baseline was the strongest behavioral predictor of motor gains (table 2 and figure 2). This is consistent with a prior study that found that, among 12 patients with chronic stroke, deficits in proprioception predicted behavioral change associated with 100 trials (2 hours) of tracking training.31 The link between proprioception and treatment-related gains in the current cohort was also described in our report of clinical trial results14; here, we extend that finding by examining the neural underpinnings. Indeed, the relationship between baseline proprioception and subsequent treatment-related hand function gains was independent of any association that baseline motor behavior had with treatment-related gains. Furthermore, all 8 patients who failed to show any improvement in B&B score had proprioception errors at least 2 SDs greater than those found in 25 age-matched healthy controls.22 These findings are consistent with the critical role that proprioception plays in motor learning9 and control10 in the intact CNS, where proprioceptive signals are known to modulate motor neuron activity,11 and with a meta-analysis that found proprioception to be directly linked to arm functional status after stroke.32 These findings are also consistent with clinical observations that somatosensory deficits after stroke are associated with poorer functional outcomes, longer hospitalizations, increased mortality, and diminished quality of life.33–36
This study aimed to identify the neural basis for interparticipant differences in treatment-related gains in hand motor function. The data suggest that measures of both somatosensory and motor systems have predictive value but emphasize that measures of somatosensory system injury and function have greater predictive value than motor system measures for this therapy that targeted finger movements with enhanced proprioceptive feedback (table 2). The final model for predicting treatment-related motor gains included a measure of neural injury, total sensory system injury, an aggregate measure that includes TST, S1, and S2 injury. These anatomic regions are important to somatosensory function37 and demonstrated superior predictive value when injury was measured in aggregate (total sensory system injury) compared to any injury element alone (figure 3A and table 2). This suggests that treatment gains depended on preserved anatomic integrity of a distributed somatosensory network and emphasizes the value of comprehensive injury metrics incorporating both gray matter and white matter. Previous studies of experimental CNS somatosensory system injury in animals are consistent, showing that such injury has no effect on limb use or control but reduces learning of new motor behaviors. However, there has been limited study beyond postcentral gyrus lesions.38–42
The final model for predicting treatment-related motor gains also included a measure of neural function, connectivity between iM1 and iS2 (figure 3B). This highlights the importance of sensorimotor processing in motor rehabilitation targeting hand function. S2 has strong anatomic and functional connections with S1 and M1 and is known to play a key role in sensorimotor integration.43 This finding, that patients with weaker iM1-iS2 connectivity were less successful in achieving gains in hand motor function, suggests that the robot-assisted therapy used here, with its emphasis on bolstering afferent signals, required intact functional interactions between higher-order sensorimotor regions.
Strengths of the current study include a dual focus on somatosensory system and motor system status and consideration of multiple classes of candidate predictor variables in parallel. Baseline measures of the primary endpoint were very stable. The potential to study a Hebbian-based intervention was enabled by several features of the design of the robot and by targeting the fingers, which are highly innervated with respect to proprioception.44 Weaknesses of the study include the fact that data could not be collected from some patients for some predictors, although >20 patients were available for each analysis (table 2), a substantial number considering that the multivariate testing that was performed in the context of a clinical trial. However, future studies aiming to validate these predictors of treatment-related behavioral gains in the somatosensory system would benefit from having a larger sample size. Using a sphere linked to MNI-space coordinates to measure gray matter injury ensures that the same brain regions are interrogated across patients, but this approach includes some white matter and thus introduces variance into the measurement. The multivariate model identified here explained 56% of variance in outcome, and while this exceeds performance of any single neural measure, additional explanatory factors need to be identified. While a wide range of motor deficits was permitted for study entry (table 1), patients had a baseline B&B score of 23.0 ± 18.1 (table 2), the capacity to play Guitar Hero, and mild deficits on the NIH Stroke Scale, indicating that motor deficits were not severe and cognitive functions were substantially intact, a constellation common in chronic stroke studies. These findings suggest uncertainty about the extent to which the current findings generalize to the broader stroke population. Generalization in stroke studies is complex. Enrolling a heterogeneous group increases the extent to which results generalize to the broad stroke population. However, interparticipant variability is often high in stroke populations, which reduces statistical power. A common solution in early-phase studies, pursued herein, is to experimentally reduce variance by enrolling a select subpopulation, enabling detection of a neurobiological relationship but limiting generalization.
Stroke is an extremely heterogeneous disease. Gains from rehabilitation therapies are maximized when content of therapy is appropriately matched to an individual patient's behavior and neural state. The current findings indicate that, at least for a Hebbian-based robot-assisted therapy, proprioception is important to achieving gains in hand function and that these gains are best predicted by measures of both neural injury and neural function. These findings thus may be useful to define approaches to individualize rehabilitation therapy and thereby to maximize treatment-related gains.
Glossary
- B&B
Box and Blocks
- CST
corticospinal tract
- FINGER
Finger Individuating Grasp Exercise Robot
- MNI
Montreal Neurological Institute
- ROI
region of interest
- TST
thalamocortical spinal tract
Author contributions
M.L. Ingemanson. J.R. Rowe, and V. Chan contributed to study design, study performance, data analysis, and manuscript composition. E.T. Wolbrecht contributed to study design, data analysis, and manuscript composition. D.J. Reinkensmeyer and S.C. Cramer contributed to study design, study performance, data analysis, and manuscript composition.
Study funding
This study was supported by grants R01 HD062744, K24 HD074722, and UL1 TR001414 (NIH).
Disclosure
M. Ingemanson, J. Rowe, V. Chan, and E. Wolbrecht report no disclosures relevant to the manuscript. D. Reinkensmeyer is a cofounder of Flint Rehabilitation Devices and has received payment for consulting and holds equity in Hocoma; both companies are manufacturers of rehabilitation technology. The terms of these interests have been reviewed by the UC Irvine Conflict of Interest Committee. S. Cramer serves as a consultant for MicroTransponder, Dart Neuroscience, Roche, Neurolutions, Regenera, Abbvie, SanBio, and TRCare. Go to Neurology.org/N for full disclosures.
References
- 1.Rathore SS, Hinn AR, Cooper LS, Tyroler HA, Rosamond WD. Characterization of incident stroke signs and symptoms: findings from the Atherosclerosis Risk in Communities study. Stroke 2002;33:2718–2721. [DOI] [PubMed] [Google Scholar]
- 2.Meyer S, De Bruyn N, Lafosse C, et al. Somatosensory impairments in the upper limb poststroke: distribution and association with motor function and visuospatial neglect. Neurorehabil Neural Repair 2016;30:731–742. [DOI] [PubMed] [Google Scholar]
- 3.Stinear CM, Ward NS. How useful is imaging in predicting outcomes in stroke rehabilitation? Int J Stroke 2013;8:33–37. [DOI] [PubMed] [Google Scholar]
- 4.Kim B, Winstein CJ. Can neurological biomarkers of brain impairment Be used to predict post-stroke motor recovery? A systematic review. Neurorehabil Neural Repair 2017;31:3–24. [DOI] [PubMed] [Google Scholar]
- 5.Burke Quinlan E, Dodakian L, See J, et al. Neural function, injury, and stroke subtype predict treatment gains after stroke. Ann Neurol 2015;77:132–145. [DOI] [PMC free article] [PubMed] [Google Scholar]
- 6.Stinear CM, Barber PA, Smale PR, Coxon JP, Fleming MK, Byblow WD. Functional potential in chronic stroke patients depends on corticospinal tract integrity. Brain 2007;130:170–180. [DOI] [PubMed] [Google Scholar]
- 7.Stinear CM, Barber PA, Petoe M, Anwar S, Byblow WD. The PREP algorithm predicts potential for upper limb recovery after stroke. Brain 2012;135:2527–2535. [DOI] [PubMed] [Google Scholar]
- 8.Nouri S, Cramer SC. Anatomy and physiology predict response to motor cortex stimulation after stroke. Neurology 2011;77:1076–1083. [DOI] [PMC free article] [PubMed] [Google Scholar]
- 9.Wolpert DM, Diedrichsen J, Flanagan JR. Principles of sensorimotor learning. Nat Rev Neurosci 2011;12:739–751. [DOI] [PubMed] [Google Scholar]
- 10.Rothwell JC, Traub MM, Day BL, Obeso JA, Thomas PK, Marsden CD. Manual motor performance in a deafferented man. Brain 1982;105(pt 3):515–542. [DOI] [PubMed] [Google Scholar]
- 11.Riemann BL, Lephart SM. The sensorimotor system, part II: the role of proprioception in motor control and functional joint stability. J Athl Train 2002;37:80–84. [PMC free article] [PubMed] [Google Scholar]
- 12.Caporale N, Dan Y. Spike timing–dependent plasticity: a hebbian learning rule. Annu Rev Neurosci 2008;31:25–46. [DOI] [PubMed] [Google Scholar]
- 13.Buma F, Kwakkel G, Ramsey N. Understanding upper limb recovery after stroke. Restor Neurol Neurosci 2013;31:707–722. [DOI] [PubMed] [Google Scholar]
- 14.Rowe J, Chan V, Ingemanson M, Cramer S, Wolbrecht E, Reinkensmeyer D. Robotic assistance for training finger movement using a hebbian model: a randomized controlled trial. Neurorehab Neural Repair 2017;31:769–780. [DOI] [PMC free article] [PubMed] [Google Scholar]
- 15.Mathiowetz V, Volland G, Kashman N, Weber K. Adult norms for the Box and Block test of manual dexterity. Am J Occup Ther 1985;39:386–391. [DOI] [PubMed] [Google Scholar]
- 16.Taheri H, Rowe JB, Gardner D, et al. Design and preliminary evaluation of the FINGER rehabilitation robot: controlling challenge and quantifying finger individuation during musical computer game play. J Neuroeng Rehabil 2014;11:10. [DOI] [PMC free article] [PubMed] [Google Scholar]
- 17.Yozbatiran N, Der-Yeghiaian L, Cramer SC. A standardized approach to performing the action research arm test. Neurorehabil Neural Repair 2008;22:78–90. [DOI] [PubMed] [Google Scholar]
- 18.See J, Dodakian L, Chou C, et al. A standardized approach to the Fugl-Meyer assessment and its implications for clinical trials. Neurorehab Neural Repair 2013;27:732–741. [DOI] [PubMed] [Google Scholar]
- 19.Heller A, Wade DT, Wood VA, Sunderland A, Hewer RL, Ward E. Arm function after stroke: measurement and recovery over the first three months. J Neurol Neurosurg Psychiatry 1987;50:714–719. [DOI] [PMC free article] [PubMed] [Google Scholar]
- 20.Shimoyama I, Ninchoji T, Uemura K. The Finger-Tapping test. Arch Neurol 1990;47:681–684. [DOI] [PubMed] [Google Scholar]
- 21.Oldfield RC. The assessment and analysis of handedness: the Edinburgh Inventory. Neuropsychologia 1971;9:97–113. [DOI] [PubMed] [Google Scholar]
- 22.Ingemanson ML, Rowe JB, Chan V, Wolbrecht ET, Cramer SC, Reinkensmeyer DJ. Use of a robotic device to measure age-related decline in finger proprioception. Exp Brain Res 2016;234:83–93. [DOI] [PMC free article] [PubMed] [Google Scholar]
- 23.Burke E, Dodakian L, See J, et al. A multimodal approach to understanding motor impairment and disability after stroke. J Neurol 2014;261:1178–1186. [DOI] [PubMed] [Google Scholar]
- 24.Mayka MA, Corcos DM, Leurgans SE, Vaillancourt DE. Three-dimensional locations and boundaries of motor and premotor cortices as defined by functional brain imaging: a meta-analysis. Neuroimage 2006;31:1453–1474. [DOI] [PMC free article] [PubMed] [Google Scholar]
- 25.Eickhoff SB, Amunts K, Mohlber H, Ziller K. The human parietal operculum, II: stereotaxic maps and correlation with functional imaging results. Cereb Cortex 2006;16:268–279. [DOI] [PubMed] [Google Scholar]
- 26.Riley JD, Le V, Der-Yeghiaian L, et al. Anatomy of stroke injury predicts gains from therapy. Stroke 2011;42:421–426. [DOI] [PMC free article] [PubMed] [Google Scholar]
- 27.Fernández G, de Greiff A, von Oertzen J, et al. Language mapping in less than 15 minutes: real-time functional MRI during routine clinical investigation. Neuroimage 2001;14:585–594. [DOI] [PubMed] [Google Scholar]
- 28.Whitfield-Gabrieli S, Nieto-Castanon A. Conn: a functional connectivity toolbox for correlated and anticorrelated brain networks. Brain Connect 2012;2:125–141. [DOI] [PubMed] [Google Scholar]
- 29.Wu J, Srinivasan R, Kaur A, Cramer SC. Resting-state cortical connectivity predicts motor skill acquisition. Neuroimage 2014;91:84–90. [DOI] [PMC free article] [PubMed] [Google Scholar]
- 30.van der Lee JH, Beckerman H, Lankhorst GJ, Bouter LM. The responsiveness of the Action Research Arm Test and the Fugl-Meyer Assessment Scale in chronic stroke patients. J Rehabil Med 2001;33:110–113. [DOI] [PubMed] [Google Scholar]
- 31.Vidoni ED, Boyd LA. Preserved motor learning after stroke is related to the degree of proprioceptive deficit. Behav Brain Funct 2009;5:36. [DOI] [PMC free article] [PubMed] [Google Scholar]
- 32.Meyer S, Karttunen AH, Thijs V, Feys H, Verheyden G. How do somatosensory deficits in the arm and hand relate to upper limb impairment, activity, and participation problems after stroke? A systematic review. Phys Ther 2014;94:1220–1231. [DOI] [PubMed] [Google Scholar]
- 33.Kessner SS, Bingel U, Thomalla G. Somatosensory deficits after stroke: a scoping review. Top Stroke Rehabil 2016;23:136–146. [DOI] [PubMed] [Google Scholar]
- 34.Connell LA, Lincoln NB, Radford KA. Somatosensory impairment after stroke: frequency of different deficits and their recovery. Clin Rehabil 2008;22:758–767. [DOI] [PubMed] [Google Scholar]
- 35.Carey LM, Oke LE, Matyas TA. Impaired touch discrimination after stroke: a quantitative test. Neurorehabil Neural Repair 1997;11:219–232. [Google Scholar]
- 36.Sullivan JE, Hedman LD. Sensory dysfunction following stroke: incidence, significance, examination, and intervention. Top Stroke Rehabil 2008;15:200–217. [DOI] [PubMed] [Google Scholar]
- 37.Hughes CML, Tommasino P, Budhota A, Campolo D. Upper extremity proprioception in healthy aging and stroke populations, and the effects of therapist- and robot-based rehabilitation therapies on proprioceptive function. Front Hum Neurosci 2015;9:120. [DOI] [PMC free article] [PubMed] [Google Scholar]
- 38.Sakamoto T, Arissian K, Asanuma H. Functional role of the sensory cortex in learning motor skills in cats. Brain Res 1989;503:258–264. [DOI] [PubMed] [Google Scholar]
- 39.Denny-Brown D. The Cerebral Control of Movement. Liverpool: Liverpool University Press; 1966. [Google Scholar]
- 40.Tatton WG, Forner SD, Gerstein GL, Chambers WW, Liu CN. The effect of postcentral cortical lesions on motor responses to sudden upper limb displacements in monkeys. Brain Res 1975;96:108–113. [DOI] [PubMed] [Google Scholar]
- 41.Pavlides C, Miyashita E, Asanuma H. Projection from the sensory to the motor cortex is important in learning motor skills in the monkey. J Neurophysiol 1993;70:733–741. [DOI] [PubMed] [Google Scholar]
- 42.Xerri C, Merzenich MM, Peterson BE, Jenkins W. Plasticity of primary somatosensory cortex paralleling sensorimotor skill recovery from stroke in adult monkeys. J Neurophysiol 1998;79:2119–2148. [DOI] [PubMed] [Google Scholar]
- 43.Eickhoff SB, Jbabdi S, Caspers S, et al. Anatomical and functional connectivity of cytoarchitectonic areas within the human parietal operculum. J Neurosci 2010;30:6409–6421. [DOI] [PMC free article] [PubMed] [Google Scholar]
- 44.Mountcastle VB. General Features of Somatic Afferent Systems. Boston: Harvard University Press; 2005:51–68. [Google Scholar]