

Abstract
Objective
To assess the value of blood neurofilament light chain (NfL) as a biomarker of recent, ongoing, and future disease activity and tissue damage and its utility to monitor treatment response in relapsing-remitting multiple sclerosis.
Methods
We measured NfL in blood samples from 589 patients with relapsing-remitting multiple sclerosis (from phase 3 studies of fingolimod vs placebo, FREEDOMS and interferon [IFN]-β-1a, TRANSFORMS) and 35 healthy controls and compared NfL levels with clinical and MRI-related outcomes.
Results
At baseline, NfL levels (pg/mL) were higher in patients than in healthy controls (30.5 and 27.0 vs 16.9, p = 0.0001) and correlated with T2 lesion load and number of gadolinium-enhancing T1 lesions (p < 0.0001, both). Baseline NfL levels, treatment, and number of new or enlarging T2 lesions during the studies predicted NfL levels at the end of study (all p < 0.01). High vs low baseline NfL levels were associated (estimate [95% confidence interval]) with an increased number of new or enlarging T2 lesions (ratio of mean: 2.64 [1.51–4.60]; p = 0.0006), relapses (rate ratio: 2.53 [1.67–3.83]; p < 0.0001), brain volume loss (difference in means: −0.78% [−1.02 to −0.54]; p < 0.0001), and risk of confirmed disability worsening (hazard ratio: 1.94 [0.97–3.87]; p = 0.0605). Fingolimod significantly reduced NfL levels already at 6 months (vs placebo 0.73 [0.656–0.813] and IFN 0.789 [0.704–0.884]), which was sustained until the end of the studies (vs placebo 0.628 [0.552–0.714] and IFN 0.794 [0.705–0.894]; p < 0.001, both studies at all assessments).
Conclusions
Blood NfL levels are associated with clinical and MRI-related measures of disease activity and neuroaxonal damage and have prognostic value. Our results support the utility of blood NfL as an easily accessible biomarker of disease evolution and treatment response.
MRI is the current standard to quantitate brain atrophy as a macroscopic reflection of the neuroaxonal damage occurring in patients with multiple sclerosis (MS).1 However, MRI assessments of brain volume loss are difficult to standardize and are retrospective in nature.2 Therefore, there is a need for easier-to-perform and less costly biomarkers suitable for longitudinal monitoring of the disease in clinical trials and in routine clinical practice.
Elevated CSF and blood concentrations of neurofilament light chain (NfL) were found to correlate with an increase in the number of relapses, disability worsening, MRI disease activity, and brain volume loss in MS.3–9 A highly sensitive single molecule array (SIMOA) immunoassay has recently been developed to measure NfL in blood.6,10 Blood NfL measured with SIMOA was shown to strongly correlate with NfL in the CSF of patients with MS.6–9
We therefore assessed NfL as a potential biomarker to monitor MS disease activity and treatment response using blood samples obtained in the course of 2 large, phase 3, randomized controlled clinical trials of fingolimod in relapsing-remitting MS (RRMS). Our objectives were as follows: (1) compare blood NfL concentrations in patients with RRMS to those in healthy controls; (2) assess the relationship of NfL concentrations with patient demographics and MS disease characteristics cross-sectionally; (3) evaluate the effect of fingolimod on blood NfL concentrations compared to placebo or interferon (IFN)-β-1a; and (4) investigate the prognostic potential of blood NfL at baseline for future disease activity and disease worsening.
Methods
Participants
Patients with MS
In this exploratory biomarker analysis, we measured NfL concentrations in blood samples from patients with RRMS who participated in the 2-year, placebo-controlled, phase 3 FREEDOMS trial11 (NCT00289978) and the 1-year, active-controlled, phase 3 TRANSFORMS trial12 (NCT00340834). Patients had to stop IFN-β or glatiramer acetate therapy 3 or more months before inclusion in FREEDOMS, whereas no washout was required before inclusion in TRANSFORMS.
Healthy controls
We measured NfL concentrations in blood samples from 35 healthy controls of similar age.
Assessments
In FREEDOMS, blood samples were collected at baseline and months 6, 12, 18, and 24, and in TRANSFORMS, at baseline and months 6 and 12. All available blood samples from consenting patients who received fingolimod 0.5 mg, placebo, or IFN-β-1a were analyzed. We measured the concentrations of NfL in ethylenediaminetetraacetic acid–treated plasma samples using the SIMOA immunoassay described previously.6 Interassay coefficients of variation (CVs) for 3 native plasma samples were below 12%. The mean intra-assay CV of duplicate determinations for concentration was 4.9%. Repeat measurements were done for a few samples with intra-assay CVs above 20%. Measurements were performed on coded samples. All laboratory personnel remained blinded to treatment allocation and diagnosis and had no access to clinical data.
Statistical analysis
NfL measurements
We analyzed data according to the intention-to-treat (ITT) principle and included all available values in the statistical analysis. We summarized NfL concentrations using geometric means (GeoMeans) and compared them between healthy controls and patients with MS using a Wilcoxon rank sum test.
Demographic and MS disease characteristics related to NfL
To identify the best explanatory factors of baseline NfL concentrations among baseline MS disease and demographic variables, a multiple linear regression analysis of log(NfL) on 8 candidate variables was conducted: age, sex, disease duration since first symptoms, MS treatment prior to randomization (yes/no), relapses in the past 60 days before the collection of the blood sample (yes/no), Expanded Disability Status Scale (EDSS) score at baseline, gadolinium-enhancing (Gd+) lesion count at baseline, and T2 lesion volume at baseline. GeoMean ratios are reported with 95% confidence intervals and p values. For NfL concentrations at end of study (EOS), analogous linear regression analyses were performed whereby the potential baseline explanatory variables “prior MS treatment” and “EDSS” were dropped and “treatment,” “new T2 lesions on study,” and “log-transformed (log) baseline NfL” were included as additional explanatory variables. The underlying assumptions of the linear regression models (linearity, normality, and homoscedasticity) were checked and deemed acceptable in regression diagnostic plots.
Treatment effect
The treatment effect of fingolimod on NfL vs placebo in FREEDOMS, or vs IFN-β-1a in TRANSFORMS, was visualized in line plots with GeoMeans and their 95% confidence intervals, which were obtained from a mixed model for repeated measurements with log(NfL) as the response variable and with adjustments for treatment, age, and log(baseline NfL). The model further included visit-by-treatment and visit-by-log(baseline NfL) interactions. An unstructured covariance matrix was used. Model assumptions were checked in regression diagnostic plots and deemed acceptable.
A sensitivity analysis using multiple regression models of log(NfL) with adjustments for treatment, age, and log(baseline NfL) fit by time point provided similar results.
Prognostic potential of baseline NfL concentrations for on-study activity and disease worsening
To investigate the prognostic potential of NfL on MS disease activity and worsening, patients were grouped by treatment and NfL category to quantify and illustrate MS outcomes within distinct subgroups of patients. Patients from the 2-year FREEDOMS study were categorized into 3 groups based on their baseline NfL concentration: low, <30 pg/mL; medium, 30–60 pg/mL; and high, >60 pg/mL. The cutoff at 30 pg/mL corresponds to the GeoMean in patients with relapsing MS in our dataset and is approximately twice as high as the value seen in healthy controls; the cutoff at 60 pg/mL corresponds to approximately twice the GeoMean in patients with relapsing MS. Descriptive statistics for each group were calculated for each endpoint. The number of new or enlarging T2 lesions, and the annualized relapse rate were both analyzed in negative binomial models, the annualized rate of brain volume change (measured using SIENA [Structural Image Evaluation, Using Normalization, of Atrophy] as previously described13) in a linear regression model, and time to 3-month confirmed disability worsening (CDW) in a Cox proportional hazard model. We adjusted each model for treatment and NfL category at baseline and for additional covariates (detailed later). In a second step, we expanded each model by a treatment-by-NfL category interaction to test whether the NfL effect varies across treatment arms and whether the treatment effect depends on NfL category.
Data availability
Anonymized data not published within this article will be made available by request from any qualified investigator.
Results
Baseline characteristics
Blood samples of 269 patients from the FREEDOMS trial and 320 patients from the TRANSFORMS trial were available for this analysis, reflecting 23% of the ITT population of these trials. Availability of samples was exclusively related to the patients' informed consent for this biomarker study and unrelated to clinical study outcomes. Baseline demographic and disease characteristics of the patients who contributed to this analysis were similar across treatment groups and to the overall randomized population of the respective trials. The analyzed population was young (mean [SD] age was 37.1 [8.6] and 36.5 [8.2] years) and predominately comprised women (69.1% and 67.2% of the total analysis population). The mean (SD) disease duration since first symptom was 8.1 (6.1) and 7.8 (6.4) years for FREEDOMS and TRANSFORMS, respectively. The patients on average experienced 2.1 (1.2) and 2.2 (1.3) number of relapses in the last 2 years before randomization to the respective trials. The mean (SD) EDSS score was 2.5 (1.3) and 2.2 (1.3), mean number of Gd+ lesions were 1.5 (3.6) and 0.9 (2.6), mean T2 lesion volume (cm3) was 6.732 (7.535) and 4.829 (5.842), and the normalized brain volume (cm3) was 1,512 (85.3) and 1,526 (75.3).
Association of NfL at baseline with other baseline disease characteristics
At baseline, patients had significantly higher blood NfL concentrations (FREEDOMS 30.5 pg/mL, TRANSFORMS 27.0 pg/mL) than healthy controls (16.9 pg/mL, p = 0.0001 in both trials; figure 1). Patients who switched from IFN or glatiramer acetate directly to TRANSFORMS had lower NfL values than treatment-naive patients (28.6 vs 34.5 pg/mL, p = 0.0379); there was no statistically significant difference of NfL levels between previously treated and treatment-naive patients in FREEDOMS (31.1 vs 32.7 pg/mL, p = 0.5366; table 1).
Figure 1. Baseline NfL concentrations in patients with relapsing-remitting multiple sclerosis and healthy controls.

The box represents the interquartile range, with the median represented by the line in the center; n = number of patients with evaluable data. The black dot represents the GeoMean value and the whiskers indicate the 10th and 90th percentiles. Dotted line represents plasma NfL (pg/mL, median) concentrations in healthy controls. The p Values are based on a Wilcoxon rank sum test. GeoMean = geometric mean; Max = maximum; Min = minimum; NfL = neurofilament light chain.
Table 1.
Relationship between NfL levels and MS characteristics at baseline

In a multiple linear regression model, which included 8 potential explanatory variables, high baseline NfL concentrations were strongly associated with high baseline T2 lesion volume and the presence of Gd+ T1 lesions (table 1). In patients with very low T2 lesion volume (<0.8 cm3), NfL concentrations were similar to the levels of healthy controls. NfL concentrations increased gradually with higher baseline T2 lesion volume (figure 2). Per cubic-centimeter increase in T2 lesion volume, NfL levels increased by 2.7% (FREEDOMS) and 3.9% (TRANSFORMS).
Figure 2. Blood NfL levels by T2 lesion volume (mm3) at baseline: (A) FREEDOMS, (B) TRANSFORMS.
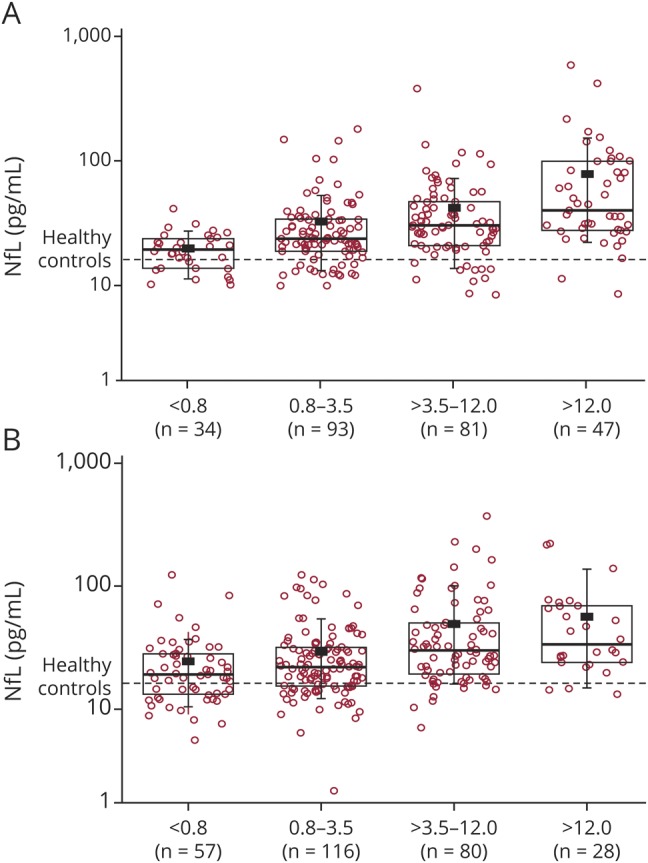
The box represents the interquartile range, with the median represented by the line in the center; n = number of patients with evaluable data. The black dot represents the geometric mean value and the whiskers indicate the 10th and 90th percentiles. Dotted line represents plasma NfL (pg/mL, median) concentrations in healthy controls. NfL = neurofilament light chain.
In both studies, NfL concentrations were higher in patients with Gd+ lesions at baseline compared with those free of Gd+ lesions (FREEDOMS: 40.9 vs 24.9 pg/mL, p < 0.0001; TRANSFORMS: 38.2 vs 25.8 pg/mL, p < 0.0001). The adjusted NfL concentrations were 64% (p < 0.0001, FREEDOMS) and 48% (p < 0.0001, TRANSFORMS) higher in patients with Gd+ lesions than in patients without Gd+ lesions (table 1). Adjusted NfL values ranged from 22.9 pg/mL in patients without Gd+ lesions to 75.5 pg/mL in patients with more than 3 Gd+ lesions in FREEDOMS; in TRANSFORMS, the corresponding values were 22.8 and 62.2 pg/mL, respectively (p < 0.0001, both trials) (figure 3). Patients without Gd+ lesions at baseline also had significantly higher NfL concentrations than healthy controls (p = 0.0014; pooled trial cohorts). Association of baseline NfL concentration with disease duration was only significant in FREEDOMS and the presence of recent relapses or a prior disease-modifying treatment in TRANSFORMS; we did not find significant associations of baseline NfL concentrations with age, sex, and EDSS score at baseline (table 1).
Figure 3. Blood NfL levels by Gd+ T1 lesion count at baseline: (A) FREEDOMS, (B) TRANSFORMS.
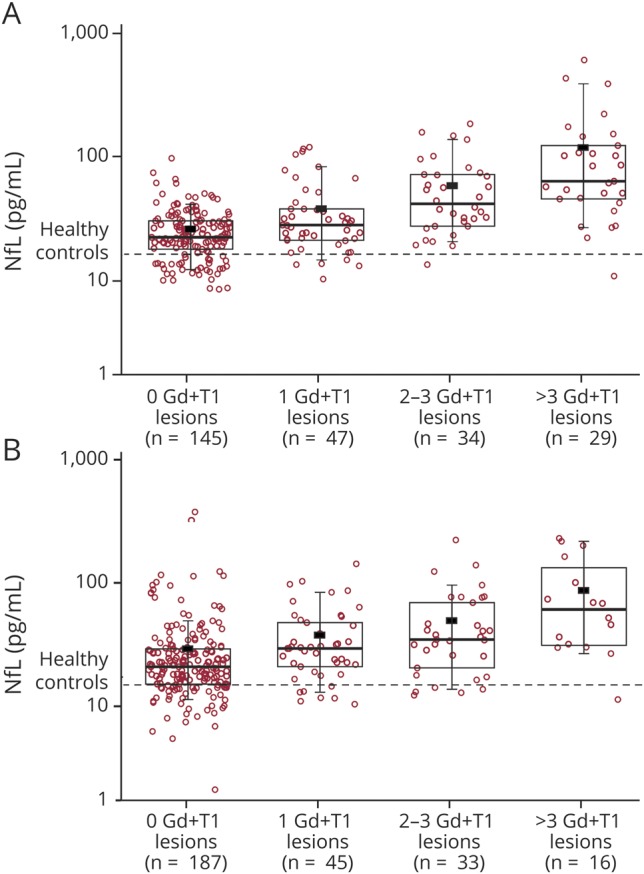
The box represents the interquartile range, with the median represented by the line in the center; n = number of patients with evaluable data. The black dot represents the geometric mean value and the whiskers indicate the 10th and 90th percentiles. Dotted line represents plasma NfL (pg/mL, median) concentrations in healthy controls. Gd+ = gadolinium-enhancing; NfL = neurofilament light chain.
Patient and disease parameters predictive of NfL at EOS
The strongest prognostic factor of high NfL at EOS was a high NfL at baseline (p < 0.0001 in both trials; table 2). Independent of treatment, patients with high NfL levels at baseline had higher NfL levels at EOS than patients with low NfL concentrations at baseline. Moreover, occurrence of new or enlarging T2 lesions during the studies was also associated with higher NfL at EOS (p < 0.001, both trials). Fingolimod treatment significantly reduced NfL levels at EOS compared with placebo or IFN-β-1a (p < 0.01, both trials). Older patients had higher NfL concentrations at EOS in FREEDOMS (p = 0.0002); however, this association could not be confirmed in the TRANSFORMS study (p = 0.1239). All other variables (sex, disease duration, relapses in the past 60 days before the NfL sampling date at EOS, the number of Gd+ lesions at baseline, and T2 lesion volume) had no additional explanatory value for the EOS NfL concentration (table 2).
Table 2.
NfL levels at end of study by demographic, clinical, and MRI characteristics

NfL is sensitive to treatment
In the first NfL assessment, 6 months after start of study treatment, blood NfL concentrations in the fingolimod group were significantly lower compared with both placebo and IFN-β-1a (figure 4, A and B). In FREEDOMS, blood NfL concentrations in the fingolimod group decreased by 35.4% at month 6 relative to baseline (30.6–19.6 pg/mL) and by 43% at month 24 (31.4–18.0 pg/mL), whereas in the placebo group, the reduction was 9% (29.1–26.7 pg/mL) and 4% (28.2–26.9 pg/mL), respectively. In TRANSFORMS, blood NfL concentrations in the fingolimod arm decreased by 36% (28.5–18.4 pg/mL) at month 6, and by 39% at month 12 (28.2–17.1 pg/mL). The corresponding reductions in the IFN-β-1a arm were 14% (24.8–21.5 pg/mL) and 17% (24.9–20.7 pg/mL). By EOS, NfL levels in fingolimod-treated patients were approaching those of healthy controls (16.9 pg/mL) in both trials.
Figure 4. Effect of fingolimod on NfL levels in blood, (A) compared with placebo, FREEDOMS study; (B) compared with interferon-β-1a, TRANSFORMS study.
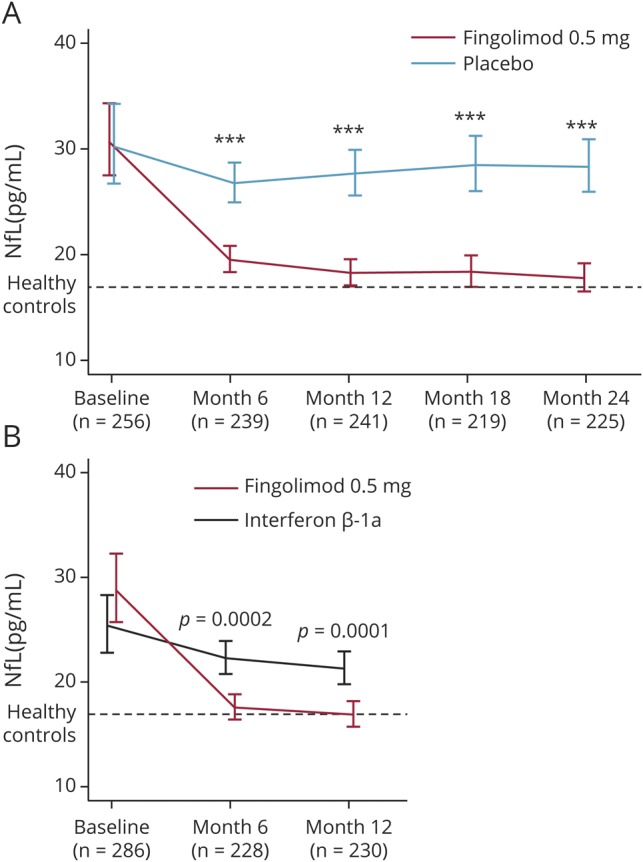
The figure shows geometric means of NfL with 95% confidence intervals and statistical tests from mixed models for repeated measurements of postbaseline NfL. Dotted line represents plasma NfL (pg/mL, geometric mean) concentrations in healthy controls. ***p < 0.0001. n = number of patients with evaluable data. NfL = neurofilament light chain.
Prognostic potential of baseline NfL for future disease activity and worsening
We investigated the prognostic value of 3 categories of baseline blood NfL concentrations for on-study lesion formation, relapse activity, brain volume loss, and 3-month CDW within 24 months in the FREEDOMS trial (table 3). Irrespective of treatment, patients with high blood NfL concentrations (>60 pg/mL) at baseline compared with those with low baseline NfL concentrations (<30 pg/mL) had 2.6 times more new or enlarging T2 lesions (difference: 164%), 2.5 times more MS relapses (difference: 153%), 2.9 times more brain volume loss (difference: 195%) (all p < 0.001), and had a 1.9 times higher risk of 3-month CDW (p = 0.0605). Although fingolimod significantly reduced all these outcomes, there was no significant treatment-by-NfL category interaction, suggesting that the prognostic value of NfL is applicable in both placebo- and fingolimod-treated patients, and that the treatment effects of fingolimod were consistent in all NfL categories.
Table 3.
Clinical and MRI-related outcomes at month 24 by treatment and baseline NfL category (FREEDOMS)

Discussion
In this study, we measured plasma NfL levels using the highly sensitive SIMOA method in a large representative sample set of patients with RRMS, participating in 2 controlled, phase 3 trials. This setting not only allowed assessment of the relative effects of fingolimod treatment vs placebo and IFN-β-1a in a parallel randomized design, but it also provided the opportunity to study the relation of this specific marker of neuroaxonal damage with other clinical and imaging measures of disease activity and severity obtained independently under good clinical practice conditions.
The patients included in our study were typical for an RRMS population. Although samples were only available for about 25% of all study participants, the selection criterion (patient's consent in the biomarker study) and the comparison of baseline characteristics of those included in this analysis from each of the 2 studies and the respective ITT population do not suggest any relevant selection bias.11,12
Baseline characteristics of the 2 trials were similar except for a higher number of Gd+ lesions and higher T2 lesion volume in FREEDOMS than in TRANSFORMS. This difference probably reflects that TRANSFORMS patients were permitted to continue their previous disease-modifying treatment without washout—in contrast, interferon-β or glatiramer acetate therapy had to have been stopped 3 or more months before randomization in the FREEDOMS trial. Similarly, NfL concentrations in patients were significantly higher than in healthy controls, confirming previous observations in CSF14–18 and blood,4,6–9 but across the 2 trials, were lower in TRANSFORMS than in FREEDOMS. Plasma NfL levels at baseline were highly correlated with MRI markers of disease activity (Gd+ lesions and T2 lesion volume) and future tissue destruction (brain volume loss), and this close correlation was sustained throughout the studies irrespective of treatment.
Although patients with enhancing lesions had higher NfL levels, NfL levels in patients without Gd+ lesions were still significantly higher than levels in healthy individuals. This finding suggests that NfL levels also reflect ongoing neuronal damage and loss independent of detectable inflammatory activity, possibly occurring in normal-appearing gray and white matter. This assumption is further supported by the correlation between NfL levels and an objective measure of neuroaxonal damage, brain and spinal cord volume loss in a recent study by our group,9 and by the predictive value of baseline NfL for brain volume loss after 2 years on study in the FREEDOMS trial. Together, these results suggest that NfL in blood is likely to reflect an integral measure of recent and ongoing neuronal damage (over weeks, and possibly months). This neuronal damage not only relates to lesions in both white matter and gray matter regions but also the extralesional (normal-appearing) cortical gray matter MS pathology that manifests as reduction in density of both neurons and oligodendroglia in areas outside lesions.
The high correlation of plasma NfL levels with lesional MRI activity observed in this study is in accordance with the results of a recent observational study6 in which patients with high numbers of T2 or contrast-enhancing lesions in brain or spinal cord had higher serum NfL levels. This correlation of MRI activity with a specific marker of neuroaxonal damage adds to our understanding of the clinical-radiologic paradox in MS—the low correlation of MRI activity with clinical disability.19,20 The identification of T2 lesion load and presence of Gd+ lesions as strong predictors of later brain volume loss21 has already informed the debate about the relevance of MRI activity but less convincingly because brain volume is also dependent on water content and therefore confounded by inflammatory edema and its resolution. Because of their specificity for neurons, increased NfL levels confirm that active inflammatory lesions are associated with neuroaxonal damage. The reasons for their low correlation with clinical disability must therefore primarily be sought in compensation and repair. Neuropathologic studies showing a higher rate of axonal damage in early/relapsing than in progressive MS brains are also compatible with this view.22
NfL levels at baseline had a prognostic value for future on-study disease activity and progression on a group level. Irrespective of treatment allocation, in the FREEDOMS study, categorization of NfL levels into high vs low significantly increased the risk of new/enlarging T2 lesions, relapses, and accelerated brain volume loss over 2 years. Association with CDW was not significant but in the same direction. A small study in serum7 and 2 studies in CSF3,23 also described the prognostic value of NfL for later brain volume loss. This has also recently been confirmed and extended to spinal cord volume loss in a large observational study.9 However, further research is needed to understand whether NfL may allow treatment decisions on an individual patient basis.
In contrast to 3 recent studies that reported treatment effects of disease-modifying therapies on blood NfL levels in observational settings,6–9 the parallel controlled study design of FREEDOMS and TRANSFORMS allowed controlling for potential spontaneous remission (“regression to the mean”) and therefore provided a reliable estimate of fingolimod's effect. In both of these parallel controlled studies, fingolimod treatment was associated with significantly lower NfL levels than the comparators, placebo, or IFN-β-1a, and this effect was seen from the first measurement at 6 months until the end of the studies.
We have shown that blood NfL levels are closely related to clinical and MRI measures in patients with RRMS, which capture features of acute disease activity, worsening of disability, and tissue loss. In contrast to imaging markers, it is feasible to measure blood NfL serially, with minimal burden to the patient. NfL levels in blood appear suitable to monitor disease activity and drug response in real time. In the future, with the availability of a normative database containing reference ranges for NfL levels that take into account the age-dependent increase of blood NfL in healthy controls and more data about the effects of comorbidities, NfL could also inform treatment decisions at the individual level.
Glossary
- CDW
confirmed disability worsening
- CV
coefficient of variation
- EDSS
Expanded Disability Status Scale
- EOS
end of study
- FREEDOMS
Efficacy and Safety of Fingolimod in Patients with Relapsing-Remitting Multiple Sclerosis
- Gd
gadolinium
- GeoMean
geometric mean
- IFN
interferon
- ITT
intention-to-treat
- MS
multiple sclerosis
- NfL
neurofilament light chain
- RRMS
relapsing-remitting multiple sclerosis
- SIMOA
single molecule array
- TRANSFORMS
Efficacy and Safety of Fingolimod in Patients with Relapsing-Remitting Multiple Sclerosis with Optional Extension Phase
Footnotes
See page 451
Author contributions
J. Kuhle: literature search, figures, data generation, data analysis, data interpretation, writing. H. Kropshofer: literature search, study design and data interpretation, writing and critical review of manuscript. D.A. Haering: data analysis and interpretation, and critical review of manuscript. U. Kundu: literature search, manuscript drafting, revising and editing. R. Meinert: statistical analysis, figures, and manuscript review. C. Barro: literature search, data generation and data interpretation, critical review of manuscript. F. Dahlke, D. Tomic, and D. Leppert: study design, data interpretation, and critical review of the manuscript. L. Kappos: study design, data collection and data interpretation, and critical review of manuscript.
Study funding
The study was funded by Novartis Pharma AG and the Swiss National Science Foundation (320030_160221). The study sponsor (Novartis Pharma AG) participated in the design and conduct of the study, data collection, data management, data analysis and interpretation, and preparation, review, and approval of the manuscript. The measurement of NfL levels was performed (by fully blinded staff) at the University Hospital, Basel, Switzerland, and the data were provided to the sponsor. The biostatistical analyses were done at DATAMAP, Freiburg, Germany.
Disclosure
J. Kuhle's institution (University Hospital Basel) received and exclusively used for research support: consulting fees from Biogen, Novartis, Protagen AG, Roche, and Teva; speaker fees from the Swiss MS Society, Biogen, Genzyme, Merck, Novartis, Roche; travel expenses from Merck Serono, Novartis, and Roche; and grants from the ECTRIMS Research Fellowship Programme, University of Basel, Swiss MS Society, Swiss National Research Foundation (320030_160221), Bayer, Biogen, Genzyme, Merck, Novartis, and Roche. H. Kropshofer is an employee of Novartis Pharma AG. D. Haering is an employee of Novartis Pharma AG. U. Kundu is an employee of Novartis Healthcare. R. Meinert is an employee of DATAMAP GmbH, Freiburg, Germany, which provides services to Novartis Pharma AG. C. Barro received travel support from Teva and Novartis. F. Dahlke is an employee of Novartis Pharma AG. D. Tomic is an employee of Novartis Pharma AG. D. Leppert is an employee of Novartis Pharma AG. L. Kappos' institution (University Hospital Basel) has received in the last 3 years and used exclusively for research support: steering committee, advisory board, and consultancy fees from Actelion, Addex, Bayer HealthCare, Biogen Idec, Biotica, Genzyme, Lilly, Merck, Mitsubishi, Novartis, Ono Pharma, Pfizer, Receptos, Sanofi, Santhera, Siemens, Teva, UCB, and XenoPort; speaker fees from Bayer HealthCare, Biogen Idec, Merck, Novartis, Sanofi, and Teva; support for educational activities from Bayer HealthCare, Biogen, CSL Behring Genzyme, Merck, Novartis, Sanofi, and Teva; license fees for Neurostatus products; and grants from Bayer HealthCare, Biogen Idec, European Union, Merck, Novartis, Roche Research Foundation, Swiss MS Society, and the Swiss National Research Foundation. Go to Neurology.org/N for full disclosures.
References
- 1.Wattjes MP, Rovira À, Miller D, et al. Evidence-based guidelines: MAGNIMS consensus guidelines on the use of MRI in multiple sclerosis: establishing disease prognosis and monitoring patients. Nat Rev Neurol 2015;11:597–606. [DOI] [PubMed] [Google Scholar]
- 2.Saindane AM, Law M, Ge Y, Johnson G, Babb JS, Grossman RI. Correlation of diffusion tensor and dynamic perfusion MR imaging metrics in normal-appearing corpus callosum: support for primary hypoperfusion in multiple sclerosis. AJNR Am J Neuroradiol 2007;28:767–772. [PMC free article] [PubMed] [Google Scholar]
- 3.Arrambide G, Espejo C, Eixarch H, et al. Neurofilament light chain level is a weak risk factor for the development of MS. Neurology 2016;87:1076–1084. [DOI] [PMC free article] [PubMed] [Google Scholar]
- 4.Kuhle J, Barro C, Disanto G, et al. Serum neurofilament light chain in early relapsing remitting MS is increased and correlates with CSF levels and with MRI measures of disease severity. Mult Scler 2016;22:1550–1559. [DOI] [PubMed] [Google Scholar]
- 5.Kuhle J, Nourbakhsh B, Grant D, et al. Serum neurofilament is associated with progression of brain atrophy and disability in early MS. Neurology 2017;88:826–831. [DOI] [PMC free article] [PubMed] [Google Scholar]
- 6.Disanto G, Barro C, Benkert P, et al. Serum neurofilament light: a biomarker of neuronal damage in multiple sclerosis. Ann Neurol 2017;81:857–870. [DOI] [PMC free article] [PubMed] [Google Scholar]
- 7.Piehl F, Kockum I, Khademi M, et al. Plasma neurofilament light chain levels in patients with MS switching from injectable therapies to fingolimod. Mult Scler 2018;24:1046–1054. [DOI] [PubMed] [Google Scholar]
- 8.Novakova L, Zetterberg H, Sundström P, et al. Monitoring disease activity in multiple sclerosis using serum neurofilament light protein. Neurology 2017;89:2230–2237. [DOI] [PMC free article] [PubMed] [Google Scholar]
- 9.Barro C, Benkert P, Disanto G, et al. Serum neurofilament light chain as a predictor of disease worsening and brain and spinal cord atrophy in multiple sclerosis. Brain Epub 2018 May 30. [DOI] [PubMed]
- 10.Gisslen M, Price RW, Andreasson U, et al. Plasma concentration of the neurofilament light protein (NfL) is a biomarker of CNS injury in HIV infection: a cross-sectional study. EBioMedicine 2016;3:135–140. [DOI] [PMC free article] [PubMed] [Google Scholar]
- 11.Kappos L, Radue EW, O'Connor P, et al. A placebo-controlled trial of oral fingolimod in relapsing multiple sclerosis. N Engl J Med 2010;362:387–401. [DOI] [PubMed] [Google Scholar]
- 12.Cohen JA, Barkhof F, Comi G, et al. Oral fingolimod or intramuscular interferon for relapsing multiple sclerosis. N Engl J Med 2010;362:402–415. [DOI] [PubMed] [Google Scholar]
- 13.De Stefano N, Silva DG, Barnett MH. Effect of fingolimod on brain volume loss in patients with multiple sclerosis. CNS Drugs 2017;31:289–305. [DOI] [PMC free article] [PubMed] [Google Scholar]
- 14.Norgren N, Sundström P, Svenningsson A, Rosengren L, Stigbrand T, Gunnarsson M. Neurofilament and glial fibrillary acidic protein in multiple sclerosis. Neurology 2004;63:1586–1590. [DOI] [PubMed] [Google Scholar]
- 15.Teunissen CE, Iacobaeus E, Khademi M, et al. Combination of CSF N-acetylaspartate and neurofilaments in multiple sclerosis. Neurology 2009;72:1322–1329. [DOI] [PubMed] [Google Scholar]
- 16.Gunnarsson M, Malmeström C, Axelsson M, et al. Axonal damage in relapsing multiple sclerosis is markedly reduced by natalizumab. Ann Neurol 2011;69:83–89. [DOI] [PubMed] [Google Scholar]
- 17.Romme Christensen J, Börnsen L, Khademi M, et al. CSF inflammation and axonal damage are increased and correlate in progressive multiple sclerosis. Mult Scler 2013;19:877–884. [DOI] [PubMed] [Google Scholar]
- 18.Novakova L, Axelsson M, Khademi M, et al. Cerebrospinal fluid biomarkers as a measure of disease activity and treatment efficacy in relapsing-remitting multiple sclerosis. J Neurochem 2017;141:296–304. [DOI] [PubMed] [Google Scholar]
- 19.Kappos L, Moeri D, Radue EW, et al. Predictive value of gadolinium-enhanced magnetic resonance imaging for relapse rate and changes in disability or impairment in multiple sclerosis: a meta-analysis. Gadolinium MRI Meta-analysis Group. Lancet 1999;353:964–969. [DOI] [PubMed] [Google Scholar]
- 20.Barkhof F. The clinico-radiological paradox in multiple sclerosis revisited. Curr Opin Neurol 2002;15:239–245. [DOI] [PubMed] [Google Scholar]
- 21.Radue EW, Barkhof F, Kappos L, et al. Correlation between brain volume loss and clinical and MRI outcomes in multiple sclerosis. Neurology 2015;84:784–793. [DOI] [PMC free article] [PubMed] [Google Scholar]
- 22.Kuhlmann T, Lingfeld G, Bitsch A, Schuchardt J, Brück W. Acute axonal damage in multiple sclerosis is most extensive in early disease stages and decreases over time. Brain 2002;125:2202–2212. [DOI] [PubMed] [Google Scholar]
- 23.Petzold A, Steenwijk MD, Eikelenboom JM, Wattjes MP, Uitdehaag BM. Elevated CSF neurofilament proteins predict brain atrophy: a 15-year follow-up study. Mult Scler 2016;22:1154–1162. [DOI] [PubMed] [Google Scholar]
Associated Data
This section collects any data citations, data availability statements, or supplementary materials included in this article.
Data Availability Statement
Anonymized data not published within this article will be made available by request from any qualified investigator.