

Abstract
Cryogenic electron microscopy (cryo-EM) enables structure determination of macromolecular objects and their assemblies. Although the techniques have been developing for nearly four decades, they have gained widespread attention in recent years due to technical advances on numerous fronts, enabling traditional microscopists to break into the world of molecular structural biology. Many samples can now be routinely analyzed at near-atomic resolution using standard imaging and image analysis techniques. However, numerous challenges to conventional workflows remain, and continued technical advances open entirely novel opportunities for discovery and exploration. Here, I will review some of the main methods surrounding cryo-EM with an emphasis specifically on single-particle analysis, and I will highlight challenges, open questions, and opportunities for methodology development.
Keywords: protein structure, cryo-electron microscopy, single-particle analysis, protein–protein interaction, structural biology, atomic resolution
Introduction
Cryo-EM enables structure determination of monodisperse macromolecular assemblies imaged at cryogenic temperatures in a transmission electron microscope. Cryo-EM techniques have been rapidly developing over the last several years and have become standard tools in the structural biologist's toolkit (1). Numerous technical advances, including the introduction of direct electron detectors coupled to the development of algorithms that correct for beam-induced movement and specimen drift (2–4), the adoption of automated data collection strategies (5, 6), and the introduction of novel software for image analysis (7–10), all coupled to systematic improvements in auxiliary methodologies surrounding microscope operation and general cryo-EM workflows, have enabled the wide adoption of the technique for many structural biology applications. In many instances, cryo-EM is now the first go-to method for structural analysis of specific biological samples (11). For these and other reasons, the 2017 Nobel prize in Chemistry was awarded to Jacques Dubochet, Richard Henderson, and Joachim Frank for “developing cryo-EM for the high-resolution structure determination of biomolecules in solution” (12–14).
Beyond simply extending capabilities to samples that cannot be crystallized, cryo-EM techniques open entirely new questions and raise novel challenges, especially pertaining to dynamic and heterogeneous assemblies (15) or for in situ cellular structural biology (16). The latter topic has been witnessing exciting developments of its own (usually in the context of cryo-electron tomography) and has been discussed elsewhere in recent reviews (16, 17). In regard to cryo-EM single-particle analysis (SPA),2 multiple good recent reviews and perspectives cover the history and development of the field, as well as applications to macromolecular structural biology, and the reader is directed to them for further details (1, 18–23). Here, I will focus on what I believe are the current bottlenecks to streamlined and automated workflows specific to SPA of purified macromolecular samples within the confines of a generalized workflow (Fig. 1), highlighting some of the current technical limitations, open questions, and exciting areas of development.
Figure 1.
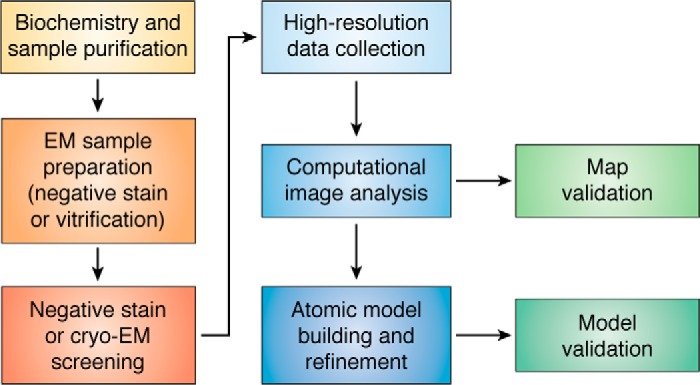
General workflow for single-particle analysis. The main steps in the SPA workflow are depicted and will be referred to throughout the text. Although the workflow is depicted as approximately linear, often times the process is iterative, and it may be necessary to go back and optimize individual steps prior to proceeding forward.
Macromolecular specimen isolation and purification
Biological macromolecules and macromolecular assemblies are characterized by complex three-dimensional architectures with precisely defined local environments, both of which have been fine-tuned over millions of years of evolution. Macromolecular structure is crucial to macromolecular function, and deciphering the structure/function relationship—the central goal in the field of molecular structural biology—has illuminated the molecular world. Most current structural biology experiments begin by defining a question with respect to a macromolecular object of interest and subsequently isolating and purifying the sample from its cellular context (for the purpose of this review, in situ structural biology approaches will not be discussed). Single-particle cryo-EM techniques of purified specimens have facilitated defining molecular structures for samples that were not amenable to conventional crystallographic approaches. For example, structures of mitochondrial ribosomes (24–26), eukaryotic spliceosomes (27–30), different types of membrane proteins (31–35), all of which previously resisted crystallographic studies, but also many other specimens (23), could be solved using cryo-EM single-particle analysis, revealing fascinating novel principles in macromolecular structural biology and potentially paving the road for novel therapeutic approaches.
Arguably, sample purification remains one of the key bottlenecks to structural analysis, especially for dynamic and/or transiently interacting assemblies (36). A purified sample should have a reasonable degree of stability and homogeneity. Typically, an SDS-polyacrylamide gel and size-exclusion peak from gel filtration should inform the researcher of the relative sample purity and whether there are contaminating bands or peaks that would impede structural studies. For most samples, these two biochemical assessments are a minimal requirement prior to initiating cryo-EM analysis. Concentrations in the micromolar range can produce well-distributed and polydisperse particles on holey cryo-EM grids (individual particles are distributed within holes etched into a carbon or gold support film). Higher concentrations may require the use of surfactants, such as detergents, to avoid oversaturating the field of view (37). However, in many instances, especially with larger and less abundant macromolecular assemblies, gel filtration is not an option, as the sample is too scarce. In such cases, an SDS-polyacrylamide gel followed by silver staining or Western blotting may suffice, but it would be of benefit to perform preliminary data analysis to look for homogeneous particles (see sections below), either using negative stain or with vitrified specimen, which can guide optimization of the purification protocol. In addition to changing the buffer conditions, the presence/absence of surfactants (for vitrification purposes), and general biochemical procedures, there are specific tools available for screening and evaluating the stability of macromolecular assemblies (e.g. differential scanning calorimetry (DSC), differential scanning fluorescence (DSF), ProteoPlex (38)). Some laboratories have found that the gradient fixation (GraFix) approach—wherein macromolecules undergo a weak, intramolecular chemical cross-linking while being purified by density gradient ultracentrifugation (39, 40)—can be beneficial for stabilizing rare and/or dynamic complexes that have tendencies to dissociate into its constituent components (41–43). As with any cross-linking method, there is always the potential to induce artifacts caused by chemical fixation. However, the argument is that the cross-links will be randomly dispersed throughout the molecular assembly and thus will be averaged out during image analysis. Biochemical sample preparation and optimization can be iterative processes, often guided by and benefiting from multiple rounds of data collection and analysis.
The goal of a single-particle imaging experiment is to capture all relevant structural states through classification, an idea that will be elaborated upon under “Computational image analysis” below. Numerous studies have taken advantage of this concept and demonstrated the utility of computational classification approaches, following data collection, to successfully “purify” complexes in silico, in cases where traditional biochemical approaches proved insufficient to isolate the specimen of interest free of undesired contaminating particles (44–46). However, this comes with the significant drawback of requiring larger datasets, because the final resolution for any individual map is directly related to the number of particles from which it is derived (47). To facilitate in silico purification and identification of specific subunits, tags can be placed on the protein-of-interest, such as the fragment antigen-binding (fab) regions of antibodies (48) or site-specific labels (49). Some groups have also experimented with scaffolds to allow for more routine structure determination of smaller objects-of-interest or for facilitating purification (50–52), although its success will likely vary depending on the properties of the sample.
As the tools become more developed, and the downstream protocols become more automated, we will want to examine more challenging samples, including those that may be less abundant, that contain transiently interacting factors, and that generally represent highly dynamic and heterogeneous assemblies. It should be possible to perform relatively crude purifications, even starting from cell lysate (53, 54), and to capture a spectrum of heterogeneity within the imaged sample (55). Accomplishing such a task for higher-resolution studies would feed off of developments in all the downstream steps, especially as pertains to specimen vitrification (which can disrupt macromolecular integrity through destructive forces at the air–water interface (56)), data collection (which will benefit from further speedups (57, 58)), and image analysis (which can become complex for highly heterogeneous cases). Although in silico purification approaches will be useful, the rarer and more challenging the sample, the more necessary it will be to optimize sample purity biochemically; and as always, the adage “garbage in, garbage out” will apply. In this regard, one particularly attractive approach is the use of affinity grids for on-grid specimen purification (59–61). Although the initial applications have been limited in scope (62–65), it seems possible that a highly-specific and well-conjugated tag, coupled to a rigorous on-grid purification protocol, has the potential to provide a powerful means to isolate and explore rare biological assemblies with interesting functional properties.
Sample preparation for imaging in a transmission electron microscope
Once the sample has been purified and verified biochemically, it is applied onto grids for screening and data collection. There are two major methods for sample preparation for imaging in an electron microscope: negative staining and vitrification. Negative staining constitutes the application of a heavy metal stain (e.g. uranyl acetate/formate, ammonium molybdate, methylamine tungstate, etc.) to the sample (66, 67). The process effectively dehydrates the sample, and the grids can be stored for a long period of time at room temperature. Grids are imaged under room temperature conditions, and the contrast is generated by the heavy metal atoms surrounding the molecule of interest. Vitrification constitutes freezing the sample under liquid nitrogen temperatures (typically into liquid ethane medium). The process, which was in part influenced by earlier reports with 2D crystals (68), maintains a “near-native” state of molecular preservation, as the buffer, being vitreous (or glass-like), does not have sufficient time to crystallize (69–72). The grids must be stored under cryogenic conditions. Images are acquired under liquid nitrogen temperatures, and the contrast is generated by electron scattering from the atoms within the sample itself.
Negative staining is a powerful technique that has been used for many successful structural studies at low resolution (66, 73). However, several things are important to note. First, because the contrast is generated by the heavy metal atoms, the approach generates an outline of the particle, whereas all of the internal information is lost. Second, the stain dehydrates and flattens the object, which can be readily observed when the grid is imaged at a tilt angle (74). Third, there is an additional layer of carbon, which increases background noise. All these factors, as well as the grain size of the stain, fundamentally limit the resolution and the information that can be obtained. However, negative stain can also provide the experimentalist with a quick and meaningful understanding of the quality of the sample (31). For this reason, a high-throughput approach, e.g. for rapid sample screening and optimization, can be useful and time-saving for difficult samples or for identifying optimal buffer conditions. One such approach is currently being developed at the National Resource for Automated Molecular Microscopy (NRAMM),3 based on a prototype instrument (75).
When initiating cryo-EM experiments after successful results from a negative stain, several problems may be encountered. First, negative staining typically requires ∼1 order of magnitude lower sample concentration, because the particles adhere to a thin carbon support film, to which they have a high affinity and preference over empty holes. Second, the carbon support film can induce severe and/or altered preferential orientations, as compared with the air–water interface in conventional holey grids (76). For this reason, the negative staining protocol is distinct from cryo-EM vitrification, and structures obtained by negative staining may not immediately translate into high-resolution structures by cryo-EM. As a result, some groups, including my own, have in many cases omitted negative staining altogether.
Vitrification can be performed using numerous devices. A conventional manual plunge freezer has been around since the 1980s and has worked astonishingly well for vitrifying many different samples (71). Remarkably, a large percentage of the user base in the microscope facility employed by researchers from the Salk Institute and The Scripps Research Institute still uses the same manual plungers and prefers them to robotic vitrification instruments, such as the ThermoFisher Scientific (formerly FEI) Vitrobot, Gatan Cryoplunge 3 System, or the Leica EM GP. For the most part, they all perform the same standard procedure as one would carry out by hand, using filter paper to blot off excess buffer and plunge-freeze the grid into liquid ethane (70), but the protocols are roboticized, and are performed within a controlled environment (77). They provide the user with the ability to, for example, reproducibly vary the blotting time, specify single- or double-side blotting, angle of the filter paper, etc. For lower-abundance samples (sub-micromolar quantities), there is a high likelihood that the particles will not go into the grid holes. In this case, support films can be floated onto the grids, and the sample would be adhered to the film (78). The use of graphene (79–82), graphene oxide (83–85), and other supports (86) have also been employed and are currently being optimized for routine use.
There are multiple disadvantages to any vitrification approach that uses filter paper for sample blotting. First, the majority of the sample is discarded, and only nanoliters of material remain vitrified on the grid. Second, the user is limited to the application of a single sample on a grid, whereas only a small fraction of the grid is actually required for a high-resolution dataset. Third, the ice thickness often varies from one square to another. There have also been discussions that ions (like calcium) can potentially leak from the filter paper to the sample, thus disrupting the integrity or influencing the structural properties of ion channels, for example. Finally, in almost all instances, the sample appears to be absorbed to one of two air–water interfaces (87). The last problem is particularly bad and stems from the sample hitting the air–water interface orders of magnitude times faster than the time it takes for it to plunge into the ethane medium. Every time the particles hit the air–water interfaces, they tend to stick, and consequently, the vast majority of the particles end up adsorbing to one of two interfaces, at the top and bottom of the grid (87). This is a major problem, as it causes “preferred specimen orientation,” which results in resolution anisotropy within the final map (Fig. 2A, and see “Microscopy and data collection” and “Cryo-EM map and atomic model validation” below) and can also lead to protein denaturation at the site of contact (56).
Figure 2.

Preferred particle orientation and specimen tilting. A, top view of a cryo-EM grid (schematic) and selected cross-section within a particular hole. Particles within each hole are typically adsorbed to one of two air–water interfaces, causing them to adopt a preferred orientation on grids (87). Preferred particle orientation leads to anisotropic resolution in the reconstructed map. B, to overcome the preferred orientation and anisotropic resolution problem, the grid can be tilted inside the electron microscope (electron beam is in green). This results in more even coverage of Fourier space voxels and an improvement in the reconstructed volume.
To overcome some of the problems with conventional blotting and vitrification, the instrument Spotiton has been developed at NRAMM, which uses inkjet printing heads with picoliter dispensing capabilities to spot samples onto grids (88). Initially, the instrument was developed to reproducibly spot small volumes of sample onto cryo-EM grids and generate “perfectly thin ice,” with additional capabilities of multiplexing the spotting process and vitrifying multiple samples on the grid (88, 89). These advances addressed the first three issues described above (namely discarding the sample and large areas of ice thickness variation). Unexpectedly, the developers also noticed that it was possible to reduce specimen adherence to the air–water interface, and therefore preferred particle orientation and resulting directional resolution anisotropy, by minimizing the time between spotting and plunging (90). However, even the fastest spot-to-plunge times do not completely overcome specimen adherence to the air–water interface, and further speedups are being developed within in-house and commercial instruments. Low spot-to-plunge times may therefore have major benefits for routine and automated sample preparation in SPA and may be applicable to other instruments that aim to automate and improve conventional blotting methods. It is worth noting that, under some circumstances, one may actually want to exploit sample adherence to the air–water interface to the experimenter's advantage, for example for concentrating rare samples (91). Anytime the specimen adheres to the air–water interface, there is the possibility of partial sample denaturation, but if this is the only mechanism by which to distribute particles within holes and away from the grainy and noisy carbon, it may remain the best strategy, at least for some samples in the future. One can then use tilted data collection strategies to overcome preferred orientation (Fig. 2B), as discussed below.
The basic method for vitrification has changed little in the last 40 years and works remarkably well. But it is nonetheless limited. The ability to reproducibly titrate the thickness of the ice and to ensure even ice across the entirety of the grid will dramatically speed up workflows. Multiplexing capabilities, coupled with the ability to load and screen multiple samples during a microscope session, should essentially ensure that a good grid can be obtained every time a sample is purified, at least for “well-behaved” and abundant samples. Solving the air–water interface problem, either by reducing the spot-to-plunge time (90), through the development of substrate supports (86), or through other methods (92), should reproducibly and routinely diminish the orientation bias and affect the resulting resolution anisotropy.
Microscopy and data collection
Data collection procedures for single-particle cryo-EM have become more standardized in recent years. They have increasingly relied on automated software, such as the Leginon system that pioneered automated data collection methodologies (5, 93, 94), or SerialEM (6), EPU (ThermoFisher Scientific), among others (96). Multiple user facilities, for example at New York Structural Biology Center, Janelia Research Campus, the recently established national centers, and many places around the world, have standardized their procedures for data acquisition, at least for the specific facility. Because the development (97) and implementation of the first counting detectors (3, 4), which can directly count each incident electron on a camera pixel, much of the field has migrated toward them due to the improved detective quantum efficiency (DQE, a measure of signal-to-noise ratio of the detector at different spatial frequencies) (98, 99), especially within the low-frequency range that is relevant for computational image analysis (100).
A common problem that is encountered with many samples is preferential specimen orientation through adherence to the air–water interface, which leads to anisotropic resolution in the map. The user collects a dataset, spends weeks processing the data to obtain a map, only to find out that it is smeared in the Z direction and difficult to interpret. The user can easily spend months trying out and screening different substrate supports, surfactants, surface treatment strategies, etc., to ameliorate the preferential orientation problem and alter the orientation distribution (35, 37, 101, 102). However, none of these are generalizable. Because of the geometry of the imaging experiment, simply tilting the specimen can largely alleviate the problem in a generally applicable manner (Fig. 2B) (103). Using tilts during data collection results in more even coverage of Fourier space voxels and a corresponding improvement in the reconstructed volume. Previously, we compared reconstructions of the hemagglutinin (HA) trimer, which is oriented in predominantly top views (103) from data collected at different tilt angles. Reconstructions from tilted images show less stretching, better defined features, and less problems caused by misalignment of orientation (streaking evident within top views, caused by iterative refinement in the context of uneven orientation sampling) (Fig. 3A). Although some amount of anisotropy will likely remain even after tilting (indicated by the 3D FSCs in Fig. 3B), as only a uniform orientation distribution results in a completely isotropic map, in practice, tilting is sufficient to solve many of the problems and has been successfully applied to multiple specimens by numerous laboratories (104–108). The approach does not require any modification to the data collection strategy other than setting the tilt angle during image acquisition (and potentially using a higher frame rate to account for increased beam-induced movement). The practical disadvantages are that the sample exhibits more beam-induced movement at tilt, the focus gradient needs to be properly estimated, and the ice is inherently thicker due to geometry. We believe that the first two problems will be addressed with improved computational methods, whereas increased ice thickness is unavoidable, and its effects must be experimentally determined. Until the preferred orientation problem is completely eliminated, the tilting strategy remains a robust technique for solving the anisotropy problem. It should nonetheless be noted that tilting will not address sample denaturation at the air–water interface (80), which must be done through chemical or other means.
Figure 3.

Experimental results showing the utility of a tilted data collection strategy. Comparison of HA trimer reconstructions refined and reconstructed independently from 0°-untilted images (top) or from 40°-tilted images (bottom). A, left to right, side view of the experimental reconstruction (in gray, the direction of preferred orientation is indicated by the red arrowhead) superimposed onto a projection of the envelope of the HA trimer crystal structure (in pink), displayed alongside a top view and a close-up of a particular region. The black arrowhead indicates streaking in the unsharpened map, which results from misalignment of orientations and/or overfitting. B, experimental half-map and map-to-model 3D FSC isosurfaces. The map-to-model 3D FSCs, which measure correlation to the true structure, are much worse than the half-map 3D FSCs, which measure the internal correlation of two randomly selected half-subsets of the data during refinement. This indicates that some amount of overfitting is present during refinement, since the resulting maps are worse than their apparent reported resolution. Figure adapted from Ref. 103.
It is worth emphasizing that resolutions still rarely break 3 Å, even though, in principle, there may not be a theoretical barrier for achieving this (Fig. 4, A and B). Thus, users often want to optimize their collection strategies for their particular sample. For example, one may vary the dose, the amount of underfocus used for imaging, whether image shift or stage position is used for targeting (109), the frame rate, etc. We have started using higher frame rates (e.g. 20 frames/s) to account for beam-induced movement (110, 111) in the beginning of the movie (2–4). Although this can be successful, currently, with constant frame rates in most of the current generation of detectors, the strategy has the drawback that a large movie must be recorded to compensate for movement that occurs largely in the first few frames; effectively, the majority of the movie becomes redundant. To account for this, variable frame rates have been introduced in the latest generation K3 detectors (Gatan) and should become more standard, especially as we learn more about the mechanisms of beam-induced movement. Other aspects, such as dose rate, total dose, magnification (and the balance between smaller field of view versus improved low-frequency DQE (112)), etc., would be relevant to obtain a quantitative understanding of the current bottlenecks within the structure determination pipeline.
Figure 4.

Advances in cryo-EM map depositions and resolutions by year. A, new depositions into the Electron Microscopy Data Bank by year. B, resolutions of deposited maps in 2018. C, highest resolutions for non-icosahedral specimens by year. D, highest resolutions for icosahedral specimens by year.
The selection of a cost-effective microscope for routine high-resolution molecular structural biology remains an open question. The vast majority of high-resolution structures deposited into the EM data bank (113) have been collected on a 300-kV microscope, typically a Titan Krios manufactured by ThermoFisher Scientific (formerly FEI company)—the most expensive electron microscope on the market. The higher accelerating voltage reduces the amount of inelastic electron scattering (low-dose images are primarily formed by elastically scattered electrons) and specimen charging (114, 115), but this microscope may not be the most cost-effective solution to individual institutions. Recently, cheaper 200-kV microscopes have been shown to be amenable for high-resolution structural biology, including for sub-4 Å (116) and sub-3 Å structures (117). Atomic cross-sections for elastically (and inelastically) scattered electrons increase at lower microscope accelerating voltages, which leads to more low-resolution contrast within the images, albeit at the expense of a dampened envelope and increased inelastic scattering (118). Although it is still not clear whether current resolutions on a 200-kV system are limited by the two-condenser lens system of the Talos Arctica—the mid-range microscope manufactured by ThermoFisher Scientific—and whether the improvements arise from the increased contrast of lower kV instruments, or simply general improvements in data collection and analysis protocols, these preliminary results are exciting, because they demonstrate that significantly cheaper microscopes can be used for routine high-resolution data collection. It will be particularly interesting to watch for developments with even lower voltage (e.g. 100 kV) microscopes as, for example, proposed by Vinothkumar and Henderson (20) for routine single-particle applications in the future. Presumably, some of the ancillary effects of lower kV, such as increased curvatures of the Ewald sphere (119, 120) or lens aberrations (121, 122), can be corrected computationally. However, multiple inelastic scattering events will also increase at lower kV and will no longer contribute coherently to the image (118). Efforts toward quantifying the energy dependence of contrast and radiation damage in cryo-EM are underway and will help guide microscope developments and their application to molecular structural biology (123). It will be interesting to see how data collection strategies will be transformed over the ensuing years, and whether lower accelerating voltage microscopes gain popularity for routine single-particle work.
Although cryo-EM capabilities are fast approaching those of X-ray crystallography (124–126), data collection time and efficiency still lag far behind by several orders of magnitude. One interesting approach to speed up data collection is to use the electron beam-shift (instead of the stage) for moving to different areas of the grid, while compensating for the introduced beam tilt using the microscope's deflection coils (127, 128). An alternative to active beam-tilt compensation is to estimate and correct the residual beam tilt computationally (126), but further studies will need to be conducted to explore the benefits of each approach. Both can provide severalfold speedup within a data collection session, potentially without compromising image quality. Larger fields of view on the detector will provide further gains. Such improvements would be broadly beneficial to the structural biology community, but might have particular implications to the pharmaceutical industry, which will benefit from rapidly defining the footprints of small molecules on macromolecular targets of interest. Many classes of proteins simply cannot be routinely crystallized (for example, membrane proteins), and therefore, cryo-EM represents an important alternative to traditional crystallographic structure-based drug design (SBDD) strategies. However, current improvements will still be insufficient for the throughput necessary for routine SBDD, due to the requirement for solving many structures bound to different small molecules, in parallel and in an iterative manner (58, 129). An alternative may be to simply maintain “microscope farms” within a facility, all devoted to automated and high-throughput data collection for structure determination. While not necessarily the most elegant solution, this may be the best medium-term approach for routine sub-2 Å resolution drug studies.
Computational image analysis
Once the data are collected, it is necessary to analyze the images to come up with one or several reconstructions representing the imaged object. Not too long ago, image processing involved many independent, time-consuming, and often experimental steps. Today, much of it, at least for “easy” samples, is more automated within consolidated workflows. There is a large variety of software available for image analysis, developed over the last ∼4 decades (130). Generally speaking, single-particle–specific software is designed to take raw cryo-EM micrographs, select particles, perform 2D and 3D alignments and classifications, assign or refine angular orientations (rotations and translations, either ab initio or using a model), and reconstruct the object(s). Many other features and functionalities are often built-in to different software, and “wrapper” packages are often employed to get the best procedures from each (130–133). For some samples, high-resolution maps can be obtained within a few hours and during data collection following a standardized and largely automated protocol (124); it is even possible to go from raw material to a high-resolution reconstruction in less than 24 h (134). An experienced user can often quickly generate high-resolution reconstructions with more challenging samples, although this requires being trained in the field and intimately familiar with the pitfalls of SPA. There is every reason to believe that the trend toward more automated workflows will continue, and automation will take over many aspects of single-particle analysis and reconstruction, much like in the X-ray crystallography field.
Size limits in cryo-EM also continue to decrease. Even a few years ago, it was difficult to imagine obtaining a near-atomic resolution structure for complexes or samples that are less than ∼100 kDa (135). The challenge arises due to the mechanism of image formation in a microscope characterized by an approximately sinusoidal contrast transfer function (CTF), which results in poor low-resolution contrast for weak-phase objects. The smaller the object, the more difficult it is to distinguish it from background noise and thus the more difficult to computationally analyze (100). One idea was that phase plates, which introduce a phase shift (ideally π/2) between the scattered and unscattered waves inside the microscope, thus producing a cosine-type CTF and improving low-resolution contrast, could more readily address size limitations (136, 137). As the techniques continue to evolve, determining structures of small proteins is becoming more feasible and can be achieved with (81, 138) and without (139) the use of phase plates. There is no silver bullet to achieving this, but it seems that a combination of higher magnification, larger dataset sizes, careful image analysis, and possibly lower accelerating voltages (and/or phase plates), facilitate reaching higher resolutions. Presumably, small particles will become more routine for structural studies with better detectors and continued software advances, reaching their predicted limit speculated some time ago (114). Given that the current generation phase plates have some drawbacks, including inconsistencies in the amount of phase shift, additional computational requirements, and inherent information loss (137), direct comparisons with and without phase plates (such as for tomography (140)) will be helpful to definitively define phase plate utility for routine SPA workflows. It will also be interesting to follow the advances of phase plate technology, especially as the next generation of laser phase plates (141, 142) is being developed.
Although cryo-EM resolutions have consistently improved, it is worth emphasizing that the first near-atomic structures from a single-particle experiment were published 10 years ago, independently by three groups (Fig. 4, C and D) (143–145). However, the above studies were limited to a select few cases of icosahedral viruses. Since then, many different aspects of the methodologies improved, such that a steady slew of smaller and generally more challenging structures could be obtained at increasingly higher resolutions (31, 124, 126, 146). We are now on the cusp of breaking into true atomic resolution, where carbon:carbon and perhaps soon even carbon:hydrogen bonds can be distinguished (Fig. 5). Interestingly, the majority of the highest-resolution information suffers radiation damage within the first several e−/Å2 (147). This exact fluence is also within the range that suffers the most beam-induced movement and consequently resolution loss, even within well-behaved samples imaged over gold grids (124). It seems likely that, unless we account for the beam-induced movement to make all particles “shiny” (the term was once coined during a session at the annual 3D Electron Microscopy Gordon Research Conference), resolutions will continue to lag behind microscope capabilities. The development of general supports for cryo-EM (86), coupled with continued improvements in software to correct for residual beam-induced movement, suggests that this may be possible in the near future, and it is likely that we may see an ∼1-Å, or even sub-Å, structure within a few years.
Figure 5.

High-resolution cryo-EM maps. A, β-gal, resolved to 1.90 Å (125). B, adeno-associated virus type 2, resolved to 1.86 Å (the reconstruction indicated the presence of hydrogen atoms) (124). C, human apoferritin, resolved to 1.65 Å (126). D, mouse apoferritin, resolved to 1.62 Å (R. Danev, H. Yanagisawa, and M. Kikkawa, manuscript in preparation), represent the state-of-the-art in cryo-EM reconstructions. The codes (EMD-####) refer to the deposition numbers within the electron microscopy databank (EMD).
Some of the most interesting data sets, arguably, are those that exhibit an extensive amount of structural heterogeneity. Heterogeneous datasets can provide insight into mechanisms of assembly or complex function and opportunities for discovering novel functionally relevant factors (106, 148, 149). Automated approaches are still underdeveloped for their analyses. To decipher structural heterogeneity, it is necessary to classify the particles in 3D (older successful analyses have also been performed in 2D (150)). Although 3D classifications are built into virtually every refinement software (7, 9, 151–154), their utility will vary, as will the accuracy with which they can identify distinct and especially sub-stoichiometric populations of particles. The analysis of heterogeneous structures can also be taken to its extreme. For example, it is possible to essentially take lysate from cells, put it on a grid, and obtain three-dimensional structures of select specimens (55). However, the current approaches are still limited to complexes that are highly abundant and homogeneous. For any practitioner of single particle analysis, it is well-known that even crudely purified macromolecular assemblies may present significant challenges to computational image analysis, and it is almost always advisable to improve the purity of the sample as a first step when troubleshooting a difficult specimen. In practice, it is not clear how many impurities it is possible to tolerate. Nonetheless, such “lysate-to-structure” methods represent the first steps toward the cryo-EM version of structural (or visual) proteomics (53, 54), and with the right approach (and perhaps mild biochemical enrichment), one can envision the possibility of taking relatively crude material and determining structures of many, or at least some, core macromolecules or macromolecular assemblies.
We often think of macromolecular dynamics in terms of discrete conformational or compositional states, such as those that characterize distinct enzymatic states or allosteric activators. However, many macromolecules are continuously or quasi-continuously dynamic. Several approaches have explicitly attempted to deal with the continuous flexibility problem, including normal mode analysis (155), and the manifold embedding approach (156). This is an ongoing field of development, which has the potential to define entire energy landscapes associated with continuous movement in addition to discrete structural states. When the complex has multiple moving parts, it is also possible to break them up into independently defined (and often continuously mobile) rigid bodies and treat them separately within individual refinement protocols (157). An alternative approach would be to use focused classification strategies to focus in on an area of interest, while excluding the rest of the molecule (158–160). Presumably, with increases in data size, computational power, and algorithmic capabilities, we will more actively apply continuous and quasi-continuous conformational analyses to macromolecular objects, at least on a focused regional basis.
With improved methods for classification, it is also possible to build upon old ideas pertaining to time-resolved structural studies. Over the years, different methods of fast specimen preparation have been introduced to capture transient structural states (161). Early pioneering work showed that one could capture the response of the acetylcholine receptor to its substrate, with millisecond reaction times, by spraying acetylcholine onto grids coated with the receptor prior to cryo-EM structural analysis (162). Similar experiments were performed in parallel to measure the response of acto-myosin ATPase to droplets of ATP (163). These efforts also led to the development of second and third generation apparatuses for mixing and reacting two reactants prior to their deposition on grids for structural analysis (164–166). Such techniques offer the opportunity to observe transient responses, for example to ligand and stimulants, or to UV pulses (167) and the redistribution of domains into distinct states.
When analyzing heterogeneous particles, the following questions are often encountered and also represent current challenges. How does one decide on the proper number of classes with which to represent the data? What is the right classification approach? What determines a significant difference between any two structures? Finally, and perhaps most importantly, what are the biological implications of each structural state? Arguably some of the most interesting biology exists within structurally heterogeneous datasets, and single-particle cryo-EM is, at its core, a single molecule technique that has a unique capability to make sense of such data. A comprehensive approach is required to make sense of increasingly more heterogeneous data sets, especially as the questions start to diverge from understanding static structures to studying dynamic assemblies.
Derivation of an atomic model
Many of the individual steps pertaining to atomic model building and refinement have relied upon the wealth of knowledge in physical and protein chemistry, as well as existing tools for crystallographic model refinement. Most of the first atomic models were obtained by manually building and real-space refinement in programs such as Coot (31) or by converting cryo-EM maps into structure factors and using established packages for crystallographic Fourier space refinement (168). Such approaches were logical extensions of existing workflows, as modeling packages lagged behind the rapid improvements in cryo-EM resolution that suddenly necessitated deriving atomic models. Over the last several years, many of the gaps have been closed, and there are now numerous available packages, both standalone and as part of existing suites, which are designed to perform many aspects of model building into real space cryo-EM maps (169–174). Automated model building tools (phenix.auto-build, Rosetta, ARP-wARP, MAINMAST, Buccaneer) have also been modified from X-ray crystallography to work with cryo-EM maps.
Moving forward, there are concrete differences that are unique to cryo-EM, which distinguish refinement of models into cryo-EM maps from X-ray maps. The atomic form factors in cryo-EM maps represent electrostatic potential of the atoms, whereas in X-ray maps, they represent electron density. This means that cryo-EM maps also contain information about charge states in the macromolecule, which are not detected in an X-ray experiment. Cryo-EM maps contain information about the phases of the Fourier transform of the imaged object, whereas the phases must be experimentally recovered in an X-ray scattering experiment. The presence of experimental phases also allows for easier interpretation of cryo-EM maps at a lower resolution than is typically accepted for X-ray crystallographic experiments. These and other factors (173) mean that cryo-EM refinements cannot simply borrow concepts from the crystallographic community, and some procedures need to be uniquely developed within the cryo-EM community. Understanding these fundamental differences will better help to derive atomic models from cryo-EM reconstructions, especially at true atomic resolution.
Cryo-EM map and atomic model validation
There is a common understanding that the most powerful, but also the most dangerous, aspect of single-particle cryo-EM is that a map will always emerge at the end of any workflow. Ensuring that the map, and subsequently the model, correctly represents the data to the best possible agreement is arguably the most important aspect of the experiment and will help to avoid serious mistakes and misinterpretations of the data (175–177). Validation measures have seen an extensive amount of development over the last several years, but they are not as standardized as in the X-ray crystallographic community. They will continue to evolve as resolutions improve and as heterogeneous data sets become more complicated. I have summarized some of the important questions that must be asked when evaluating the quality of a map and corresponding atomic model, both qualitatively and quantitatively (Fig. 6). There are numerous good reviews on validation topics that go into much more detail (178, 179). Furthermore, with the recent “Frontiers in Cryo-EM Validation” meeting held in Hinxton, United Kingdom, in January 2019, we can soon expect a timely update to the established standards set several years back (180). Finally, in addition to analyzing the standard validation metrics, as will be described below, it is always advisable that the reader exercise her/his own judgment in determining whether the structural data presented in a paper justifies the conclusions.
Figure 6.

Validation procedures for cryo-EM maps and models. Steps for helping to ensure correctness of the derived cryo-EM map (A) and associated atomic model (B). Specific recommendations can be found in Refs. 178–180, 202.
The standard metric for evaluating a reconstructed cryo-EM map is the FSC curve (181), which is the three-dimensional extension of the two-dimensional Fourier ring correlation curve (182) and describes the correlation between two “half-maps,” each reconstructed from randomly selected ½-subsets of the data, as a function of spatial resolution. The nominal resolution value can then be obtained by cutting off the curve at a specific threshold, typically 0.143 (47) (others have also been proposed (183)). Importantly, the shape of the FSC curve matters and can reflect much about the data and reconstruction process (103, 184, 185). For example, a careful analysis of the curve itself can provide insights into overfitting, heterogeneity, insufficient defocus spread, among other things (184). The FSC is a requirement for all publications and map depositions.
Although the evaluation of the global map resolution is critical, it often belies some of the most interesting features of the map, particularly those that exhibit structural heterogeneity. For this reason, local resolution analyses, typically computed in patches across the map, have become increasingly important to describe the quality of different regions of the reconstructed object (153, 186–189). The most common observation is that core regions of a map display higher resolution, whereas outer regions display lower resolution. Importantly, it is also possible to filter the map by local resolution, such that heterogeneous regions would be filtered to a lower resolution than homogeneous regions. Often times, especially for large assemblies, some of the most interesting biology occurs in the outer segments of a map, whereby auxiliary (often sub-stoichiometrically occupied) components or associated protein factors relay a signal to the catalytic core (190). The proper way to interpret such structural cascades is through a careful assessment of local resolution and of locally filtered maps (188, 191). Local resolution analyses have become more widely seen and arguably should be standard in cryo-EM publications and depositions.
More recently, the conventional one-dimensional FSC curve has been extended into three dimensions to describe the overall anisotropy, or directional resolution, of the reconstructed map (103, 192). Such 3D FSCs (Fig. 3) (103), which are themselves motivated by earlier work (193–195), can reveal a lot about the pathologies in the map and serve as a quantitative complement to conventional qualitative Euler angle distribution profiles. This is an important validation measure, which stems from the problems associated with vitrification causing preferential specimen orientation of the imaged object (see “Sample preparation for imaging in a transmission electron microscope” above) that results in nonuniform resolution in different directions. Because of the geometry of the imaging experiment, preferential specimen orientation typically manifests itself as poor resolution in the Z direction at the expense of better resolution in the X and Y directions. This effectively results in stretching of density features along the Z axis. In many cases, anisotropy may not cause much of a problem, either for model building/refinement or interpretation, but in more serious cases, it can severely deform the map and compromise its interpretability altogether; if not properly accounted for, even minor density elongation could pose problems during atomic model refinement and lead to inappropriate conclusions, especially if the biological interpretations are founded on subtle structural changes. We have recently proposed that 3D FSCs, which quantitatively describe orientation anisotropy (103), become standard tools for validation of any single-particle reconstruction.
The relationship between anisotropy and resolution is not fully understood. Although the sampling distribution is largely independent of other factors attenuating image quality, distinct sampling distributions seem to affect the nominal resolution of a reconstructed map (196). However, a direct relationship has not been established and requires further work. Whereas tilts can ameliorate resolution anisotropy, this comes at the expense of increased B-factor that attenuates global resolution (minimally caused by inherent increases in ice thickness within tilted images, but possibly also from other factors (103)). Ideally, one would be able to explicitly define the optimal tilt angle for a dataset given a sampling distribution, which can be deduced within a few hours of data collection.
The FSC can also be used to compute the correlation of the map to the atomic model. Such map-to-model FSCs describe the fit of the model to the experimental reconstruction, which needs to numerically correspond to the map-to-map resolution between half-sets of the data. If the two do not (approximately) match, this is a sign of problems that should be corrected. Furthermore, the map-to-model resolution analysis can be dynamically incorporated into atomic model refinement protocols, as demonstrated with independent half-map–based refinements (197). In this case, the refinement is performed against the “working half-map,” and the map-to-model FSC is calculated against the “free half-map” (197). This represents one type of cryo-EM analogy to the crystallographic free R-factor (198). The disadvantage of the approach is that only one-half of the data are used for model refinement, which by definition lowers the quality and resolution of the working map. Nonetheless, independent half-map–based refinements would, at a minimum, provide an external measure of model improvement. Whether the approach becomes more widely accepted remains to be seen.
Atomic models must also be validated using numerous external metrics. Model validation builds upon decades of work in the crystallographic community and is typically reported in table format as supporting information. Importantly, the proper way to validate any model is to only use metrics that have not been relied upon during model refinement. For example, if Ramachandran restraints were used during refinement, they cannot be used to validate the model. The same logic applies for many other restraints, such as bond distances, dihedral angles, planarity, etc. Numerous complementary approaches, such as (Cα-based low-resolution annotation method) CaBLAM (199), EM-ringer (200), and others (179), have been proposed to validate cryo-EM maps and models. Finally, any model must be validated using Molprobity (201, 202), which provides an “all-atom contact analysis” and produces a variety of numerical scores that summarize the quality of the final model.
Some important questions remain to be addressed or accepted as standards in the field. For example, how does one know when the resolution is sufficient to start modeling? Which areas of the map should and should not be modeled? To what extent is the model, and its interpretability, affected by anisotropy? Validation measures also have to be further developed and standardized. As was recently highlighted, there are many issues still remaining (203). For example, in many of the current models derived from cryo-EM maps, experimental temperature factors lie outside of the expected range of values given the nominal map resolution, waters are not accounted for or lie outside of density, geometry is poor with many interatomic clashes, and there are no standard methods for sharpening or thresholding the maps (203). Sharpening restores high-resolution structure factor amplitudes and can be achieved through application of a negative temperature factor based on Guinier analysis (47), but in practice, the user typically sharpens the map to different extents and visually and qualitatively selects the optimal sharpening amount. Furthermore, sharpening is performed slightly differently within cryo-EM packages (7–9). In principle, one can optimize the detail and connectivity of a sharpened map in a reference-free manner (204). One recent idea for addressing the thresholding issue has been proposed by generating “confidence maps” based on false discovery rate on a voxel-by-voxel basis (205). It will be necessary to systematically establish working criteria that the field can generally agree upon, both for maps and for models, and continue to define what should and shouldn't be deposited into the PDB/EMDB.
In light of the systematic improvements in resolution, one interesting observation is the appearance of hydrogen atoms at apparently lower resolutions than those typically required for their observation in X-ray diffraction experiments (124), but perhaps similar to what is observed in neutron diffraction (206). This is exciting because it demonstrates some of the fundamental differences between X-ray electron density and cryo-EM coulomb potential maps (see “Derivation of an atomic model” above). The latter are less straightforward to interpret (207) but have several fundamental advantages, such as the ability to distinguish different charge states (208–210). One of the observations from high-resolution electron crystallography experiments is that the R-factors derived from an atomic model seem to be higher than R-factors from X-ray maps at comparable resolutions, implying slight deviations in interatomic distances from those known through physical chemistry (211–213). One explanation for this phenomenon is that electron scattering factors for proteins are not properly taken into account during refinement of the atomic model (scattering factors for proteins and amino acids differ from scattering factors calculated for gas-phase electron diffraction from neutral atoms (95), whereas the latter are currently used for model refinement). The additional requirement to experimentally derive phase information in diffraction experiments (173) may also contribute. The fact that single-particle images already contain experimental phases, and because resolutions are quickly approaching those from micro-electron diffraction (micro-ED) implies that careful measurements can be performed to define and utilize the correct scattering factors for atomic model refinement, and such analyses will have implications for the types of details that can be observed at true atomic resolution. Biologically, this may have implications for enzyme mechanism, which is often governed by subtle structural changes, coupled with charge state, within the local chemical environment.
Conclusions
Cryo-EM methods have come a long way and are now opening opportunities to explore the complexity of macromolecular structural biology in previously inconceivable ways. The numerous current challenges should be worked out over the ensuing years to establish routine workflows, such that, upon sample purification (perhaps even in relatively crude form), a structure could be readily obtained. In contrast to crystallography, where sample purity and its (in)ability to crystallize can stifle or completely impede progress, cryo-EM is much less, if at all, constrained by these factors. Thus, perhaps we can speculate about the future of cryo-EM development by looking toward the sequencing community, where rapid progress has resulted in the establishment of core sequencing centers within many institutions, and broad developments have completely transformed biological sciences. Analogously, cryo-EM may provide the opportunity for structural biology to evolve from a relatively niche field to a fundamental component intrinsic to any biological study. Although I did not address any methods or applications relevant to cryo-electron tomography or in situ cellular structural biology (16, 17), it is important to note that many of the same tools that have been developed for SPA can be retooled or in some cases directly applied to the analysis of tomograms or sub-tomogram averages. There are even greater challenges to overcome in cellular cryo-EM imaging, but the possibilities offer an opportunity to chart out the molecular organization of the cell with unprecedented detail, level of understanding, and resolution.
Acknowledgments
I thank Nikolaus Grigorieff, Peter Rosenthal, Yong Zi Tan, as well as members of my lab for critical reading of the manuscript.
This work was supported by National Institutes of Health Grants DP5 OD021396, R01 AI136680, and U54 GM103368. The author declares that he has no conflict of interest with the contents of this article. The content is solely the responsibility of the authors and does not necessarily represent the official views of the National Institutes of Health.
Bridget Carragher, personal communication.
- SPA
- single-particle analysis
- FSC
- Fourier shell correlation coefficient
- CTF
- contrast transfer function
- SBDD
- structure-based drug design
- HA
- hemagglutinin
- NRAMM
- National Resource for Automated Molecular Microscopy
- DQE
- detective quantum efficiency.
References
- 1. Nogales E. (2016) The development of cryo-EM into a mainstream structural biology technique. Nat. Methods 13, 24–27 10.1038/nmeth.3694 [DOI] [PMC free article] [PubMed] [Google Scholar]
- 2. Bai X.-C., Fernandez I. S., McMullan G., and Scheres S. H. (2013) Ribosome structures to near-atomic resolution from thirty thousand cryo-EM particles. Elife 2, e00461 10.7554/eLife.00461 [DOI] [PMC free article] [PubMed] [Google Scholar]
- 3. Campbell M. G., Cheng A., Brilot A. F., Moeller A., Lyumkis D., Veesler D., Pan J., Harrison S. C., Potter C. S., Carragher B., and Grigorieff N. (2012) Movies of ice-embedded particles enhance resolution in electron cryo-microscopy. Structure 20, 1823–1828 10.1016/j.str.2012.08.026 [DOI] [PMC free article] [PubMed] [Google Scholar]
- 4. Li X., Mooney P., Zheng S., Booth C. R., Braunfeld M. B., Gubbens S., Agard D. A., and Cheng Y. (2013) Electron counting and beam-induced motion correction enable near-atomic-resolution single-particle cryo-EM. Nat. Methods 10, 584–590 10.1038/nmeth.2472 [DOI] [PMC free article] [PubMed] [Google Scholar]
- 5. Suloway C., Pulokas J., Fellmann D., Cheng A., Guerra F., Quispe J., Stagg S., Potter C. S., and Carragher B. (2005) Automated molecular microscopy: the new Leginon system. J. Struct. Biol. 151, 41–60 10.1016/j.jsb.2005.03.010 [DOI] [PubMed] [Google Scholar]
- 6. Mastronarde D. N. (2005) Automated electron microscope tomography using robust prediction of specimen movements. J. Struct. Biol. 152, 36–51 10.1016/j.jsb.2005.07.007 [DOI] [PubMed] [Google Scholar]
- 7. Grant T., Rohou A., and Grigorieff N. (2018) cisTEM, user-friendly software for single-particle image processing. Elife 7, e35383 10.7554/eLife.35383 [DOI] [PMC free article] [PubMed] [Google Scholar]
- 8. Scheres S. H. (2012) RELION: implementation of a Bayesian approach to cryo-EM structure determination. J. Struct. Biol. 180, 519–530 10.1016/j.jsb.2012.09.006 [DOI] [PMC free article] [PubMed] [Google Scholar]
- 9. Punjani A., Rubinstein J. L., Fleet D. J., and Brubaker M. A. (2017) CryoSPARC: algorithms for rapid unsupervised cryo-EM structure determination. Nat. Methods 14, 290–296 10.1038/nmeth.4169 [DOI] [PubMed] [Google Scholar]
- 10. Tegunov D., and Cramer P. (2018) Real-time cryo-EM data pre-processing with Warp. bioRxiv 10.1101/338558 [DOI] [Google Scholar]
- 11. Callaway E. (2015) The revolution will not be crystallized: a new method sweeps through structural biology. Nat. News 525, 172–174 10.1038/525172a [DOI] [PubMed] [Google Scholar]
- 12. Frank J. (2018) Single-particle reconstruction of biological molecules-story in a sample (Nobel Lecture). Angew. Chem. Int. Ed. Engl. 57, 10826–10841 10.1002/anie.201802770 [DOI] [PubMed] [Google Scholar]
- 13. Dubochet J. (2018) On the development of electron cryo-microscopy (Nobel Lecture). Angew. Chem. Int. Ed. Engl. 57, 10842–10846 10.1002/anie.201804280 [DOI] [PubMed] [Google Scholar]
- 14. Henderson R. (2018) From electron crystallography to single particle cryoEM (Nobel Lecture). Angew. Chem. Int. Ed. Engl. 57, 10804–10825 10.1002/anie.201802731 [DOI] [PubMed] [Google Scholar]
- 15. Murata K., and Wolf M. (2018) Cryo-electron microscopy for structural analysis of dynamic biological macromolecules. Biochim. Biophys. Acta 1862, 324–334 10.1016/j.bbagen.2017.07.020 [DOI] [PubMed] [Google Scholar]
- 16. Pfeffer S., and Mahamid J. (2018) Unravelling molecular complexity in structural cell biology. Curr. Opin. Struct. Biol. 52, 111–118 10.1016/j.sbi.2018.08.009 [DOI] [PubMed] [Google Scholar]
- 17. Villa E., Schaffer M., Plitzko J. M., and Baumeister W. (2013) Opening windows into the cell: focused-ion-beam milling for cryo-electron tomography. Curr. Opin. Struct. Biol. 23, 771–777 10.1016/j.sbi.2013.08.006 [DOI] [PubMed] [Google Scholar]
- 18. Cheng Y. (2015) Single-particle cryo-EM at crystallographic resolution. Cell. 161, 450–457 10.1016/j.cell.2015.03.049 [DOI] [PMC free article] [PubMed] [Google Scholar]
- 19. Cheng Y., Grigorieff N., Penczek P. A., and Walz T. (2015) A primer to single-particle cryo-electron microscopy. Cell 161, 438–449 10.1016/j.cell.2015.03.050 [DOI] [PMC free article] [PubMed] [Google Scholar]
- 20. Vinothkumar K. R., and Henderson R. (2016) Single particle electron cryomicroscopy: trends, issues and future perspective. Q. Rev. Biophys. 49, e13 10.1017/S0033583516000068 [DOI] [PubMed] [Google Scholar]
- 21. Frank J. (2017) Advances in the field of single-particle cryo-electron microscopy over the last decade. Nat. Protoc. 12, 209–212 10.1038/nprot.2017.004 [DOI] [PMC free article] [PubMed] [Google Scholar]
- 22. Dubochet J. (2016) A reminiscence about early times of vitreous water in electron cryomicroscopy. Biophys. J. 110, 756–757 10.1016/j.bpj.2015.07.049 [DOI] [PMC free article] [PubMed] [Google Scholar]
- 23. Fernandez-Leiro R., and Scheres S. H. (2016) Unravelling biological macromolecules with cryo-electron microscopy. Nature 537, 339–346 10.1038/nature19948 [DOI] [PMC free article] [PubMed] [Google Scholar]
- 24. Amunts A., Brown A., Bai X.-C., Llácer J. L., Hussain T., Emsley P., Long F., Murshudov G., Scheres S. H. W., and Ramakrishnan V. (2014) Structure of the yeast mitochondrial large ribosomal subunit. Science 343, 1485–1489 10.1126/science.1249410 [DOI] [PMC free article] [PubMed] [Google Scholar]
- 25. Amunts A., Brown A., Toots J., Scheres S. H. W., and Ramakrishnan V. (2015) The structure of the human mitochondrial ribosome. Science 348, 95–98 10.1126/science.aaa1193 [DOI] [PMC free article] [PubMed] [Google Scholar]
- 26. Greber B. J., Bieri P., Leibundgut M., Leitner A., Aebersold R., Boehringer D., and Ban N. (2015) The complete structure of the 55S mammalian mitochondrial ribosome. Science 348, 303–308 10.1126/science.aaa3872 [DOI] [PubMed] [Google Scholar]
- 27. Nguyen T. H., Galej W. P., Bai X.-C., Savva C. G., Newman A. J., Scheres S. H., and Nagai K. (2015) The architecture of the spliceosomal U4/U6.U5 tri-snRNP. Nature 523, 47–52 10.1038/nature14548 [DOI] [PMC free article] [PubMed] [Google Scholar]
- 28. Nguyen T. H. D., Galej W. P., Bai X.-C., Oubridge C., Newman A. J., Scheres S. H. W., and Nagai K. (2016) Cryo-EM structure of the yeast U4/U6.U5 tri-snRNP at 3.7 angstrom resolution. Nature 530, 298–302 10.1038/nature16940 [DOI] [PMC free article] [PubMed] [Google Scholar]
- 29. Hang J., Wan R., Yan C., and Shi Y. (2015) Structural basis of pre-mRNA splicing. Science 349, 1191–1198 10.1126/science.aac8159 [DOI] [PubMed] [Google Scholar]
- 30. Yan C., Hang J., Wan R., Huang M., Wong C. C., and Shi Y. (2015) Structure of a yeast spliceosome at 3.6-angstrom resolution. Science 349, 1182–1191 10.1126/science.aac7629 [DOI] [PubMed] [Google Scholar]
- 31. Liao M., Cao E., Julius D., and Cheng Y. (2013) Structure of the TRPV1 ion channel determined by electron cryo-microscopy. Nature 504, 107–112 10.1038/nature12822 [DOI] [PMC free article] [PubMed] [Google Scholar]
- 32. Cao E., Liao M., Cheng Y., and Julius D. (2013) TRPV1 structures in distinct conformations reveal activation mechanisms. Nature 504, 113–118 10.1038/nature12823 [DOI] [PMC free article] [PubMed] [Google Scholar]
- 33. Vinothkumar K. R., Zhu J., and Hirst J. (2014) Architecture of mammalian respiratory complex I. Nature 515, 80–84 10.1038/nature13686 [DOI] [PMC free article] [PubMed] [Google Scholar]
- 34. Wei X., Su X., Cao P., Liu X., Chang W., Li M., Zhang X., and Liu Z. (2016) Structure of spinach photosystem II–LHCII supercomplex at 3.2 Å resolution. Nature 534, 69–74 10.1038/nature18020 [DOI] [PubMed] [Google Scholar]
- 35. Lu P., Bai X.-C., Ma D., Xie T., Yan C., Sun L., Yang G., Zhao Y., Zhou R., Scheres S. H. W., and Shi Y. (2014) Three-dimensional structure of human γ-secretase. Nature 512, 166–170 10.1038/nature13567 [DOI] [PMC free article] [PubMed] [Google Scholar]
- 36. Takizawa Y., Binshtein E., Erwin A. L., Pyburn T. M., Mittendorf K. F., and Ohi M. D. (2017) While the revolution will not be crystallized, biochemistry reigns supreme. Protein Sci. 26, 69–81 10.1002/pro.3054 [DOI] [PMC free article] [PubMed] [Google Scholar]
- 37. Lyumkis D., Julien J.-P., de Val N., Cupo A., Potter C. S., Klasse P. J., Burton D. R., Sanders R. W., Moore J. P., Carragher B., Wilson I. A., and Ward A. B. (2013) Cryo-EM structure of a fully glycosylated soluble cleaved HIV-1 envelope trimer. Science 342, 1484–1490 10.1126/science.1245627 [DOI] [PMC free article] [PubMed] [Google Scholar]
- 38. Chari A., Haselbach D., Kirves J.-M., Ohmer J., Paknia E., Fischer N., Ganichkin O., Möller V., Frye J. J., Petzold G., Jarvis M., Tietzel M., Grimm C., Peters J. M., Schulman B. A., et al. (2015) ProteoPlex: stability optimization of macromolecular complexes by sparse-matrix screening of chemical space. Nat. Methods 12, 859–865 10.1038/nmeth.3493 [DOI] [PMC free article] [PubMed] [Google Scholar]
- 39. Kastner B., Fischer N., Golas M. M., Sander B., Dube P., Boehringer D., Hartmuth K., Deckert J., Hauer F., Wolf E., Uchtenhagen H., Urlaub H., Herzog F., Peters J. M., Poerschke D., et al. (2008) GraFix: sample preparation for single-particle electron cryomicroscopy. Nat. Methods 5, 53–55 10.1038/nmeth1139 [DOI] [PubMed] [Google Scholar]
- 40. Stark H. (2010) GraFix: stabilization of fragile macromolecular complexes for single particle cryo-EM. Methods Enzymol. 481, 109–126 10.1016/S0076-6879(10)81005-5 [DOI] [PubMed] [Google Scholar]
- 41. Murakami K., Elmlund H., Kalisman N., Bushnell D. A., Adams C. M., Azubel M., Elmlund D., Levi-Kalisman Y., Liu X., Gibbons B. J., Levitt M., and Kornberg R. D. (2013) Architecture of an RNA polymerase II transcription pre-initiation complex. Science 342, 1238724 10.1126/science.1238724 [DOI] [PMC free article] [PubMed] [Google Scholar]
- 42. Kujirai T., Ehara H., Fujino Y., Shirouzu M., Sekine S.-I., and Kurumizaka H. (2018) Structural basis of the nucleosome transition during RNA polymerase II passage. Science 362, 595–598 [DOI] [PubMed] [Google Scholar]
- 43. Du D., Wang Z., James N. R., Voss J. E., Klimont E., Ohene-Agyei T., Venter H., Chiu W., and Luisi B. F. (2014) Structure of the AcrAB–TolC multidrug efflux pump. Nature 509, 512–515 10.1038/nature13205 [DOI] [PMC free article] [PubMed] [Google Scholar]
- 44. Passos D. O., Li M., Yang R., Rebensburg S. V., Ghirlando R., Jeon Y., Shkriabai N., Kvaratskhelia M., Craigie R., and Lyumkis D. (2017) Cryo-EM structures and atomic model of the HIV-1 strand transfer complex intasome. Science 355, 89–92 10.1126/science.aah5163 [DOI] [PMC free article] [PubMed] [Google Scholar]
- 45. Ho C.-M., Beck J. R., Lai M., Cui Y., Goldberg D. E., Egea P. F., and Zhou Z. H. (2018) Malaria parasite translocon structure and mechanism of effector export. Nature 561, 70–75 10.1038/s41586-018-0469-4 [DOI] [PMC free article] [PubMed] [Google Scholar]
- 46. Fernández I. S., Bai X.-C., Hussain T., Kelley A. C., Lorsch J. R., Ramakrishnan V., and Scheres S. H. W. (2013) Molecular architecture of a eukaryotic translational initiation complex. Science 342, 1240585 10.1126/science.1240585 [DOI] [PMC free article] [PubMed] [Google Scholar]
- 47. Rosenthal P. B., and Henderson R. (2003) Optimal determination of particle orientation, absolute hand, and contrast loss in single-particle electron cryomicroscopy. J. Mol. Biol. 333, 721–745 10.1016/j.jmb.2003.07.013 [DOI] [PubMed] [Google Scholar]
- 48. Wu S., Avila-Sakar A., Kim J., Booth D. S., Greenberg C. H., Rossi A., Liao M., Li X., Alian A., Griner S. L., Juge N., Yu Y., Mergel C. M., Chaparro-Riggers J., Strop P., et al. (2012) Fabs enable single particle cryoEM studies of small proteins. Structure 20, 582–592 10.1016/j.str.2012.02.017 [DOI] [PMC free article] [PubMed] [Google Scholar]
- 49. Dambacher C. M., and Lander G. C. (2015) Site-specific labeling of proteins for electron microscopy. J. Struct. Biol. 192, 151–158 10.1016/j.jsb.2015.09.010 [DOI] [PMC free article] [PubMed] [Google Scholar]
- 50. Liu Y., Gonen S., Gonen T., and Yeates T. O. (2018) Near-atomic cryo-EM imaging of a small protein displayed on a designed scaffolding system. Proc. Natl. Acad. Sci. U.S.A. 115, 3362–3367 10.1073/pnas.1718825115 [DOI] [PMC free article] [PubMed] [Google Scholar]
- 51. Martin T. G., Bharat T. A., Joerger A. C., Bai X.-C., Praetorius F., Fersht A. R., Dietz H., and Scheres S. H. (2016) Design of a molecular support for cryo-EM structure determination. Proc. Natl. Acad. Sci. U.S.A. 113, E7456–E7463 10.1073/pnas.1612720113 [DOI] [PMC free article] [PubMed] [Google Scholar]
- 52. Zhang C., Cantara W., Jeon Y., Musier-Forsyth K., Grigorieff N., and Lyumkis D. (2018) Analysis of discrete local variability and structural covariance in macromolecular assemblies using cryo-EM and focused classification. Ultramicroscopy 2018, S0304–3991(18)30266–3 [DOI] [PMC free article] [PubMed] [Google Scholar]
- 53. Kemmerling S., Arnold S. A., Bircher B. A., Sauter N., Escobedo C., Dernick G., Hierlemann A., Stahlberg H., and Braun T. (2013) Single-cell lysis for visual analysis by electron microscopy. J. Struct. Biol. 183, 467–473 10.1016/j.jsb.2013.06.012 [DOI] [PubMed] [Google Scholar]
- 54. Schmidli C., Rima L., Arnold S. A., Stohler T., Syntychaki A., Bieri A., Albiez S., Goldie K. N., Chami M., Stahlberg H., and Braun T. (2018) Miniaturized sample preparation for transmission electron microscopy. J. Vis. Exp. 2018, 10.3791/57310 [DOI] [PMC free article] [PubMed] [Google Scholar]
- 55. Verbeke E. J., Mallam A. L., Drew K., Marcotte E. M., and Taylor D. W. (2018) Classification of single particles from human cell extract reveals distinct structures. Cell Rep. 24, 259–268.e3 10.1016/j.celrep.2018.06.022 [DOI] [PMC free article] [PubMed] [Google Scholar]
- 56. Glaeser R. M., and Han B.-G. (2017) Opinion: hazards faced by macromolecules when confined to thin aqueous films. Biophys. Rep. 3, 1–7 [DOI] [PMC free article] [PubMed] [Google Scholar]
- 57. Tan Y. Z., Cheng A., Potter C. S., and Carragher B. (2016) Automated data collection in single particle electron microscopy. Microscopy 65, 43–56 10.1093/jmicro/dfv369 [DOI] [PMC free article] [PubMed] [Google Scholar]
- 58. Scapin G., Potter C. S., and Carragher B. (2018) Cryo-EM for small molecules discovery, design, understanding, and application. Cell Chem. Biol. 25, 1318–1325 10.1016/j.chembiol.2018.07.006 [DOI] [PMC free article] [PubMed] [Google Scholar]
- 59. Kelly D. F., Abeyrathne P. D., Dukovski D., and Walz T. (2008) The affinity grid: a pre-fabricated EM grid for monolayer purification. J. Mol. Biol. 382, 423–433 10.1016/j.jmb.2008.07.023 [DOI] [PMC free article] [PubMed] [Google Scholar]
- 60. Kelly D. F., Dukovski D., and Walz T. (2010) Strategy for the use of affinity grids to prepare non-His-tagged macromolecular complexes for single-particle electron microscopy. J. Mol. Biol. 400, 675–681 10.1016/j.jmb.2010.05.045 [DOI] [PMC free article] [PubMed] [Google Scholar]
- 61. Kelly D. F., Dukovski D., and Walz T. (2010) A practical guide to the use of monolayer purification and affinity grids. Methods Enzymol. 481, 83–107 10.1016/S0076-6879(10)81004-3 [DOI] [PubMed] [Google Scholar]
- 62. Benjamin C. J., Wright K. J., Bolton S. C., Hyun S.-H., Krynski K., Grover M., Yu G., Guo F., Kinzer-Ursem T. L., Jiang W., and Thompson D. H. (2016) Selective capture of histidine-tagged proteins from cell lysates using TEM grids modified with NTA-graphene oxide. Sci. Rep. 6, 32500 10.1038/srep32500 [DOI] [PMC free article] [PubMed] [Google Scholar]
- 63. Choi S.-S., Katsuyama Y., Bai L., Deng Z., Ohnishi Y., and Kim E.-S. (2018) Genome engineering for microbial natural product discovery. Curr. Opin. Microbiol. 45, 53–60 10.1016/j.mib.2018.02.007 [DOI] [PubMed] [Google Scholar]
- 64. Kiss G., Chen X., Brindley M. A., Campbell P., Afonso C. L., Ke Z., Holl J. M., Guerrero-Ferreira R. C., Byrd-Leotis L. A., Steel J., Steinhauer D. A., Plemper R. K., Kelly D. F., Spearman P. W., and Wright E. R. (2014) Capturing enveloped viruses on affinity grids for downstream cryo-electron microscopy applications. Microsc. Microanal. 20, 164–174 10.1017/S1431927613013937 [DOI] [PMC free article] [PubMed] [Google Scholar]
- 65. Gilmore B. L., Varano A. C., Dearnaley W., Liang Y., Marcinkowski B. C., Dukes M. J., and Kelly D. F. (2018) Protein Complex Assembly, pp. 45–58, Humana Press, New York: [DOI] [PMC free article] [PubMed] [Google Scholar]
- 66. Ohi M., Li Y., Cheng Y., and Walz T. (2004) Negative staining and image classification–powerful tools in modern electron microscopy. Biol. Proced. Online 6, 23–34 10.1251/bpo70 [DOI] [PMC free article] [PubMed] [Google Scholar]
- 67. Harris J. R., and De Carlo S. (2014) Negative staining and cryo-negative staining: applications in biology and medicine. Methods Mol. Biol. 1117, 215–258 10.1007/978-1-62703-776-1_11 [DOI] [PubMed] [Google Scholar]
- 68. Taylor K. A., and Glaeser R. M. (1974) Electron diffraction of frozen, hydrated protein crystals. Science 186, 1036–1037 10.1126/science.186.4168.1036 [DOI] [PubMed] [Google Scholar]
- 69. Dubochet J., and McDowall A. W. (1981) Vitrification of pure water for electron microscopy. J. Microsc. 124, 3–4 10.1111/j.1365-2818.1981.tb02483.x [DOI] [Google Scholar]
- 70. Dubochet J., Lepault J., Freeman R., Berriman J. A., and Homo J. C. (1982) Electron microscopy of frozen water and aqueous solutions. J. Microsc. 128, 219–237 10.1111/j.1365-2818.1982.tb04625.x [DOI] [Google Scholar]
- 71. Dubochet J., Adrian M., Chang J. J., Homo J. C., Lepault J., McDowall A. W., and Schultz P. (1988) Cryo-electron microscopy of vitrified specimens. Q. Rev. Biophys. 21, 129–228 10.1017/S0033583500004297 [DOI] [PubMed] [Google Scholar]
- 72. Adrian M., Dubochet J., Lepault J., and McDowall A. W. (1984) Cryo-electron microscopy of viruses. Nature 308, 32–36 10.1038/308032a0 [DOI] [PubMed] [Google Scholar]
- 73. De Rosier D. J., and Klug A. (1968) Reconstruction of three dimensional structures from electron micrographs. Nature 217, 130–134 10.1038/217130a0 [DOI] [PubMed] [Google Scholar]
- 74. Wagenknecht T., Carazo J. M., Radermacher M., and Frank J. (1989) Three-dimensional reconstruction of the ribosome from Escherichia coli. Biophys. J. 55, 455–464 10.1016/S0006-3495(89)82839-5 [DOI] [PMC free article] [PubMed] [Google Scholar]
- 75. Mulligan S. K., Speir J. A., Razinkov I., Cheng A., Crum J., Jain T., Duggan E., Liu E., Nolan J. P., Carragher B., and Potter C. S. (2015) Multiplexed TEM specimen preparation and analysis of plasmonic nanoparticles. Microsc. Microanal. 21, 1017–1025 10.1017/S1431927615014324 [DOI] [PMC free article] [PubMed] [Google Scholar]
- 76. Cheng Y., Wolf E., Larvie M., Zak O., Aisen P., Grigorieff N., Harrison S. C., and Walz T. (2006) Single particle reconstructions of the transferrin-transferrin receptor complex obtained with different specimen preparation techniques. J. Mol. Biol. 355, 1048–1065 10.1016/j.jmb.2005.11.021 [DOI] [PubMed] [Google Scholar]
- 77. Bellare J. R., Davis H. T., Scriven L. E., and Talmon Y. (1988) Controlled environment vitrification system: an improved sample preparation technique. J. Electron Microsc. Tech. 10, 87–111 10.1002/jemt.1060100111 [DOI] [PubMed] [Google Scholar]
- 78. He Y., Yan C., Fang J., Inouye C., Tjian R., Ivanov I., and Nogales E. (2016) Near-atomic resolution visualization of human transcription promoter opening. Nature 533, 359–365 10.1038/nature17970 [DOI] [PMC free article] [PubMed] [Google Scholar]
- 79. Pantelic R. S., Meyer J. C., Kaiser U., and Stahlberg H. (2012) The application of graphene as a sample support in transmission electron microscopy. Methods Enzymol. 152, 1375–1382 10.1016/j.ssc.2012.04.038 [DOI] [Google Scholar]
- 80. D'Imprima E., Floris D., Joppe M., Sánchez R., Grininger M., and Kühlbrandt W. (2018) The deadly touch: protein denaturation at the water-air interface and how to prevent it. bioRxiv 10.1101/400432 [DOI] [PMC free article] [PubMed] [Google Scholar]
- 81. Fan X., Wang J., Zhang X., Yang Z., Zhang J.-C., Zhao L., Peng H.-L., Lei J., and Wang H.-W. (2018) Single particle cryo-EM reconstruction of 52 kDa streptavidin at 3.2 Angstrom resolution. bioRxiv 10.1101/457861 [DOI] [PMC free article] [PubMed] [Google Scholar]
- 82. Sader K., Stopps M., Calder L. J., and Rosenthal P. B. (2013) Cryomicroscopy of radiation sensitive specimens on unmodified graphene sheets: reduction of electron-optical effects of charging. J. Struct. Biol. 183, 531–536 10.1016/j.jsb.2013.04.014 [DOI] [PMC free article] [PubMed] [Google Scholar]
- 83. Pantelic R. S., Meyer J. C., Kaiser U., Baumeister W., and Plitzko J. M. (2010) Graphene oxide: a substrate for optimizing preparations of frozen-hydrated samples. J. Struct. Biol. 170, 152–156 10.1016/j.jsb.2009.12.020 [DOI] [PubMed] [Google Scholar]
- 84. Boland A., Martin T. G., Zhang Z., Yang J., Bai X.-C., Chang L., Scheres S. H., and Barford D. (2017) Cryo-EM structure of a metazoan separase–securin complex at near-atomic resolution. Nat. Struct. Mol. Biol. 24, 414–418 10.1038/nsmb.3386 [DOI] [PMC free article] [PubMed] [Google Scholar]
- 85. Palovcak E., Wang F., Zheng S. Q., Yu Z., Li S., Betegon M., Bulkley D., Agard D. A., and Cheng Y. (2018) A simple and robust procedure for preparing graphene-oxide cryo-EM grids. J. Struct. Biol. 204, 80–84 10.1016/j.jsb.2018.07.007 [DOI] [PMC free article] [PubMed] [Google Scholar]
- 86. Russo C. J., and Passmore L. A. (2016) Progress towards an optimal specimen support for electron cryomicroscopy. Curr. Opin. Struct. Biol. 37, 81–89 10.1016/j.sbi.2015.12.007 [DOI] [PMC free article] [PubMed] [Google Scholar]
- 87. Noble A. J., Dandey V. P., Wei H., Brasch J., Chase J., Acharya P., Tan Y. Z., Zhang Z., Kim L. Y., Scapin G., Rapp M., Eng E. T., Rice W. J., Cheng A., Negro C. J., et al. (2018) Routine single particle cryoEM sample and grid characterization by tomography. Elife 7, e34257 10.7554/eLife.34257 [DOI] [PMC free article] [PubMed] [Google Scholar]
- 88. Jain T., Sheehan P., Crum J., Carragher B., and Potter C. S. (2012) Spotiton: a prototype for an integrated inkjet dispense and vitrification system for cryo-TEM. J. Struct. Biol. 179, 68–75 10.1016/j.jsb.2012.04.020 [DOI] [PMC free article] [PubMed] [Google Scholar]
- 89. Razinkov I., Dandey V., Wei H., Zhang Z., Melnekoff D., Rice W. J., Wigge C., Potter C. S., and Carragher B. (2016) A new method for vitrifying samples for cryoEM. J. Struct. Biol. 195, 190–198 10.1016/j.jsb.2016.06.001 [DOI] [PMC free article] [PubMed] [Google Scholar]
- 90. Noble A. J., Wei H., Dandey V. P., Zhang Z., Tan Y. Z., Potter C. S., and Carragher B. (2018) Reducing effects of particle adsorption to the air–water interface in cryo-EM. Nat. Methods 15, 793–795 10.1038/s41592-018-0139-3 [DOI] [PMC free article] [PubMed] [Google Scholar]
- 91. Snijder J., Borst A. J., Dosey A., Walls A. C., Burrell A., Reddy V. S., Kollman J. M., and Veesler D. (2017) Vitrification after multiple rounds of sample application and blotting improves particle density on cryo-electron microscopy grids. J. Struct. Biol. 198, 38–42 10.1016/j.jsb.2017.02.008 [DOI] [PMC free article] [PubMed] [Google Scholar]
- 92. Glaeser R. M. (2018) Proteins, interfaces, and cryo-EM grids. Curr. Opin. Colloid Interface Sci. 34, 1–8 10.1016/j.cocis.2017.12.009 [DOI] [PMC free article] [PubMed] [Google Scholar]
- 93. Potter C. S., Chu H., Frey B., Green C., Kisseberth N., Madden T. J., Miller K. L., Nahrstedt K., Pulokas J., Reilein A., Tcheng D., Weber D., and Carragher B. (1999) Leginon: a system for fully automated acquisition of 1000 electron micrographs a day. Ultramicroscopy 77, 153–161 10.1016/S0304-3991(99)00043-1 [DOI] [PubMed] [Google Scholar]
- 94. Carragher B., Kisseberth N., Kriegman D., Milligan R. A., Potter C. S., Pulokas J., and Reilein A. (2000) Leginon: an automated system for acquisition of images from vitreous ice specimens. J. Struct. Biol. 132, 33–45 10.1006/jsbi.2000.4314 [DOI] [PubMed] [Google Scholar]
- 95. Grigorieff N., Ceska T. A., Downing K. H., Baldwin J. M., and Henderson R. (1996) Electron-crystallographic refinement of the structure of bacteriorhodopsin. J. Mol. Biol. 259, 393–421 10.1006/jmbi.1996.0328 [DOI] [PubMed] [Google Scholar]
- 96. Lyumkis D., Moeller A., Cheng A., Herold A., Hou E., Irving C., Jacovetty E. L., Lau P.-W., Mulder A. M., Pulokas J., Quispe J. D., Voss N. R., Potter C. S., and Carragher B. (2010) Automation in single-particle electron microscopy connecting the pieces. Methods Enzymol. 483, 291–338 10.1016/S0076-6879(10)83015-0 [DOI] [PubMed] [Google Scholar]
- 97. McMullan G., Clark A. T., Turchetta R., and Faruqi A. R. (2009) Enhanced imaging in low dose electron microscopy using electron counting. Ultramicroscopy 109, 1411–1416 10.1016/j.ultramic.2009.07.004 [DOI] [PMC free article] [PubMed] [Google Scholar]
- 98. Ruskin R. S., Yu Z., and Grigorieff N. (2013) Quantitative characterization of electron detectors for transmission electron microscopy. J. Struct. Biol. 184, 385–393 10.1016/j.jsb.2013.10.016 [DOI] [PMC free article] [PubMed] [Google Scholar]
- 99. McMullan G., Chen S., Henderson R., and Faruqi A. R. (2009) Detective quantum efficiency of electron area detectors in electron microscopy. Ultramicroscopy 109, 1126–1143 10.1016/j.ultramic.2009.04.002 [DOI] [PMC free article] [PubMed] [Google Scholar]
- 100. Henderson R., Chen S., Chen J. Z., Grigorieff N., Passmore L. A., Ciccarelli L., Rubinstein J. L., Crowther R. A., Stewart P. L., and Rosenthal P. B. (2011) Tilt-pair analysis of images from a range of different specimens in single-particle electron cryomicroscopy. J. Mol. Biol. 413, 1028–1046 10.1016/j.jmb.2011.09.008 [DOI] [PMC free article] [PubMed] [Google Scholar]
- 101. Meyerson J. R., Rao P., Kumar J., Chittori S., Banerjee S., Pierson J., Mayer M. L., and Subramaniam S. (2014) Self-assembled monolayers improve protein distribution on holey carbon cryo-EM supports. Sci. Rep. 4, 7084 [DOI] [PMC free article] [PubMed] [Google Scholar]
- 102. Drulyte I., Johnson R. M., Hesketh E. L., Hurdiss D. L., Scarff C. A., Porav S. A., Ranson N. A., Muench S. P., and Thompson R. F. (2018) Approaches to altering particle distributions in cryo-electron microscopy sample preparation. Acta Crystallogr. D Struct. Biol. 74, 560–571 10.1107/S2059798318006496 [DOI] [PMC free article] [PubMed] [Google Scholar]
- 103. Tan Y. Z., Baldwin P. R., Davis J. H., Williamson J. R., Potter C. S., Carragher B., and Lyumkis D. (2017) Addressing preferred specimen orientation in single-particle cryo-EM through tilting. Nat. Methods 14, 793–796 10.1038/nmeth.4347 [DOI] [PMC free article] [PubMed] [Google Scholar]
- 104. Scapin G., Dandey V. P., Zhang Z., Prosise W., Hruza A., Kelly T., Mayhood T., Strickland C., Potter C. S., and Carragher B. (2018) Structure of the insulin receptor-insulin complex by single-particle cryo-EM analysis. Nature 556, 122–125 10.1038/nature26153 [DOI] [PMC free article] [PubMed] [Google Scholar]
- 105. Beckert B., Turk M., Czech A., Berninghausen O., Beckmann R., Ignatova Z., Plitzko J. M., and Wilson D. N. (2018) Structure of a hibernating 100S ribosome reveals an inactive conformation of the ribosomal protein S1. Nat. Microbiol. 3, 1115–1121 10.1038/s41564-018-0237-0 [DOI] [PubMed] [Google Scholar]
- 106. Davis J. H., Tan Y. Z., Carragher B., Potter C. S., Lyumkis D., and Williamson J. R. (2016) Modular assembly of the bacterial large ribosomal subunit. Cell 167, 1610–1622.e15 10.1016/j.cell.2016.11.020 [DOI] [PMC free article] [PubMed] [Google Scholar]
- 107. Balchin D., Miličić G., Strauss M., Hayer-Hartl M., and Hartl F. U. (2018) Pathway of actin folding directed by the eukaryotic chaperonin TRiC. Cell 174, 1507–1521.e16 10.1016/j.cell.2018.07.006 [DOI] [PubMed] [Google Scholar]
- 108. Stella S., Mesa P., Thomsen J., Paul B., Alcón P., Jensen S. B., Saligram B., Moses M. E., Hatzakis N. S., and Montoya G. (2018) Conformational activation promotes CRISPR-Cas12a catalysis and resetting of the endonuclease activity. Cell 175, 1856–1871.e21 10.1016/j.cell.2018.10.045 [DOI] [PubMed] [Google Scholar]
- 109. Cheng A., Eng E. T., Alink L., Rice W. J., Jordan K. D., Kim L. Y., Potter C. S., and Carragher B. (2018) High resolution single particle cryo-electron microscopy using beam-image shift. J. Struct. Biol. 204, 270–275 10.1016/j.jsb.2018.07.015 [DOI] [PMC free article] [PubMed] [Google Scholar]
- 110. Brilot A. F., Chen J. Z., Cheng A., Pan J., Harrison S. C., Potter C. S., Carragher B., Henderson R., and Grigorieff N. (2012) Beam-induced motion of vitrified specimen on holey carbon film. J. Struct. Biol. 177, 630–637 10.1016/j.jsb.2012.02.003 [DOI] [PMC free article] [PubMed] [Google Scholar]
- 111. Brink J., Sherman M. B., Berriman J., and Chiu W. (1998) Evaluation of charging on macromolecules in electron cryomicroscopy. Ultramicroscopy 72, 41–52 10.1016/S0304-3991(97)00126-5 [DOI] [PubMed] [Google Scholar]
- 112. Wu S., Armache J.-P., and Cheng Y. (2016) Single-particle cryo-EM data acquisition by using direct electron detection camera. Microscopy 65, 35–41 10.1093/jmicro/dfv355 [DOI] [PMC free article] [PubMed] [Google Scholar]
- 113. Lawson C. L., Baker M. L., Best C., Bi C., Dougherty M., Feng P., van Ginkel G., Devkota B., Lagerstedt I., Ludtke S. J., Newman R. H., Oldfield T. J., Rees I., Sahni G., Sala R., et al. (2011) EMDataBank.org: unified data resource for CryoEM. Nucleic Acids Res. 39, D456–D464 10.1093/nar/gkq880 [DOI] [PMC free article] [PubMed] [Google Scholar]
- 114. Henderson R. (1995) The potential and limitations of neutrons, electrons, and x-rays for atomic resolution microscopy of unstained biological molecules. Q. Rev. Biophys. 28, 171–193 10.1017/S003358350000305X [DOI] [PubMed] [Google Scholar]
- 115. Egerton R. F. (2014) Choice of operating voltage for a transmission electron microscope. Ultramicroscopy 145, 85–93 10.1016/j.ultramic.2013.10.019 [DOI] [PubMed] [Google Scholar]
- 116. Liang B., Li Z., Jenni S., Rahmeh A. A., Morin B. M., Grant T., Grigorieff N., Harrison S. C., and Whelan S. P. J. (2015) Structure of the L protein of vesicular stomatitis virus from electron cryomicroscopy. Cell 162, 314–327 10.1016/j.cell.2015.06.018 [DOI] [PMC free article] [PubMed] [Google Scholar]
- 117. Herzik M. A. Jr., Wu M., and Lander G. C. (2017) Achieving better-than-3-Å resolution by single-particle cryo-EM at 200 keV. Nat. Methods 14, 1075–1078 10.1038/nmeth.4461 [DOI] [PMC free article] [PubMed] [Google Scholar]
- 118. Glaeser R. M. (2016) Specimen behavior in the electron beam. Methods Enzymol. 579, 19–50 10.1016/bs.mie.2016.04.010 [DOI] [PubMed] [Google Scholar]
- 119. DeRosier D. J. (2000) Correction of high-resolution data for curvature of the Ewald sphere. Ultramicroscopy 81, 83–98 10.1016/S0304-3991(99)00120-5 [DOI] [PubMed] [Google Scholar]
- 120. Jensen G. J., and Kornberg R. D. (2000) Defocus-gradient corrected back-projection. Ultramicroscopy 84, 57–64 10.1016/S0304-3991(00)00005-X [DOI] [PubMed] [Google Scholar]
- 121. Saxton W. O. (1995) Observation of lens aberrations for very high-resolution electron microscopy. I. Theory. J. Microsc. 179, 201–213 10.1111/j.1365-2818.1995.tb03633.x [DOI] [Google Scholar]
- 122. Krivanek O. L., and Stadelmann P. A. (1995) Effect of three-fold astigmatism on high resolution electron micrographs. Ultramicroscopy 60, 103–113 10.1016/0304-3991(95)00050-B [DOI] [Google Scholar]
- 123. Peet M. J., Henderson R., and Russo C. J. (2019) The energy dependence of contrast and damage in electron cryomicroscopy of biological molecules. Ultramicroscopy 10.1016/j.ultramic.2019.02.007 [DOI] [PMC free article] [PubMed] [Google Scholar]
- 124. Tan Y. Z., Aiyer S., Mietzsch M., Hull J. A., McKenna R., Grieger J., Samulski R. J., Baker T. S., Agbandje-McKenna M., and Lyumkis D. (2018) Sub-2 Å Ewald curvature corrected structure of an AAV2 capsid variant. Nat. Commun. 9, 3628 10.1038/s41467-018-06076-6 [DOI] [PMC free article] [PubMed] [Google Scholar]
- 125. Bartesaghi A., Aguerrebere C., Falconieri V., Banerjee S., Earl L. A., Zhu X., Grigorieff N., Milne J. L. S., Sapiro G., Wu X., and Subramaniam S. (2018) Atomic resolution cryo-EM structure of β-galactosidase. Structure 26, 848–856.e3 10.1016/j.str.2018.04.004 [DOI] [PMC free article] [PubMed] [Google Scholar]
- 126. Zivanov J., Nakane T., Forsberg B. O., Kimanius D., Hagen W. J., Lindahl E., and Scheres S. H. (2018) New tools for automated high-resolution cryo-EM structure determination in RELION-3. Elife 7, e42166 10.7554/eLife.42166 [DOI] [PMC free article] [PubMed] [Google Scholar]
- 127. Eades A. (2006) Obtaining TEM images with a uniform deviation parameter. Ultramicroscopy 106, 432–438 10.1016/j.ultramic.2005.12.002 [DOI] [PubMed] [Google Scholar]
- 128. Glaeser R. M., Typke D., Tiemeijer P. C., Pulokas J., and Cheng A. (2011) Precise beam-tilt alignment and collimation are required to minimize the phase error associated with coma in high-resolution cryo-EM. J. Struct. Biol. 174, 1–10 10.1016/j.jsb.2010.12.005 [DOI] [PMC free article] [PubMed] [Google Scholar]
- 129. Renaud J.-P., Chari A., Ciferri C., Liu W.-T., Rémigy H.-W., Stark H., and Wiesmann C. (2018) Cryo-EM in drug discovery: achievements, limitations and prospects. Nat. Rev. Drug Discov. 17, 471–492 10.1038/nrd.2018.77 [DOI] [PubMed] [Google Scholar]
- 130. Voss N. R., Potter C. S., Smith R., and Carragher B.. Software tools for molecular microscopy: an open-text Wikibook. Methods Enzymol. 482, 381–392 10.1016/S0076-6879(10)82016-6 [DOI] [PubMed] [Google Scholar]
- 131. Biyani N., Righetto R. D., McLeod R., Caujolle-Bert D., Castano-Diez D., Goldie K. N., and Stahlberg H. (2017) Focus: the interface between data collection and data processing in cryo-EM. J. Struct. Biol. 198, 124–133 10.1016/j.jsb.2017.03.007 [DOI] [PubMed] [Google Scholar]
- 132. de la Rosa-Trevín J. M., Quintana A., Del Cano L., Zaldívar A., Foche I., Gutiérrez J., Gómez-Blanco J., Burguet-Castell J., Cuenca-Alba J., Abrishami V., Vargas J., Otón J., Sharov G., Vilas J. L., Navas J., et al. (2016) Scipion: a software framework toward integration, reproducibility and validation in 3D electron microscopy. J. Struct. Biol. 195, 93–99 10.1016/j.jsb.2016.04.010 [DOI] [PubMed] [Google Scholar]
- 133. Lander G. C., Stagg S. M., Voss N. R., Cheng A., Fellmann D., Pulokas J., Yoshioka C., Irving C., Mulder A., Lau P.-W., Lyumkis D., Potter C. S., and Carragher B. (2009) Appion: an integrated, database-driven pipeline to facilitate EM image processing. J. Struct. Biol. 166, 95–102 10.1016/j.jsb.2009.01.002 [DOI] [PMC free article] [PubMed] [Google Scholar]
- 134. Forsberg B. O., Aibara S., Kimanius D., Paul B., Lindahl E., and Amunts A. (2017) Cryo-EM reconstruction of the chlororibosome to 3.2 Å resolution within 24 h. IUCrJ. 4, 723–727 10.1107/S205225251701226X [DOI] [PMC free article] [PubMed] [Google Scholar]
- 135. Merk A., Bartesaghi A., Banerjee S., Falconieri V., Rao P., Davis M. I., Pragani R., Boxer M. B., Earl L. A., Milne J. L. S., and Subramaniam S. (2016) Breaking cryo-EM resolution barriers to facilitate drug discovery. Cell 165, 1698–1707 10.1016/j.cell.2016.05.040 [DOI] [PMC free article] [PubMed] [Google Scholar]
- 136. Danev R., and Nagayama K. (2001) Transmission electron microscopy with Zernike phase plate. Ultramicroscopy 88, 243–252 10.1016/S0304-3991(01)00088-2 [DOI] [PubMed] [Google Scholar]
- 137. Danev R., and Baumeister W. (2017) Expanding the boundaries of cryo-EM with phase plates. Curr. Opin. Struct. Biol. 46, 87–94 10.1016/j.sbi.2017.06.006 [DOI] [PubMed] [Google Scholar]
- 138. Khoshouei M., Radjainia M., Baumeister W., and Danev R. (2017) Cryo-EM structure of haemoglobin at 3.2 Å determined with the Volta phase plate. Nat. Commun. 8, 16099 10.1038/ncomms16099 [DOI] [PMC free article] [PubMed] [Google Scholar]
- 139. Herzik M. A. Jr., Wu M., and Lander G. C. (2018) High-resolution structure determination of sub-100 kilodalton complexes using conventional cryo-EM. bioRxiv 10.1101/489898 [DOI] [PMC free article] [PubMed] [Google Scholar]
- 140. Khoshouei M., Pfeffer S., Baumeister W., Förster F., and Danev R. (2017) Subtomogram analysis using the Volta phase plate. J. Struct. Biol. 197, 94–101 10.1016/j.jsb.2016.05.009 [DOI] [PubMed] [Google Scholar]
- 141. Müller H., Jin J., Danev R., Spence J., Padmore H., and Glaeser R. M. (2010) Design of an electron microscope phase plate using a focused continuous-wave laser. New J. Phys. 12, 073011 10.1088/1367-2630/12/7/073011 [DOI] [PMC free article] [PubMed] [Google Scholar]
- 142. Schwartz O., Axelrod J. J., Tuthill D. R., Haslinger P., Ophus C., Glaeser R. M., and Müller H. (2017) Near-concentric Fabry-Pérot cavity for continuous-wave laser control of electron waves. Opt. Express 25, 14453–14462 10.1364/OE.25.014453 [DOI] [PubMed] [Google Scholar]
- 143. Yu X., Jin L., and Zhou Z. H. (2008) 3.88 A structure of cytoplasmic polyhedrosis virus by cryo-electron microscopy. Nature 453, 415–419 10.1038/nature06893 [DOI] [PMC free article] [PubMed] [Google Scholar]
- 144. Zhang X., Settembre E., Xu C., Dormitzer P. R., Bellamy R., Harrison S. C., and Grigorieff N. (2008) Near-atomic resolution using electron cryomicroscopy and single-particle reconstruction. Proc. Natl. Acad. Sci. U.S.A. 105, 1867–1872 10.1073/pnas.0711623105 [DOI] [PMC free article] [PubMed] [Google Scholar]
- 145. Jiang W., Baker M. L., Jakana J., Weigele P. R., King J., and Chiu W. (2008) Backbone structure of the infectious ϵ15 virus capsid revealed by electron cryomicroscopy. Nature 451, 1130–1134 10.1038/nature06665 [DOI] [PubMed] [Google Scholar]
- 146. Bartesaghi A., Merk A., Banerjee S., Matthies D., Wu X., Milne J. L., and Subramaniam S. (2015) Electron microscopy. 2.2 Å resolution cryo-EM structure of β-galactosidase in complex with a cell-permeant inhibitor. Science 348, 1147–1151 10.1126/science.aab1576 [DOI] [PMC free article] [PubMed] [Google Scholar]
- 147. Hattne J., Shi D., Glynn C., Zee C.-T., Gallagher-Jones M., Martynowycz M. W., Rodriguez J. A., and Gonen T. (2018) Analysis of global and site-specific radiation damage in cryo-EM. Structure 26, 759–766.e4 10.1016/j.str.2018.03.021 [DOI] [PMC free article] [PubMed] [Google Scholar]
- 148. Patel A. B., Louder R. K., Greber B. J., Grünberg S., Luo J., Fang J., Liu Y., Ranish J., Hahn S., and Nogales E. (2018) Structure of human TFIID and mechanism of TBP loading onto promoter DNA. Science 362, eaau8872 10.1126/science.aau8872 [DOI] [PMC free article] [PubMed] [Google Scholar]
- 149. Haselbach D., Komarov I., Agafonov D. E., Hartmuth K., Graf B., Dybkov O., Urlaub H., Kastner B., Lührmann R., and Stark H. (2018) Structure and conformational dynamics of the human spliceosomal Bact complex. Cell 172, 454–464.e11 10.1016/j.cell.2018.01.010 [DOI] [PubMed] [Google Scholar]
- 150. Burgess S. A., Walker M. L., Sakakibara H., Knight P. J., and Oiwa K. (2003) Dynein structure and power stroke. Nature 421, 715–718 10.1038/nature01377 [DOI] [PubMed] [Google Scholar]
- 151. Lyumkis D., Brilot A. F., Theobald D. L., and Grigorieff N. (2013) Likelihood-based classification of cryo-EM images using FREALIGN. J. Struct. Biol. 183, 377–388 10.1016/j.jsb.2013.07.005 [DOI] [PMC free article] [PubMed] [Google Scholar]
- 152. Scheres S. H. (2016) Processing of structurally heterogeneous cryo-EM data in RELION. Methods Enzymol. 579, 125–157 10.1016/bs.mie.2016.04.012 [DOI] [PubMed] [Google Scholar]
- 153. Moriya T., Saur M., Stabrin M., Merino F., Voicu H., Huang Z., Penczek P. A., Raunser S., and Gatsogiannis C. (2017) High-resolution single particle analysis from electron cryo-microscopy images using SPHIRE. J. Vis. Exp. 2017, 10.3791/55448 [DOI] [PMC free article] [PubMed] [Google Scholar]
- 154. Tang G., Peng L., Baldwin P. R., Mann D. S., Jiang W., Rees I., and Ludtke S. J. (2007) EMAN2: an extensible image processing suite for electron microscopy. J. Struct. Biol. 157, 38–46 10.1016/j.jsb.2006.05.009 [DOI] [PubMed] [Google Scholar]
- 155. Jin Q., Sorzano C. O., de la Rosa-Trevín J. M., Bilbao-Castro J. R., Núñez-Ramírez R., Llorca O., Tama F., and Jonić S. (2014) Iterative elastic 3D-to-2D alignment method using normal modes for studying structural dynamics of large macromolecular complexes. Structure 22, 496–506 10.1016/j.str.2014.01.004 [DOI] [PubMed] [Google Scholar]
- 156. Dashti A., Schwander P., Langlois R., Fung R., Li W., Hosseinizadeh A., Liao H. Y., Pallesen J., Sharma G., Stupina V. A., Simon A. E., Dinman J. D., Frank J., and Ourmazd A. (2014) Trajectories of the ribosome as a Brownian nanomachine. Proc. Natl. Acad. Sci. U.S.A. 111, 17492–17497 10.1073/pnas.1419276111 [DOI] [PMC free article] [PubMed] [Google Scholar]
- 157. Nakane T., Kimanius D., Lindahl E., and Scheres S. H. (2018) Characterisation of molecular motions in cryo-EM single-particle data by multi-body refinement in RELION. Elife 7, e36861 10.7554/eLife.36861 [DOI] [PMC free article] [PubMed] [Google Scholar]
- 158. Bai X.-C., Rajendra E., Yang G., Shi Y., and Scheres S. H. (2015) Sampling the conformational space of the catalytic subunit of human γ-secretase. Elife. 4, e11182 [DOI] [PMC free article] [PubMed] [Google Scholar]
- 159. Abeyrathne P. D., Koh C. S., Grant T., Grigorieff N., and Korostelev A. A. (2016) Ensemble cryo-EM uncovers inchworm-like translocation of a viral IRES through the ribosome. Elife 5, e14874 10.7554/eLife.14874 [DOI] [PMC free article] [PubMed] [Google Scholar]
- 160. Zhang C., Cantara W., Jeon Y., Musier-Forsyth K., Grigorieff N., and Lyumkis D. (2018) Analysis of local variability and allostery in macromolecular assemblies using cryo-EM and focused classification. bioRxiv 10.1101/365940 [DOI] [PMC free article] [PubMed] [Google Scholar]
- 161. Frank J. (2017) Time-resolved cryo-electron microscopy: recent progress. J. Struct. Biol. 200, 303–306 10.1016/j.jsb.2017.06.005 [DOI] [PMC free article] [PubMed] [Google Scholar]
- 162. Berriman J., and Unwin N. (1994) Analysis of transient structures by cryo-microscopy combined with rapid mixing of spray droplets. Ultramicroscopy 56, 241–252 10.1016/0304-3991(94)90012-4 [DOI] [PubMed] [Google Scholar]
- 163. Walker M., Trinick J., and White H. (1995) Millisecond time resolution electron cryo-microscopy of the M-ATP transient kinetic state of the acto-myosin ATPase. Biophys. J. 68, 87S–91S [PMC free article] [PubMed] [Google Scholar]
- 164. White H. D., Thirumurugan K., Walker M. L., and Trinick J. (2003) A second generation apparatus for time-resolved electron cryo-microscopy using stepper motors and electrospray. J. Struct. Biol. 144, 246–252 10.1016/j.jsb.2003.09.027 [DOI] [PubMed] [Google Scholar]
- 165. Lu Z., Shaikh T. R., Barnard D., Meng X., Mohamed H., Yassin A., Mannella C. A., Agrawal R. K., Lu T. M., and Wagenknecht T. (2009) Monolithic microfluidic mixing-spraying devices for time-resolved cryo-electron microscopy. J. Struct. Biol. 168, 388–395 10.1016/j.jsb.2009.08.004 [DOI] [PMC free article] [PubMed] [Google Scholar]
- 166. Feng X., Fu Z., Kaledhonkar S., Jia Y., Shah B., Jin A., Liu Z., Sun M., Chen B., Grassucci R. A., Ren Y., Jiang H., Frank J., and Lin Q. (2017) A fast and effective microfluidic spraying-plunging method for high-resolution single-particle cryo-EM. Structure 25, 663–670.e3 10.1016/j.str.2017.02.005 [DOI] [PMC free article] [PubMed] [Google Scholar]
- 167. Fitzpatrick A. W., Lorenz U. J., Vanacore G. M., and Zewail A. H. (2013) 4D cryo-electron microscopy of proteins. J. Am. Chem. Soc. 135, 19123–19126 10.1021/ja4115055 [DOI] [PubMed] [Google Scholar]
- 168. Winn M. D., Ballard C. C., Cowtan K. D., Dodson E. J., Emsley P., Evans P. R., Keegan R. M., Krissinel E. B., Leslie A. G., McCoy A., McNicholas S. J., Murshudov G. N., Pannu N. S., Potterton E. A., Powell H. R., et al. (2011) Overview of the CCP4 suite and current developments. Acta Crystallogr. D Biol. Crystallogr. 67, 235–242 10.1107/S0907444910045749 [DOI] [PMC free article] [PubMed] [Google Scholar]
- 169. Frenz B., Walls A. C., Egelman E. H., Veesler D., and DiMaio F. (2017) RosettaES: a sampling strategy enabling automated interpretation of difficult cryo-EM maps. Nat. Methods 14, 797–800 10.1038/nmeth.4340 [DOI] [PMC free article] [PubMed] [Google Scholar]
- 170. Wang R. Y., Song Y., Barad B. A., Cheng Y., Fraser J. S., and DiMaio F. (2016) Automated structure refinement of macromolecular assemblies from cryo-EM maps using Rosetta. Elife 5, e17219 10.7554/eLife.17219 [DOI] [PMC free article] [PubMed] [Google Scholar]
- 171. Afonine P. V., Klaholz B. P., Moriarty N. W., Poon B. K., Sobolev O. V., Terwilliger T. C., Adams P. D., and Urzhumtsev A. (2018) New tools for the analysis and validation of cryo-EM maps and atomic models. Acta Crystallogr. D Struct. Biol. 74, 814–840 10.1107/S2059798318009324 [DOI] [PMC free article] [PubMed] [Google Scholar]
- 172. Terwilliger T. C., Adams P. D., Afonine P. V., and Sobolev O. V. (2018) A fully automatic method yielding initial models from high-resolution cryo-electron microscopy maps. Nat. Methods 15, 905–908 10.1038/s41592-018-0173-1 [DOI] [PMC free article] [PubMed] [Google Scholar]
- 173. Nicholls R. A., Tykac M., Kovalevskiy O., and Murshudov G. N. (2018) Current approaches for the fitting and refinement of atomic models into cryo-EM maps using CCP-EM. Acta Crystallogr. D Struct. Biol. 74, 492–505 10.1107/S2059798318007313 [DOI] [PMC free article] [PubMed] [Google Scholar]
- 174. Brown A., Long F., Nicholls R. A., Toots J., Emsley P., and Murshudov G. (2015) Tools for macromolecular model building and refinement into electron cryo-microscopy reconstructions. Acta Crystallogr. D Biol. Crystallogr. 71, 136–153 10.1107/S1399004714021683 [DOI] [PMC free article] [PubMed] [Google Scholar]
- 175. Henderson R. (2013) Avoiding the pitfalls of single particle cryo-electron microscopy: Einstein from noise. Proc. Natl. Acad. Sci. U.S.A. 110, 18037–18041 10.1073/pnas.1314449110 [DOI] [PMC free article] [PubMed] [Google Scholar]
- 176. van Heel M. (2013) Finding trimeric HIV-1 envelope glycoproteins in random noise. Proc. Natl. Acad. Sci. U.S.A. 110, E4175–E4177 10.1073/pnas.1314353110 [DOI] [PMC free article] [PubMed] [Google Scholar]
- 177. Subramaniam S. (2013) Structure of trimeric HIV-1 envelope glycoproteins. Proc. Natl. Acad. Sci. U.S.A. 110, E4172–E4174 10.1073/pnas.1313802110 [DOI] [PMC free article] [PubMed] [Google Scholar]
- 178. Rosenthal P. B., and Rubinstein J. L. (2015) Validating maps from single particle electron cryomicroscopy. Curr. Opin. Struct. Biol. 34, 135–144 10.1016/j.sbi.2015.07.002 [DOI] [PubMed] [Google Scholar]
- 179. Richardson J. S., Williams C. J., Hintze B. J., Chen V. B., Prisant M. G., Videau L. L., and Richardson D. C. (2018) Model validation: local diagnosis, correction and when to quit. Acta Crystallogr. D Struct. Biol. 74, 132–142 10.1107/S2059798317009834 [DOI] [PMC free article] [PubMed] [Google Scholar]
- 180. Henderson R., Sali A., Baker M. L., Carragher B., Devkota B., Downing K. H., Egelman E. H., Feng Z., Frank J., Grigorieff N., Jiang W., Ludtke S. J., Medalia O., Penczek P. A., Rosenthal P. B., et al. (2012) Outcome of the first electron microscopy validation task force meeting. Structure 20, 205–214 10.1016/j.str.2011.12.014 [DOI] [PMC free article] [PubMed] [Google Scholar]
- 181. Harauz G., and van Heel M. (1986) Exact filters for general geometry three-dimensional reconstruction. Optik. 73, 146–156 [Google Scholar]
- 182. Saxton W. O., and Baumeister W. (1982) The correlation averaging of a regularly arranged bacterial cell envelope protein. J. Microsc. 127, 127–138 10.1111/j.1365-2818.1982.tb00405.x [DOI] [PubMed] [Google Scholar]
- 183. van Heel M., and Schatz M. (2005) Fourier shell correlation threshold criteria. J. Struct. Biol. 151, 250–262 10.1016/j.jsb.2005.05.009 [DOI] [PubMed] [Google Scholar]
- 184. Penczek P. A. (2010) Resolution measures in molecular electron microscopy. Methods Enzymol. 482, 73–100 10.1016/S0076-6879(10)82003-8 [DOI] [PMC free article] [PubMed] [Google Scholar]
- 185. Chen S., McMullan G., Faruqi A. R., Murshudov G. N., Short J. M., Scheres S. H., and Henderson R. (2013) High-resolution noise substitution to measure overfitting and validate resolution in 3D structure determination by single particle electron cryomicroscopy. Ultramicroscopy 135, 24–35 10.1016/j.ultramic.2013.06.004 [DOI] [PMC free article] [PubMed] [Google Scholar]
- 186. Kucukelbir A., Sigworth F. J., and Tagare H. D. (2014) Quantifying the local resolution of cryo-EM density maps. Nat. Methods 11, 63–65 10.1038/nmeth.2727 [DOI] [PMC free article] [PubMed] [Google Scholar]
- 187. Cardone G., Heymann J. B., and Steven A. C. (2013) One number does not fit all: mapping local variations in resolution in cryo-EM reconstructions. J. Struct. Biol. 184, 226–236 10.1016/j.jsb.2013.08.002 [DOI] [PMC free article] [PubMed] [Google Scholar]
- 188. Ramirez-Aportela E., Vilas J. L., Melero R., Conesa P., Martinez M., Maluenda D., Mota J., Jimenez A., Vargas J., Marabini R., Carazo J.-M., and Sorzano C. O. S. (2018) Automatic local resolution-based sharpening of cryo-EM maps. bioRxiv 10.1101/433284 [DOI] [PMC free article] [PubMed] [Google Scholar]
- 189. Vilas J. L., Gómez-Blanco J., Conesa P., Melero R., Miguel de la Rosa-Trevín J., Otón J., Cuenca J., Marabini R., Carazo J.-M., Vargas J., and Sorzano C. O. S. (2018) MonoRes: automatic and accurate estimation of local resolution for electron microscopy maps. Structure 26, 337–344.e4 10.1016/j.str.2017.12.018 [DOI] [PubMed] [Google Scholar]
- 190. Thal D. M., Glukhova A., Sexton P. M., and Christopoulos A. (2018) Structural insights into G-protein-coupled receptor allostery. Nature 559, 45–53 10.1038/s41586-018-0259-z [DOI] [PubMed] [Google Scholar]
- 191. Jakobi A. J., Wilmanns M., and Sachse C. (2017) Model-based local density sharpening of cryo-EM maps. Elife 6, e27131 10.7554/eLife.27131 [DOI] [PMC free article] [PubMed] [Google Scholar]
- 192. Dang S., Feng S., Tien J., Peters C. J., Bulkley D., Lolicato M., Zhao J., Zuberbühler K., Ye W., Qi L., Chen T., Craik C. S., Jan Y. N., Minor D. L. Jr., Cheng Y., and Jan L. Y. (2017) Cryo-EM structures of the TMEM16A calcium-activated chloride channel. Nature 552, 426–429 10.1038/nature25024 [DOI] [PMC free article] [PubMed] [Google Scholar]
- 193. Penczek P. A. (2002) Three-dimensional spectral signal-to-noise ratio for a class of reconstruction algorithms. J. Struct. Biol. 138, 34–46 10.1016/S1047-8477(02)00033-3 [DOI] [PubMed] [Google Scholar]
- 194. Diebolder C. A., Faas F. G., Koster A. J., and Koning R. I. (2015) Conical Fourier shell correlation applied to electron tomograms. J. Struct. Biol. 190, 215–223 10.1016/j.jsb.2015.03.010 [DOI] [PubMed] [Google Scholar]
- 195. Dudkina N. V., Kudryashev M., Stahlberg H., and Boekema E. J. (2011) Interaction of complexes I, III, and IV within the bovine respirasome by single particle cryoelectron tomography. Proc. Natl. Acad. Sci. U.S.A. 108, 15196–15200 10.1073/pnas.1107819108 [DOI] [PMC free article] [PubMed] [Google Scholar]
- 196. Naydenova K., and Russo C. J. (2017) Measuring the effects of particle orientation to improve the efficiency of electron cryomicroscopy. Nat. Commun. 8, 629 10.1038/s41467-017-00782-3 [DOI] [PMC free article] [PubMed] [Google Scholar]
- 197. DiMaio F., Zhang J., Chiu W., and Baker D. (2013) Cryo-EM model validation using independent map reconstructions. Protein Sci. 22, 865–868 10.1002/pro.2267 [DOI] [PMC free article] [PubMed] [Google Scholar]
- 198. Brünger A. T. (1997) Free R value: cross-validation in crystallography. Methods Enzymol. 277, 366–396 10.1016/S0076-6879(97)77021-6 [DOI] [PubMed] [Google Scholar]
- 199. Williams C. J., Hintze B. J., Richardson D. C., and Richardson J. S. (2013) CaBLAM: identification and scoring of disguised secondary structure at low resolution. Comput. Cryst. Newsletter 4, 33–35 [Google Scholar]
- 200. Barad B. A., Echols N., Wang R. Y., Cheng Y., DiMaio F., Adams P. D., and Fraser J. S. (2015) EMRinger: side chain-directed model and map validation for 3D cryo-electron microscopy. Nat. Methods 12, 943–946 10.1038/nmeth.3541 [DOI] [PMC free article] [PubMed] [Google Scholar]
- 201. Chen V. B., Arendall W. B. 3rd., Headd J. J., Keedy D. A., Immormino R. M., Kapral G. J., Murray L. W., Richardson J. S., and Richardson D. C. (2010) MolProbity: all-atom structure validation for macromolecular crystallography. Acta Crystallogr. D Biol. Crystallogr. 66, 12–21 10.1107/S0907444909042073 [DOI] [PMC free article] [PubMed] [Google Scholar]
- 202. Williams C. J., Headd J. J., Moriarty N. W., Prisant M. G., Videau L. L., Deis L. N., Verma V., Keedy D. A., Hintze B. J., Chen V. B., Jain S., Lewis S. M., Arendall W. B. 3rd., Snoeyink J., Adams P. D., et al. (2018) MolProbity: more and better reference data for improved all-atom structure validation. Protein Sci. 27, 293–315 10.1002/pro.3330 [DOI] [PMC free article] [PubMed] [Google Scholar]
- 203. Wlodawer A., Li M., and Dauter Z. (2017) High-resolution cryo-EM maps and models: a crystallographer's perspective. Structure 25, 1589–1597.e1 10.1016/j.str.2017.07.012 [DOI] [PMC free article] [PubMed] [Google Scholar]
- 204. Terwilliger T. C., Sobolev O. V., Afonine P. V., and Adams P. D. (2018) Automated map sharpening by maximization of detail and connectivity. Acta Crystallogr. D Struct. Biol. 74, 545–559 10.1107/S2059798318004655 [DOI] [PMC free article] [PubMed] [Google Scholar]
- 205. Beckers M., Jakobi A. J., and Sachse C. (2019) Thresholding of cryo-EM density maps by false discovery rate control. IUCrJ 6, 18–33 10.1107/S2052252518014434 [DOI] [PMC free article] [PubMed] [Google Scholar]
- 206. Shu F., Ramakrishnan V., and Schoenborn B. P. (2000) Enhanced visibility of hydrogen atoms by neutron crystallography on fully deuterated myoglobin. Proc. Natl. Acad. Sci. U.S.A. 97, 3872–3877 10.1073/pnas.060024697 [DOI] [PMC free article] [PubMed] [Google Scholar]
- 207. Wang J., and Moore P. B. (2017) On the interpretation of electron microscopic maps of biological macromolecules. Protein Sci. 26, 122–129 10.1002/pro.3060 [DOI] [PMC free article] [PubMed] [Google Scholar]
- 208. Mitsuoka K., Hirai T., Murata K., Miyazawa A., Kidera A., Kimura Y., and Fujiyoshi Y. (1999) The structure of bacteriorhodopsin at 3.0 A resolution based on electron crystallography: implication of the charge distribution. J. Mol. Biol. 286, 861–882 10.1006/jmbi.1998.2529 [DOI] [PubMed] [Google Scholar]
- 209. Wang J. (2017) Experimental charge density from electron microscopic maps. Protein Sci. 26, 1619–1626 10.1002/pro.3198 [DOI] [PMC free article] [PubMed] [Google Scholar]
- 210. Wang J. (2017) On the appearance of carboxylates in electrostatic potential maps. Protein Sci. 26, 396–402 10.1002/pro.3093 [DOI] [PMC free article] [PubMed] [Google Scholar]
- 211. Yonekura K., Kato K., Ogasawara M., Tomita M., and Toyoshima C. (2015) Electron crystallography of ultrathin 3D protein crystals: atomic model with charges. Proc. Natl. Acad. Sci. U.S.A. 112, 3368–3373 10.1073/pnas.1500724112 [DOI] [PMC free article] [PubMed] [Google Scholar]
- 212. Shi D., Nannenga B. L., Iadanza M. G., and Gonen T. (2013) Three-dimensional electron crystallography of protein microcrystals. Elife 2, e01345 10.7554/eLife.01345 [DOI] [PMC free article] [PubMed] [Google Scholar]
- 213. de la Cruz de M. J., Hattne J., Shi D., Seidler P., Rodriguez J., Reyes F. E., Sawaya M. R., Cascio D., Weiss S. C., Kim S. K., Hinck C. S., Hinck A. P., Calero G., Eisenberg D., and Gonen T. (2017) Atomic-resolution structures from fragmented protein crystals with the cryoEM method MicroED. Nat. Methods. 14, 399–402 10.1038/nmeth.4178 [DOI] [PMC free article] [PubMed] [Google Scholar]