

Abstract
Class C G protein–coupled receptors (GPCRs) are obligatory dimers that are particularly important for neuronal responses to endogenous and environmental stimuli. Ligand recognition through large extracellular domains leads to the reorganization of transmembrane regions to activate G protein signaling. Although structures of individual domains are known, the complete architecture of a class C GPCR and the mechanism of interdomain coupling during receptor activation are unclear. By screening a mutagenesis library of the human class C sweet taste receptor subunit T1R2, we enhanced surface expression and identified a dibasic intracellular retention motif that modulates surface expression and co-trafficking with its heterodimeric partner T1R3. Using a highly expressed T1R2 variant, dimerization sites along the entire subunit within all the structural domains were identified by a comprehensive mutational scan for co-trafficking with T1R3 in human cells. The data further reveal that the C terminus of the extracellular cysteine-rich domain needs to be properly folded for T1R3 dimerization and co-trafficking, but not for surface expression of T1R2 alone. These results guided the modeling of the T1R2–T1R3 dimer in living cells, which predicts a twisted arrangement of domains around the central axis, and a continuous folded structure between transmembrane domain loops and the cysteine-rich domains. These insights have implications for how conformational changes between domains are coupled within class C GPCRs.
Keywords: G protein-coupled receptor (GPCR), membrane trafficking, dimerization, directed evolution, molecular modeling, structural model, mutagenesis, deep mutational scan
Introduction
The perception of sweet taste guides animals to seek nutritious food. Initial molecular recognition of sweet-tasting substances, which includes sugars, artificial sweeteners, and some proteins, is by sweet taste receptors comprising taste 1 receptor member 2 (T1R2)2 and member 3 (T1R3) (1, 2). The sweet taste receptor is conserved in vertebrates, but there are species-specific differences in ligand specificity and sensitivity to inhibitors (3–6).
T1R2 and T1R3 belong to the class C G protein–coupled receptor (GPCR) family. This family is dominated by important neuronal receptors, including eight types of metabotropic glutamate receptor (mGluR) and the γ-aminobutyric acid type B receptor (GABABR) that recognize the major excitatory and inhibitory neurotransmitters, respectively, and the umami taste receptor (T1R1–T1R3). Other class C GPCRs include the calcium-sensing receptor (CaSR) for regulating calcium homeostasis and the promiscuous androgen receptor GPRC6A. Class C GPCRs have a large N-terminal extracellular domain (ECD) genetically fused to the seven-helix transmembrane domain (TMD). The ECD is further divided into a ligand-binding domain (LBD), which adopts a bi-lobed structure that closes over a ligand similar to the action of a venus-fly trap, and, with the exception of GABABR, a cysteine-rich domain (CRD) that connects to the TMD (7, 8). In the human sweet taste receptor, sugars bind and induce closure of the T1R2 LBD, whereas artificial sweeteners and sweet proteins can bind other sites dispersed across the receptor to stabilize an active conformation (3, 9–18).
Class C GPCRs are obligate dimers, and their dimeric architecture is critical for converting agonist binding at the extracellular LBDs into active G protein signaling in the cytoplasm (19). Multiple studies have determined dimeric ECD structures in ligand-bound and -unbound states and identified that ECD dimerization occurs through hydrophobic contacts between the N-terminal subdomains, referred to as lobe 1 (20–27). The relative orientation between lobes 1 and 2 can vary in both ligand-free and -bound states, but it is their closure around an agonist that ultimately generates conformational changes in the TMD for active signaling (28–33). There are two isolated TMD structures from mGluR1 and mGluR5 (34–36). Although the mGluR1–TMD crystal packing captured a possible dimer mediated by transmembrane helix 1 (TM1 or H1), cysteine cross-linking has shown that mGluR2 dimerizes via TM4/TM5 contacts in the resting state and via TM6 in the active state (35, 37). It is unclear whether the dimeric mGluR1 TMD structure is physiological or perhaps represents an alternative conformational state. Although these studies provide insights into receptor dimerization and ligand-induced conformational change, it remains unclear how LBD closure generates conformational changes in the TMD. This limitation is a consequence of not knowing how individual domains are assembled into a full-length receptor. Understanding how T1R2 and T1R3 associate can therefore illuminate the mechanism of class C GPCRs generally.
In this study, we identify a conserved surface during in vitro selection of human T1R2 for associating with T1R3. Identifying the dimerization surface of the sweet taste receptor was challenging due to low surface expression (2, 38, 39), which necessitated the selection of T1R2 mutants for enhanced surface expression and co-trafficking with T1R3. A subsequent deep mutational scan of T1R2 in human cells identified surfaces on lobe 1 of the LBD, on the CRD, and in TM6 for dimerization with T1R3 as assessed by their co-trafficking to the plasma membrane. These surfaces are also conserved in natural evolution, but whereas natural sequence conservation is shaped by multiple properties such as protein stability, ligand binding, and signaling, the deep mutational scan could be focused on T1R2–T1R3 co-trafficking to identify residues under explicit conservation for dimerization. We consequently propose a model of the T1R2–T1R3 heterodimer consistent with the saturation mutagenesis and previously published studies.
Results
Selection of T1R2 mutants with enhanced surface expression
Surface localization of human T1R3 depends on human T1R2 co-expression, suggesting the two subunits must form a heterodimeric complex for appropriate trafficking of a functional sweet taste receptor (39). We focus on the mutagenesis and selection of T1R2 to tease apart the effects of mutations on subunit stability (based on the independent trafficking of T1R2 to the cell surface) and dimerization (based on T1R2–T1R3 co-trafficking).
T1R2 and T1R3 were expressed with extracellular N-terminal tags for surface detection either independently or together in Expi293F cells, a suspension culture derivative of HEK293 that has advantages for sorting large mutant libraries. Based on flow cytometry of cells stained in nonpermeable and permeable conditions (Fig. 1, A–D), we found low levels of T1R2 and barely detectable levels of T1R3 on the cell surface, with most protein remaining intracellular. T1R3 surface expression was substantially increased by co-expression with T1R2 but not with the unrelated GPCR CXCR4 (Fig. 1, B and D, and Fig. S1). T1R2 surface levels, however, were decreased by co-expression with T1R3, due partially to decreased total expression (Fig. 1, A and C). Using a brighter fluorescent antibody showed that although T1R2 surface expression is reduced, some T1R2 nonetheless remains surface-localized when co-expressed with T1R3 (Fig. S1).
Figure 1.

Selection of T1R2 mutants with increased surface expression. A and B, flow cytometry histograms representing surface expression of FLAG–T1R2 (A) and c-Myc–T1R3 (B) transfected in Expi293F cells. C and D, quantified flow cytometry data showing surface and total expression of FLAG–T1R2 (C) and c-Myc–T1R3 (D). Gates for T1R2 (anti-FLAG–Cy3)- or T1R3 (anti-c-Myc–Alexa 647)-positive cells were set at 0.5% of negative control cells. The percent positive cells in the transfected culture was a more reproducible indicator of expression than measuring mean fluorescence of a very small positive population. Data are averaged over at least 12 experiments (± S.D.). **, p < 0.01; ***, p < 0.001; Student's two-tailed unpaired t test. E, flow cytometry histogram showing the emergence of T1R2 mutants with enhanced surface expression after two rounds of FACS enrichment. F, sites of mutations found in 17 T1R2 variants with enhanced expression. Amino acid substitutions are black. Frameshift mutations are orange.
To identify T1R2 mutants with enhanced surface expression that may be more amenable to biochemical studies, we used fluorescence-activated cell sorting (FACS) to select high-expressing T1R2 variants. A random mutagenesis library of FLAG-tagged T1R2 was transfected into Expi293F cells using conditions that typically yield no more than one sequence variant per cell, providing a tight link between genotype and phenotype (40). The highest T1R2-expressing cells were enriched by two rounds of FACS (Fig. 1E). 61 individual clones were isolated and tested, and the 18 clones with higher T1R2 surface expression were sequenced. All were unique, and yet despite the lack of convergence, two kinds of mutations were over-represented; seven clones had a serine to asparagine substitution at position 212, and 10 clones had frameshift mutations that result in extended C termini or premature termination after TM1 (Fig. 1F and Fig. S2). We named clones with only missense mutations as M1 to M7 and clones with frameshift mutations as FS1 to FS10. An 18th mutant combined premature termination after TM3 with 9 amino acid substitutions, but because it lacked similarities to other clones, it was excluded from further analysis. In summary, a diverse library of T1R2 was successfully evolved in vitro for higher surface expression.
Single missense mutations that enhance surface expression of T1R2 and T1R3
T1R2 variants with enhanced surface expression had one or more missense mutations in the extracellular domain, with the exception of clone FS1 that only had a frameshift (Fig. 1F and Fig. S2). To determine which of the missense mutations are responsible for higher surface expression, we used targeted mutagenesis to introduce the mutations individually into T1R2. Most enhanced T1R2 surface expression, with small increases in total expression compared with WT (Fig. 2A and Fig. S3A). Mutation S212N, which was found in seven of the clones, had the largest effect. I132S, R230H, and D231G also caused substantial increases in surface expression, whereas other mutations had lesser effects. With few exceptions, mutations could generally be combined for even higher T1R2 surface expression (Fig. 2A).
Figure 2.
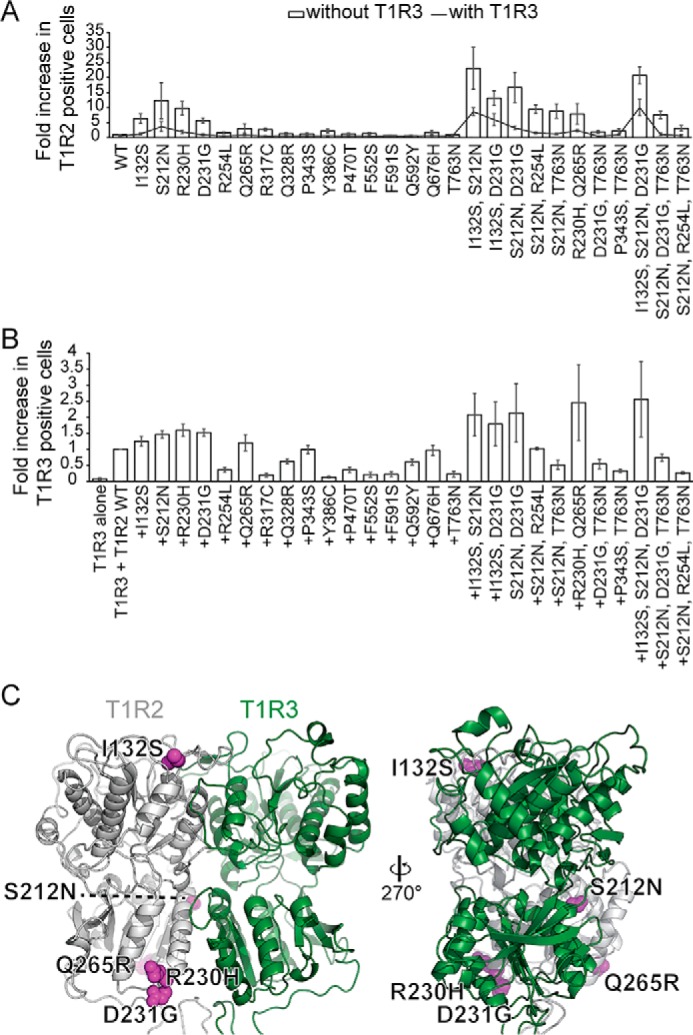
Surface expression and co-trafficking with T1R3. A, quantified flow cytometry data of T1R2 surface expression by itself (columns) or co-transfected with T1R3 (unbroken black line). The gate for T1R2 (anti-FLAG–Cy3)-positive cells was set at 0.5% of vector-only control cells. Data are mean ± S.D., n ≥ 3. B, Expi293F cells were co-transfected with WT T1R3 and the indicated T1R2 mutants. Surface expression of T1R3 was quantified by flow cytometry. The gate for T1R3 (anti-c-Myc–Alexa 647)-positive cells was set at 0.5% of control cells. Values are normalized to the percentage of T1R3-positive cells in the sample co-transfected with WT T1R2 and T1R3. Data are mean ± S.D., n ≥ 3. C, homology model of the human T1R2 (gray) and T1R3 (green) dimer showing the positions of five T1R2 substitutions (magenta spheres) that enhanced surface expression of both subunits.
Co-expression with T1R3 decreased surface T1R2 by half or more for all the missense mutations (Fig. 2A), due in part to decreased total expression (Fig. S3A). Surprisingly, T1R3 surface expression was only improved by co-expression with a subset of the T1R2 variants containing mutations I132S, S212N, R230H, D231G, or Q265R, whereas other highly-expressed T1R2 mutants failed to bring T1R3 to the cell surface as effectively as WT and are presumably defective for dimeric associations (Fig. 2B and Fig. S3B).
The five most effective T1R2 mutations–I132S, S212N, R230H, D231G, and Q265R–are located close to the T1R3-binding interface and are directed toward the solvent (Fig. 2C and Fig. S3C). I132S and S212N generate consensus glycosylation sequences (Asn130–Tyr131–Ser132 and Asn212–Asp213–Thr214). N-Linked glycosylation is often involved in folding and trafficking of membrane proteins (41). Whether glycosylation on residue 212 might interfere with ECD dimerization would depend on the relative orientations of T1R2–T1R3 lobes 1 and 2 (Fig. 2C and Fig. S3C), perhaps explaining why S212N caused a large increase in T1R2 surface expression but a smaller increase for T1R3 compared with other mutations (Fig. 2, A and B). R230H and D231G, which can cap and break the C terminus of the second helix in lobe 2, may facilitate folding of the loop that forms a critical disulfide (Cys233–Cys513) between the LBD and CRD (Fig. S3D). Finally, Q265R makes favorable contacts to nearby backbone atoms (Fig. S3E).
TMDs and cytosolic tails of T1R2 and T1R3 modulate surface expression of the dimeric sweet taste receptor
Ten of the T1R2 clones had frameshifts generating premature termination after TM1 or an extended C terminus of altered sequence after TM7 (Fig. 1F and Fig. S2). We therefore hypothesized that a C-terminal motif in the transmembrane domain or cytosolic tail of T1R2 inhibits surface expression. To test this, we characterized truncated variants of T1R2 and T1R3 in which the extracellular domains alone (R2ECD and R3ECD, respectively) were fused to a canonical transmembrane helix from MHC class I (R2ECD–MHC and R3ECD–MHC) (Fig. 3A). Surface expression of both R2ECD–MHC and R3ECD–MHC was indeed improved, whereas total expression was similar to the WT proteins (Fig. 3, B and C, and Fig. S4, A and B). We further tested two T1R2 frameshift mutants with extended (R2FS1) or pre-matured (R2FS10) cytosolic tails. Surface expression of R2FS1 and R2FS10 was substantially increased, yet these T1R2 variants had relatively similar total expression (Fig. 3B and Fig. S4A). Cells expressing R2FS1 responded to sweet compounds similarly to cells expressing T1R2, indicating that the mutant is functional (Fig. 3, D–F). The T1R2 transmembrane domain and cytosolic tail therefore retain T1R2 intracellularly, and the transmembrane domain and cytosolic tail of T1R3 couples T1R3 escape from intracellular compartments to the presence of T1R2.
Figure 3.

Effects of ECD and TMD interactions on surface expression of T1R2–T1R3. A, schematic diagram of T1R2 and T1R3 constructs. Quantified flow cytometry data of surface expression of FLAG–T1R2 (B) and c-Myc–T1R3 constructs (C) were expressed individually. Gates for positive cells were set at 0.5% of control cells. The percentage of positive cells was normalized to the percent positive cells expressing WT T1R2 or T1R3. Mean ± S.D., n = 3. D and E, representative recordings of Ca2+ mobilization in single cells. HEK293 cells heterologously expressing T1R2 + T1R3 (D) or R2FS1 + T1R3 (E) with Gα16–gust44 showed Ca2+ responses to non-nutritive sweeteners 10 mm Asp, 0.3 mm SC, and 30 mm Cyc, but not to Cyc with lactisole (1 mm) (T1R3 inhibitor) or 1 mm PROP (T2R38 agonist). Positive control: 10 μm Iso. F, HEK293 cells were transiently transfected with T1R2 or R2FS1 along with T1R3 and Gα16-gust44 or Gα16-gust44 without sweet taste receptor. The responses to aspartame, SC, Cyc, Cyc with lactisole, PROP, and Iso were measured. Data are mean ± S.E., 27–29 cells (n = 3). G–I, normalized percent positive cells after analyzing surface expression of FLAG–T1R2 constructs co-expressed with WT T1R3 (G), R3ECD–MHC (H), and R3ECD (I). Mean ± S.D., n = 3. J, sequence alignment of C-terminal cytosolic tails from fish, dog, rat, mouse, monkey, and human T1R2 with frameshift mutant R2FS1. K, quantified flow cytometry data of surface (white) and total (gray) expression of T1R2 constructs. Percent positive cells is normalized to the percentage of cells expressing WT T1R2. Data are mean ± S.D. over at least three experiments.
T1R2 and T1R3 variants were then co-expressed to determine whether ECD interactions are sufficient to promote T1R3 surface trafficking. Indeed, surface localization of WT T1R3 or R3ECD–MHC was enhanced by co-expression with R2FS10 and R2ECD–MHC, as well as by co-expression with soluble R2ECD that lacks any transmembrane anchor (Fig. 3, G and H). Soluble R3ECD was also expressed on the cell surface with T1R2 variants (Fig. 3I), presumably bound to the T1R2 ECD. Total expression of all variants was similar to the WT proteins (Fig. S4, C–E). ECD interactions are therefore sufficient for promoting T1R2–T1R3 surface expression.
Surface expression of R3ECD–MHC and R3ECD was correlated with surface levels of the various T1R2 variants, but surface localization of full-length T1R3 was not. Instead, T1R3 levels at the plasma membrane remained similar or were lower when co-expressed with the T1R2 variants R2FS1 or R2FS10 or the extracellular domains R2ECD or R2ECD–MHC. This was despite these different T1R2 constructs expressing on the cell surface at much higher levels than WT T1R2, whereas total expression was similar (Fig. 3G and Fig. S4C). The transmembrane domain and cytosolic tail of T1R2 is therefore required for optimum surface expression of a T1R2–T1R3 heterodimer.
Compared with WT T1R2, the R2FS1 variant has increased surface expression and differs by a short random extension three residues in from the native C terminus (Fig. 3, B and J). Because the cytosolic tail of T1R2 is also highly conserved (Fig. 3J), we hypothesized that the cytosolic tail regulates trafficking. To narrow down the location of a trafficking motif, we truncated the last five residues (R2Δ835–839), as well as substituted the highly conserved terminal basic residues at positions 837 and 838 to glycine (R2-RR837–8GG), as found in R2FS1. Surface T1R2 expression was increased by both modifications, whereas total expression was similar to WT T1R2 (Fig. 3K). However, surface T1R3 failed to increase beyond levels achieved by co-expression with WT T1R2, similar to the previously characterized R2FS1 construct (Fig. S4, F and G). T1R1, a homolog of T1R2 that also forms a heterodimer with T1R3 for the recognition of umami taste, similarly has two basic residues at its C terminus, but their substitution did not increase T1R1 surface expression, and it likely has different trafficking mechanisms (Fig. S4, H and I). We also examined the subcellular localization of T1R2 and R2FS1 using confocal microscopy and found both proteins co-localize intracellularly with GM130, suggesting the checkpoint for trafficking to the cell surface is exit from the Golgi (Fig. S5). In summary, a terminal dibasic motif within the T1R2 cytosolic tail inhibits T1R2 surface localization and favors the plasma membrane trafficking of a T1R2–T1R3 heterodimer based on co-expression analysis.
Deep mutational scan of T1R2 for surface expression and dimerization with T1R3
T1R3 is barely detected on the cell surface when expressed alone, yet its surface expression dramatically increases when co-expressed with T1R2 (Figs. 1–3). Furthermore, T1R3 surface expression is correlated with the various surface levels observed for different missense mutants of T1R2, strongly suggesting that T1R2 and T1R3 physically associate and traffic together (Fig. 2). Hence, using co-trafficking of T1R3 to the cell surface as an indirect measure of heterodimer interactions, we screened T1R2 mutations for T1R3 association to define the dimerization surface, using deep mutational scanning in human cells as described previously for the class A GPCRs CXCR4 and CCR5 (40). Single site-saturation mutagenesis (SSM) was applied to R2FS1 rather than WT T1R2 for three reasons. First, because R2FS1 had higher surface expression (Fig. 3G), positive cells could be well resolved for consistent FACS gating conditions. Second, we had already shown that the T1R2 C-terminal tail regulates trafficking of a T1R2–T1R3 heterodimer, but now we wanted to explore all the other potential sites on the LBD, CRD, and TMD that may mediate subunit interactions. Third, R2FS1 is functionally competent for signaling (Fig. 3, D–F). The deep mutational scan is therefore in the R2FS1 background, and from hereon we simply refer to it as T1R2.
Three SSM libraries of FLAG-tagged T1R2 were generated spanning residues 22–285 (ECD1 library), 286–549 (ECD2 library), and 550–836 (TMD library) that together cover nearly all single amino acid substitutions. Splitting mutagenesis across three libraries that are sorted independently increases sampling of each mutation. The T1R2 SSM libraries were transfected in Expi293F cells stably expressing c-Myc–tagged T1R3. Cells were stained and sorted for surface expression of T1R2 to assess the impact of mutations on subunit stability and escape from the ER quality control machinery, or were sorted for both T1R2 and T1R3 surface expression to indirectly assess the impact of mutations on heterodimerization (Fig. S6). Naïve plasmid libraries and cDNA from sorted cells were deep-sequenced, and enrichment ratios for all amino acid substitutions were calculated; beneficial mutations are enriched, whereas deleterious mutations are depleted (Fig. 4) (42). Residue conservation scores, which define conserved sites for the activity under selection, are calculated by averaging log2 enrichment ratios of all mutations at a specific position (40). Both enrichment ratios and conservation scores for the three SSM libraries were closely correlated between independent replicates (Fig. S7).
Figure 4.

Sequence–activity landscapes of human T1R2 for surface expression and co-trafficking with T1R3. A, schematic diagram showing domain organization of T1R2 primary sequence. B, sequence–activity landscape of T1R2 based on selection for surface expression. Amino acid substitutions are plotted vertically, whereas the T1R2 sequence is scanned on the horizontal axis. Log2 enrichment ratios (average from two independent replicates) are plotted from ≤ −3 (depleted, orange) to 0 (neutral, white) to ≥ +3 (enriched, blue). Mutations missing in the naïve libraries (frequencies less than 5 × 10⁻⁶) are black. *, stop codon. C, sequence–activity landscape of T1R2 based on selection of cells co-expressing both T1R2 and T1R3. Data are plotted and colored as described for B. D, schematic diagram showing regions with secondary structure (colored by domain, as in A) based on crystal structures of homologs. E, plot of average conservation scores along the T1R2 sequence. The more negative the score, the more conserved the residue in the in vitro selection experiment for T1R2 surface expression (purple bars) or T1R2–T1R3 surface co-expression (green line). Positions where substitutions were missing in the naïve SSM libraries are shaded gray.
In the T1R2 sequence–activity landscape, mutations in secondary structure tend to be deleterious for surface expression, whereas the connecting loops are more tolerant of amino acid substitutions. Two long loops in lobe 1 (residues 40–65 and 328–384) were highly tolerant of mutations, as were the loops connecting the seven transmembrane helices, whereas polar substitutions within transmembrane helices were depleted. As expected, stop codons at most positions were depleted, with the notable exception that premature termination after TM1 is tolerated for T1R2 surface expression, although such mutants are highly deleterious for “bringing” T1R3 to the cell surface, immediately indicating there are important interactions between the TMDs and cytosolic tails. These results are consistent with the T1R2 random mutagenesis screen.
T1R2 has eight asparagine residues that are putative sites of N-glycosylation. All eight are exposed to solvent on the T1R2 surface and are highly conserved in the in vitro selection except Asn248 (Fig. S8). Four (Asn84, Asn292, Asn368, and Asn428) are known N-glycosylation sites in fish T1R2 (25).
Conserved surface on the T1R2 ECD for dimerization with T1R3
When the T1R2 libraries were selected for T1R2–T1R3 surface co-expression, many more mutations were deleterious, and the T1R2 sequence becomes more conserved (Fig. 4E). This is especially apparent in lobe 1 of the LBD. To highlight T1R2 residues preferentially conserved for heterodimerization, we calculate the difference between conservation scores from the selections for T1R2 surface expression (which primarily capture sequence constraints for subunit folding) from the conservation scores for surface expression of T1R3. A surface patch of T1R2 lobe 1, which we refer to as site I, is under strong selective pressure for associating with T1R3 (Fig. 5, A and B; residues at predicted contact sites are listed in Table S1). Hydropathy-weighted averages of enrichment ratios also highlight that site I is biased toward hydrophilic residues for T1R2 surface expression alone, yet it is restricted to hydrophobic residues for dimerizing and trafficking with T1R3 (Fig. 5, C and D). This is consistent with crystal structures showing that the ECDs of class C GPCRs dimerize mainly through hydrophobic interactions between lobe 1 of each subunit. The mutational scan also indicated that the tip of the CRD most distal from the membrane, which we refer to as site II, is preferentially conserved for dimeric interactions. Furthermore, a large surface on the CRD (referred to as site III) is weakly conserved and biased toward hydrophobic residues.
Figure 5.

Important sites on T1R2 for surface expression and heterodimerization. A, surface representation of a homology model of T1R2 ECD, colored by conservation scores following in vitro selection for T1R2 surface expression. Proposed dimerization sites on the ECD are shown with dashed lines. Conservation scores are colored from ≤ −2 (conserved, orange) to 0 (variable, white) to ≥ +2 (under selection for change, blue). B, surface representation of T1R2 ECD showing the different conservation scores between in vitro selections for surface expression of T1R2 alone and T1R2–T1R3 together. Difference conservation scores are colored from ≤ −2 (preferentially conserved for dimerization, orange) to 0 (equally conserved in both selections, white) to ≥ +2 (preferentially conserved for T1R2 surface expression alone, blue). C, surface of T1R2 ECD colored by the average of the hydropathy-weighted log2 enrichment ratios after selection for T1R2 surface expression. Residues that prefer polar substitutions are blue, and the residues that prefer hydrophobic amino acids are yellow. D, surface of T1R2 ECD colored by hydropathy scores (residues tolerant of polar substitutions are blue; residues that prefer hydrophobic amino acids are yellow) from the in vitro selections for T1R2–T1R3 surface co-expression. E and F, model of T1R2 ECD (surface, colored by difference conservation score as in B) bound to T1R3 ECD (green ribbon). E is in the same orientation as in A–D. G–J, conservation during natural evolution (based on ortholog sequence alignments) is shown on the crystal structures of fish T1R2 LBD (G; PDB 5X2N), fish T1R3 LBD (H; PDB 5X2N), CaSR ECD (I; PDB 5K5S), and mGluR3 ECD (J; PDB 2E4W). Variable residues are in turquoise, and the highly conserved residues are in maroon. All structures are aligned and in the same conformation as A–D. K, model of T1R2 TMD showing average conservation scores based on in vitro selection for surface expression. Site IV is shown with a dashed line. Conservation scores are colored from ≤ −1.5 (conserved, orange) to 0 (variable, white) to ≥ +1.5 (under selection for change, blue). L, difference conservation scores (as in B) are mapped to the surface of a model of T1R2 TMD. Residues more conserved for T1R2–T1R3 co-trafficking are orange (scores ≤ −1.5); residues similarly conserved under both selection regimes are white; and residues preferentially conserved for T1R2 surface expression are blue (scores ≥ +1.5). M–O, sequence conservation during natural evolution mapped to surfaces of the homology model of T1R2 TMD (M), T1R3 TMD (N), and mGluR1 TMD (O; PDB 4OR2). Evolutionarily conserved residues are shown in maroon to the highly variable residues shown in turquoise. Structures are oriented as in K and L, with site IV encircled by a dashed line. P, cartoon representation of L with the T1R2 TMD colored as a spectrum from the N terminus (blue) to the C (red) terminus.
A dimerization interface between sites I, II, and III of two ECDs closely matches the dimeric structure of agonist-bound CaSR (21). This was surprising, because we had anticipated the mutational scan would define the dimerization interface for the sweet taste receptor in a resting conformation with the LBDs unbound and open. However, we note that the sugar-binding site at the cleft between lobes 1 and 2 of T1R2 is highly conserved in the sequence–activity landscape, and the receptor could bind one of the many sugars or sugar derivatives in the ER lumen. The data are overall highly consistent with a dimeric T1R2–T1R3 extracellular domain conformation resembling that of ligand-bound CaSR.
Crystal structures show class C GPCRs share structural and dimerization features, and it is therefore likely that the dimerization surface is evolutionarily conserved. Natural sequence conservation for T1R2, T1R3, CaSR, or mGluR3 was calculated and mapped to the crystal structures of fish T1R2–LBD, fish T1R3–LBD, CaSR–ECD, and mGluR3–ECD, respectively. The putative dimerization surface based on the mutational scan is also conserved in natural history (Fig. 5, G–J). An advantage of the experimental mutational scan using two different selection regimes is that it filters out residue conservation for the folding and surface expression of T1R2 alone, thereby focusing attention on residues under explicit preferential conservation for T1R2–T1R3 association and co-trafficking.
Conserved surface on the T1R2 TMD for dimerization with T1R3
Beyond the extracellular region, the difference map also highlighted a region in the T1R2 TMD preferentially conserved for T1R2–T1R3 surface co-expression. Although most of the TMD surface was similarly conserved for both T1R2 surface expression alone or for T1R2–T1R3 co-expression, site IV was notably much more intolerant of mutations in the latter selection (Fig. 5, K and L; Fig. S9, A–J). Site IV is composed of TM6 and the cytoplasmic base of TM5. Interestingly, this region is also extremely conserved during natural evolution based on alignments of orthologous mGluR1 or T1R2 sequences, whereas the surrounding TMD surfaces are highly variable (Fig. 5, M–O; Fig. S9, K–T). Because the extracellular dimerization surface identified by the mutational scan is both well-matched to crystal structures of ECD dimers and evolutionarily conserved, we argue that site IV, which is similarly highly conserved both in natural history and our mutational scan, forms the dimerization interface between the TMDs. A previous study used cross-linking to show that TM6 helices of both subunits are in proximity in agonist-bound mGluR2 (37). This further suggests that site IV is a real dimerization surface of T1R2 and that class C GPCRs share a common dimerization mechanism for the ECDs and TMDs. Because residues in TM6 of mGluR2 are only cross-linked in the active conformation (37), the mutational scan likely informs on a ligand-bound T1R2 conformation, as also suggested by the data's agreement with the agonist-bound CaSR–ECD crystal structure. Finally, the cytosolic surface of the TMD is conserved both in the deep mutational scan and in natural evolution, suggesting that proper structure of the G protein–binding site is important for sweet taste receptor dimerization and surface expression (Fig. S9, E, J, O, and T).
CRD and the second extracellular loop (ECL2) of the TMD are involved in T1R2–T1R3 surface co-expression
T1R2 has 19 extracellular cysteine residues, all of which form disulfide bonds. In the LBD, three cysteines were highly conserved, whereas five cysteines within or bonded to the two long variable loops were generally tolerant of substitutions (Fig. 6A and Fig. S10, A and B). The cysteines with high-mutational tolerance are Cys102 of the lobe 1 core that bonds to Cys59 in the first variable loop, Cys363 and Cys366 that form a disulfide between nearby positions within the same loop, and Cys359 that forms an intersubunit disulfide with Cys129 of T1R3. This final result was unexpected; the cysteine forming a disulfide connection between T1R2 and T1R3 is clearly unnecessary for subunit expression and dimerization, and rather the major determinants of T1R2–T1R3 association are noncovalent interactions. In metabotropic glutamate receptors, the disulfide linking the two subunits is also dispensable for expression of a functional dimer (29). Of the three highly conserved LBD cysteines in the mutational scan, Cys405 and Cys410 form a disulfide that stabilizes a sharp turn at the apex of lobe 1, and Cys233 connects the LBD and CRD to couple conformational dynamics (Fig. 6, B–D).
Figure 6.

Mutational tolerance of T1R2 cysteine residues. A, plot showing average conservation scores of all cysteine residues following in vitro selection. Negative scores indicate greater conservation and intolerance to mutations. Cysteine residues that are preferentially highly conserved for T1R2–T1R3 co-trafficking are highlighted by the difference score and are colored red. B and C, cartoon representations (views are rotated by 180°) showing the positions of cysteine residues in a model of the ECD. T1R2 is gray, and T1R3 is green. Loops containing cysteines (magenta sticks) are colored cyan, and the C-terminal end of lobe 1 is colored yellow. Cys359, which forms a disulfide to T1R3, is light green. D, topology of the CRD and TMD showing disulfides (red lines) between cysteine residues (red circles). Highly conserved cysteines based on the difference conservation score are in bold red text. One A1′ module and two A1 modules are colored blue, green, and yellow, respectively, and one A1-like module is colored red. LP, linker peptide. E and F, cartoon representations showing close-up view of the boxed region in D. Cysteines and highly conserved residues in the CRD for T1R2–T1R3 co-expression are shown with sticks. Expression (E) and difference (F) conservation scores are mapped to T1R2; conservation scores are colored from ≤ −2 (conserved, orange) to ≥ +2 (blue).
With the exception of the GABAB receptor, class C GPCRs have nine strictly conserved cysteines in the CRD, and all nine were also conserved in our experimental deep mutational scans for T1R2 surface expression and dimerization (Fig. S10, A and B). However, sequence constraints were tighter for the cysteines during selection for T1R2–T1R3 co-expression, and this was most apparent for cysteine residues near the CRD C terminus. In particular, the last two cysteine residues of the CRD (Cys538 and Cys551) are highlighted in the difference conservation scores, indicating that the CRD C terminus must be properly structured for T1R2–T1R3 dimerization but less so for T1R2 surface expression alone (Fig. 6, A, E and F). Furthermore, ECL2 and three residues (Asn541, Phe552, and Arg554) at the CRD C terminus are also highlighted in the difference map as under greater conservation for dimerization. A structural model of the heterodimeric sweet taste receptor must account for why the bases of the CRD and ECL2 are conserved in the mutational scan, despite the fact that both these regions are solvent-exposed in crystal structures of the separate parts.
Model of T1R2–T1R3 dimerization
The deep mutational scans indicated interaction sites on LBD lobe 1 (site I), the CRD (sites II and III), and the TMD (site IV) for co-expression of T1R2 and T1R3 on the cell surface. The data are consistent with a conformation of the T1R2–ECD resembling the crystal structure of ligand-bound CaSR–ECDs, in which the CRDs are in close proximity with contacts mediated by sites I, II, and III. The data are also consistent with contacts between TM6 of the TMD as found earlier by cross-linking agonist-bound mGluR2 subunits, in addition to contacts mediated by the base of TM5 (collectively forming site IV) (37). A model was constructed of the human sweet taste receptor in a putative ligand-bound conformation by bringing together homology models of the individual domains in an arrangement that satisfies the experimental data (Fig. 7A and Fig. S11). Side-chain and backbone conformations were minimized using the ROSETTA energy function (43), followed by all-atom molecular dynamics (MD) in a lipid bilayer with explicit solvent. Distance restraints between conserved residues predicted to be at the dimer interface (Table S2–S4) maintained a pseudo-symmetric architecture. C-terminal peptides of G proteins were modeled bound to the TMDs for the purpose of forcing an active conformation; this is not to imply that the dimeric receptor trafficking in our experimental system is necessarily bound to G proteins, and actual G protein signaling occurs through a single TMD (44).
Figure 7.
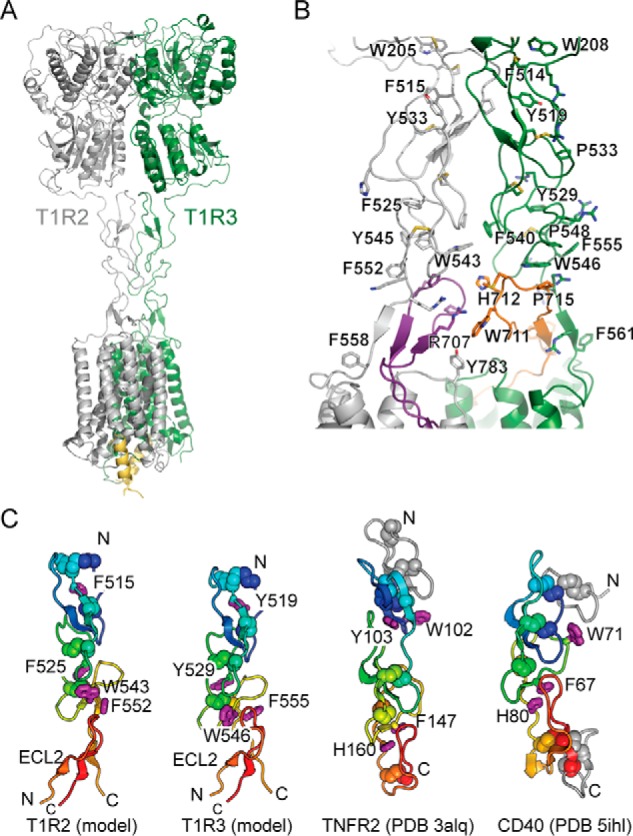
Model of the human sweet taste receptor. A, model of the full-length T1R2–T1R3 heterodimer. C-terminal 18-residue peptides of G proteins are shown in yellow and were included in the model to maintain the TMDs in active conformations during minimization. B, model of the dimerization interface between the CRDs of T1R2 (gray) and T1R3 (green). Cysteines and other key residues involved in stacking interactions are shown as sticks. ECL2 of T1R2 and T1R3 are purple and orange, respectively. C, comparison of CRD structures from the T1R2–T1R3 model to TNFR2 (46) and CD40 (47). Cysteines are shown as spheres, and key aromatic residues that mediate module stacking are shown as purple sticks. A shared structural fold is colored from the N terminus in blue to the C terminus in red, with additional structural elements in gray.
The model has three notable features. First, ECL2 and the linker peptide of the CRD form a fold that resembles an A1 module in distantly related cysteine-rich domains (Figs. 6D and 7, B and C) (45). This forms a continuous structure similar to the CRD of tumor necrosis factor receptor, in which aromatic residues mediate module stacking (Fig. 7C) (46, 47). Aromatic residues T1R2–Trp543 (highly conserved in both the mutational scan and natural evolution) and T1R2–Phe552 (conserved as an aromatic in the mutational scan) are exposed on the CRD surface but become partially buried by contacts to the ECL2 backbone and T1R2–Pro713 (tolerates hydrophobic substitutions in the mutational scan). Just as LBD lobe 2 and the CRD have two connections (the protein backbone and a disulfide), there are possibly two connections between the CRD and TMD (the protein backbone and the CRD–ECL2 folded structure) that ensure interdomain motions are coupled and not dissipated within flexible backbone linkers. Second, the two ECL2s contribute to the dimerization interface (Fig. 7B). As a result, the CRDs are stacked both within and between subunits through aromatic and proline residues and by aliphatic moieties of lysine and arginine side chains. This can account for the high conservation of the CRD C terminus in the deep mutational scan for co-expression with T1R3 (Fig. 6). Finally, our model predicts a “twisted” or “spiral” architecture of the domains around the central rotational axis (Fig. 7A). The model may account for how ligand-dependent translational motions of the CRDs are coupled to rotational motions of the TMDs (37) to reconfigure the transmembrane dimer interface (Fig. S11).
Discussion
Here, we identified important regions of human T1R2 for surface expression and co-trafficking with T1R3 using mutational screening and deep mutational scanning. These results guided the modeling and “visualization” of the full-length T1R2–T1R3 dimer in living cells. Our model provides insights into the general mechanism of class C GPCRs.
Many of the T1R2 clones isolated in our mutational screen for enhanced surface expression shared a S212N missense mutation, creating a new consensus N-glycosylation site within an accessible loop of lobe 2. Native N-glycosylation is required for surface expression of other class C GPCRs (21, 48–50). Notably, with only one exception, all putative N-glycosylation sites of T1R2 were also highly conserved for surface expression in the deep mutational scan.
The cytosolic C terminus of T1R2 modulates surface expression of the sweet taste receptor. Replacement of the TMDs and cytosolic tails of T1R2 or T1R3 with generic transmembrane helices increased surface expression, and although ECD interactions alone were sufficient, the native TMD and cytosolic tail of T1R2 were required for optimum co-trafficking. We further identified a dibasic motif in the cytosolic tail of T1R2 that inhibits plasma membrane localization. Mutation of the dibasic motif dramatically increased surface T1R2 but failed to substantially change T1R3 levels at the cell surface, suggesting monomeric or homodimeric T1R2 was now escaping intracellular retention. Dibasic motifs in cytosolic regions of membrane proteins can, in some cases, bind adaptors to drive retrograde translocation from the Golgi back to the ER, whereas the similar KX(D/E) motif can retain proteins in the Golgi (51, 52). This mechanism for intracellular retention is especially important for quality control of protein complexes (53), including the GABAB receptor (a heterodimer of GB1 and GB2), where the GB1 subunit has a C-terminal dibasic motif that becomes masked by formation of a coiled-coil with the cytosolic tail of GB2 (54). Human T1R2 also has a C-terminal dibasic trafficking motif (sequence RRD), yet when mutated, only a fraction of the protein escapes to the surface while much remains in the Golgi (Fig. S5). There is complexity in the trafficking mechanism of the sweet taste receptor that will require further study.
Based on a comprehensive mutational scan of T1R2 co-expressing with T1R3 on the cell surface, important interaction sites were identified that guided modeling of the full sweet taste receptor. The domain orientations are constrained by the mutational data in such a way as to bring ECL2 immediately below the last module of the CRD. In GPCRs generally, ECL2 is a critical determinant of ligand interactions (55, 56). ECL2 of class C GPCRs are similar in length (less than 35 residues), and the length of the linker peptide at the end of the CRD is also important for receptor activation and surface expression (57–59). Interaction of ECL2 with the CRD linker peptide was observed in the crystal structure of inactive mGluR1 TMD and was hypothesized to be important for activation (9, 36, 59), and we now predict ECL2–CRD interactions are important for dimerization. Further studies will be required to conclusively elucidate the role of ECL2 in dimerization and activation. It is also notable that the mutational scan clearly implicates TM6 and the base of TM5 at the dimer interface, as this region undergoes the most significant conformational change between resting and activated class A GPCRs (60).
The mutational scan reveals contacts between T1R2 and T1R3 that are consistent with a ligand-bound conformation trafficking to the cell surface. We showed that the WT and expression-enhanced sweet taste receptor used in this study are functional in HEK293 cells, but we failed to detect signaling by the sweet taste receptor in the Expi293F cell line, either by microscopy or flow cytometry, even when overexpressing promiscuous G proteins (positive controls with class A GPCRs showed robust responses). We speculate that due to the rich growth medium, the sweet taste receptor binds sugars or sugar derivatives in the ER shortly after synthesis and is desensitized. Low-glucose growth medium, which is used to prevent desensitization in other lines, was toxic to Expi293F cells. It is possible that in sensory neurons of the taste bud, a T1R2–T1R3 heterodimer in a resting conformation may instead traffic to microvilli at the taste pore. Despite this limitation of the experimental system, our results are nonetheless consistent with previous data, crystal structures, and natural evolution. We therefore argue that the dimerization surface we identify by mutational scanning in living cells is real.
Finally, late during revision of this manuscript, the cryo-EM structure of the class C GPCR mGluR5 in an active conformation was published (61). Our modeled architecture of the active sweet taste receptor, with a twisted arrangement of domains and contacts to the CRDs via ECL2 loops, perfectly matches the cryo-EM structure (Fig. S12). This highlights that our innovative use of mutational scans to accurately model proteins in living cells is valid and of high impact.
Although natural history of a protein sequence contains combined information on folding, ligand recognition, signaling, and conformational dynamics, in vitro evolution and deep mutational scanning can be focused on specific protein properties. Here, we focused selections on surface expression to identify residues important for subunit folding and complex assembly. Further deep mutational scans may offer additional insights into class C GPCR mechanisms and provide a structural basis for designing low-caloric sweeteners to address obesity and diabetes.
Experimental procedures
Construction of plasmids
The native sequence of human T1R2, a human codon-optimized sequence of human T1R3, and an Escherichia coli codon-optimized sequence of human T1R1 were synthesized as gene fragments (Integrated DNA Technologies). Based on flow cytometric analysis of transfected cells, we found no difference in expression of native or codon-optimized human T1R3 cDNA, but due to difficulties in amplifying the native sequence for PCR-based modifications, we chose to use codon-optimized T1R3 except for the experiment described in Fig. S1, where native T1R3 was used. The native signal peptides (amino acids 1–24, 1–21, and 1–20 for T1R1, T1R2, and T1R3, respectively) were replaced with the signal peptide of influenza hemagglutinin (HA) or of HLA class I histocompatibility antigen A-2 α chain (HLA). FLAG or c-Myc tags with short flexible linker sequences were inserted after the signal peptide. T1R1 WT and mutant constructs were cloned in pcDNA3.1(+) (ThermoFisher Scientific). T1R2 and T1R3 WT and mutant constructs were cloned in pCEP4 (Invitrogen) or pcDNA3.1(+). T1R1 and T1R3 were constructed with the HLA signal peptide followed by the c-Myc tag. T1R2 constructs were fused to the HA signal peptide followed by the FLAG tag, with the exception of Fig. S1, where T1R2 was fused downstream of a HLA signal peptide and FLAG or c-Myc tag.
Cell culture and transfection
Expi293FTM cells were cultured with Expi293TM expression medium (ThermoFisher Scientific) in a 37 °C incubator with humidified atmosphere of 8% CO2. For 1-ml transfections, up to 1 μg of plasmid DNA and 2.7 μl of ExpiFectamineTM 293 reagent (ThermoFisher Scientific) were prepared separately in 50 μl of OptiMEM (Gibco). After 5 min of incubation at room temperature, DNA and ExpiFectamineTM 293 reagent were mixed and further incubated for 30 min. Total 100 μl of DNA/ExpiFectamineTM 293 reagent mixture was added to 1 ml of 2 × 10⁶ cells.
Flow cytometry analysis of surface and total expression
Total 1 μg of DNA was transfected into 1 ml of 2 × 10⁶ cells as described above. 500 ng of T1R2, T1R3, or T1R1 was co-transfected with 500 ng of empty vector. For co-expression of T1R2 and T1R3, 500 ng of each DNA was co-transfected. Transfected cells were collected after 22–27 h by centrifugation at 500 × g for 1 min at room temperature. The cell pellet was resuspended in 800 μl of cold phosphate-buffered saline (PBS) containing 0.2% BSA (PBS/BSA). Cells were collected by centrifugation and resuspended in 300 μl of PBS/BSA. 3 μl of fixable viability dye eFluor 450 (eBioscience) was added to the cells and incubated for 30 min on ice in the dark. Cells were pelleted and resuspended in 800 μl of PBS/BSA. The cells were then split into two tubes for staining surface and whole-cell protein. For surface staining, cells were centrifuged and resuspended in 40 μl of PBS/BSA. 0.3-μl antibody was then added and incubated for 20 min on ice in the dark. Unless otherwise noted, anti-FLAG–Cy3 (Sigma; clone M2) and anti-c-Myc–Alexa Fluor 647 (Cell Signaling; clone 9B11) antibodies were used. Cells were washed twice with 800 μl of PBS/BSA, resuspended in 300 μl of PBS/BSA, and analyzed. BD Cytofix/CytoperTM Fixation/Permeabilization kit (BD Biosciences) was used for whole-cell protein staining. Cells were collected by centrifugation and resuspended in 250 μl of Fixation/Permeabilization solution for 20 min on ice in the dark. Cells were washed twice with 1 ml of 1× BD Perm/WashTM buffer or 0.5× PBS–BD Perm/WashTM buffer, and resuspended in 40 μl of wash buffer. 0.3 μl of antibody was then added and incubated for 30 min on ice in the dark. Cells were washed twice with 250 μl of wash buffer and resuspended in 250 μl of wash solution for analysis. Surface and total expression of T1R1, T1R2, and T1R3 were measured on a BD LSR II or BD AccuriTM C6 (BD Biosciences). The data were collected using BD FACSDiva software (BD Biosciences) and analyzed using FCS Express 6 (De Novo Software). Gates were set on negative controls with 0.5% of events falling within the gate, and the percentages of fluorescence-positive cells were calculated. Relative surface and total expression were normalized to WT.
Random mutagenesis library generation
T1R2 was mutagenized by error-prone PCR using goTaq (Promega), with an average error rate of two amino acid substitutions per 2.5-kb T1R2 gene. T1R2 PCR fragments were inserted into the pCEP4 vector using restriction and ligation methods. The T1R2 mutant library was transformed into 5-α electrocompetent E. coli cells (New England Biolabs) by electroporation. Transformed cells were collected after 1 h of incubation in S.O.C. medium at 37 °C, and 10 μl of serially diluted cells were plated to calculate the library size. Remaining cells were inoculated in 250 ml of LB medium and cultured overnight at 37 °C, and plasmid DNA was prepared using GeneJET plasmid maxiprep kit (ThermoFisher Scientific). The cDNA from sorted T1R2 mutant library-transfected Expi293F cells was similarly cloned into pCEP4, and plasmid DNA was purified as described above.
Sorting the T1R2 random mutagenesis library
30 ng of T1R2 mutant library and 60 μg of pUC18 carrier DNA were co-transfected into a 30-ml Expi293F culture. Medium was replaced 2 h post-transfection. Transfected cells were harvested 22 h post-transfection by centrifugation at 500 × g for 2 min at room temperature. The cell pellet was washed with 40 ml of PBS/BSA, resuspended in 4 ml of PBS/BSA containing 1/500 chicken anti-DYKDDDDK-FITC (Immunology Consultants Laboratory), and incubated for 30 min on ice in the dark. 40 ml of PBS/BSA was added to the cells, and unbound antibody was washed by centrifugation at 500 × g for 1 min at room temperature. The cells were washed twice more with 40 ml of PBS/BSA and resuspended in 4 ml of PBS/BSA for sorting. The 0.4% of cells with highest FITC signal were collected for 4 h on a BD FACS Aria II at the Roy J. Carver Biotechnology Center. Sorted cells were centrifuged at 500 × g for 2 min at 4 °C and stored at −80 °C for later RNA extraction.
RNA extraction and cDNA synthesis
Total RNA was extracted using GeneJET RNA purification kit (ThermoFisher Scientific). T1R2 cDNA fragments were synthesized from the extracted RNA by RT-PCR using AccuScript Hi-Fi (Agilent).
Reconstruction of sorted T1R2 random mutagenesis library after sorts
Because of inefficiencies of high-fidelity reverse transcription, full-length T1R2 DNA was not amplified from the cDNA. Instead, three separate fragments were amplified using Phusion (ThermoFisher Scientific). Fragment 1 was amplified from cDNA primed with an internal gene-specific primer (TGCAGCTTGTCCACAATGGT) using PCR primers pCEP4_MCS-F (GATCTCTAGAAGCTGGGTACC) and NativeR2_775_seqR (TGCAGCTTGTCCACAATGGT). Fragment 2 was amplified from cDNA primed with the EBV-reverse primer using PCR primers NativeR2_616_seqF (ATCATTGTGCTGGTGAGCAG) and natR2_1335_seqR (TGGACAATCTCCAAGTGCAGA). Fragment 3 DNA was amplified from cDNA primed with the EBV-reverse primer using PCR primers NativeR2_1275_seqF (GAAGGTCAACTTCACTCTCC) and pCEP4_MCS-R (CAATGTATCTTATCATGTCTGGATCC). The full-length product was then assembled from the fragments by overlap extension PCR and cloned into pCEP4 for a second round of sorting.
To reassemble the T1R2 library after the second round of sorting, fragment 2 was amplified using PCR primers natR2_691F_seqF (GACATCTGCATCGCCTTCCA) and natR2_1417_seqR (TGGATGTTCTTCAGCTGTCG). Fragments 1 and 3 were amplified as described above. The full-length DNA library was amplified and cloned into pCEP4 as described above.
Functional expression
HEK293 cells were kindly provided by Dr. Makoto Tominaga (Okazaki Institute for Integrative Bioscience). These cells were cultured at 37 °C under a humidified atmosphere containing 5% CO2 in Dulbecco's modified Eagle's medium (DMEM) supplemented with 10% fetal bovine serum (FBS). For calcium imaging experiments, cells were seeded onto a 35-mm recording chamber. After 24 h at 37 °C, plasmid DNAs were transiently co-transfected into HEK293 cells using Lipofectamine2000 reagent (Life Technologies, Inc.) (2.5 μl per 0.9 μg of DNA). T1R2 or R2FS1 was co-transfected with T1R3 and Gα16-gust44 using 0.9 μg of plasmids. Ca2+ imaging assays were performed 24 h after transfection.
Single-cell Ca2+ imaging
As described previously (62, 63), a bath perfusion system was used for determination of the kinetics of activation. Transfected cells in 35-mm recording chambers were washed in Hanks' balanced salt solution (HBSS) (Life Technologies, Inc.) containing 10 mm HEPES (pH 7.4) and loaded with 3 mm fluo-4 acetoxymethyl ester (Life Technologies, Inc.) for 30 min at 37 °C. Taste solutions diluted in HBSS containing 10 mm HEPES were applied sequentially to the cells for 30 s with a peristaltic pump at a flow rate of 1.5 ml/min, and fluorescence images were obtained using a S Fluor 620/0.75 objective lens (Nikon) via a cooled-CCD camera (C6790, Hamamatsu Photonics) fitted to a TE300 microscope (Nikon). AquaCosmos software (version 1.3, Hamamatsu Photonics) was used to acquire and analyze fluorescence images. A 5-min interval was maintained between each tastant application to ensure that the cells were not desensitized. Responses were measured from individual responding cells. Isoproterenol (Iso, 10 μm) was used as positive control, which stimulates endogenous β-adrenergic receptors, showing that the Gα16-dependent signal transduction cascade was functional. SC45647 (0.3 mm), aspartame (10 mm), and sodium cyclamate (30 mm) were used as sweet taste stimuli. Human-specific sweet receptor inhibitor lactisole (1 mm) and 6-n-propylthiouracil (PROP: T2R38 agonist) were used as negative controls.
Ca2+ imaging data analysis
In the analysis of single cell responses, changes in [Ca2+]i were monitored as changes in fluo-4 fluorescence. Fluorometric signals are expressed as relative fluorescence changes: ΔF/F0 = (F − F0)/F0, where F0 denotes the baseline fluorescence level. The magnitude of the calcium increases from 10 to 30 s after stimulus onset was measured and averaged.
SSM library generation
Expression-enhanced variant R2FS1 was used as the template. An internal XhoI site was silenced, and silent HindIII, Pfl23II, and XhoI sites were inserted by targeted mutagenesis. Three SSM libraries covering T1R2 residues 22–285 (ECD1 library), 286–549 (ECD2 library), and 550–936 (TMD library) were generated by overlap extension PCR (64) and ligated into the NheI-XhoI, HindIII-Pfl23II, and XhoI-BamHI sites of HA-FLAG-R2FS1 in pCPE4. The ligations were transformed into 5-α electrocompetent E. coli cells, and plasmid DNA was prepared as described above, ensuring the number of transformants was at least 10 times the possible library diversity. The three deep sequenced plasmid libraries covered 16,177 out of 16,300 possible single amino acid substitutions based on a minimum frequency of 5 × 10⁻⁶.
c-Myc–T1R3 stable cell line generation
HLA-c-Myc–T1R3 in pcDNA3.1(+) was linearized by restriction with PvuI. 4 μg of linearized DNA was transfected in 8 ml of Expi293F cells as described above. G418 was added 24 h post-transfection at 100 μg/ml. Cells were passaged, and medium supplemented with G418 was replaced every 2–3 days. The G418 concentration was reduced to 50 μg/ml 3 weeks post-transfection. T1R3-positive cells were enriched by FACS as described above with some changes. R2FS1 cloned in pcDNA3.1(+) was used as an indicator to select cells expressing T1R3; unlike pCEP4, pcDNA3.1(+) lacks the ability to replicate extra-chromosomally and therefore will be lost with passaging unless integrated into the genome. Cells were transfected with R2FS1 to promote surface trafficking of T1R3 and stained with anti-FLAG–FITC and anti-c-Myc–Alexa 647. Propidium iodide was added for gating and exclusion of dead cells. The top 8% of Alexa 647–positive cells were collected and recovered in fresh medium supplemented with penicillin–streptomycin.
Sorting T1R2 SSM libraries
Plasmid DNA libraries were transfected into T1R3 stable Expi293F cells using conditions that typically yield no more than one coding sequence per cell (40). 1 ng/ml library DNA and 1.5 μg/ml pCEP4-ΔCMV (in which the fragment between SalI sites of pCEP4 is removed) were transfected into T1R3 stable cells at 2 × 10⁶ cells/ml. Medium was replaced 2 h post-transfection, and cells were harvested 22–24 h post-transfection by centrifugation at 500 × g for 2 min at 4 °C. Cells were washed with 30 ml of PBS/BSA, and stained with 30 μl of anti-FLAG–Cy3 and anti-c-Myc–Alexa 647 in 4 ml of PBS/BSA for 30 min in the dark. Cells were washed twice with 30 ml of ice-cold PBS/BSA and resuspended in PBS/BSA for sorting on a BD FACS Aria II at the Roy J. Carver Biotechnology Center. Propidium iodide was added to the sample immediately prior to sorting, and dead cells were gated in the PE/Texas Red channel and excluded. Auto-fluorescent cells in the AmCyan channel were also removed during gating. The highest 55% (ECD1 and ECD2 libraries) and 100% (TMD library) of Cy3-positive cells were sorted for surface expression of T1R2. For co-trafficking of T1R3, the top 20% of APC-positive cells were sorted after gating 100 or 55% of Cy3-positive cells as just described. Sorted cells were collected and frozen at −80 °C. To maintain viability, prepared samples were sorted for no more than 4 h. Libraries were sorted on multiple occasions to collect greater numbers of cells, and the sorted cell pellets were pooled during RNA extraction.
Deep sequencing
RNA was extracted as described above. First-strand cDNA was synthesized with Accuscript using internal gene-specific primers to offset the poor efficiency of accurately reverse-transcribing long messages. For the ECD1 library, reverse transcription was primed with natT1R2_882_ECD1_R (AGTGAAGTTCTGGCGCAG); for the ECD2 library with natT1R2_1682_ECD2_R (CATTCCAGGAAGACCAGC); and for the TMD library with pCEP4_EBV_Rev (GTGGTTTGTCCAAACTCATC). In a first round of PCR (18 thermocycles), primer overhangs added sequences complementary to the Illumina sequencing primers, and then barcodes and adaptor sequences were added in a second round of PCR amplification (15 thermocycles) for annealing to the Illumina flow cell. Two overlapping fragments were amplified for both ECD1 and ECD2 libraries, and three overlapping fragments were amplified for the TMD library to achieve full sequencing coverage. PCR fragments were then sequenced at the University of Illinois at Urbana-Champaign Roy J. Carver Biotechnology Center on an Illumina HiSeq 2500 (2 × 250-nucleotide kit). Deep sequencing data were analyzed with Enrich (65). Normalized log2 enrichment ratios were calculated by subtracting the log2 enrichment of the WT sequence. Commands are available in the data deposition with NCBI's Gene Expression Omnibus (66) under series accession number GSE115751.
Estimating evolutionary conservation scores
Evolutionary conservation scores for amino acid positions of T1R2, T1R3, CaSR, mGluR1, and mGluR3 were calculated using the ConSurf server (67, 68). The search for homologs was based on the amino acid sequence of T1R2 TMD or on protein structures in other cases (69). Homologous sequences were searched using HMMER from UNIREF-90 with a number of iterations of 1 and E-value cutoff of 0.001. Orthologous sequences were manually selected for LBD of T1R2 (103 orthologous) and T1R3 (147 orthologous), ECD of CaS receptor (45 orthologous) and mGluR3 (59 orthologous), and TMD of T1R2 (132 orthologous) and mGluR1 (156 orthologous). The list of sequences used in each analysis is available upon request. Multiple sequence alignments were built using MAFFT–L-INS-I, and conservation scores were computed using Bayesian algorithm of substitution.
Structural modeling
The sequences of human T1R2 and T1R3 were threaded on the crystal structures of fish T1R2–T1R3 LBDs (PDB 5X2N), agonist-bound CaSR CRDs (PDB 5K5S), and mGluR1 TMD (PDB 4OR2). Loops with insertions/deletions were rebuilt in FoldIt (70), and the homology models were minimized by applying fast-relax using RosettaScripts (71). 18-Residue C-terminal peptides from GαS and gustducin were docked into the G protein–coupling sites of T1R2 and T1R3, respectively, based on alignment to the structure of GαS-bound β2-adrenergic receptor (β2AR, PDB 3SN6) (60). GαS was docked to T1R2 to make a favorable electrostatic contact to the otherwise buried charge of T1R2–Arg651; signaling by a putative sweet taste receptor through GαS has been observed in some cases (72), and the mutational scan showed high conservation in the G protein–coupling site, leading us to speculate an endogenous G protein might be bound to T1R2 in Expi293F cells. This forced an outward motion of TM6 during backbone minimization, analogous to the active GαS–β2AR crystal structure. The LBD and CRD models were assembled based on alignment to agonist-bound CaSR, and the TMDs were manually positioned so as to bury site IV identified in the mutational scans while maintaining pseudo-C2 symmetry. The full dimeric structure was fast-relaxed with coordinate restraints on all atoms, followed by fast-relax with distance constraints holding four of the most conserved T1R2 residues predicted to be at the dimer interface, and the equivalent T1R3 residues, in proximity of the central axis (Table S2). This prevented the extracellular domains “bending over” at flexible connections, thereby maintaining pseudo-C2 symmetry. The lowest energy ROSETTA model was chosen from 300 decoys.
The ROSETTA model was further relaxed by molecular dynamics (MD). The MD system was built using Tleap module in AMBER14 (73). The transmembrane domains were embedded in 1-palmitoyl-2-oleoyl-phosphatidylcholine lipid bilayer, and the full receptor was solvated using TIP3P water molecules (74). The MD system was neutralized using 0.15 m NaCl. The AMBERff14SB force field (75) was used for simulation, and the protonation states were assigned to the titratable residues at physiological pH 7. The final MD system contained ∼193,000 atoms. The MD system was subjected to minimization for 20,000 cycles and then heated at constant volume from 0 to 300 K over 3 ns. The system was equilibrated for 20 ns at constant pressure and temperature to 1 bar and 300 K. The backbone atoms of the receptor dimer were restrained with a force constant of 10 kcal/mol/Å2 during the minimization, heating, and equilibration protocol. The hydrogen bonds were constrained using SHAKE algorithm (76), and the long-range electrostatics were treated with Particle Mesh Ewald method (77). The nonbonded interaction cutoff was set to 10 Å, and the integration time step was 2 fs. The final productions runs were performed over a period of 50 ns. During the productions runs, the combination of relaxation protocols was applied over the length of the simulation time. For the initial 10 ns, the Cα atoms of all protein residues were restrained. For the next 10 ns, the Cα atoms of residues at the domain interface were restrained (Table S3). Finally, distance restraints were applied for 30 ns between a small subset of residues at the domain interface (Table S4). A force constant of 20 kcal/mol/Å2 was used in the production runs. The root mean square deviation (RMSD) plots of extracellular and transmembrane domains (Fig. S11E) show that the structures are converged with a mean RMSD of 2.5 Å. The flexible cysteine-rich loop regions are excluded from the RMSD analysis.
Confocal microscopy
HEK293T cells were seeded onto μ-slide 8-well (ibidi) at least a day before transfection and cultured with DMEM supplemented with 10% FBS at 37 °C with 5% CO2. 50–60% confluent cells were transfected. 300 ng of plasmid DNA and 0.9 ng of linear polyethyleneimine (Polyscience, Mr 250,000) were mixed in 30 μl of OptiMEM and incubated for 20 min at room temperature. The DNA/polyethyleneimine mixture was added to a well. Cells were washed with PBS after 24 h, fixed, and permeabilized with the Fixation/Permeabilization solution of BD Cytofix/CytoperTM Fixation/Permeabilization kit for 20 min. Cells were further washed and incubated with BD Perm/WashTM buffer for 15 min. Cells were then incubated with anti-FLAG–Cy3 (1:200) and anti-GM130–Alexa Fluor 488 (ThermoFisher Scientific, 1:400) or anti-calnexin–Alexa Fluor 488 (ThermoFisher Scientific, 1:200) for 1 h in the dark. Cells were washed three times with PBS. Images were collected on Zeiss LSM 700 (Carl Zeiss) using ×63 oil-immersion objective. The collected images were processed using Fiji (ImageJ).
Data and plasmid availability
Raw deep sequencing data and calculated enrichment ratios are deposited with NCBI's Gene Expression Omnibus (66) under series accession number GSE115751. Plasmids have been deposited with Addgene under accession numbers 113944–113962. Structure coordinates are available upon request.3
Author contributions
J. P. and E. P. conceptualization; J. P., K. S., N. S., and E. P. formal analysis; J. P., B. S., K. S., and N. S. investigation; J. P., B. S., D. S., and E. P. methodology; J. P. writing-original draft; B. S., D. S., and E. P. writing-review and editing; K. S., D. S. and E. P. supervision; D. S. and E. P. project administration; E. P. and K. S. funding acquisition.
Supplementary Material
Acknowledgments
Barbara Pilas, Barbara Balhan, and Angela Kouris at the University of Illinois at Urbana-Champaign Roy J. Carver Biotechnology Center assisted with flow cytometry and Alvaro Hernandez and Chris Wright helped with deep sequencing.
This work was supported in part by National Institutes of Health NIMH Award R21MH113155 (to E. P.) for development of deep mutational scanning in human cells and in part by JSPS KAKENHI Grant JP18K09523 (to K. S.). The authors declare that they have no conflicts of interest with the contents of this article. The content is solely the responsibility of the authors and does not necessarily represent the official views of the National Institutes of Health.
This article contains Figs. S1–S12 and Tables S1–S4.
Data were deposited in NCBI's Gene Expression Omnibus under accession number GSE115751.
Please note that the JBC is not responsible for the long-term archiving and maintenance of this site or any other third party hosted site.
- T1R2
- taste 1 receptor member 2
- T1R3
- taste 1 receptor member 3
- GPCR
- G protein–coupled receptor
- mGluR
- metabotropic glutamate receptor
- GABABR
- γ-aminobutyric acid type B receptor
- CaSR
- calcium-sensing receptor
- ECD
- extracellular domain
- TMD
- transmembrane domain
- LBD
- ligand-binding domain
- CRD
- cysteine-rich domain
- TM and H
- transmembrane helix
- SSM
- site-saturation mutagenesis
- ECL2
- second extracellular loop
- MD
- molecular dynamics
- ER
- endoplasmic reticulum
- HA
- influenza hemagglutinin
- HLA
- human leukocyte antigen
- HBSS
- Hanks' balanced salt solution
- DMEM
- Dulbecco's modified Eagle's medium
- FBS
- fetal bovine serum
- RMSD
- root mean square deviation
- Asp
- aspartame
- SC
- SC45647
- Cyc
- cyclamate
- PROP
- 6-n-propylthiouracil
- Iso
- isoproterenol
- PDB
- Protein Data Bank
- MHC
- major histocompatibility complex
- EBV
- Epstein-Barr virus
- β2AR
- β2-adrenergic receptor.
References
- 1. Nelson G., Hoon M. A., Chandrashekar J., Zhang Y., Ryba N. J., and Zuker C. S. (2001) Mammalian sweet taste receptors. Cell 106, 381–390 10.1016/S0092-8674(01)00451-2 [DOI] [PubMed] [Google Scholar]
- 2. Li X., Staszewski L., Xu H., Durick K., Zoller M., and Adler E. (2002) Human receptors for sweet and umami taste. Proc. Natl. Acad. Sci. U.S.A. 99, 4692–4696 10.1073/pnas.072090199 [DOI] [PMC free article] [PubMed] [Google Scholar]
- 3. Jiang P., Cui M., Zhao B., Liu Z., Snyder L. A., Benard L. M., Osman R., Margolskee R. F., and Max M. (2005) Lactisole interacts with the transmembrane domains of human T1R3 to inhibit sweet taste. J. Biol. Chem. 280, 15238–15246 10.1074/jbc.M414287200 [DOI] [PubMed] [Google Scholar]
- 4. Koizumi A., Nakajima K., Asakura T., Morita Y., Ito K., Shmizu-Ibuka A., Misaka T., and Abe K. (2007) Taste-modifying sweet protein, neoculin, is received at human T1R3 amino-terminal domain. Biochem. Biophys. Res. Commun. 358, 585–589 10.1016/j.bbrc.2007.04.171 [DOI] [PubMed] [Google Scholar]
- 5. Shi P., and Zhang J. (2006) Contrasting modes of evolution between vertebrate sweet/umami receptor genes and bitter receptor genes. Mol. Biol. Evol. 23, 292–300 10.1093/molbev/msj028 [DOI] [PubMed] [Google Scholar]
- 6. Xu H., Staszewski L., Tang H., Adler E., Zoller M., and Li X. (2004) Different functional roles of T1R subunits in the heteromeric taste receptors. Proc. Natl. Acad. Sci. U.S.A. 101, 14258–14263 10.1073/pnas.0404384101 [DOI] [PMC free article] [PubMed] [Google Scholar]
- 7. Chun L., Zhang W. H., and Liu J. F. (2012) Structure and ligand recognition of class C GPCRs. Acta Pharmacol. Sin. 33, 312–323 10.1038/aps.2011.186 [DOI] [PMC free article] [PubMed] [Google Scholar]
- 8. Leach K., and Gregory K. J. (2017) Molecular insights into allosteric modulation of Class C G protein-coupled receptors. Pharmacol. Res. 116, 105–118 10.1016/j.phrs.2016.12.006 [DOI] [PubMed] [Google Scholar]
- 9. Chéron J. B., Golebiowski J., Antonczak S., and Fiorucci S. (2017) The anatomy of mammalian sweet taste receptors. Proteins 85, 332–341 10.1002/prot.25228 [DOI] [PubMed] [Google Scholar]
- 10. Jiang P., Cui M., Zhao B., Snyder L. A., Benard L. M., Osman R., Max M., and Margolskee R. F. (2005) Identification of the cyclamate interaction site within the transmembrane domain of the human sweet taste receptor subunit T1R3. J. Biol. Chem. 280, 34296–34305 10.1074/jbc.M505255200 [DOI] [PubMed] [Google Scholar]
- 11. Jiang P., Ji Q., Liu Z., Snyder L. A., Benard L. M., Margolskee R. F., and Max M. (2004) The cysteine-rich region of T1R3 determines responses to intensely sweet proteins. J. Biol. Chem. 279, 45068–45075 10.1074/jbc.M406779200 [DOI] [PubMed] [Google Scholar]
- 12. Koizumi T., Terada T., Nakajima K., Kojima M., Koshiba S., Matsumura Y., Kaneda K., Asakura T., Shimizu-Ibuka A., Abe K., and Misaka T. (2015) Identification of key neoculin residues responsible for the binding and activation of the sweet taste receptor. Sci. Rep. 5, 12947 10.1038/srep12947 [DOI] [PMC free article] [PubMed] [Google Scholar]
- 13. Maillet E. L., Cui M., Jiang P., Mezei M., Hecht E., Quijada J., Margolskee R. F., Osman R., and Max M. (2015) Characterization of the binding site of aspartame in the human sweet taste receptor. Chem. Senses 40, 577–586 10.1093/chemse/bjv045 [DOI] [PMC free article] [PubMed] [Google Scholar]
- 14. Morini G., Bassoli A., and Temussi P. A. (2005) From small sweeteners to sweet proteins: anatomy of the binding sites of the human T1R2_T1R3 receptor. J. Med. Chem. 48, 5520–5529 10.1021/jm0503345 [DOI] [PubMed] [Google Scholar]
- 15. Nie Y., Vigues S., Hobbs J. R., Conn G. L., and Munger S. D. (2005) Distinct contributions of T1R2 and T1R3 taste receptor subunits to the detection of sweet stimuli. Curr. Biol. 15, 1948–1952 10.1016/j.cub.2005.09.037 [DOI] [PubMed] [Google Scholar]
- 16. Temussi P. A. (2002) Why are sweet proteins sweet? Interaction of brazzein, monellin and thaumatin with the T1R2–T1R3 receptor. FEBS Lett. 526, 1–4 10.1016/S0014-5793(02)03155-1 [DOI] [PubMed] [Google Scholar]
- 17. Walters D. E., and Hellekant G. (2006) Interactions of the sweet protein brazzein with the sweet taste receptor. J. Agric. Food Chem. 54, 10129–10133 10.1021/jf062359y [DOI] [PMC free article] [PubMed] [Google Scholar]
- 18. Winnig M., Bufe B., Kratochwil N. A., Slack J. P., and Meyerhof W. (2007) The binding site for neohesperidin dihydrochalcone at the human sweet taste receptor. BMC Struct. Biol. 7, 66 10.1186/1472-6807-7-66 [DOI] [PMC free article] [PubMed] [Google Scholar]
- 19. El Moustaine D., Granier S., Doumazane E., Scholler P., Rahmeh R., Bron P., Mouillac B., Banères J. L., Rondard P., and Pin J. P. (2012) Distinct roles of metabotropic glutamate receptor dimerization in agonist activation and G-protein coupling. Proc. Natl. Acad. Sci. U.S.A. 109, 16342–16347 10.1073/pnas.1205838109 [DOI] [PMC free article] [PubMed] [Google Scholar]
- 20. Geng Y., Bush M., Mosyak L., Wang F., and Fan Q. R. (2013) Structural mechanism of ligand activation in human GABAB receptor. Nature 504, 254–259 10.1038/nature12725 [DOI] [PMC free article] [PubMed] [Google Scholar]
- 21. Geng Y., Mosyak L., Kurinov I., Zuo H., Sturchler E., Cheng T. C., Subramanyam P., Brown A. P., Brennan S. C., Mun H. C., Bush M., Chen Y., Nguyen T. X., Cao B., Chang D. D., et al. (2016) Structural mechanism of ligand activation in human calcium-sensing receptor. Elife 5, e13662 10.7554/eLife.13662 [DOI] [PMC free article] [PubMed] [Google Scholar]
- 22. Kunishima N., Shimada Y., Tsuji Y., Sato T., Yamamoto M., Kumasaka T., Nakanishi S., Jingami H., and Morikawa K. (2000) Structural basis of glutamate recognition by a dimeric metabotropic glutamate receptor. Nature 407, 971–977 10.1038/35039564 [DOI] [PubMed] [Google Scholar]
- 23. Levitz J., Habrian C., Bharill S., Fu Z., Vafabakhsh R., and Isacoff E. Y. (2016) Mechanism of assembly and cooperativity of homomeric and heteromeric metabotropic glutamate receptors. Neuron 92, 143–159 10.1016/j.neuron.2016.08.036 [DOI] [PMC free article] [PubMed] [Google Scholar]
- 24. Muto T., Tsuchiya D., Morikawa K., and Jingami H. (2007) Structures of the extracellular regions of the group II/III metabotropic glutamate receptors. Proc. Natl. Acad. Sci. U.S.A. 104, 3759–3764 10.1073/pnas.0611577104 [DOI] [PMC free article] [PubMed] [Google Scholar]
- 25. Nuemket N., Yasui N., Kusakabe Y., Nomura Y., Atsumi N., Akiyama S., Nango E., Kato Y., Kaneko M. K., Takagi J., Hosotani M., and Yamashita A. (2017) Structural basis for perception of diverse chemical substances by T1r taste receptors. Nat. Commun. 8, 15530 10.1038/ncomms15530 [DOI] [PMC free article] [PubMed] [Google Scholar]
- 26. Tsuchiya D., Kunishima N., Kamiya N., Jingami H., and Morikawa K. (2002) Structural views of the ligand-binding cores of a metabotropic glutamate receptor complexed with an antagonist and both glutamate and Gd3+. Proc. Natl. Acad. Sci. U.S.A. 99, 2660–2665 10.1073/pnas.052708599 [DOI] [PMC free article] [PubMed] [Google Scholar]
- 27. Zhang C., Zhang T., Zou J., Miller C. L., Gorkhali R., Yang J. Y., Schilmiller A., Wang S., Huang K., Brown E. M., Moremen K. W., Hu J., and Yang J. J. (2016) Structural basis for regulation of human calcium-sensing receptor by magnesium ions and an unexpected tryptophan derivative co-agonist. Sci. Adv. 2, e1600241 10.1126/sciadv.1600241 [DOI] [PMC free article] [PubMed] [Google Scholar]
- 28. Doumazane E., Scholler P., Fabre L., Zwier J. M., Trinquet E., Pin J. P., and Rondard P. (2013) Illuminating the activation mechanisms and allosteric properties of metabotropic glutamate receptors. Proc. Natl. Acad. Sci. U.S.A. 110, E1416–E1425 10.1073/pnas.1215615110 [DOI] [PMC free article] [PubMed] [Google Scholar]
- 29. Huang S., Cao J., Jiang M., Labesse G., Liu J., Pin J. P., and Rondard P. (2011) Interdomain movements in metabotropic glutamate receptor activation. Proc. Natl. Acad. Sci. U.S.A. 108, 15480–15485 10.1073/pnas.1107775108 [DOI] [PMC free article] [PubMed] [Google Scholar]
- 30. Kniazeff J., Bessis A. S., Maurel D., Ansanay H., Prézeau L., and Pin J. P. (2004) Closed state of both binding domains of homodimeric mGlu receptors is required for full activity. Nat. Struct. Mol. Biol. 11, 706–713 10.1038/nsmb794 [DOI] [PubMed] [Google Scholar]
- 31. Nango E., Akiyama S., Maki-Yonekura S., Ashikawa Y., Kusakabe Y., Krayukhina E., Maruno T., Uchiyama S., Nuemket N., Yonekura K., Shimizu M., Atsumi N., Yasui N., Hikima T., Yamamoto M., et al. (2016) Taste substance binding elicits conformational change of taste receptor T1r heterodimer extracellular domains. Sci. Rep. 6, 25745 10.1038/srep25745 [DOI] [PMC free article] [PubMed] [Google Scholar]
- 32. Olofsson L., Felekyan S., Doumazane E., Scholler P., Fabre L., Zwier J. M., Rondard P., Seidel C. A., Pin J. P., and Margeat E. (2014) Fine tuning of sub-millisecond conformational dynamics controls metabotropic glutamate receptors agonist efficacy. Nat. Commun. 5, 5206 10.1038/ncomms6206 [DOI] [PubMed] [Google Scholar]
- 33. Vafabakhsh R., Levitz J., and Isacoff E. Y. (2015) Conformational dynamics of a class C G-protein-coupled receptor. Nature 524, 497–501 10.1038/nature14679 [DOI] [PMC free article] [PubMed] [Google Scholar]
- 34. Christopher J. A., Aves S. J., Bennett K. A., Doré A. S., Errey J. C., Jazayeri A., Marshall F. H., Okrasa K., Serrano-Vega M. J., Tehan B. G., Wiggin G. R., and Congreve M. (2015) Fragment and structure-based drug discovery for a class C GPCR: discovery of the mGlu5 negative allosteric modulator HTL14242 (3-chloro-5-[6-(5-fluoropyridin-2-yl)pyrimidin-4-yl]benzonitrile). J. Med. Chem. 58, 6653–6664 10.1021/acs.jmedchem.5b00892 [DOI] [PubMed] [Google Scholar]
- 35. Doré A. S., Okrasa K., Patel J. C., Serrano-Vega M., Bennett K., Cooke R. M., Errey J. C., Jazayeri A., Khan S., Tehan B., Weir M., Wiggin G. R., and Marshall F. H. (2014) Structure of class C GPCR metabotropic glutamate receptor 5 transmembrane domain. Nature 511, 557–562 10.1038/nature13396 [DOI] [PubMed] [Google Scholar]
- 36. Wu H., Wang C., Gregory K. J., Han G. W., Cho H. P., Xia Y., Niswender C. M., Katritch V., Meiler J., Cherezov V., Conn P. J., and Stevens R. C. (2014) Structure of a class C GPCR metabotropic glutamate receptor 1 bound to an allosteric modulator. Science 344, 58–64 10.1126/science.1249489 [DOI] [PMC free article] [PubMed] [Google Scholar]
- 37. Xue L., Rovira X., Scholler P., Zhao H., Liu J., Pin J. P., and Rondard P. (2015) Major ligand-induced rearrangement of the heptahelical domain interface in a GPCR dimer. Nat. Chem. Biol. 11, 134–140 10.1038/nchembio.1711 [DOI] [PubMed] [Google Scholar]
- 38. Ashikawa Y., Ihara M., Matsuura N., Fukunaga Y., Kusakabe Y., and Yamashita A. (2011) GFP-based evaluation system of recombinant expression through the secretory pathway in insect cells and its application to the extracellular domains of class C GPCRs. Protein Sci. 20, 1720–1734 10.1002/pro.707 [DOI] [PMC free article] [PubMed] [Google Scholar]
- 39. Shimizu M., Goto M., Kawai T., Yamashita A., and Kusakabe Y. (2014) Distinct human and mouse membrane trafficking systems for sweet taste receptors T1r2 and T1r3. PLoS ONE 9, e100425 10.1371/journal.pone.0100425 [DOI] [PMC free article] [PubMed] [Google Scholar]
- 40. Heredia J. D., Park J., Brubaker R. J., Szymanski S. K., Gill K. S., and Procko E. (2018) Mapping interaction sites on human chemokine receptors by deep mutational scanning. J. Immunol. 200, 3825–3839 10.4049/jimmunol.1800343 [DOI] [PMC free article] [PubMed] [Google Scholar]
- 41. Vagin O., Kraut J. A., and Sachs G. (2009) Role of N-glycosylation in trafficking of apical membrane proteins in epithelia. Am. J. Physiol. Renal Physiol. 296, F459–F469 10.1152/ajprenal.90340.2008 [DOI] [PMC free article] [PubMed] [Google Scholar]
- 42. Araya C. L., and Fowler D. M. (2011) Deep mutational scanning: assessing protein function on a massive scale. Trends Biotechnol. 29, 435–442 10.1016/j.tibtech.2011.04.003 [DOI] [PMC free article] [PubMed] [Google Scholar]
- 43. Leaver-Fay A., Tyka M., Lewis S. M., Lange O. F., Thompson J., Jacak R., Kaufman K., Renfrew P. D., Smith C. A., Sheffler W., Davis I. W., Cooper S., Treuille A., Mandell D. J., Richter F., et al. (2011) ROSETTA3: an object-oriented software suite for the simulation and design of macromolecules. Methods Enzymol. 487, 545–574 10.1016/B978-0-12-381270-4.00019-6 [DOI] [PMC free article] [PubMed] [Google Scholar]
- 44. Hlavackova V., Goudet C., Kniazeff J., Zikova A., Maurel D., Vol C., Trojanova J., Prézeau L., Pin J. P., and Blahos J. (2005) Evidence for a single heptahelical domain being turned on upon activation of a dimeric GPCR. EMBO J. 24, 499–509 10.1038/sj.emboj.7600557 [DOI] [PMC free article] [PubMed] [Google Scholar]
- 45. Bodmer J. L., Schneider P., and Tschopp J. (2002) The molecular architecture of the TNF superfamily. Trends Biochem. Sci. 27, 19–26 10.1016/S0968-0004(01)01995-8 [DOI] [PubMed] [Google Scholar]
- 46. Mukai Y., Nakamura T., Yoshikawa M., Yoshioka Y., Tsunoda S., Nakagawa S., Yamagata Y., and Tsutsumi Y. (2010) Solution of the structure of the TNF–TNFR2 complex. Sci. Signal. 3, ra83 [DOI] [PubMed] [Google Scholar]
- 47. Yamniuk A. P., Suri A., Krystek S. R., Tamura J., Ramamurthy V., Kuhn R., Carroll K., Fleener C., Ryseck R., Cheng L., An Y., Drew P., Grant S., Suchard S. J., Nadler S. G., et al. (2016) Functional antagonism of human CD40 achieved by targeting a unique species-specific epitope. J. Mol. Biol. 428, 2860–2879 10.1016/j.jmb.2016.05.014 [DOI] [PubMed] [Google Scholar]
- 48. Nasrallah C., Rottier K., Marcellin R., Compan V., Font J., Llebaria A., Pin J. P., Banères J. L., and Lebon G. (2018) Direct coupling of detergent purified human mGlu5 receptor to the heterotrimeric G proteins Gq and Gs. Sci. Rep. 8, 4407 10.1038/s41598-018-22729-4 [DOI] [PMC free article] [PubMed] [Google Scholar]
- 49. Nørskov-Lauritsen L., Jørgensen S., and Bräuner-Osborne H. (2015) N-Glycosylation and disulfide bonding affects GPRC6A receptor expression, function, and dimerization. FEBS Lett. 589, 588–597 10.1016/j.febslet.2015.01.019 [DOI] [PubMed] [Google Scholar]
- 50. Ray K., Clapp P., Goldsmith P. K., and Spiegel A. M. (1998) Identification of the sites of N-linked glycosylation on the human calcium receptor and assessment of their role in cell surface expression and signal transduction. J. Biol. Chem. 273, 34558–34567 10.1074/jbc.273.51.34558 [DOI] [PubMed] [Google Scholar]
- 51. Teasdale R. D., and Jackson M. R. (1996) Signal-mediated sorting of membrane proteins between the endoplasmic reticulum and the Golgi apparatus. Annu. Rev. Cell Dev. Biol. 12, 27–54 10.1146/annurev.cellbio.12.1.27 [DOI] [PubMed] [Google Scholar]
- 52. Woo C. H., Gao C., Yu P., Tu L., Meng Z., Banfield D. K., Yao X., and Jiang L. (2015) Conserved function of the lysine-based KXD/E motif in Golgi retention for endomembrane proteins among different organisms. Mol. Biol. Cell 26, 4280–4293 10.1091/mbc.e15-06-0361 [DOI] [PMC free article] [PubMed] [Google Scholar]
- 53. Nufer O., and Hauri H.-P. (2003) ER export: call 14-3-3. Curr. Biol. 13, R391–R393 10.1016/S0960-9822(03)00318-X [DOI] [PubMed] [Google Scholar]
- 54. Margeta-Mitrovic M., Jan Y. N., and Jan L. Y. (2000) A trafficking checkpoint controls GABA(B) receptor heterodimerization. Neuron 27, 97–106 10.1016/S0896-6273(00)00012-X [DOI] [PubMed] [Google Scholar]
- 55. Cvicek V., Goddard W. A. 3rd, Abrol R. (2016) Structure-based sequence alignment of the transmembrane domains of all human GPCRs: phylogenetic, structural and functional implications. PLoS Comput. Biol. 12, e1004805 10.1371/journal.pcbi.1004805 [DOI] [PMC free article] [PubMed] [Google Scholar]
- 56. Gacasan S. B., Baker D. L., and Parrill A. L. (2017) G protein-coupled receptors: the evolution of structural insight. AIMS Biophys. 4, 491–527 10.3934/biophy.2017.3.491 [DOI] [PMC free article] [PubMed] [Google Scholar]
- 57. Margeta-Mitrovic M., Jan Y. N., and Jan L. Y. (2001) Ligand-induced signal transduction within heterodimeric GABA(B) receptor. Proc. Natl. Acad. Sci. U.S.A. 98, 14643–14648 10.1073/pnas.251554798 [DOI] [PMC free article] [PubMed] [Google Scholar]
- 58. Ray K., Adipietro K. A., Chen C., and Northup J. K. (2007) Elucidation of the role of peptide linker in calcium-sensing receptor activation process. J. Biol. Chem. 282, 5310–5317 10.1074/jbc.M609610200 [DOI] [PubMed] [Google Scholar]
- 59. Zhang X. C., Liu J., and Jiang D. (2014) Why is dimerization essential for class-C GPCR function? New insights from mGluR1 crystal structure analysis. Protein Cell 5, 492–495 10.1007/s13238-014-0062-z [DOI] [PMC free article] [PubMed] [Google Scholar]
- 60. Rasmussen S. G., DeVree B. T., Zou Y., Kruse A. C., Chung K. Y., Kobilka T. S., Thian F. S., Chae P. S., Pardon E., Calinski D., Mathiesen J. M., Shah S. T., Lyons J. A., Caffrey M., Gellman S. H., et al. (2011) Crystal structure of the β2 adrenergic receptor–Gs protein complex. Nature 477, 549–555 10.1038/nature10361 [DOI] [PMC free article] [PubMed] [Google Scholar]
- 61. Koehl A., Hu H., Feng D., Sun B., Zhang Y., Robertson M. J., Chu M., Kobilka T., Laermans T., Steyaert J., Tarrasch J., Dutta S., Fonseca R., Weis W. I., Mathiesen J. M., et al. (2019) Structural insights into the activation of metabotropic glutamate receptors. Nature 566, 79–84 10.1038/s41586-019-0881-4 [DOI] [PMC free article] [PubMed] [Google Scholar]
- 62. Sanematsu K., Kitagawa M., Yoshida R., Nirasawa S., Shigemura N., and Ninomiya Y. (2016) Intracellular acidification is required for full activation of the sweet taste receptor by miraculin. Sci. Rep. 6, 22807 10.1038/srep22807 [DOI] [PMC free article] [PubMed] [Google Scholar]
- 63. Sanematsu K., Kusakabe Y., Shigemura N., Hirokawa T., Nakamura S., Imoto T., and Ninomiya Y. (2014) Molecular mechanisms for sweet-suppressing effect of gymnemic acids. J. Biol. Chem. 289, 25711–25720 10.1074/jbc.M114.560409 [DOI] [PMC free article] [PubMed] [Google Scholar]
- 64. Procko E., Hedman R., Hamilton K., Seetharaman J., Fleishman S. J., Su M., Aramini J., Kornhaber G., Hunt J. F., Tong L., Montelione G. T., and Baker D. (2013) Computational design of a protein-based enzyme inhibitor. J. Mol. Biol. 425, 3563–3575 10.1016/j.jmb.2013.06.035 [DOI] [PMC free article] [PubMed] [Google Scholar]
- 65. Fowler D. M., Araya C. L., Gerard W., and Fields S. (2011) Enrich: software for analysis of protein function by enrichment and depletion of variants. Bioinformatics 27, 3430–3431 10.1093/bioinformatics/btr577 [DOI] [PMC free article] [PubMed] [Google Scholar]
- 66. Edgar R., Domrachev M., and Lash A. E. (2002) Gene expression omnibus: NCBI gene expression and hybridization array data repository. Nucleic Acids Res. 30, 207–210 10.1093/nar/30.1.207 [DOI] [PMC free article] [PubMed] [Google Scholar]
- 67. Ashkenazy H., Erez E., Martz E., Pupko T., and Ben-Tal N. (2010) ConSurf 2010: calculating evolutionary conservation in sequence and structure of proteins and nucleic acids. Nucleic Acids Res. 38, W529–W533 10.1093/nar/gkq399 [DOI] [PMC free article] [PubMed] [Google Scholar]
- 68. Celniker G., Nimrod G., Ashkenazy H., Glaser F., Martz E., Mayrose I., Pupko T., and Ben-Tal N. (2013) ConSurf: using evolutionary data to raise testable hypotheses about protein function. Israel J. Chem. 53, 199–206 10.1002/ijch.201200096 [DOI] [Google Scholar]
- 69. Landau M., Mayrose I., Rosenberg Y., Glaser F., Martz E., Pupko T., and Ben-Tal N. (2005) ConSurf 2005: the projection of evolutionary conservation scores of residues on protein structures. Nucleic Acids Res. 33, W299–W302 10.1093/nar/gki370 [DOI] [PMC free article] [PubMed] [Google Scholar]
- 70. Kleffner R., Flatten J., Leaver-Fay A., Baker D., Siegel J. B., Khatib F., and Cooper S. (2017) Foldit Standalone: a video game-derived protein structure manipulation interface using Rosetta. Bioinformatics 33, 2765–2767 10.1093/bioinformatics/btx283 [DOI] [PMC free article] [PubMed] [Google Scholar]
- 71. Fleishman S. J., Leaver-Fay A., Corn J. E., Strauch E. M., Khare S. D., Koga N., Ashworth J., Murphy P., Richter F., Lemmon G., Meiler J., and Baker D. (2011) RosettaScripts: a scripting language interface to the Rosetta macromolecular modeling suite. PLoS ONE 6, e20161 10.1371/journal.pone.0020161 [DOI] [PMC free article] [PubMed] [Google Scholar]
- 72. Masubuchi Y., Nakagawa Y., Ma J., Sasaki T., Kitamura T., Yamamoto Y., Kurose H., Kojima I., and Shibata H. (2013) A novel regulatory function of sweet taste-sensing receptor in adipogenic differentiation of 3T3-L1 cells. PLoS ONE 8, e54500 10.1371/journal.pone.0054500 [DOI] [PMC free article] [PubMed] [Google Scholar]
- 73. Case D. A., Babin V., Berryman J. T., Betz R. M., Cai Q., Cerutti D. S., Cheatham T. E., Darden T. A., Duke R. E., Gohlke H., Goetz A. W., Gusarov S., Homeyer N., Janowski P., Kaus J., et al. (2014) AMBER 14. University of California, San Francisco [Google Scholar]
- 74. Jorgensen W. L., Chandrasekhar J., Madura J. D., Impey R. W., and Klein M. L. (1983) Comparison of simple potential functions for simulating liquid water. J. Chem. Phys. 79, 926–935 10.1063/1.445869 [DOI] [Google Scholar]
- 75. Maier J. A., Martinez C., Kasavajhala K., Wickstrom L., Hauser K. E., and Simmerling C. (2015) ff14SB: improving the accuracy of protein side chain and backbone parameters from ff99SB. J. Chem. Theory. Comput. 11, 3696–3713 10.1021/acs.jctc.5b00255 [DOI] [PMC free article] [PubMed] [Google Scholar]
- 76. Ryckaert J. P., Ciccotti G., and Berendsen H. J. C. (1977) Numerical integration of cartesian equations of motion of a system with constraints–Molecular-dynamics of N-alkanes. J. Comput. Phys. 23, 327–341 10.1016/0021-9991(77)90098-5 [DOI] [Google Scholar]
- 77. Essmann U., Perera L., Berkowitz M. L., Darden T., Lee H., and Pedersen L. G. (1995) A smooth particle mesh Ewald method. J. Chem. Phys. 103, 8577–8593 10.1063/1.470117 [DOI] [Google Scholar]
Associated Data
This section collects any data citations, data availability statements, or supplementary materials included in this article.