

Abstract
The yeast mitochondrial proteins Rcf1 and Rcf2 are associated with a subpopulation of the cytochrome bc1–cytochrome c oxidase supercomplex and have been proposed to play a role in the assembly and/or modulation of the activity of the cytochrome c oxidase (complex IV, CIV). Yeast mutants deficient in either Rcf1 or Rcf2 proteins can use aerobic respiration–based metabolism for growth, but the absence of both proteins results in a strong growth defect. In this study, using assorted biochemical and biophysical analyses of Rcf1/Rcf2 single and double null-mutant yeast cells and mitochondria, we further explored how Rcf1 and Rcf2 support aerobic respiration and growth. We show that the absence of Rcf1 physically reduces the levels of CIV and diminishes the ability of the CIV that is present to maintain a normal mitochondrial proton motive force (PMF). Although the absence of Rcf2 did not noticeably affect the physical content of CIV, the PMF generated by CIV was also lower than normal. Our results indicate that the detrimental effects of the absence of Rcf1 and Rcf2 proteins on the CIV complex are distinct in terms of CIV assembly/accumulation and additive in terms of the ability of CIV to generate PMF. Thus, the combined absence of Rcf1 and Rcf2 alters both CIV physiology and assembly. We conclude that the slow aerobic growth of the Rcf1/Rcf2 double null mutant results from diminished generation of mitochondrial PMF by CIV and limits the level of CIV activity required for maintenance of the PMF and growth under aerobic conditions.
Keywords: mitochondria, proton motive force, cytochrome oxidase, bioenergetics, mitochondrial respiratory chain complex, OXPHOS, Rcf1/Rcf2
Introduction
Originally found through their physical association with the cytochrome bc1–cytochrome c oxidase supercomplex of the mitochondrial oxidative phosphorylation (OXPHOS)2 system, the yeast Rcf1 and Rcf2 respiratory supercomplex–associated factor proteins have been reported to support the cell's ability to perform aerobic respiration (1–6). Rcf1 and Rcf2 are yeast members of the conserved Hig1 protein family (hypoxia-induced gene 1 family) (7–10). Contrary to initial suggestions, the presence of Rcf1 and Rcf2 is not required to achieve the III2–IV1–2 supercomplex arrangement of the cytochrome bc1 (complex III (CIII)) with the cytochrome c oxidase (complex IV (CIV)) enzyme. Rather, evidence that Rcf1 supports the assembly and activity of the CIV enzyme by physically associating with it, possibly in a dynamic way to modify the enzyme and, thereby, its stability and catalytic properties, has been presented (1, 4, 11–15). In addition, Rcf1 has been shown to physically interact with the newly synthesized Cox3 subunit prior to Cox3's assembly into the functional CIV enzyme (1, 16). Evidence indicating that Rcf1's “fingerprint” on the CIV complex may involve association of lipids with the Cox3 subunit has also been presented recently (11).
Cox1, Cox2, and Cox3 represent the core subunits of the CIV enzyme, and all three are encoded on the mitochondrial genome. The Cox1 and Cox2 subunits contain the heme (aa3) and copper prosthetic groups essential for CIV catalysis and thus are directly involved in the oxidation of cytochrome c and the reduction of oxygen (O2) to water. Although Cox3 does not bind metal and is not essential for electron transfer (ET), it does bind cardiolipin and phosphatidylglycerol in a deep cleft between its two transmembrane domains (17–19). Cox3 binds to Cox1, and O2 flows through the lipids of Cox3 into the O2 translocation channel in Cox1 (18, 20, 21). The observed association of Rcf1 with newly synthesized Cox3 and reduced levels of assembled CIV enzyme in the absence of Rcf1 suggest that Rcf1 plays a role in the folding and/or lipid incorporation into the Cox3 subunit prior to its assembly into CIV (1–3). Consistently, misassembly of some CIV active sites in the absence of Rcf1, as evidenced by altered cyanide binding and by a low redox potential for heme a3, was recently reported (12, 13). Consequently, maximum turnover rates of CIV enzyme are reported to be lower in Δrcf1 than in WT mitochondria (520 s−1 compared with 800 s−1) (13). However, the role of the Rcf1 and Rcf2 proteins after CIV assembly, particularly bioenergetic consequences of the absence of Rcf1 and/or Rcf2, are unknown.
As an essential component of OXPHOS, CIV transfers electrons from reduced cytochrome c to O2, a catalytic reaction accompanied by the uptake of electrons and protons used in the formation of water from opposite sides of the inner mitochondrial membrane (IMM). In addition, ET also drives the pumping of protons completely across the IMM. Both O2 reduction and proton pumping generate proton motive force (PMF), almost all of which takes the form of an electrical potential (ΔΨ) (22). PMF drives the proton translocation used by the F1Fo-ATP synthase to effect ATP synthesis. The rate of catalytic turnover by CIV is limited by the normal PMF of mitochondria (∼180 mV, negative inside, positive outside). In isolated intact mitochondria, addition of a bolus of ADP activates proton flow through F1Fo-ATP synthase, driving ATP synthesis, which leads to a transient decrease in PMF. OXPHOS ET, including CIV, accelerates as the decreased density of the positive charge on the outer surface of the IMM allows more rapid proton pumping. Addition of an uncoupler (e.g. CCCP) to completely dissipate the PMF removes any inhibition of proton pumping, allowing CIV to reach maximal turnover rates for a given set of substrate concentrations, i.e. reduced [cytochrome c], [H+] (pH), and [O2].
Yeast mutants deficient in either Rcf1 or Rcf2 proteins (i.e. Δrcf1 and Δrcf2 strains) retain their ability to grow through aerobic respiration–based metabolism, as evidenced by their growth on nonfermentable carbon sources. In contrast, combined deletion of the genes encoding both Rcf1 and Rcf2 results in a strong defect in respiration-based growth of the resulting double mutant, Δrcf1;Δrcf2 (1). The compromised ability to live by respiration when both Rcf1 and Rcf2 are absent, as opposed to when one or other are absent, indicates that these proteins may share overlapping functions or that they have distinct functions and their combined absence compromises OXPHOS capacity below a threshold critical to support aerobic growth.
In this study, we sought to gain further understanding of the significance of the Rcf1 and Rcf2 proteins for the bioenergetics of CIV and the OXPHOS system. We report here that, in the absence of Rcf1, the physical content of the CIV enzyme is reduced and a decline in PMF, independent of the lower content of CIV, is detected when electron transport activity through the CIV enzyme is induced. In contrast, the CIV enzyme levels are not strongly affected by the absence of Rcf2. However, evidence for a reduced ability of the CIV to generate PMF was also obtained in Δrcf2 mitochondria, suggesting that Rcf2 may also be required to ensure normal PMF production by the CIV. The combined absence of both Rcf1 and Rcf2 (i.e. Δrcf1; Δrcf2 mitochondria) strongly diminished the ability of yeast mitochondria to maintain a normal membrane potential. Analysis of the overall data suggests that CIV is the source of the ΔΨ maintenance defect when Rcf1/Rcf2 proteins are absent. We speculate a role for Rcf1/Rcf2 proteins in maintaining the integrity of the CIV enzyme in a manner that involves the Cox3 subunit and its association with its integral lipids.
Results
The mitochondrial physical content of the CIV is negatively impacted by the absence of Rcf1 but not Rcf2
To extend our previous analyses of the consequences caused by the absence of Rcf1 and/or Rcf2 on the content of mitochondrial OXPHOS complexes (1), we initially analyzed the cytochrome content of Rcf1/Rcf2 single- and double-null mutant mitochondria using dithionite reduced-ferricyanide oxidized spectra (Fig. 1A and Table S1). The content of CIV, as determined from the cytochrome aa3 peak at 603 nm, was similar to the WT in the Δrcf2 mitochondria but 50% reduced in Δrcf1 mitochondria. Notably, the CIV levels were not further reduced when Rcf2, in addition to Rcf1, was absent, as the cytochrome aa3 levels in the Δrcf1;Δrcf2 mitochondria were found to be similar to those in Δrcf1 mitochondria (Fig. 1A and Table S1). This indicates that the loss of Rcf2 in addition to Rcf1 does not have an additive negative consequence for the physical content of CIV. Little impact on cytochrome c:c1 spectral levels (550 nm) were observed when Rcf1 and/or Rcf2 were absent. However, the amount of b-type cytochromes (560 nm) was slightly increased over the WT control in the absence of Rcf2 (in both Δrcf2 and Δrcf1; Δrcf2 mitochondria) (Fig. 1A and Table S1). SDS-PAGE analysis of isolated mitochondrial proteins confirmed that the levels of cytochromes c1, c, and b were not reduced in the mutant strains (and were even slightly elevated in the absence of Rcf2). Consistent with the cytochrome aa3 spectral analysis, the content of Cox1 was significantly reduced in Δrcf1 and Δrcf1;Δrcf2 mitochondria but not in Δrcf2 mitochondria (Fig. 1B).
Figure 1.
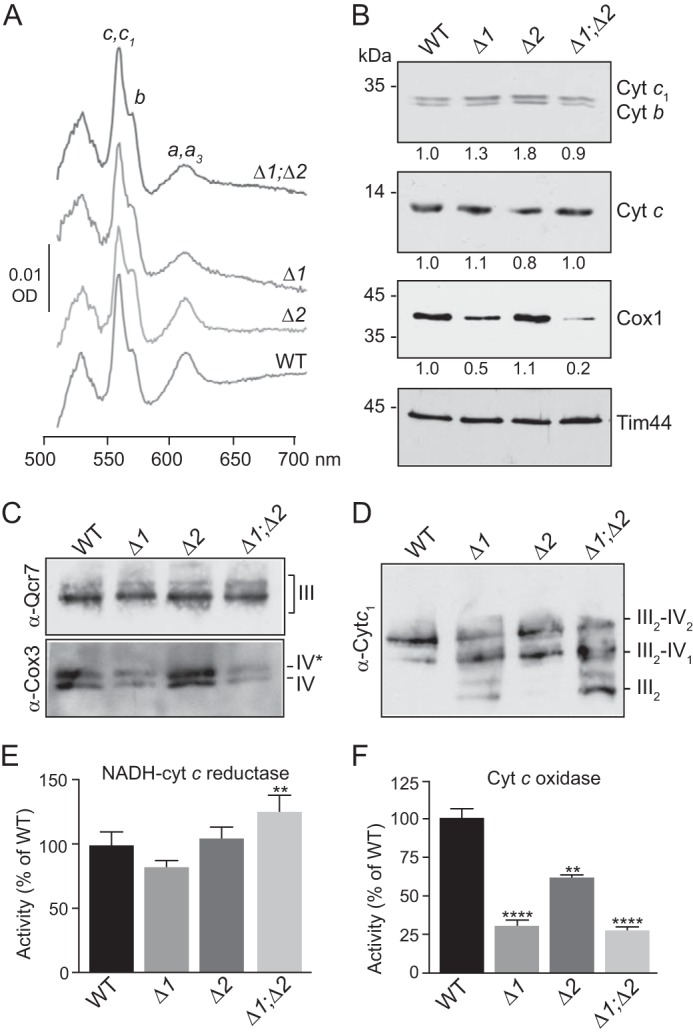
The levels of CIV complex are reduced in the absence of Rcf1. A, spectral analysis of total mitochondrial cytochromes. Mitochondria (1 mg) isolated from the indicated strains were solubilized in DDM (2%), and difference spectra of reduced (sodium dithionite) minus oxidized (potassium ferricyanide) mitochondrial cytochromes (aa3, b, and c, c1) were recorded. B, steady-state levels of the indicated OXPHOS subunits in isolated mitochondria (25 μg) were analyzed by Western blotting. The resulting signals were quantified following scanning using Image Studio software and normalized to the loading control Tim44. The positions of the molecular mass standards are indicated. C, mitochondria (30 μg) isolated from the indicated strains were solubilized in DDM (0.6%) and subjected to BN-PAGE analysis, Western blotting, and immunodecoration with antibodies against the complex III subunit Qcr7 (α-Qcr7) or complex IV subunit Cox3 (α-Cox3) was performed. D, the same as in C, except that mitochondria were solubilized with digitonin (1.0%) prior to BN-PAGE, and decoration was performed with antibodies against the complex III subunit cytochrome c1 (α-Cytc1). E and F, specific activities of the cytochrome bc1 (E, NADH-cyt c reductase, n = 9) and CIV (F, Cyt c oxidase, n = 4–23) enzymes were measured in detergent-solubilized mitochondria as described under “Experimental procedures.” Activities are expressed as a percentage of the WT control. Values represent average ± S.E. ****, p < 0.0001; **, p < 0.01. Δ1, Δrcf1; Δ2, Δrcf2; Δ1;Δ2, Δrcf1;Δrcf2; OD, optical density.
The assembly profiles of CIII and CIV were also analyzed by blue native PAGE analysis (BN-PAGE) (Fig. 1C). Two forms of CIV, complexes IV and IV*, which differ in the association of subunit Cox12 with the CIV enzyme (11), are detected from WT mitochondria following solubilization in 0.6% dodecyl maltoside (Fig. 1C, bottom panel). A strong reduction in both IV/IV* forms was observed in the absence of Rcf1, and a similar reduction was obtained in Δrcf1;Δrcf2 mitochondria. The absence of Rcf2 alone did not have any apparent negative impact on CIV accumulation, which was similar to the WT control. The cytochrome bc1 complex (III2) appeared to be largely unaffected by the absence of Rcf1 and/or Rcf2 (Fig. 1C, top panel).
Solubilization of the isolated mitochondria with digitonin (a milder detergent than dodecyl maltoside) allowed examination of III2–IV1–2 supercomplex organization. Compared with the WT, the lower content of CIV in the absence of Rcf1 led to decreased amounts of the III2–IV2 supercomplex, an increase in the III2–IV1 supercomplex, and accumulation of free dimeric CIII (III2) (Fig. 1D). Similar changes were observed in Δrcf1;Δrcf2 mitochondria. In contrast, Δrcf2 mitochondria showed a supercomplex profile similar to the WT, and no free dimeric CIII was seen (Fig. 1D), consistent with our previous findings (1).
The ET activities of detergent-solubilized cytochrome bc1 and CIV, analyzed spectrophotometrically for rates of exogenous cytochrome c reduction and oxidation, respectively (Fig. 1, E and F, and Table S2), yielded results consistent with the protein gels and cytochrome content analyses. The cytochrome c reduction assay showed that the activity levels of the cytochrome bc1 complex were similar in WT, Δrcf1, and Δrcf2 mitochondria and even somewhat elevated in Δrcf1;Δrcf2 mitochondria (Fig. 1E). The cytochrome c oxidation assay, on the other hand, indicated that the relative specific activities of the CIV enzyme in Δrcf1 and Δrcf1;Δrcf2 mitochondria were strongly reduced and to similar extents (31% and 27%, respectively, of the WT control) (Fig. 1F and Table S1). Less of a reduction in CIV activity was observed in the Δrcf2 mitochondria, again consistent with the protein gels and cytochrome content analyses.
The specific activity of CIV was also independently measured in intact mitochondria using ascorbate/TMPD to donate electrons to endogenous cytochrome c and measuring its O2 consumption rate. Measurements were performed in the presence of the uncoupler CCCP to avoid inhibition of CIV activity by PMF. Under these conditions, CIV in Δrcf1 and Δrcf1;Δrcf2 mitochondria showed 37% and 28% of the activity CIV in WT mitochondria, respectively, whereas the activity of CIV in Δrcf2 mitochondria was 70% of the WT (Fig. S1 and Table S2). Hence, both methods of measuring CIV activity gave similar results (Fig. 1F versus Fig. S1 and Table S2). Our finding that the CIV enzyme–specific activities are lower than the CIV accumulation levels indicated by the protein gels and by the spectrophotometric analyses indicates that the molecular activities of CIV in each of the Rcf mutant mitochondria must be lower than CIV in WT mitochondria.
In summary, we conclude that the physical levels of the CIV enzyme are negatively impacted by the absence of Rcf1. However, the absence of Rcf2 has little effect on the content of CIV.
Cells deficient in Rcf2 exhibit enhanced respiration and sensitivity to K+/H+ ionophore and hypoxic conditions
We have reported previously that cells deficient in Rcf1 or Rcf2 can still grow on nonfermentable carbon sources (i.e. respiration-based growth) but that growth of the double Δrcf1;Δrcf2 mutant is strongly impaired under these conditions (1, 11). To determine whether the observed respiration-based growth defect of the Δrcf1;Δrcf2 mutant is due to a compromised O2 consumption capacity and/or a reduction in the mitochondrial content of these cells, we analyzed whole-cell respiration in the Rcf1/Rcf2 mutants and the levels of mitochondria in their whole-cell extracts (Fig. 2). The cellular O2 consumption rates in Δrcf1 and Δrcf1;Δrcf2 cells were close to those of WT cells, despite the significantly lower CIV content of their mitochondria. The O2 consumption profile of Δrcf2 cells was significantly elevated with respect to the WT control and single Rcf1/Rcf2 mutants (OCR of Δrcf2 cells was 140% that of the WT levels) (Fig. 2A). The mitochondrial content of the Rcf1/Rcf2 mutant cells was found not to greatly differ from those of the WT cells, as indicated by the levels of mitochondrial proteins such as porin (an outer mitochondrial membrane protein) and Tim17 (an IMM protein) relative to the cytosolic marker protein Pgk1 (Fig. 2B). Consistent with the observed decrease in the steady-state levels of CIV in the isolated mitochondria documented in Fig. 1, the levels of Cox3 were strongly reduced in Δrcf1 and Δrcf1; Δrcf2 cells and, to a lesser extent, in Δrcf2 cells (Fig. 2B). Taken together, these results indicate that the impaired ability of Δrcf1;Δrcf2 cells to grow through respiration-based metabolism is not due to an inability to respire, i.e. consume O2, or reduced cellular mitochondrial content.
Figure 2.
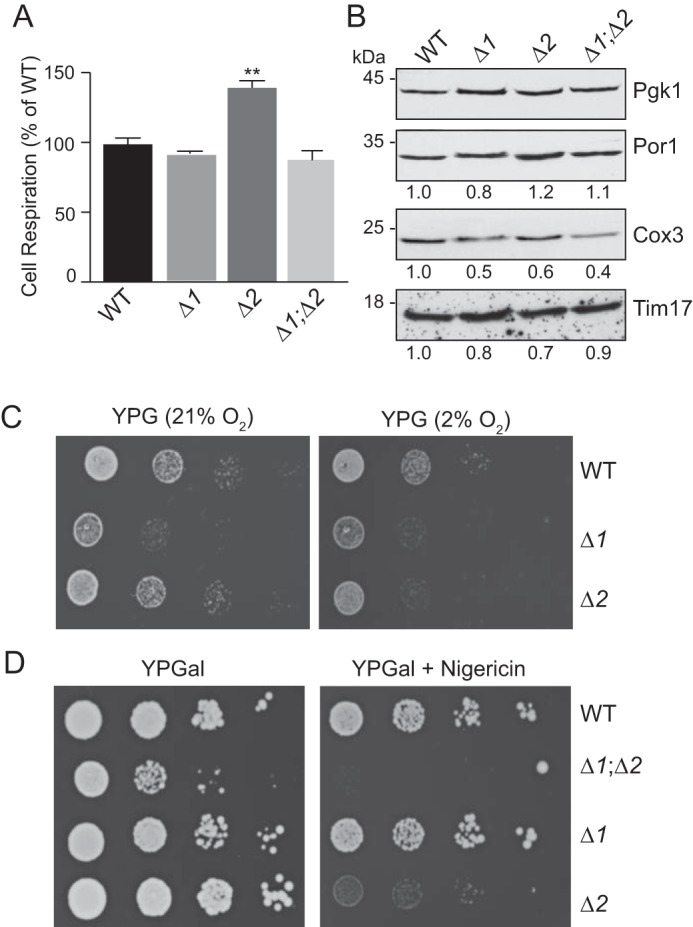
Cellular respiration and stress sensitivity are enhanced in the absence of Rcf2. A, endogenous cellular respiration was measured in the indicated YPGal-grown yeast cultures (A600 = 0.6) (starting concentration, ∼270 μm O2) using a Clark-type oxygen electrode at 30 °C. KCN-sensitive OCR is shown, expressed as percent of the WT (n = 2). Values represent average ± S.E. **, p < 0.01. B, whole-cell protein extracts from YPGal-grown cultures (A600 = 0.6) were analyzed by SDS-PAGE and Western blotting using antibodies to 3-phosphoglycerokinase (Pgk1), mitochondrial outer membrane porin (Por1), and complex IV subunit 3 (Cox3). Signals were quantified as described under “Experimental procedures” and normalized to the loading control Pgk1. The positions of the molecular mass standards are indicated. C, cell suspension serial dilutions spotted onto YPG medium and incubated at 21 °C for 5 days under normoxia (21% oxygen) or hypoxia (2% oxygen), as indicated. D, cell suspension serial dilutions were spotted on YPGal medium with or without nigericin (1 μm), as indicated, and incubated at 30 °C for 5 days. Δ1, Δrcf1; Δ2, Δrcf2; Δ1;Δ2, Δrcf1;Δrcf2.
The significantly increased level of respiration in Δrcf2 cells relative to their mitochondria and CIV/cytochrome aa3 content may be indicative of partial uncoupling. Consistent with this suggestion, we observed that respiration-based growth of the Δrcf2 strain was compromised when grown under hypoxic conditions (2% O2; expected to slow mitochondrial ET and ATP synthesis) relative to the WT strain under the same [O2] condition or the Δrcf2 strain grown under normoxia conditions (Fig. 2C). In addition, we observed that the Δrcf2 and Δrcf1;Δrcf2 strains (but not the Δrcf1 or WT control strains) were hypersensitive to low levels of nigericin when grown on galactose medium (Fig. 2D). Nigericin is a K+/H+ ionophore that dissipates ΔpH of the PMF (but not the charge component, ΔΨ), and its action is specific to the IMM (23). The concentration of nigericin used was subtoxic for WT respiration, i.e. it strongly reduced but did not completely inhibit respiration-based growth (glycerol) of WT control cells (data not shown). Galactose is a fermentable carbon source that favors respiration-based growth (galactose does not repress mitochondrial respiration like glucose does) and, consequently, the Δrcf1;Δrcf2 strain exhibits a lower growth capacity on this medium (Fig. 2D). The observed hypersensitivity of Δrcf2 (and the Δrcf1;Δrcf2 strain) to nigericin suggests that the mitochondria's ability to establish and/or maintain a normal PMF is compromised when Rcf2 is absent, a finding consistent with the increased rate of cellular O2 consumption by the Δrcf2 strain. In summary, although the Δrcf2 cells can still grow on glycerol-based medium, i.e. survive by respiration, the observed elevated O2 consumption profile and hypersensitivity to hypoxia and nigericin are consistent with compromised ability of the Δrcf2 mutant to achieve or maintain an optimal PMF, which is critical for OXPHOS coupling.
Deletion of RCF1 and RCF2 cumulatively lowers OXPHOS coupling
Our results so far indicate that the absence of Rcf1 is correlated with a physical reduction in CIV enzyme content. Although the CIV levels are not as strongly reduced in the absence of Rcf2, our data suggest that the mitochondria's ability to maintain a normal PMF in the absence of Rcf2 may be impaired. On the basis of these data, we hypothesize that the combination of both of these defects may be underlying the observed respiration-based growth defect of the Δrcf1;Δrcf2 strain, as, unlike their respective single mutants, the PMF generated in the absence of both Rcf1 and Rcf2 may not be sufficient to support normal rates of mitochondrial ATP synthesis. To test this hypothesis, we evaluated the O2 consumption profile of the isolated Rcf1/Rcf2 mutant mitochondria for indications of their ability to generate and maintain PMF.
We initially measured the basal O2 consumption rate (OCR) (state 2) of the ET chain of the OXPHOS system by adding the respiratory substrate NADH to isolated intact mitochondria (Fig. 3A). In yeast mitochondria, ET from NADH to O2 involves an NADH dehydrogenase that does not generate PMF and CIII and CIV, which do. In normal coupled mitochondria, ET is inhibited by PMF, particularly in the absence of proton transfer through ATP synthase (state 2 conditions). For example, WT mitochondria uncoupled with CCCP exhibited a rate of 900 nmol O2 min−1 mg protein−1 for ET from NADH to O2 (Fig. S2C), but the PMF developed under state 2 conditions slows ET to 170 nmol O2 min−1 mg protein−1 (Fig. 3A). In the presence of CCCP, uncoupled O2 consumption driven by NADH in Δrcf1 and Δrcf1;Δrcf2 mitochondria was ∼45% less than that of the WT (Fig. S2C), consistent with the strongly reduced content of CIV in these mitochondria. However, in the absence of CCCP, the state 2 O2 consumption driven by NADH was faster in all three mutant mitochondria than in the WT control (Fig. 3A and Table S3), suggesting a diminished PMF in these mitochondria. The highest state 2 OCR rates were obtained when Rcf2 was absent (i.e. in Δrcf2 and Δrcf1;Δrcf2 mitochondria), where the elevated OCR in Δrcf2 mitochondria is particularly relevant when one considers that the level of CIV was not as impacted by the absence of Rcf2 (Fig. 1). Normalization of the state 2 OCR to the physical content of CIV (i.e. cytochrome aa3 content) rather than to total mitochondrial protein generates data showing the rate of ET per complete ET chain (Fig. S2A). By this method, obvious increases in state 2 ET are observed in all three mutant mitochondria relative to the WT control, further supporting that the mitochondria may have a diminished PMF when Rcf1 and/or Rcf2 are absent (Fig. S2A).
Figure 3.

Changes in state 2 and state 3 respiration in mitochondria from the Δrcf1, Δrcf2, and Δrcf1;Δrcf2 mutants. A, OCR (nanomoles O2 per minute per milligram of isolated mitochondria) was measured in 0.5 ml of respiration buffer containing isolated mitochondria (40 μg) following addition of NADH (1 mm) (state 2) as detailed under “Experimental procedures.” Values represent the average rate over the 2- to 8-min range ± S.E. ***, p < 0.001; **, p < 0.01. B, OCR was measured following addition of NADH (1 mm) and ADP (200 μm) (state 3). Peak OCR is reported. Values represent average ± S.E. *, p < 0.05. C, RCR was calculated by dividing the peak state 3 OCR (B) by the recorded state 2 OCR (A). D, state 2 respiration measured as in A and kinetically monitored for 8 min. The calculated rate of OCR at each time point recorded is indicated. E, the state 2 OCR was initially recorded in the presence of NADH for 3 min, after which ADP (100 μm) was added. The OCR was kinetically followed for another 7 min. Values represent average ± S.E. ****, p < 0.0001; **, p < 0.01. Δ1, Δrcf1; Δ2, Δrcf2; Δ1;Δ2, Δrcf1;Δrcf2.
When ATP synthase was activated by addition of ADP (state 3), NADH-driven OCR increased in the WT control because proton flow through Fo-ATP synthase partially dissipated the PMF and stimulated ET activity by CIII and CIV (Fig. 3B). The rate of state 3 OCR driven by NADH was less stimulated by ADP in Δrcf1 and Δrcf1;Δrcf2 mitochondria relative to control WT mitochondria (Fig. 3B and Table S3). Consequently, the calculated respiratory control ratios (RCR, i.e. the state 3/state 2 ratios) were lower in the absence of Rcf1, indicating loss of OXPHOS coupling in rcf1 mutant mitochondrial types (Fig. 3C); the ratio of state 3 to state 2 ET is a standard measure of the degree to which PMF affects mitochondrial ET. The lowered RCR of the Rcf1/Rcf2 mutant mitochondria was obtained in numerous independent preparations, supporting that it was not due to a poor preparation of uncoupled (i.e. not intact) mitochondria. Independently, we measured the exchange of ADP and ATP through the ADP/ATP carrier (AAC) protein, also known to associate with Rcf1 (1, 11). AAC activity was not altered in the absence of Rcf1 and Rcf2 (data not shown); therefore, the observed decrease in the rate of state 3 respiration in the absence of Rcf1 cannot be attributed to potentially limiting ADP levels within the mitochondria.
When monitoring the NADH-driven state 2 respiration profile, we observed that the OCR increased over time in Δrcf1;Δrcf2 mitochondria and, to a lesser extent, in Δrcf1 mitochondria, suggesting that the induction of electron transport through the ET chain in the absence of Rcf1 may cause further uncoupling (Fig. 3D). In contrast, the OCR was stable in WT and Δrcf2 mitochondria. The gradual increase in OCR observed in Δrcf1;Δrcf2 mitochondria was not prevented by addition of the F1Fo-ATP synthase inhibitor oligomycin or atractyloside, an inhibitor of the AAC protein (data not shown), suggesting that a potential proton leak through either the Fo sector of the enzyme or the AAC protein was not a contributing factor.
Following the consumption of exogenously added ADP, the NADH-driven state 4 OCR of WT mitochondria, as expected, returned to a level that was similar to the measured state 2 OCR prior to ADP addition (i.e. state 4 OCR = state 2 OCR) (Fig. 3E). Δrcf2 mitochondria displayed a similar property. However, this was not the case for Δrcf1 and Δrcf1;Δrcf2 mitochondria, which displayed a higher “state 4” level following ADP consumption (Fig. 3E). To account for the kinetic variations in state 2 OCRs between the different mutant types, the level of ADP-stimulated O2 consumption occurring at the time of peak state 3 was calculated for each mitochondrial type (i.e. state 3 minus state 2 OCRs at the peak time), and this further illustrated the compromised OXPHOS coupling capacity in the all three of the Rcf1/Rcf2 mutant mitochondria (Fig. S2B). These observations, taken together, indicate an underlying issue establishing and/or maintaining the required PMF in the absence of Rcf1 and Rcf2, limiting OXPHOS state 3 performance and, thus, ATP synthesis capacity.
The ability of the ET chain system to support the PMF is impaired in the absence of Rcf1/Rcf2
The ability of the ET chain system in Rcf1/Rcf2 mutant mitochondria to establish and maintain a normal PMF was next investigated using the membrane potential indicator fluorescent dye safranin (24) (Fig. 4). Safranin is a lipophilic yet cationic dye that partitions into the matrix of mitochondria in proportion to the ΔΨ, i.e. in proportion to the density of negative charge on the matrix surface of the inner membrane. When inside, safranin aggregates and self-quenches. Therefore, the extent of loss of safranin fluorescence in the presence of isolated mitochondria indicates the extent of membrane potential formation.
Figure 4.
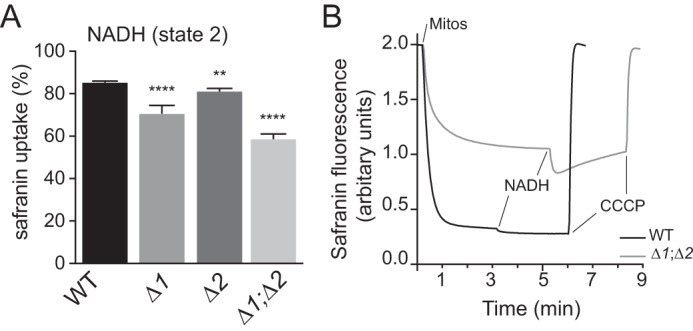
Measurements of state 2 membrane potential in mitochondria isolated from the Δrcf1, Δrcf2, and Δrcf1;Δrcf2 mutants. A, maximum values for percent safranin uptake as an indicator of ΔΨ were measured for state 2 ET from 0.5 mm NADH to O2 as described under “Experimental procedures.” The corresponding ΔΨ values in millivolt are presented in Fig. S3A and Table S4. In these data, there was no significant difference in the average ET rates in the reaction chamber for any of the mitochondrial types (data not shown). Therefore, any changes in percent safranin uptake (as well as in estimated ΔΨ) did not result from altered rates of ET through CIII and CIV. Values represent the average ± S.E. n = 14–22; ****, p < 0.0001; **, p < 0.01. B, representative kinetic traces of safranin fluorescence during state 2 ET from NADH to O2 as described in the text and obtained as described under “Experimental procedures.” Δ1, Δrcf1; Δ2, Δrcf2; Δ1;Δ2, Δrcf1;Δrcf2.
During ET from NADH to O2, ΔΨ is generated by CIII and CIV. During state 2 ET, the maximum uptake of safranin by Δrcf1;Δrcf2 mitochondria was ∼30% lower than that of the WT control (Fig. 4A and Table S4), corresponding to a 45% decline in the estimated ΔΨ (in millivolts, see “Experimental procedures”) during steady-state ET (Fig. S3A). The uptake of safranin was also lower in Δrcf1 and Δrcf2 single mutants, 83% and 95% of the WT, respectively (Fig. 4A), corresponding to ΔΨ declines of 27% in the absence of Rcf1 and 14% in the absence of Rcf2 (Fig. S3A and Table S4). We conclude, therefore, that the PMF was partially diminished in the absence of either Rcf1 or Rcf2 but more significantly compromised when both proteins were absent. In terms of “rescuing” the ΔΨ defect of the double Rcf mutant during ET from NADH to O2, Rcf1 appeared to be more effective than Rcf2.
More information on the ability of WT and Δrcf1;Δrcf2 mitochondria to establish a PMF was extracted from the analysis of kinetic traces of safranin uptake during ET (Fig. 4B). The introduction of normal (WT) mitochondria in the assay mixture containing 2 μm safranin initiates a slow rate of O2 consumption driven by endogenous substrates in the mitochondrial matrix (∼30 pmol O2 s−1 × ml). This slow rate of ET is sufficient to generate a potential across the IMM that drives the uptake of 83% of the available safranin (Fig. 4B, black trace) for an estimated ΔΨ of 150 mV. The addition of 0.5 mm NADH speeds ET in the reaction chamber ∼12-fold. This increases the percent safranin uptake to 86%, corresponding to an estimated ΔΨ of 169 mV.
When the Δrcf1;Δrcf2 mitochondria were analyzed in parallel (Fig. 4B, gray trace), two significant changes from the results obtained with WT mitochondria were observed. First, the mitochondria from the Δrcf1;Δrcf2 strain exhibited a 45% lower maximum ΔΨ than that of WT mitochondria, as discussed above. Second, the more rapid state 2 ET initiated by NADH triggered a progressive loss of ΔΨ during continuous ET, seen as an increase in safranin fluorescence. This phenomenon was always observed in Δrcf1;Δrcf2 mitochondria but not in mitochondria isolated from the single Rcf deletion mutants (data not shown). The trace of ET-driven loss of ΔΨ in Δrcf1;Δrcf2 mitochondria does not proceed to complete collapse of ΔΨ. ET-driven loss of ΔΨ was not altered by addition of either oligomycin or atractyloside (data not shown), indicating that ET was not activating a proton leak through either ATP synthase or the adenine nucleotide translocator.
We conclude that the ability of the ET chain system to generate and/or maintain ΔΨ is compromised in the absence of Rcf1 and Rcf2. This explains the lower RCR values and the increases in state 2 ET observed for the Rcf mutants (Fig. 3, A and C). Moreover, progressive loss of ΔΨ may be the cause of the increasing rate of O2 consumption observed in Δrcf1;Δrcf2 mitochondria during state 2 ET from NADH to O2 (Fig. 3D). The compromised ability of the Rcf mutants to generate and/or maintain ΔΨ when supplied with NADH could arise from a decreased ability of CIV to generate PMF and was next directly analyzed.
The Rcf1 and Rcf2 proteins are necessary for CIV to generate a normal membrane potential
Using ascorbate/TMPD as an electron donor to bioenergetically isolate the CIV enzyme in intact mitochondria, we directly measured the CIV's O2 consumption and ΔΨ generation activities. The state 2 OCRs of CIV in Δrcf1, Δrcf2, and Δrcf1;Δrcf2 intact mitochondria (i.e. in the presence of a PMF and absence of ATP synthesis) were determined to be 54%, 78%, and 45% of the WT control levels, respectively (Fig. 5A and Table S2), consistent with the reduced CIV physical levels in the absence of Rcf1 (Fig. 1).
Figure 5.
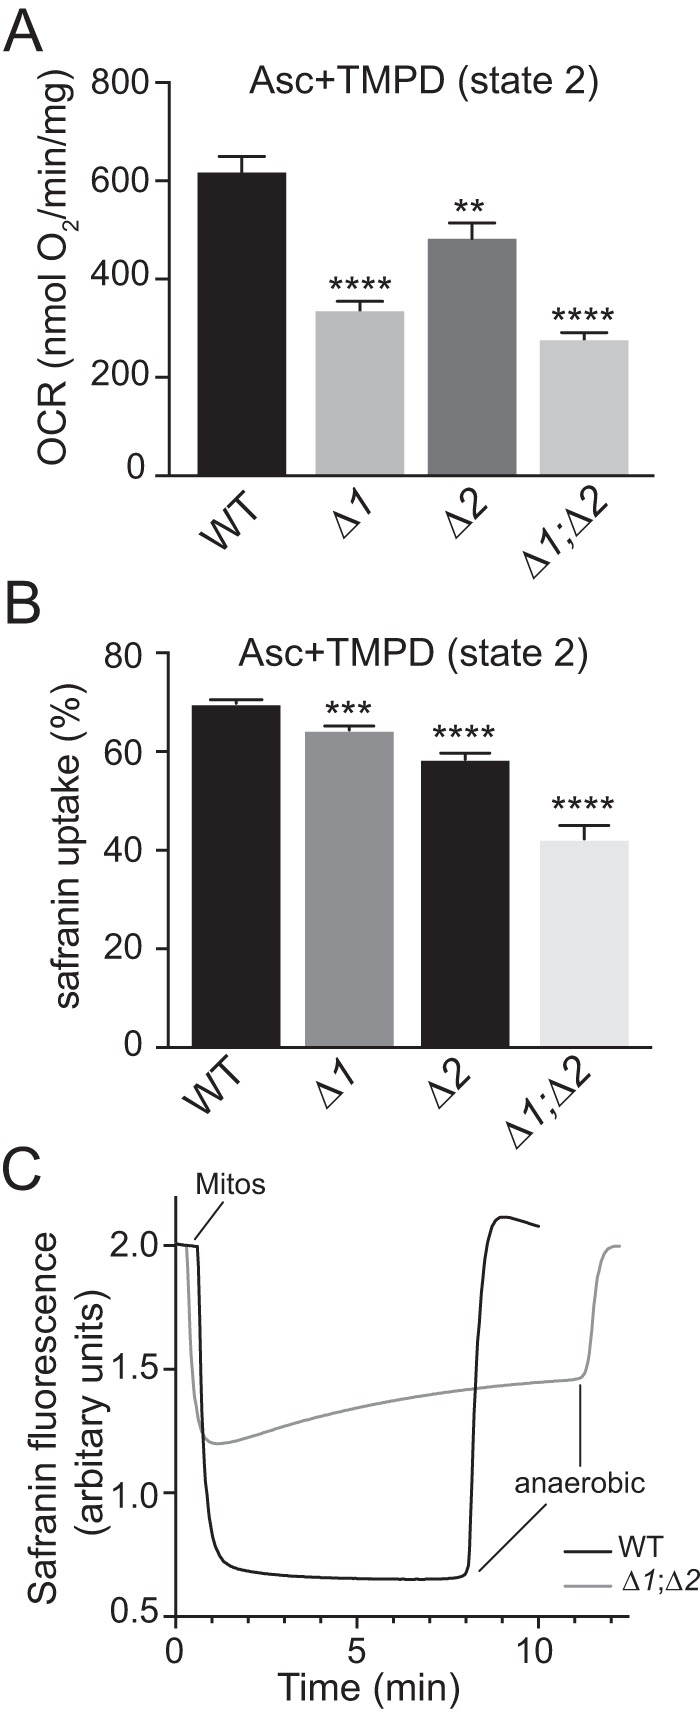
Capacity of CIV to contribute to the mitochondrial membrane potential during state 2 ET. A, mitochondria (40 μg) isolated from the indicated strains were suspended in respiration buffer, and the OCR driven by electron flow directly to the CIV enzyme via ascorbate (12.5 mm) and TMPD (1.4 mm) was recorded. Values represent the average ± S.E. n = 5–11; ****, p < 0.0001; **, p < 0.01. B, maximum values for percent safranin uptake as an indicator of ΔΨ were measured for state 2 ET through CIV, as described under “Experimental procedures.” The corresponding ΔΨ values in millivolt are presented in Fig. S3B and Table S4. Values represent the average ± S.E. n = 6–16; ****, p < 0.0001; ***, p < 0.001. C, representative kinetic traces of safranin fluorescence during state 2 ET through CIV as described in the text and obtained as described under “Experimental procedures.” Δ1, Δrcf1; Δ2, Δrcf2; Δ1;Δ2, Δrcf1;Δrcf2.
We next measured the maximum ΔΨ (maximum safranin fluorescence quenching) developed by state 2 ET through the CIV enzyme alone for each mitochondrial type (Fig. 5B and Table S4). Measurements were performed in the presence of antimycin A to inhibit complex III. To avoid complications arising from differing amounts of CIV between the mitochondrial types, we matched the ET rates through CIV for each of the mitochondrial forms during the measurements of ΔΨ (Fig. S3B, left panel, and Table S4). CIV activity was adjusted by varying the amounts mitochondria used in the different assays between 100 and 200 μg (mitochondrial protein). With similar rates of ET through each CIV form, both the decreased amounts of CIV seen in the absence of Rcf1 and the lower molecular activities of CIV in the Rcf deletion mutants cease to be factors that influence the outcome. Rather, the assay determines to what extent each CIV form can convert the same amount of redox energy into PMF. Plots of the amount of mitochondria versus safranin uptake indicated that changes in matrix volume had no significant effect on the measured values of ΔΨ (data not shown).
The CIV-driven maximum safranin uptake values exhibited by Δrcf1 and Δrcf2 mitochondria were 8% and 16% less than that of the WT, respectively, whereas Δrcf1;Δrcf2 mitochondria showed a 40% decline (Fig. 5B). These values correspond to estimated millivolt declines of 10% and 18% for Δrcf1 and Δrcf2 CIV, respectively, and a 33% decline in ΔΨ for Δrcf1;Δrcf2 CIV (Fig. S3B). This pattern is similar to that observed for the ΔΨ values obtained during state 2 ET from NADH to O2, with the exception that the ΔΨ obtained in the absence of Rcf1 is slightly greater than that of Δrcf2, rather than less. Thus, with ΔΨ supported by CIV alone, Rcf2 appears to be slightly better in rescuing the ΔΨ defect of the double Rcf mutant than Rcf1. Consistent with the measurements of ΔΨ during NADH-driven ET (Fig. 4B), Δrcf1;Δrcf2 mitochondria exhibited the phenomenon of progressive loss of ΔΨ during continuous ET through CIV (seen as an increase in safranin fluorescence, i.e. loss of quenching, over time) (Fig. 5C).
Taking these results together, we conclude that the ability of yeast mitochondria to generate and maintain their membrane potential is negatively impacted by the absence of Rcf1 or Rcf2 and that the effects of these proteins on ΔΨ are additive. As the progressive loss of ΔΨ is observed with ET driven through CIV alone, we propose that CIV is the source of that phenomenon and that CIV is also responsible for the decrease in maximum ΔΨ observed when both Rcf proteins are absent.
Discussion
We demonstrate here that the absence of Rcf1 is correlated with a significant decrease in the physical content of the CIV enzyme (Fig. 1) and an impaired ability of the mitochondria to generate and maintain normal PMF. NADH-driven ET in Δrcf1 mitochondria was less repressed by state 2 conditions than in WT mitochondria (Fig. 3A and Table S3), suggesting uncoupling, consistent with the lower RCR value determined for Δrcf1 mitochondria (Fig. 3C). Indeed, the maximum ΔΨ developed during NADH-driven ET was 27% less than that of the WT (Fig. S3A and Table S4). When bioenergetically isolated using ascorbate/TMPD as substrate, CIV of Δrcf1 mitochondria produced 10% less maximum ΔΨ than the WT control (Fig. S3B and Table S4). It is important to note that the ΔΨ measurements were obtained using conditions where the rate of ET in the Rcf1/Rcf2 mutant mitochondria were similar to WT control mitochondria. Thus, the lower ΔΨ values obtained for Rcf1/Rcf2 mutant mitochondria do not result from the lower physical content of CIV in these mitochondria. Although Δrcf1 mitochondria exhibited decreased CIV content and a lowered capacity to generate ΔΨ, respiration-based growth of Δrcf1 cells was not affected.
CIV was present in Δrcf2 mitochondria (and cells) at normal or near-normal levels (Fig. 1), strongly indicating that Rcf2, unlike Rcf1, does not play a critical role in CIV assembly/stability. However, similar to Rcf1, the presence of Rcf2 is required for the normal generation of PMF by CIV. First, the Δrcf2 strain exhibited elevated levels of cellular respiration, along with hypersensitivity to hypoxia and to subtoxic levels of the K+/H+ ionophore nigericin (Fig. 2). Second, ET from NADH to O2 in Δrcf2 mitochondria was less repressed by state 2 conditions than the WT, and the determined RCR was less than that of the WT (Fig. 3, A and C). During state 2 ET, Δrcf2 mitochondria generated 14% less ΔΨ than WT for NADH→O2 (CIII plus CIV; Fig. S3A) and 18% less ΔΨ for ascorbate/TMPD→O2 (CIV alone; Fig. S3B).
The absence of both Rcf1 and Rcf2 resulted in the same decrease in the content of CIV as seen in Δrcf1 mitochondria (Fig. 1), reinforcing the conclusion that Rcf2 has little or no effect on CIV assembly. ET in Δrcf1;Δrcf2 mitochondria shows the least PMF response to state 2 conditions, and the RCR is the lowest of the mutant mitochondrial forms (Fig. 3, A and C). The ability of ET from NADH or by CIV alone to generate ΔΨ was severely compromised in Δrcf1;Δrcf2 mitochondria relative to the respective single mutants and to the WT control, indicating, along with the ET experiments, that the effects of Rcf1 and Rcf2 absence on the production of ΔΨ are cumulative. The combined effect of the absence of both Rcf1 and Rcf2 proteins, i.e. the reduced CIV content and the lower ΔΨ, results in inability of the OXPHOS system to sustain normal rates of respiratory growth.
In addition to producing the lowest maximum ΔΨ values, the absence of Rcf1 and Rcf2 leads to the interesting phenomenon of progressive loss of ΔΨ over time (Figs. 4B and 5C). Induction of the progressive loss of ΔΨ was observed to require ET and, thus, most likely arises from an ET complex. This limits the sources to CIII or CIV, and because progressive loss of ΔΨ is observed using CIV alone, we assign the phenomenon to CIV. Induction of progressive loss of ΔΨ requires a rate of ET greater than 60 pmol O2 sec−1 through CIV because it is not observed during oxidation of endogenous substrates (Fig. 4B) but seen when the ET rate jumps 12-fold with addition of NADH. The kinetics of the progressive loss of ΔΨ in Fig. 5C fit well to a single exponential (data not shown), indicating that a population of CIV is structurally poised to lose some ability to generate ΔΨ because of a change that occurs during continuous catalytic turnover. This labile population is likely a subset of the total amount of CIV because in the exponential fit ΔΨ does not decline to zero but rather plateaus at a nonzero value.
Given that the progressive loss of ΔΨ arises from CIV, the most likely source for the decreased ability of all three of the Rcf mutants to generate ΔΨ (i.e. lower maximum ΔΨ) is abnormal CIV function. The next question is whether abnormal CIV creates a transmembrane proton leak that causes the decline in ΔΨ or whether the actual generation of ΔΨ by CIV is altered, i.e. whether some population of CIV is pumping fewer protons per catalytic cycle. These options cannot be easily distinguished because the results are identical: a lower ΔΨ. However, diminished proton pumping seems more probable on mechanistic grounds. Proton pumping by CIV requires a number of proton gates to prevent proton backflow, i.e. “slipping” of the pump proton back to the negative surface of the IMM (21, 25). Only one proton gate needs to be compromised to lower the efficiency of proton pumping, whereas all of the proton gates must be overcome to have transmembrane proton leak through CIV.
There exists precedence for decreased efficiency of proton pumping by CIV, and this precedent involves the assembly target of Rcf1, Cox3 of CIV (1, 11). The structure of Cox3 includes a specifically bound complement of lipids, up to four phosphatidylglycerols plus one cardiolipin (19, 20). It has been demonstrated previously that correct lipid binding within Cox3 is necessary for the subunit to prevent structural changes at the active site in Cox1 that lead to suicide inactivation during continuous ET (18, 19). In fact, a likely role for Rcf1 in the assembly of Cox3 is to facilitate the insertion of its lipids (11), and we further proposed that Rcf1 dynamically associates with CIV (via Cox3 and possibly Cox12) to support CIV function throughout its lifespan by maintaining the complement of specific lipids bound within Cox3 (1, 11). The altered association of Cox12 and Cox13 with the CIV enzyme, which is observed in the absence of Rcf1 and Rcf2 proteins (1, 3), may add support for an altered arrangement of Cox3 within the CIV complex.
In addition to preventing suicide inactivation of CIV (19), it is well-established that Cox3 controls the efficiency of proton pumping. The absence of Cox3 decreases the H+/e— stoichiometry of proton pumping by ∼50% for both bacterial and mitochondrial CIV (26–28). The reason for the decreased efficiency of pumping without Cox3 is likely a structural change that raises the pKa of a key pump proton transfer group located in Cox1 near the O2 reduction site (19, 29, 30). Indeed, evidence for a role of Rcf1 in supporting the structure of the heme a3-CuB O2 reduction site of CIV has been presented by Brzezinski and co-workers (12–15). Cox3 plays a role in preventing the active-site alterations documented by Brzezinski and co-workers (19, 31) via long-range interactions with the Cox1 subunit. Cox3 is present in CIV of the Rcf mutants, but it is possible that the integral lipids of Cox3 may be disturbed because of misassembly and/or lack of maintenance (11). Here we propose that correct lipid binding within Cox3 is required to maintain the environment of proton pump residues near the active site that are required for normal proton pumping. We further propose that the Rcf1/Rcf2 proteins serve to ensure the correct folding/refolding of Cox3 and the integrity of its lipid association, perhaps as lipid chaperones, both during the initial assembly of Cox3 into CIV and also during the lifespan of CIV. For example, the Rcf proteins may function to repair lipid binding defects in Cox3 caused by movements in Cox1 as a consequence of the catalytic cycle. In this scenario, a given mitochondrion would contain subpopulations of CIV physically in association with the Rcf1/Rcf2 proteins, being “fixed” to minimize suicide inactivation and maintain the efficiency of proton pumping.
Overall, we demonstrate here that the yeast Rcf1 and Rcf2 proteins support the generation and maintenance of PMF by CIV and, thus, that Rcf1/Rcf2 are essential for respiratory growth under optimal and suboptimal conditions. Rcf1 and Rcf2 are members of the Hig1/HIGD1 family of proteins. In mammals, the family also includes stress-induced Hig1/HIGD1 isoforms, expressed under conditions such as hypoxia or glucose starvation, that have been proposed to play a critical metabolic role in depressing mitochondrial OXPHOS activities to enable tumor cell survival by promoting hypoxic cellular glycolytic metabolism (8, 9). It is therefore possible that the different Hig1/HIGD1 isoforms function to differentially regulate or support the CIV enzyme to respond to different cellular metabolic environments and in a manner that may involve Cox3 and its lipid modifications.
Experimental procedures
Yeast strains and growth conditions
The Saccharomyces cerevisiae strains used in this study were WT (W303-1A, Mat a, leu2, trp1, ura3, his3, ade2), Δrcf1 (W303-1A, Mat a, leu2, trp1, ura3, ade2, RCF1::HIS3), Δrcf2 (W303-1B, Mat α, leu2, trp1, ura3, his3, ade2, RCF2::KAN), and Δrcf1;Δrcf2 (W303-1A, Mat a, leu2, trp1, ura3, ade2, RCF1::HIS3, RCF2::KAN) (1). Yeast strains were maintained and cultured using standard protocols at 30 °C on yeast extract/peptone (YP) media supplemented with 2% glucose and 20 mg/liter adenine hemisulfate (YPAD), YP-0.5% lactate medium supplemented with 2% galactose (YPGal), or YP-0.5% lactate medium supplemented with 3% glycerol (YPG), as indicated.
Growth assays
Yeast cells growing on YPAD agar for less than 24 h were resuspended in sterile water to A600 nm = 0.1, and 10-fold serial dilutions were made. The cell suspensions (3 μl) were spotted on fresh plates and incubated at 30 °C or 21 °C, as indicated. Where indicated, the medium was supplemented with 1.0 μm nigericin.
Whole-cell O2 consumption measurements
Yeast strains were grown in YPGal medium and harvested in their logarithmic phase. Endogenous respiration was measured the cells (A600 = 0.6) using a Clark-type oxygen electrode at 30 °C, as described in Ref. 32. Cyanide-sensitive OCRs were calculated and expressed as percent of the WT control. Results from two to three independent trials were averaged and presented.
Mitochondrial O2 consumption measurements
O2 consumption rates were inferred from the decrease in oxygen concentration measured with a Clark-type O2 electrode (Rank Brothers Digital Model 10) at 30 °C. Isolated mitochondria (20–40 μg of protein) resuspended in 0.5 ml of respiration buffer (0.6 m mannitol, 2 mm MgCl2, 1 mg/ml BSA, 20 mm HEPES-KOH, 1 mm EDTA, and 10 mm K2PO4 (pH 7.2)) were added to the O2 electrode chamber. For state 2 measurements, NADH (1 mm) was added, O2 consumption rates were measured for 8 min, and average rates were recorded. For state 3 measurements, NADH was followed by ADP (100–200 μm), and the peak O2 consumption rate (occurring at 4–5 min) was recorded. NADH+CCCP O2 consumption was measured for 5 min, and average rates were recorded. For measurement of O2 consumption by bioenergetically isolated CIV complex, TMPD (1.4 mm) plus ascorbate (12.5 mm (pH 7)) in the presence or absence of CCCP (10 μm), as indicated, was added. Baseline of O2 consumption in the absence of mitochondria with TMPD/ascorbate was recorded and subtracted.
Measurements of membrane potential in intact mitochondria
Membrane potential (ΔΨ) was measured by the decrease in safranin O fluorescence simultaneously with oxygen consumption at 25 °C using an O2K FluoRespirometer (Oroboros). As a membrane-permeable cation, safranin crosses to the negative (matrix) surface of the inner mitochondrial membrane in proportion to the density of negative charge on the inner membrane surface. The association of safranin with the inner surface of the inner membrane leads to self-quenching of the dye (24). For each assay, 2.1 ml of yeast mitochondrion assay buffer (0.6 m mannitol, 20 mm MOPS, 10 mm KH2PO4, 5 mm MgCl2, 50 mm KCl, 1 mm EDTA, 0.1 mm EGTA, 2 μg/ml catalase, and 1 mg/ml defatted BSA (pH 7.2)) containing 2 μm safranin O was added into an O2K chamber. The fluorescence signal of the FluoRespirometer was calibrated each day with known concentrations of safranin. Hence, the fluorescence readout of the software is in units of micromolar safranin, where the concentration of safranin is that on the outside of the mitochondria. The addition of 100–200 μg of mitochondria initiated state 2 ET. The development of ΔΨ with state 2 ET was seen as a decline in safranin fluorescence and as a decline in micromolar safranin. Assays were concluded by addition of 10 μm CCCP or 0.9 nmol valinomycin plus 0.4 μm CCCP, which brings ΔΨ to zero and safranin fluorescence (as micromolar safranin) to the maximum for that experiment. The percent safranin uptake at any time point is calculated as (micromolar safranin at 0 ΔΨ − micromolar safranin at time x)/micromolar safranin at 0 ΔΨ. The maximum percent safranin uptake value is taken at the point where safranin fluorescence quenching is greatest.
Estimates of millivolt values for ΔΨ were derived from the percent safranin uptake values using the method detailed by Figueira et al. (33). The millivolt values are considered estimates because it was assumed that the concentration of K+ in the matrix of the isolated mitochondria was 120 mm (34). These safranin uptake and estimated ΔΨ values are essentially the same as those obtained using isolated, well-coupled rat liver mitochondria in similar assays (33).
In assays measuring the ΔΨ developed by state 2 ET from NADH to O2, in which CIII and CIV are the components generating ΔΨ, the maximum safranin fluorescence decrease generated after addition of 0.5 mm NADH was recorded. In assays measuring the ΔΨ developed by state 2 ET through CIV alone, 5 mm ascorbate and 100 μm TMPD were added to reduce endogenous cytochrome c, and 5 μm antimycin A was added to inhibit CIII. High concentrations of TMPD can interfere with the safranin uptake measurements (reduced TMPD is a lipophilic cation) and therefore the TMPD concentration was lowered to 100 μm in all ΔΨ determinations.
BN-PAGE analysis
BN-PAGE analysis of digitonin-solubilized (1%) or DDM-solubilized (0.6%) mitochondrial extracts (30 μg of protein) was performed using Invitrogen NuPAGE gradient (3%-12%) gels according to the manufacturer's protocol, followed by Western blotting and antibody decoration as indicated.
Spectral measurements of cytochrome content
Mitochondrial cytochromes were quantified using a published procedure (35) with the following modifications. Isolated mitochondria were solubilized at a final concentration of 2 mg/ml in the presence of 2% DDM and 50 mm Tris-KCl (pH 7.4) and centrifuged at 10,000 rpm for 5 min. The clarified supernatant was oxidized with a potassium ferricyanide or reduced with sodium dithionite, and the difference spectrum was measured at room temperature. The absorption band corresponding to cytochromes aa3 b and c:c1 were quantified using A603 nm (to account for sloping baseline, a baseline was drawn through A700 and A630 and extended to 603 nm), A560 nm (baseline at 575 nm was subtracted), and A550 nm (baseline at 575 nm was subtracted), respectively. Average and standard error values are reported and expressed as percent of the WT control.
Spectral measurement of cytochrome bc1 and CIV enzyme activities
For measurement of the cytochrome bc1 enzyme (NADH − cytochrome c reductase), mitochondria (20 μg) were solubilized with deoxycholate (0.4%), and reduction of horse heart cytochrome c (66 μm) was measured in 10 mm potassium phosphate and 0.1 mm KCN (pH 7.5) following addition of NADH (1 mm), as described in Ref. 1. To determine the relative specific activity of CIV enzyme in each mitochondrial type, isolated mitochondria (4 μg) were solubilized with DDM (0.05%) and incubated in 10 mm Tris-HCl and 120 mm KCl (pH 7.0) in the presence of horse heart cytochrome c (11 μm), reduced previously with 0.5 mm DTT. The activities were monitored spectrally at 550 nm, and the resulting relative specific activities were determined from the initial slopes of the recorded absorbance changes at 550 nm (reduction or oxidation of cytochrome c, respectively) and expressed as a percentage of the WT control.
Statistics and reproducibility
All Western blotting/immunodecorations and serial dilution growth assays shown are representatives of at least three independent replicates. Statistical analysis of enzyme activities and mitochondrial O2 consumption assays are from a minimum of three independent experiments and using independent isolated mitochondrial preparations. Error bars show average ± S.E., and the values were compared with those of respective WT controls using Student's t test; p < 0.05 was considered significant.
Miscellaneous
Mitochondrial isolation (from cells grown in YPGal medium), protein determination and SDS-PAGE were performed as described previously (1, 36). Isolated mitochondria (10 mg/ml) were flash-frozen in liquid nitrogen and stored at −80 °C. Mitochondrial aliquots were thawed and used only once. The Cox1 and Cox3 antibodies used in this study were obtained commercially (Cox1: Abcam, anti-yeast Cox1, mouse monoclonal 11D8-B7; Cox3: Invitrogen/Novex anti-Cox3 monoclonal, 459300). All other antibodies used were rabbit polyclonal against the respective purified yeast proteins and generated either in the Stuart laboratory or received as gifts. Antigen–antibody complexes were detected by horseradish peroxidase–coupled secondary antibodies and chemiluminescence detection on X-ray films, and scanned films were quantified using ImageJ (National Institutes of Health) software.
Author contributions
V. S., J. H., and R. A. S. conceptualization; V. S., N. H. H., J. H., and R. A. S. data curation; V. S., N. H. H., J. H., and R. A. S. formal analysis; V. S., N. H. H., J. H., and R. A. S. validation; V. S., N. H. H., J. H., and R. A. S. investigation; V. S., N. H. H., J. H., and R. A. S. visualization; V. S., J. H., and R. A. S. methodology; V. S., J. H., and R. A. S. writing-review and editing; J. H. and R. A. S. supervision; J. H. and R. A. S. funding acquisition; J. H. and R. A. S. writing-original draft; J. H. and R. A. S. project administration.
Supplementary Material
Acknowledgments
We acknowledge and thank Joshua Garlich and Jessica Anderson for helpful discussions as well as Jodie Box and Dr. Kristin Edwards for technical assistance and discussions. We also thank Drs. Carla Koehler (University of California, Los Angeles) for the valuable gifts of the porin and Tim17 antisera.
This work was supported by National Science Foundation Grant MCB-1157722 and National Institutes of Health Grants R15GM101594 and R15GM117551 (to R. A. S.) and P20GM121334 (to J. H.). The authors declare that they have no conflicts of interest with the contents of this article. The content is solely the responsibility of the authors and does not necessarily represent the official views of the National Institutes of Health or National Science Foundation.
This article contains Figs. S1–S3 and Tables S1–S4.
- OXPHOS
- oxidative phosphorylation
- CIII
- cytochrome bc1 complex
- CIV
- cytochrome c oxidase
- ET
- electron transfer
- IMM
- inner mitochondrial membrane
- PMF
- proton motive force
- CCCP
- carbonyl cyanide p-chlorophenylhydrazone
- BN
- blue native
- TMPD
- N,N,N′,N′-tetramethyl-p-phenylenediamine
- OCR
- O2 consumption rate
- RCR
- respiratory control ratio
- AAC
- ADP/ATP carrier
- DDM
- dodecyl maltoside
- ΔΨ
- membrane potential or electrical potential across the inner mitochondrial membrane.
References
- 1. Strogolova V., Furness A., Robb-McGrath M., Garlich J., and Stuart R. A. (2012) Rcf1 and Rcf2, members of the hypoxia-induced gene 1 protein family, are critical components of the mitochondrial cytochrome bc1-cytochrome c oxidase supercomplex. Mol. Cell Biol. 32, 1363–1373 10.1128/MCB.06369-11 [DOI] [PMC free article] [PubMed] [Google Scholar]
- 2. Chen Y. C., Taylor E. B., Dephoure N., Heo J. M., Tonhato A., Papandreou I., Nath N., Denko N. C., Gygi S. P., and Rutter J. (2012) Identification of a protein mediating respiratory supercomplex stability. Cell Metab. 15, 348–360 10.1016/j.cmet.2012.02.006 [DOI] [PMC free article] [PubMed] [Google Scholar]
- 3. Vukotic M., Oeljeklaus S., Wiese S., Vögtle F. N., Meisinger C., Meyer H. E., Zieseniss A., Katschinski D. M., Jans D. C., Jakobs S., Warscheid B., Rehling P., and Deckers M. (2012) Rcf1 mediates cytochrome oxidase assembly and respirasome formation, revealing heterogeneity of the enzyme complex. Cell Metab. 15, 336–347 10.1016/j.cmet.2012.01.016 [DOI] [PubMed] [Google Scholar]
- 4. Cui T. Z., Conte A., Fox J. L., Zara V., and Winge D. R. (2014) Modulation of the respiratory supercomplexes in yeast: enhanced formation of cytochrome oxidase increases the stability and abundance of respiratory supercomplexes. J. Biol. Chem. 289, 6133–6141 10.1074/jbc.M113.523688 [DOI] [PMC free article] [PubMed] [Google Scholar]
- 5. Römpler K., Müller T., Juris L., Wissel M., Vukotic M., Hofmann K., and Deckers M. (2016) Overlapping role of respiratory supercomplex factor Rcf2 and its N-terminal homolog Rcf3 in Saccharomyces cerevisiae. J. Biol. Chem. 291, 23769–23778 10.1074/jbc.M116.734665 [DOI] [PMC free article] [PubMed] [Google Scholar]
- 6. Winge D. R. (2012) Sealing the mitochondrial respirasome. Mol. Cell Biol. 32, 2647–2652 10.1128/MCB.00573-12 [DOI] [PMC free article] [PubMed] [Google Scholar]
- 7. Wang J., Cao Y., Chen Y., Chen Y., Gardner P., and Steiner D. F. (2006) Pancreatic β cells lack a low glucose and O2-inducible mitochondrial protein that augments cell survival. Proc. Natl. Acad. Sci. U.S.A. 103, 10636–10641 10.1073/pnas.0604194103 [DOI] [PMC free article] [PubMed] [Google Scholar]
- 8. Ameri K., Jahangiri A., Rajah A. M., Tormos K. V., Nagarajan R., Pekmezci M., Nguyen V., Wheeler M. L., Murphy M. P., Sanders T. A., Jeffrey S. S., Yeghiazarians Y., Rinaudo P. F., Costello J. F., Aghi M. K., and Maltepe E. (2015) HIGD1A regulates oxygen consumption, ROS production, and AMPK activity during glucose deprivation to modulate cell survival and tumor growth. Cell Rep. 10, 891–899 10.1016/j.celrep.2015.01.020 [DOI] [PMC free article] [PubMed] [Google Scholar]
- 9. Ameri K., and Maltepe E. (2015) HIGD1A-mediated dormancy and tumor survival. Mol. Cell Oncol. 2, e1030537 10.1080/23723556.2015.1030537 [DOI] [PMC free article] [PubMed] [Google Scholar]
- 10. Ameri K., Rajah A. M., Nguyen V., Sanders T. A., Jahangiri A., Delay M., Donne M., Choi H. J., Tormos K. V., Yeghiazarians Y., Jeffrey S. S., Rinaudo P. F., Rowitch D. H., Aghi M., and Maltepe E. (2013) Nuclear localization of the mitochondrial factor HIGD1A during metabolic stress. PLoS ONE 8, e62758 10.1371/journal.pone.0062758 [DOI] [PMC free article] [PubMed] [Google Scholar]
- 11. Garlich J., Strecker V., Wittig I., and Stuart R. A. (2017) Mutational analysis of the QRRQ motif in the yeast Hig1 type 2 protein Rcf1 reveals a regulatory role for the cytochrome c oxidase complex. J. Biol. Chem. 292, 5216–5226 10.1074/jbc.M116.758045 [DOI] [PMC free article] [PubMed] [Google Scholar]
- 12. Rydström Lundin C., and Brzezinski P. (2017) Modulation of O2 reduction in Saccharomyces cerevisiae mitochondria. FEBS Lett. 591, 4049–4055 10.1002/1873-3468.12918 [DOI] [PubMed] [Google Scholar]
- 13. Rydström Lundin C., von Ballmoos C., Ott M., Ädelroth P., and Brzezinski P. (2016) Regulatory role of the respiratory supercomplex factors in Saccharomyces cerevisiae. Proc. Natl. Acad. Sci. U.S.A. 113, E4476–4485 10.1073/pnas.1601196113 [DOI] [PMC free article] [PubMed] [Google Scholar]
- 14. Schäfer J., Dawitz H., Ott M., Ädelroth P., and Brzezinski P. (2018) Regulation of cytochrome c oxidase activity by modulation of the catalytic site. Sci. Rep. 8, 11397 10.1038/s41598-018-29567-4 [DOI] [PMC free article] [PubMed] [Google Scholar]
- 15. Schäfer J., Dawitz H., Ott M., Ädelroth P., and Brzezinski P. (2018) Structural and functional heterogeneity of cytochrome c oxidase in S. cerevisiae. Biochim. Biophys. Acta Bioenerg. 1859, 699–704 10.1016/j.bbabio.2018.05.004 [DOI] [PubMed] [Google Scholar]
- 16. Su C. H., McStay G. P., and Tzagoloff A. (2014) The Cox3p assembly module of yeast cytochrome oxidase. Mol. Biol. Cell 25, 965–976 10.1091/mbc.e13-10-0575 [DOI] [PMC free article] [PubMed] [Google Scholar]
- 17. Yoshikawa S., Muramoto K., Shinzawa-Itoh K., and Mochizuki M. (2012) Structural studies on bovine heart cytochrome c oxidase. Biochim. Biophys. Acta 1817, 579–589 10.1016/j.bbabio.2011.12.012 [DOI] [PubMed] [Google Scholar]
- 18. Varanasi L., Mills D., Murphree A., Gray J., Purser C., Baker R., and Hosler J. (2006) Altering conserved lipid binding sites in cytochrome c oxidase of Rhodobacter sphaeroides perturbs the interaction between subunits I and III and promotes suicide inactivation of the enzyme. Biochemistry 45, 14896–14907 10.1021/bi061390q [DOI] [PubMed] [Google Scholar]
- 19. Ferguson-Miller S., and Hosler J. (2018) In Mechanisms of Primary Energy Transduction in Biology (Wikström M., ed.) pp. 215–248, Royal Society of Chemistry, London, UK [Google Scholar]
- 20. Shinzawa-Itoh K., Aoyama H., Muramoto K., Terada H., Kurauchi T., Tadehara Y., Yamasaki A., Sugimura T., Kurono S., Tsujimoto K., Mizushima T., Yamashita E., Tsukihara T., and Yoshikawa S. (2007) Structures and physiological roles of 13 integral lipids of bovine heart cytochrome c oxidase. EMBO J. 26, 1713–1725 10.1038/sj.emboj.7601618 [DOI] [PMC free article] [PubMed] [Google Scholar]
- 21. Liang R., Swanson J. M. J., Wikström M., and Voth G. A. (2017) Understanding the essential proton-pumping kinetic gates and decoupling mutations in cytochrome c oxidase. Proc. Natl. Acad. Sci. U.S.A. 114, 5924–5929 10.1073/pnas.1703654114 [DOI] [PMC free article] [PubMed] [Google Scholar]
- 22. Blomberg M. R., and Siegbahn P. E. (2012) The mechanism for proton pumping in cytochrome c oxidase from an electrostatic and quantum chemical perspective. Biochim. Biophys. Acta 1817, 495–505 10.1016/j.bbabio.2011.09.014 [DOI] [PubMed] [Google Scholar]
- 23. Kovác L., Böhmerová E., and Butko P. (1982) Ionophores and intact cells: I: valinomycin and nigericin act preferentially on mitochondria and not on the plasma membrane of Saccharomyces cerevisiae. Biochim. Biophys. Acta 721, 341–348 10.1016/0167-4889(82)90088-X [DOI] [PubMed] [Google Scholar]
- 24. Krumschnabel G., Eigentler A., Fasching M., and Gnaiger E. (2014) Use of safranin for the assessment of mitochondrial membrane potential by high-resolution respirometry and fluorometry. Methods Enzymol. 542, 163–181 10.1016/B978-0-12-416618-9.00009-1 [DOI] [PubMed] [Google Scholar]
- 25. Wikström M., Krab K., and Sharma V. (2018) Oxygen activation and energy conservation by cytochrome c oxidase. Chem. Rev. 118, 2469–2490 10.1021/acs.chemrev.7b00664 [DOI] [PMC free article] [PubMed] [Google Scholar]
- 26. Hill B. C., and Robinson N. C. (1986) Cyanide binding to bovine heart cytochrome c oxidase depleted of subunit III by treatment with lauryl maltoside. J. Biol. Chem. 261, 15356–15359 [PubMed] [Google Scholar]
- 27. Nguyen X. T., Pabarue H. A., Geyer R. R., Shroyer L. A., Estey L. A., Parilo M. S., Wilson K. S., and Prochaska L. J. (2002) Biochemical and biophysical properties of purified phospholipid vesicles containing bovine heart cytochrome c oxidase. Protein Expr. Purif. 26, 122–130 10.1016/S1046-5928(02)00503-X [DOI] [PubMed] [Google Scholar]
- 28. Sarti P., Jones M. G., Antonini G., Malatesta F., Colosimo A., Wilson M. T., and Brunori M. (1985) Kinetics of redox-linked proton pumping activity of native and subunit III-depleted cytochrome c oxidase: a stopped-flow investigation. Proc. Natl. Acad. Sci. U.S.A. 82, 4876–4880 10.1073/pnas.82.15.4876 [DOI] [PMC free article] [PubMed] [Google Scholar]
- 29. Gilderson G., Salomonsson L., Aagaard A., Gray J., Brzezinski P., and Hosler J. (2003) Subunit III of cytochrome c oxidase of Rhodobacter sphaeroides is required to maintain rapid proton uptake through the D pathway at physiologic pH. Biochemistry 42, 7400–7409 10.1021/bi0341298 [DOI] [PubMed] [Google Scholar]
- 30. Lee H. J., Svahn E., Swanson J. M., Lepp H., Voth G. A., Brzezinski P., and Gennis R. B. (2010) Intricate role of water in proton transport through cytochrome c oxidase. J. Am. Chem. Soc. 132, 16225–16239 10.1021/ja107244g [DOI] [PMC free article] [PubMed] [Google Scholar]
- 31. Bratton M. R., Pressler M. A., and Hosler J. P. (1999) Suicide inactivation of cytochrome c oxidase: catalytic turnover in the absence of subunit III alters the active site. Biochemistry 38, 16236–16245 10.1021/bi9914107 [DOI] [PubMed] [Google Scholar]
- 32. Barrientos A. (2002) In vivo and in organello assessment of OXPHOS activities. Methods 26, 307–316 10.1016/S1046-2023(02)00036-1 [DOI] [PubMed] [Google Scholar]
- 33. Figueira T. R., Melo D. R., Vercesi A. E., and Castilho R. F. (2012) Safranine as a fluorescent probe for the evaluation of mitochondrial membrane potential in isolated organelles and permeabilized cells. Methods Mol. Biol. 810, 103–117 10.1007/978-1-61779-382-0_7 [DOI] [PubMed] [Google Scholar]
- 34. Akerman K. E., and Wikström M. K. (1976) Safranine as a probe of the mitochondrial membrane potential. FEBS Lett. 68, 191–197 10.1016/0014-5793(76)80434-6 [DOI] [PubMed] [Google Scholar]
- 35. Tzagoloff A., Akai A., and Needleman R. B. (1975) Assembly of the mitochondrial membrane system. Characterization of nuclear mutants of Saccharomyces cerevisiae with defects in mitochondrial ATPase and respiratory enzymes. J. Biol. Chem. 250, 8228–8235 [PubMed] [Google Scholar]
- 36. Dienhart M. K., and Stuart R. A. (2008) The yeast Aac2 protein exists in physical association with the cytochrome bc1-COX supercomplex and the TIM23 machinery. Mol. Biol. Cell 19, 3934–3943 10.1091/mbc.e08-04-0402 [DOI] [PMC free article] [PubMed] [Google Scholar]
Associated Data
This section collects any data citations, data availability statements, or supplementary materials included in this article.