

Abstract
Aims:
To investigate the association of the GOLD ABCD groups classification with costs and health-related quality of life (HR-QoL) and to compare this with the GOLD 1234 grades classification that was primarily based on lung function only.
Methods:
In a cross-sectional study, we selected patients diagnosed with chronic obstructive pulmonary disease (COPD) from electronic medical records of general practices. Multi-level analysis was used with costs (medication, primary care, healthcare, societal), disease-specific and generic HR-QoL as independent variables. Either the new or the old GOLD stages were included in the analysis together with several covariates (age, gender, living situation, co-morbidity, self-efficacy, smoking, education, employment).
Results:
611 patients from 28 general practices were categorised as GOLD-A (n=333), GOLD-B (n=110), GOLD-C (n=80) and GOLD-D (n=88). Patients in the GOLD-B and GOLD-D groups had the highest prevalence of co-morbidities and the lowest level of physical activity, self-efficacy, and employment. The models with GOLD ABCD groups were more strongly related to and explained more variance in costs and in disease-specific and generic HR-QoL than the models with GOLD 1234 grades. The mean Clinical COPD Questionnaire score worsened significantly, with scores 1.04 (GOLD-B), 0.4 (GOLD-C) and 1.21 (GOLD-D) worse than for patients in GOLD-A. Healthcare costs per patient were significantly higher in GOLD-B (72%), GOLD-C (74%) and GOLD-D (131%) patients than in GOLD-A patients.
Conclusions:
The GOLD ABCD groups classification is more closely associated with costs and HR-QoL than the GOLD 1234 grades classification. Furthermore, patients with GOLD-C had a better HR-QoL than those with GOLD-B but the costs of the two groups did not differ.
Keywords: chronic obstructive pulmonary disease, economics, primary care
Introduction
The assessment, monitoring, and treatment of chronic obstructive pulmonary disease (COPD) have long been driven by the level of airflow limitation. However, emphasis has recently shifted towards a better understanding of the heterogeneity among patients with COPD. This led to the revision of the strategy document of the Global Initiative for Chronic Obstructive Lung Disease (GOLD) in 2011.1 In the 2011 GOLD strategy, COPD is not only classified with the spirometric 1234 grades but also with the ABCD groups.1 According to the ABCD groups, the assessment of COPD is based on symptoms and the risk of experiencing an exacerbation in addition to lung function.1 Low or high symptom burden can be determined using the modified Medical Research Council (mMRC) dyspnoea scale2 (mMRC <2 versus mMRC ≥2) or the COPD Assessment Test (CAT) (CAT<10 versus CAT≥10).3 A low or high risk is based on the history of exacerbations (<2 or ≥2 exacerbations in the previous 12 months) or the forced expiratory volume in one second (FEV1) as a percentage of the predicted value (≥50% or <50%), whichever results in a higher risk. Based on this information, the patient is placed into one of the four ABCD groups. Ultimately, the GOLD classification should estimate current health status, predict future health outcomes, and guide therapy.1
Several studies have investigated the association between the GOLD ABCD groups and health outcomes.4–7 Lange et al.4 investigated the ability of the GOLD ABCD groups to predict the risk of exacerbations and mortality in two Danish general populations combined. However, the FEV1% predicted was based on pre-bronchodilator values, which can overestimate the prevalence of severe COPD. Han et al.5 evaluated the influence of symptom instrument choice on patient category assignment and prospective exacerbation risk by GOLD group in the COPDGene cohort with patients recruited in hospitals. Soriano et al.6 compared the distribution and prognostic validity of the GOLD ABCD groups with the GOLD 1234 grades as predictors of mortality in 11 small Spanish cohorts combined. Agusti et al.7 used the ECLIPSE data to investigate the ability of the GOLD ABCD groups to predict mortality, exacerbations, and hospitalisations. Furthermore, two studies compared the ability of the GOLD 1234 grades and GOLD ABCD groups to predict mortality8,9 and hospitalisations.8 However, none of these studies has used such a wide variation of different disease-specific and generic health-related quality of life (HR-QoL) measurements as we did in our study. Moreover, none has investigated the association with costs. The latter is important information for decision-analytical models that estimate the cost-effectiveness of COPD treatments in different subgroups.
The aim of our study was to investigate the association of the GOLD ABCD groups classification with a wide range of HR-QoL outcomes and cost categories. We compared this with the GOLD 1234 grades classification, which is based on lung function only. The study was performed in patients with COPD recruited in primary care, where the vast majority of patients with COPD are treated.
Methods
Setting
Patients diagnosed with COPD were selected from electronic medical records of general practices (EMR-GP) in the Western part of the Netherlands between September 2010 and September 2011. Participants had a post-bronchodilator FEV1/forced vital capacity (FVC) ratio of <0.7. Patients with terminal illnesses, dementia, cognitive impairment, hard drug abuse, alcohol abuse, or those who were unable to complete Dutch questionnaires were excluded. The general practitioners verified that the included patients fulfilled the inclusion and exclusion criteria. All participants provided written informed consent before participation and the study was approved by the Medical Ethics Committee of the Leiden University Centre.
Data
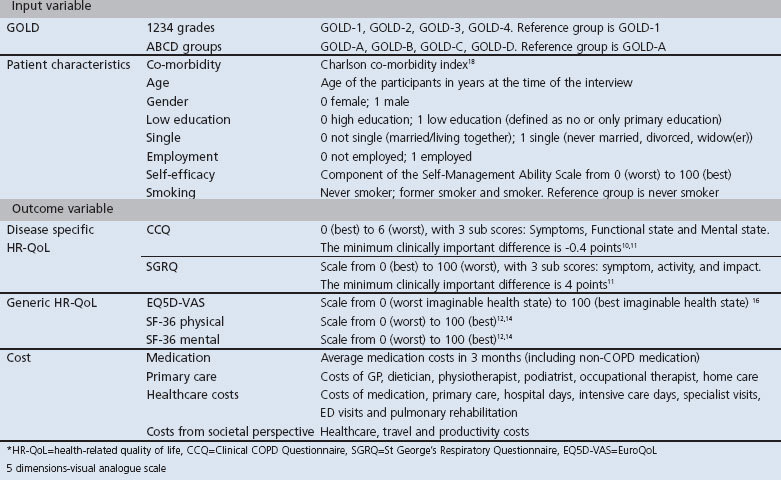
Participants completed the following questionnaires with the support of research nurses: Clinical COPD Questionnaire (CCQ),10,11 St George's Respiratory Questionnaire (SGRQ),12 MRC Dyspnoea Scale,2 Short Form-36 (SF-36),13,14 EuroQoL-5 dimensions (EQ5D) including both the descriptive part and the visual analogue scale (EQ5D-VAS),15,16 and a questionnaire asking about healthcare utilisation, travel expenses, and absence from paid work in the three months prior to completion of the questionnaire. Information on drug prescriptions was extracted from the EMR-GP. EQ5D utilities were estimated using the Dutch value set.17 We collected patient characteristics such as age, gender, co-morbidity,18 education level, marital status, employment status, self-efficacy, and smoking status. Further details are shown in Table 1.
Table 1. Input and outcome variables used in the analysis.
Participants were classified according to both 1234 grades and ABCD groups.1 Low symptom burden was defined as mMRC <2 and high symptom burden as mMRC ≥2. Spirometry data were obtained from the EMR-GP. If spirometry data were unavailable, a respiratory nurse contacted the individual participants for a spirometry test. The number of exacerbations in the previous 12 months was determined according to International Classification of Primary Care (ICPC) registrations in the EMR-GP. Exacerbations were defined as prescriptions for: (1) prednisone with or without antibiotic, unless the ICPC explicitly indicated a reason other than COPD exacerbation; or (2) antibiotics alone with an ICPC description of a COPD exacerbation. A gap of at least 21 days between prednisone prescriptions was used to distinguish subsequent exacerbations and to define different events.
Patient subgroups were created within GOLD-C and GOLD-D (i.e. those at high risk due to low lung function (GOLD-C1 and D1)), a history of frequent exacerbations (GOLD-C2 and D2), or both (GOLD-C3 and D3).
We defined four different categories of costs (medication costs, costs in the primary care sector, total healthcare costs, and total costs from a societal perspective). Medication costs included COPD- and non-COPD-related prescriptions. Primary care costs included costs of consulting with a GP, nurse, dietician, physiotherapist, podiatrist, or occupational therapist, and costs of home care provided by home care organisations. Total healthcare costs included medication costs, costs of primary care plus hospital admissions, consultations with medical specialists, emergency department visits, and pulmonary rehabilitation costs. In addition to the total healthcare costs, the costs from a societal perspective included travel costs of patients to healthcare providers and costs of productivity losses.
Standard unit costs were obtained from the Dutch manual for costing research19 inflated to 2012 values using the general consumer price index.20 The costs of medications were obtained from the GIP-Databank, including taxes and pharmacist dispensing fees.21 The productivity costs were estimated using the friction cost approach, which assumes that productivity loss only occurs during the time it takes to replace a sick employee (the friction period).22 We used a friction period of 115 days.19
Statistical analyses
Descriptive statistics of patient characteristics, clinical measures, HR-QoL, and costs were provided. Continuous variables were summarised as means and standard deviation and categorical variables as frequencies. We used ANOVAs for normally distributed variables, Kruskal-Wallis tests for non-normally distributed continuous variables, and Pearson's χ2 tests for categorical variables to test for differences between the four 1234 grades and ABCD groups; p values <0.05 were considered statistically significant.
We modelled disease-specific and generic HR-QoL as functions of the 1234 grades and the ABCD groups controlling for patient characteristics using linear mixed-effects models. We accounted for the hierarchical nature of the data in these multi-level models with level 1 patient and level 2 general practices. This model was specified for six different outcome variables: CCQ, SGRQ, EQ5D, EQ5D-VAS, SF-36 mental component, and SF-36 physical component. The inclusion of a covariate was based on the likelihood ratio test that is suitable to compare the goodness-of-fit of nested models.23 The following covariates were considered for inclusion: Charlson co-morbidity index, age, gender, low education, employment status, self-efficacy, and smoking status.
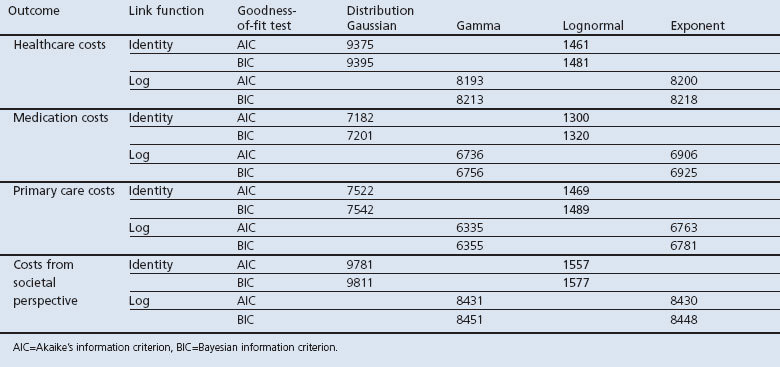
We also modelled costs as a function of the 1234 grades and the ABCD groups. We used a generalised linear mixed model suitable for analysing the right-skewed cost data. The distribution and link function were selected after comparing the goodness-of-fit of models with different specifications of the distribution and link functions. Models that had the lowest Akaike's information criterion (AIC) and the Bayesian information criterion (BIC) were selected. Four cost categories were used as outcome variables: healthcare costs, medication costs, primary care costs, and total costs from a societal perspective.
In all models we used an unstructured covariance matrix since this does not impose a particular pattern on the covariance. To correct for incorrect specifications of the covariance matrix we used sandwich estimators. The AIC compared the goodness-of-fit of the model that included the ABCD groups with the model that included the 1234 grades. Furthermore, the models were compared with respect to the proportion of explained variance measured at the patient level (R12).24 Finally, we tested whether the four ABCD groups statistically differed from each other in the four cost models and the six HR-QoL models.
Results
Descriptive statistics
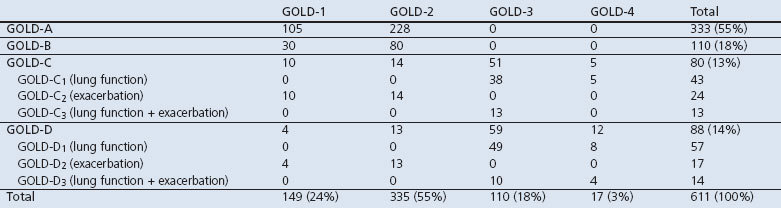
Figure 1 shows the study flowchart. From the 2,006 potential participants, 575 (29%) were excluded by their GP, most of whom (59%) were misdiagnosed. From the remaining 1,431 potential participants, 57% refused to participate in the study. Most of these indicated no reason for refusing (73%), while others expressed no interest (16%) or reported not having troublesome COPD symptoms (5%). In total, we included 611 participants diagnosed with COPD from 28 general practices; 55% were classified in GOLD-A, 18% in GOLD-B, 13% in GOLD-C, and 14% in GOLD-D (Table 2). Patients with low exacerbation risks (GOLD-A and GOLD-B) were mainly former GOLD-2 patients (70%). Patients with high exacerbation risks (GOLD-C and GOLD-D) included those from all former GOLD classes, but were mainly from GOLD-3 (65%). Table 2 shows that the major criterion for classifying patients as high-risk was low lung function.
Figure 1. Flowchart showing inclusion of patients in the study.
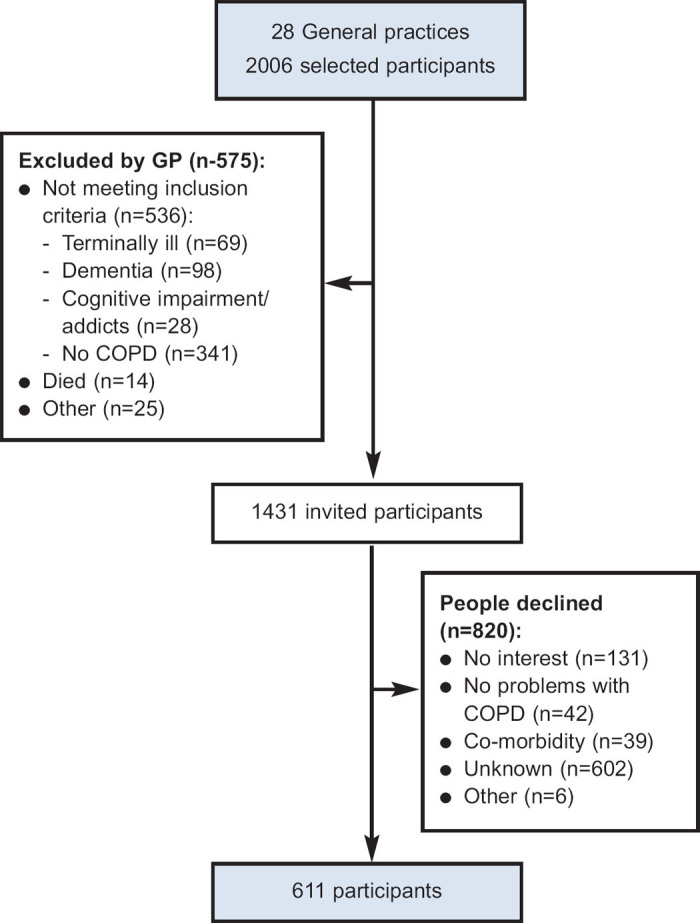
Table 2. Patient sample distributed according to the GOLD 1234 grades and ABCD groups classification.
The sample characteristics, according to GOLD group, are presented in Table 3. Patients with GOLD-B were older, more often single, and had a lower level of education than patients in other groups. GOLD-C had the highest percentage of current smokers (45%) while GOLD-B and GOLD-D had the greatest prevalence of cardiac morbidities, diabetes, and depression in addition to the lowest employment levels, self-efficacy scores, and levels of physical activity.
Table 3. Sample characteristics according to GOLD ABCD groups classification.
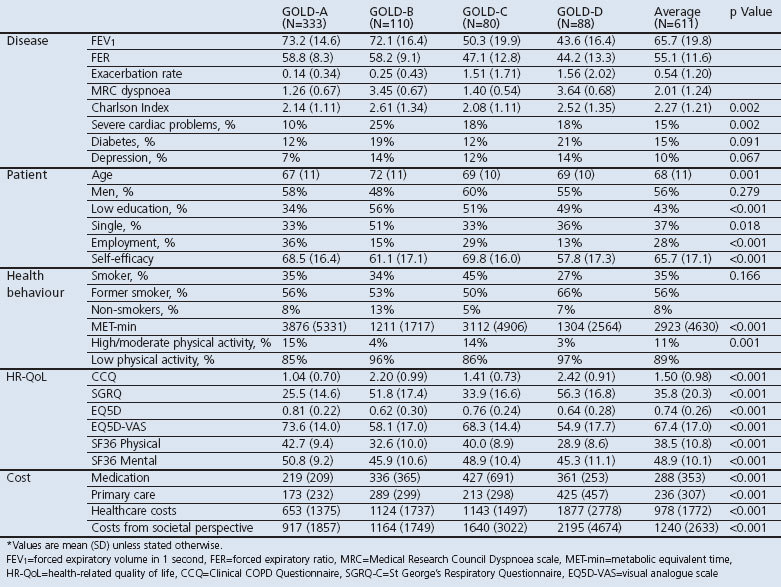
Patients with GOLD-A had the least impaired disease-specific and generic HR-QoL, followed by patients with GOLD-C, GOLD-B, and GOLD-D for all HR-QoL measures. Patients with GOLD A had the lowest costs while patients with GOLD D had the highest.
Association between GOLD classifications and HR-QoL
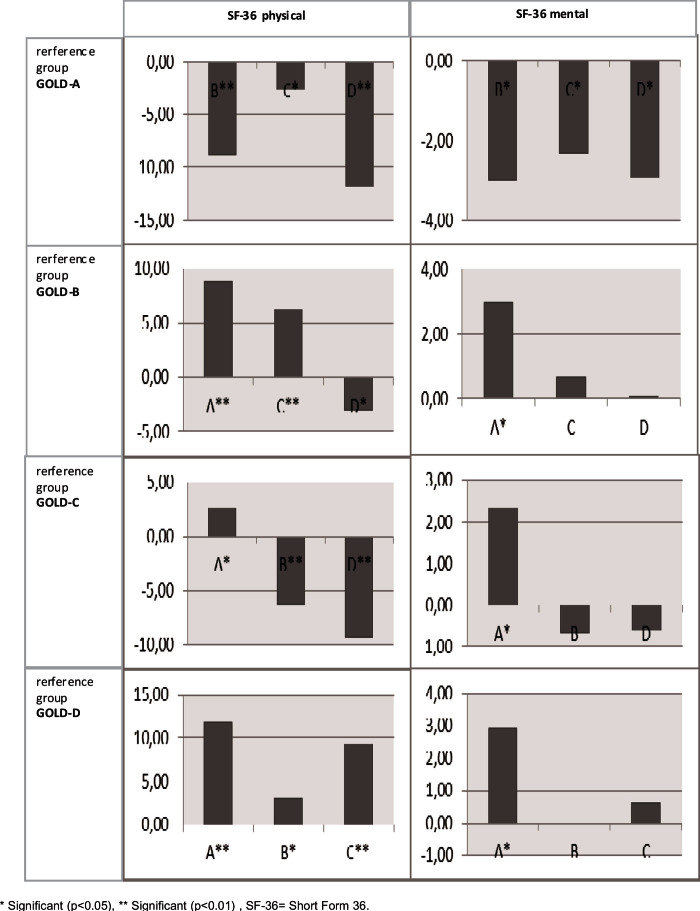
Table 4 shows the results of the multi-level models for HR-QoL. The AIC of the models with the GOLD ABCD groups classification were lower than those with the GOLD 1234 grades classification, indicating a better model fit. Furthermore, these models explained more variance between patients than models with the GOLD 1234 grades classification, as indicated by a higher R2.
Table 4. Health-related quality of life models.
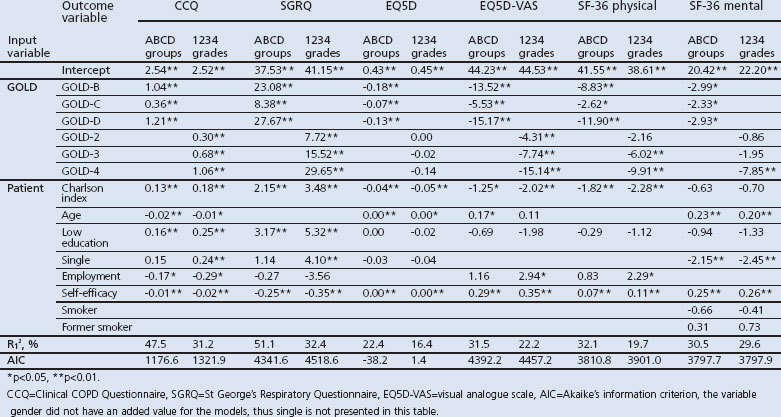
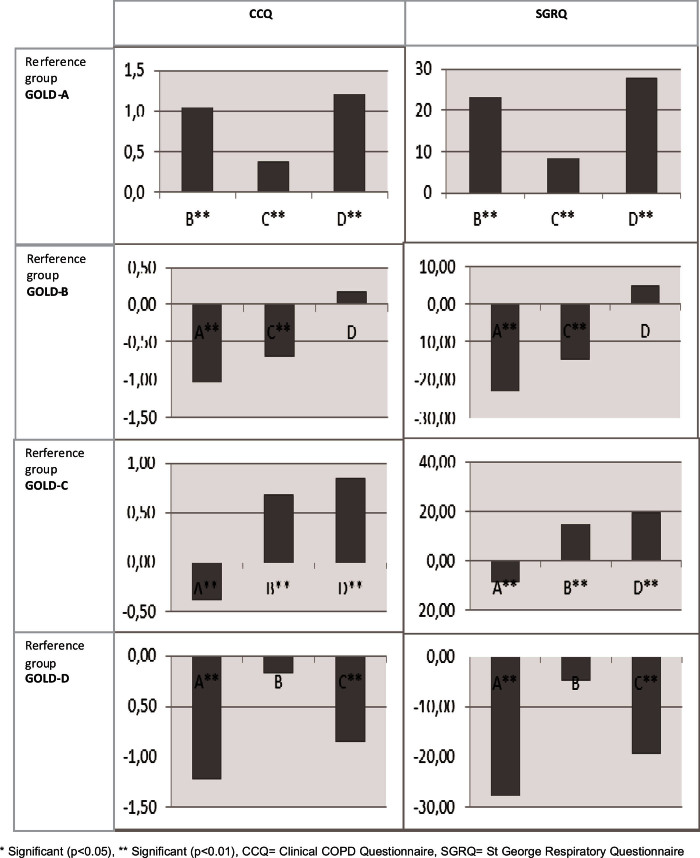
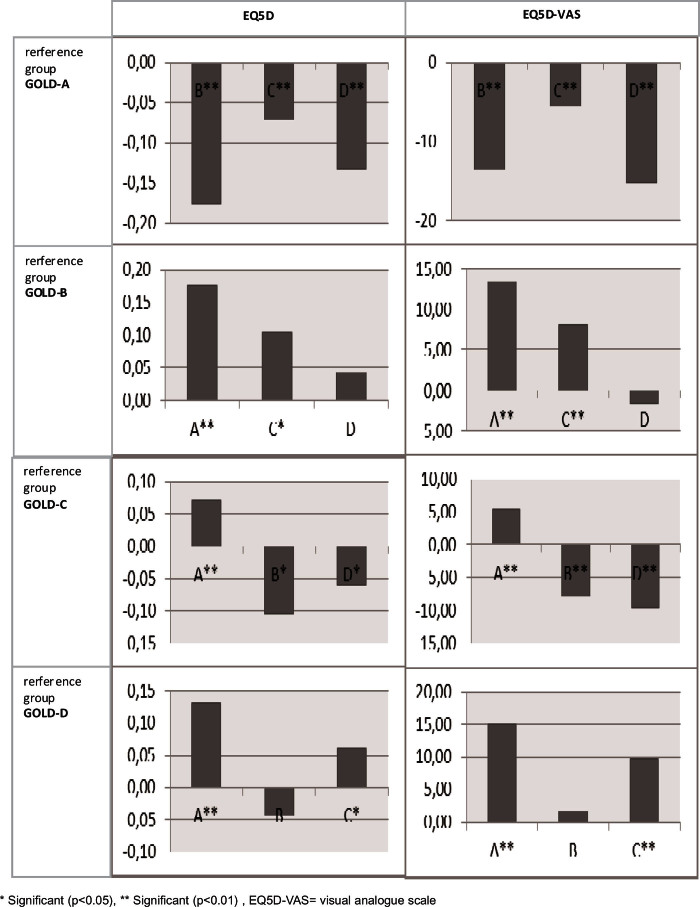
Patients with GOLD-B, GOLD-C, and GOLD-D had significantly worse HR-QoL than those with GOLD-A across all questionnaires after controlling for patient characteristics. For example, the mean CCQ score of patients with GOLD-D was 1.21 worse than the mean CCQ score of patients with GOLD-A. Appendix 1 (available online at www.pcrj.org) shows the pairwise differences from the HR-QoL models, first with GOLD-A as reference category, then GOLD-B, etc. The HR-QoL was significantly different between GOLD-B and GOLD-C, and between GOLD-C and GOLD-D, except for the SF-36 mental component. The difference in HR-QoL between patients with GOLD-B and GOLD-D was only significant for the SF-36 physical component. The GOLD group order, by increasingly impaired HR-QoL, was GOLD-A, GOLD-C, GOLD-B, and GOLD-D.
The GOLD 1234 grades classification showed greater impairment of HR-QoL as GOLD grade increased, but the differences were not statistically significant between GOLD-1 and GOLD-2 in the SF-36 physical component, between GOLD-1, GOLD-2, and GOLD-3 in the SF-36 mental component, or between GOLD-1, GOLD-2, GOLD-3, and GOLD-4 in the EQ5D score.
Association between GOLD classifications and costs
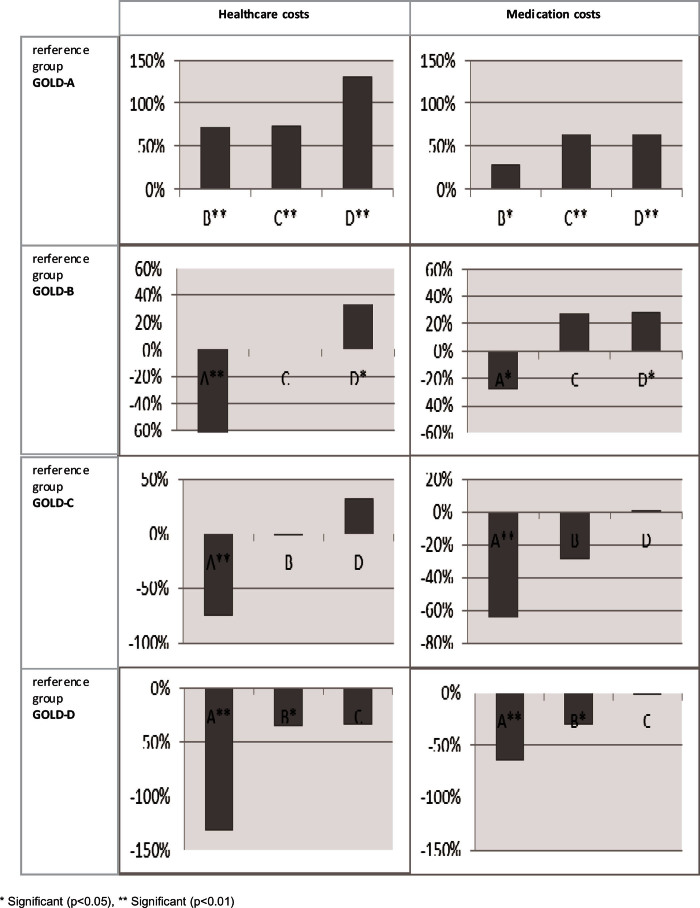
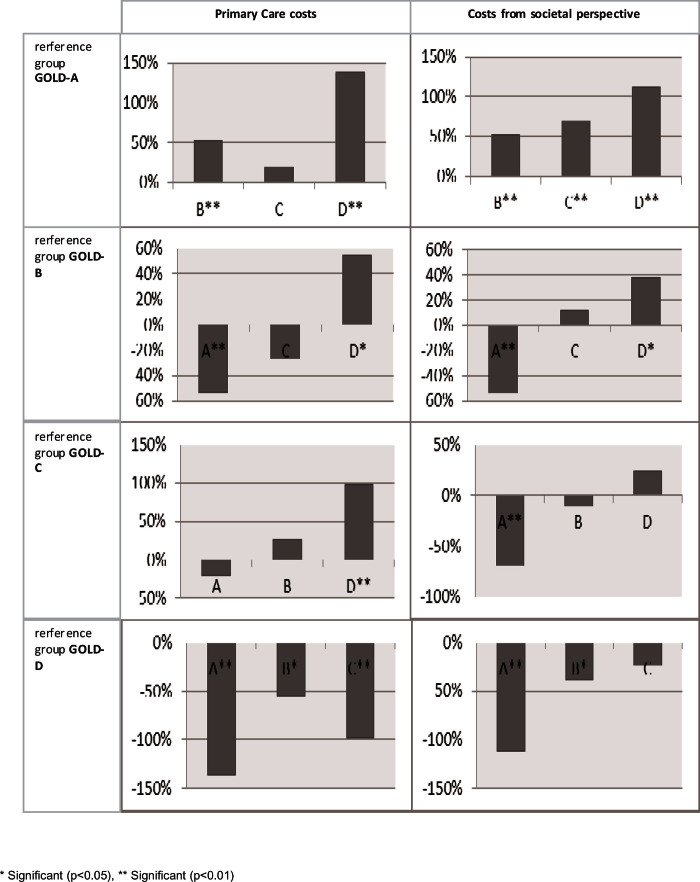
Cost models with a log normal distribution and identity link function showed the best fit (Appendix 2, available online at www.pcrj.org). The estimated β-coefficients from our cost models were transformed into the exponential form, which allows us to interpret them as the percentage of change in costs. Table 5 shows the results of these generalised linear mixed cost models. The AIC of cost models with the GOLD ABCD groups were slightly lower, indicating a better model fit, and they explained more variance than those with the GOLD 1234 grades. This suggests that models using the GOLD ABCD groups classification performed better.
Table 5. Cost models.
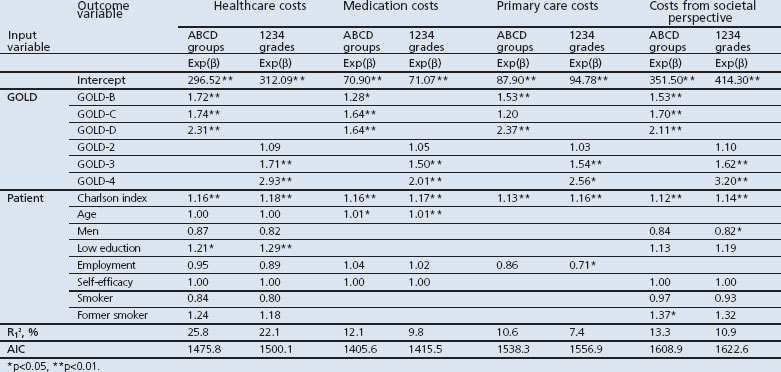
Patients with GOLD-B, GOLD-C, and GOLD-D had significantly higher costs than those with GOLD-A, except for primary care costs. Total healthcare costs were significantly higher for patients with GOLD-B (72%), GOLD-C (74%), and GOLD-D (131%) than for those with GOLD-A. Costs of patients with GOLD-B were similar to those with GOLD-C, but significantly lower than those with GOLD-D (Appendix 3, available online at www.pcrj.org). Overall, the rank ordering of GOLD group by increasing costs was GOLD-A, GOLD-B, GOLD-C, and GOLD-D.
The GOLD 1234 grades classification also showed that healthcare costs increased with increasing GOLD grade (9% higher in GOLD-2, 71% higher in GOLD-3, and 193% higher in GOLD-4 compared with GOLD-1).
Discussion
Main findings
We found that the GOLD ABCD groups classification was more strongly related to HR-QoL (disease-specific and generic) and costs than the GOLD 1234 grades classification. Multi-level analysis of HR-QoL and costs using (generalised) linear mixed models incorporating the GOLD ABCD groups classification consistently explained a higher proportion of the variance between patients and had better goodness-of-fit than models incorporating the GOLD 1234 grades classification.
The rank order of GOLD ABCD groups from best to worst HR-QoL found in this primary care population was: GOLD-A, GOLD-C, GOLD-B, GOLD-D. HR-QoL was better in patients with GOLD-C than GOLD-B, despite higher exacerbation rates and lower lung function. This can be attributed to the higher level of symptoms in GOLD-B, since the results were corrected for a higher score on the Charlson co-morbidity index, lower physical activity level, lower self-efficacy scores, lower educational level, lower employment rate, and a higher proportion of single patients with GOLD-B than with GOLD-C. Moreover, we found that the GOLD 1234 grades classification could not distinguish between GOLD-1 and GOLD-2 with respect to generic HR-QoL. Reclassifying patients with GOLD-1 and GOLD-2 into high (GOLD-B) and low symptom burden (GOLD-A) (Table 2) led to clearer differences in disease-specific and generic HR-QoL. Similarly, the separation of patients with GOLD-3 and GOLD-4 into GOLD-C and GOLD-D led to clearer distinctions in HR-QoL. Patients with lower risk levels had a significantly better HR-QoL than those with a higher risk level, and adding symptom burden to lung function improved the discriminative capabilities of the GOLD classification.
The rank order of GOLD groups by increased costs was: GOLD-A, GOLD-B, GOLD-C, GOLD-D. The GOLD 1234 grades classification could not distinguish between GOLD-1 and GOLD-2, but the GOLD ABCD groups classification did show that costs in GOLD-B, GOLD-C, and GOLD-D differed from costs in GOLD-A. Despite the fact that the model with the GOLD groups explained somewhat more variation in costs, none of the cost categories showed a statistically significant difference between GOLD-B and GOLD-C. Apparently, the higher level of symptoms in GOLD-B did not lead to more healthcare use.
Strengths and limitations of this study
Apart from the wide range of HR-QoL measures and costs used, the strength of our study lies in the large number of patients with COPD from many general practices. The sample covers the entire range of COPD severity and is representative of the Dutch COPD population because we applied few inclusion and exclusion criteria. Although we have recruited patients in primary care, the sample also included patients seen by pulmonary physicians in hospitals. This is because patients referred to secondary care are still included in the GP's records. Our severity distribution (24% GOLD-1, 55% GOLD-2, 18% GOLD-3, 3% GOLD-4) was comparable to the severity distribution previously reported in primary care (27% GOLD-1, 55% GOLD-2, 15% GOLD-3, and 2% GOLD-4).25 Moreover, like other primary care studies,26,27 approximately one-third of our study population had a high symptom burden (mMRC ≥2).
This study has some limitations. One is that healthcare utilisation was self-reported except for prescriptions, which may have led to an underestimation of costs. If this occurred to an equal extent in all four GOLD classes, differences between the four classes are not biased.28 Another limitation is that the exacerbation history was retrospectively obtained from prednisone and antibiotic prescriptions in combination with ICPC codes recorded in the EMR-GP, so mild exacerbations cannot be included. Although these mild exacerbations are unlikely to affect costs, they may affect HR-QoL. A third limitation was that, despite its size (>600 patients), our sample size was still insufficient to allow subgroup analysis within GOLD-C and GOLD-D because most patients had either GOLD-A or GOLD-B. The GOLD-C and GOLD-D groups contain a mixture of patients with a high risk due to a low level of lung function, a history of frequent exacerbations, or both (Table 2). The latter patients are likely to have a worse HR-QoL and higher healthcare costs, but we were unable to confirm this.
Interpretation of findings in relation to previously published work
Since the GOLD strategy revision in 2011, several studies have investigated the distribution and characteristics of the GOLD ABCD groups and their association with outcomes.4–9 Lange et al.4 and Leivseth et al.9 recruited patients in the general population while Han et al.5, Soriano et al.6, Augusti et al.7, and Johannessen et al.8 recruited patients mostly in hospital settings. We recruited patients from primary care, which is most likely the reason why we found more GOLD-C patients and fewer GOLD-D patients than in the latter four studies.5–8 Despite the difference in recruitment setting, our finding that co-morbidities were particularly prevalent in the two ‘high symptom’ groups (GOLD-B and GOLD-D) is in line with previous studies.7,8 Furthermore, like previous reports,4,5 we found that patients were often categorised at high risk of exacerbation because of lung function rather than exacerbation history. Only 30% of GOLD-C patients and 19% of GOLD-D patients were assigned to high-risk groups because of their exacerbation history. Also consistent with earlier studies5,26 was our finding that HR-QoL for GOLD-C patients was better than for GOLD-B patients. Three studies found that three-year survival was similar for GOLD-B and GOLD-C patients,4,6,7 but the results seem to change in the long term because one study found that patients in GOLD-B had a better survival then those in GOLD-C after 10 years of follow-up.6 Two studies concluded that the GOLD ABCD groups classification did not differ significantly from the GOLD 1234 grades classification in terms of predicting mortality6,8 and hospitalisations.8 Moreover, in one study the GOLD 1234 grades predicted mortality better than the GOLD ABCD groups.9
Debates on the GOLD ABCD groups classification are ongoing. For example, it has been suggested that one severe exacerbation requiring hospitalisation should qualify a patient as being at high risk.29,30 In our sample there were only three hospitalisations for COPD exacerbations among the low-risk group in the past three months, one in a patient with GOLD-A and two in patients with GOLD-B. Moving these patients to the high-risk groups would not have changed our results.
Implications for future research, policy, and practice
Whether the GOLD ABCD groups classification will lead to major changes in daily practice is questionable. The GOLD ABCD groups classification certainly raises awareness among physicians that assessment of COPD severity should include multiple components other than lung function. It stimulates patient-centred outcome thinking and is a step towards personalised medicine, although this would also require an integrated assessment of, for example, risk factors, biomarkers, exercise capacity, nutritional status, multi-morbidities, personal goals, illness perceptions, and coping behaviour as is currently advocated by the Dutch Care Standard for COPD.31
The GOLD ABCD groups classification may have consequences for decision-analytical models that aim to assess the cost-effectiveness of COPD treatments. Currently, most of these models are state transition models in which the states are defined by FEV1% predicted and exacerbations. However, these models are also moving towards the simulation of individual patients with different characteristics. Adopting the GOLD ABCD groups classification may be a step towards this, although it still needs to be demonstrated that the cost-effectiveness of treatments indeed varies between the GOLD ABCD groups.
Conclusions
The GOLD ABCD groups classification stimulates a multi-dimensional assessment of COPD severity that appears to be more strongly related to HR-QoL (disease-specific and generic) and costs than the GOLD 1234 grades classification, which was mainly based on lung function. Reclassifying former GOLD-1 and GOLD-2 patients into the GOLD ABCD groups classification clearly led to a greater difference in HR-QoL (disease-specific and generic) and costs between groups. Similarly, separating former GOLD-3 and GOLD-4 patients into GOLD-C and GOLD-D groups led to a clearer difference in HR-QoL. Furthermore, patients with GOLD-C had a better HR-QoL than those with GOLD-B, but their costs did not differ.
Acknowledgments
Handling editor Arnulf Langhammer
Statistical review Gopal Netuveli
Funding This study was supported by grants from Stichting Achmea, a Dutch Healthcare Insurance Company, and the Netherlands Organisation for Health Research and Development (Zon-MW), subprogramme Effects & Costs (project number 171002203). The funding agencies (Achmea Zorgverzekeringen and Zon-MW) had no influence on the analysis and writing of the papers.
Appendix 1. Differences in GOLD group estimated by the disease-specific HR-QoL models as shown in Table 4 with the different GOLD groups as reference category
Appendix 2. Distribution and link function
Appendix 3. Differences in GOLD group estimated by the cost models as shown in Table 5 with the different GOLD groups as reference category
Footnotes
The authors declare that they have no conflicts of interest in relation to this article. NHC is an Associate Editor of the PCRJ, but was not involved in the editorial review of, nor the decision to publish, this article.
References
- Global strategy for the diagnosis, management, and prevention of chronic obstructive pulmonary disease. Revised 2011. http://www.goldcopd.org/uploads/users/files/GOLD2011_Summary.pdf
- Bestall JC, Paul EA, Garrod R, Garnham R, Jones PW, Wedzicha JA. Usefulness of the Medical Research Council (MRC) dyspnoea scale as a measure of disability in patients with chronic obstructive pulmonary disease. Thorax 1999;54(7):581–6. http://dx.doi.org/10.1136/thx.54.7.581 [DOI] [PMC free article] [PubMed] [Google Scholar]
- Jones PW, Harding G, Berry P, et al. Development and first validation of the COPD assessment test. Eur Respir J 2009;34(3):648–54. http://dx.doi.org/10.1183/09031936.00102509 [DOI] [PubMed] [Google Scholar]
- Lange P, Marott JL, Vestbo J, et al. Prediction of the clinical course of chronic obstructive pulmonary disease, using the new GOLD classification: a study of the general population. Am J Respir Crit Care Med 2012;186(10):975–81. http://dx.doi.org/10.1164/rccm.201207-1299OC [DOI] [PubMed] [Google Scholar]
- Han M, Muellerova H, Curran-Everett D, et al. GOLD 2011 disease severity classification in COPDGene: a prospective cohort study. Lancet Respir Med 2013;1:43–50. http://dx.doi.org/10.1016/S2213-2600(12)70044-9 [DOI] [PMC free article] [PubMed] [Google Scholar]
- Soriano JB, Alfageme I, Almagro P, et al. Distribution and prognostic validity of the new GOLD grading classification. Chest 2013;143:694–702. [DOI] [PubMed] [Google Scholar]
- Agusti A, Edwards LD, Celli B, et al. Characteristics, stability and outcomes of the GOLD 2011 COPD groups in the ECLIPSE cohort. Eur Respir J 2013;42:636–46. http://dx.doi.org/10.1183/09031936.00195212 [DOI] [PubMed] [Google Scholar]
- Johannessen A, Nilsen RM, Storebo M, Gulsvik A, Eagan T, Bakke P. Comparison of 2011 and 2007 global initiative for chronic obstructive lung disease guidelines for predicting mortality and hospitalization. Am J Respir Crit Care Med 2013;188(1):51–9. http://dx.doi.org/10.1164/rccm.201212-2276OC [DOI] [PubMed] [Google Scholar]
- Leivseth L, Brumpton BM, Nilsen TI, Mai XM, Johnsen R, Langhammer A. GOLD classifications and mortality in chronic obstructive pulmonary disease: the HUNT study, Norway. Thorax 2013;68(10):914–21. http://dx.doi.org/10.1136/thoraxjnl-2013-203270 [DOI] [PubMed] [Google Scholar]
- van der Molen T, Willemse BW, Schokker S, ten Hacken NH, Postma DS, Juniper EF. Development, validity and responsiveness of the Clinical COPD Questionnaire. Health Qual Life Outcomes 2003;1:13. http://dx.doi.org/10.1186/1477-7525-1-13 [DOI] [PMC free article] [PubMed] [Google Scholar]
- Kocks JW, Tuinenga MG, Uil SM, van den Berg JW, Stahl E, van der Molen T. Health status measurement in COPD: The minimal clinically important difference of the clinical COPD questionnaire. Respir Res 2006;7:62. http://dx.doi.org/10.1186/1465-9921-7-62 [DOI] [PMC free article] [PubMed] [Google Scholar]
- Jones PW. St. George's Respiratory Questionnaire: MCID. COPD 2005;2(1):75–9. http://dx.doi.org/10.1081/COPD-200050513 [DOI] [PubMed] [Google Scholar]
- Aaronson NK, Muller M, Cohen PD, et al. Translation, validation, and norming of the Dutch language version of the SF-36 health survey in community and chronic disease populations. J Clin Epidemiol 1998;51(11):1055–68. http://dx.doi.org/10.1016/S0895-4356(98)00097-3 [DOI] [PubMed] [Google Scholar]
- Ware JE, Jr, Sherbourne CD. The MOS 36-item short-form health survey (SF-36). I. Conceptual framework and item selection. Med Care 1992;30(6):473–83. http://dx.doi.org/10.1097/00005650-199206000-00002 [PubMed] [Google Scholar]
- Brazier J, Roberts J, Tsuchiya A, Busschbach J. A comparison of the EQ-5D and SF-6D across seven patient groups. Health Econ 2004;13(9):873–84. http://dx.doi.org/10.1002/hec.866 [DOI] [PubMed] [Google Scholar]
- Robinson A, Dolan P, Williams A. Valuing health status using VAS and TTO: What lies behind the numbers? Soc Sci Med 1997;45(8):1289–97. http://dx.doi.org/10.1016/S0277-9536(97)00057-9 [DOI] [PubMed] [Google Scholar]
- Lamers LM, McDonnell J, Stalmeier PF, Krabbe PF, Busschbach JJ. The Dutch tariff: Results and arguments for an effective design for national EQ-5D valuation studies. Health Econ 2006;15(10):1121–32. http://dx.doi.org/10.1002/hec.1124 [DOI] [PubMed] [Google Scholar]
- Charlson ME, Charlson RE, Peterson JC, Marinopoulos SS, Briggs WM, Hollenberg JP. The Charlson comorbidity index is adapted to predict costs of chronic disease in primary care patients. J Clin Epidemiol 2008;61(12):1234–40. http://dx.doi.org/10.1016/j.jclinepi.2008.01.006 [DOI] [PubMed] [Google Scholar]
- Hakkaart-van Roijen L, Tan S, Bouwmans C. Handleiding voor kostenonderzoek, methoden en standaard kostprijzen voor economische evaluaties in de gezondheidszorg. 2010.
- Consumentenprijzen: inflatie vanaf 1963. http://statline.cbs.nl/StatWeb/
- GIPdatabank. http://www.gipdatabank.nl/
- Koopmanschap MA, Rutten FF, van Ineveld BM, van Roijen L. The friction cost method for measuring indirect costs of disease. J Health Econ 1995;14(2):171–89. http://dx.doi.org/10.1016/0167-6296(94)00044-5 [DOI] [PubMed] [Google Scholar]
- Verbeke G, Molenberghs G. Linear mixed models for longitudinal data. New York: Springer, 2005. [Google Scholar]
- Snijders TAB, Bosker RJ. Modeled variance in two-level models. Sociol Methods Res 1994;22(3):342–63. http://dx.doi.org/10.1177/0049124194022003004 [Google Scholar]
- Hoogendoorn M, Feenstra TL, Schermer TR, Hesselink AE, Rutten-van Molken MP. Severity distribution of chronic obstructive pulmonary disease (COPD) in Dutch general practice. Respir Med 2006;100(1):83–6. http://dx.doi.org/10.1016/j.rmed.2005.04.004 [DOI] [PubMed] [Google Scholar]
- Steuten LM, Creutzberg EC, Vrijhoef HJ, Wouters EF. COPD as a multicomponent disease: Inventory of dyspnoea, underweight, obesity and fat free mass depletion in primary care. Prim Care Respir J 2006;15(2):84–91. http://dx.doi.org/10.1016/j.pcrj.2005.09.001 [DOI] [PMC free article] [PubMed] [Google Scholar]
- Chavannes NH, Grijsen M, van den Akker M, et al. Integrated disease management improves one-year quality of life in primary care COPD patients: a controlled clinical trial. Prim Care Respir J 2009;18(3):171–6. http://dx.doi.org/10.3132/pcrj.2009.00003 [DOI] [PMC free article] [PubMed] [Google Scholar]
- Hoogendoorn M, van Wetering CR, Schols AM, Rutten-van Molken MP. Self-report versus care provider registration of healthcare utilization: impact on cost and costutility. Int J Technol Assess Health Care 2009;25(4):588–95. http://dx.doi.org/10.1017/S0266462309990432 [DOI] [PubMed] [Google Scholar]
- Wedzicha JA. GOLD and ABCD — a good start, but now for the evidence? Lancet Respir Med 2013;1(1):4–5. http://dx.doi.org/10.1016/S2213-2600(12)70045-0 [DOI] [PubMed] [Google Scholar]
- Vestbo J, Hurd SS, Rodriguez-Roisin R. The 2011 revision of the global strategy for the diagnosis, management and prevention of COPD (GOLD): why and what? Clin Respir J 2012;6(4):208–14. http://dx.doi.org/10.1111/crj.12002 [DOI] [PubMed] [Google Scholar]
- LAN. Zorgstandaard COPD. Amersfoort: Long Alliantie Nederland; 2010. [Google Scholar]