

For top-down proteomics, the search context includes the observed MS data, the database and search engine used, and the search parameters. For accuracy, FDR estimation should be determined for each search context. Further, FDR depends on the molecular level reported; PrSM, proteoform or protein. Failure to consider context resulted in FDRs in error by ∼24-fold from the stated level for four contexts we examined. TDCD_FDR_Calculator is a free tool to perform Context Dependent FDR calculations to enhance top-down proteomics.
Keywords: Algorithms, Post-translational modifications*, Statistics, Automation, Mathematical Modeling, False Discovery Rate, Multiple Hypothesis Testing, Proteoform, TDCD_FDR_CALCULATOR, Top-Down Proteomics
Graphical Abstract
Highlights
To correctly estimate FDR, search context should be considered.
FDR is computed at the molecular level reported; e.g., proteoform or protein.
Failure to correctly estimate FDR results in >20-fold errors for the data we studied.
TDCD_FDR_Calculator is a free tool providing accurate, conservative FDR estimation.
Abstract
Within the last several years, top-down proteomics has emerged as a high throughput technique for protein and proteoform identification. This technique has the potential to identify and characterize thousands of proteoforms within a single study, but the absence of accurate false discovery rate (FDR) estimation could hinder the adoption and consistency of top-down proteomics in the future. In automated identification and characterization of proteoforms, FDR calculation strongly depends on the context of the search. The context includes MS data quality, the database being interrogated, the search engine, and the parameters of the search. Particular to top-down proteomics—there are four molecular levels of study: proteoform spectral match (PrSM), protein, isoform, and proteoform. Here, a context-dependent framework for calculating an accurate FDR at each level was designed, implemented, and validated against a manually curated training set with 546 confirmed proteoforms. We examined several search contexts and found that an FDR calculated at the PrSM level under-reported the true FDR at the protein level by an average of 24-fold. We present a new open-source tool, the TDCD_FDR_Calculator, which provides a scalable, context-dependent FDR calculation that can be applied post-search to enhance the quality of results in top-down proteomics from any search engine.
Accurate and efficient false discovery rate (FDR)1 determination of protein and proteoform identifications is needed to improve top-down proteomics for large-scale, automated proteoform discovery (qualitative analysis) and relative quantification (quantitative analysis) (1–2). Discovery top-down proteomics uses LC-MS/MS to analyze complex samples to determine the proteoform composition without protease digestion and employs various search algorithms to identify proteoforms.
Over time, the community of bottom-up proteomics has developed more accurate, global FDR solution that scales well (3). A very large scale 2014 study found 18,097 protein entries from multiple parts of the human body (4), whereas a subsequent reanalysis with a more accurate estimation of a 1% FDR at the protein level revised this number down to 15,375 protein entries (5). A major complexity in bottom-up is the “protein inference problem” where individual peptides can be shared between different highly related proteins of different genes, isoforms and proteoforms of a single protein (6). This gives rise to the need for bottom-up to report protein groups. Systems developed for bottom-up FDR estimation (7–10) do not consider the individual molecular levels discovered by top-down (Fig. 1) and thus cannot be used in this context. Likewise, the targeted top-down analysis tools that have been available for many years (11–12) are optimized for expert-driven manual validation of the search results of one or a few Spectra. These tools provide several different search strategies (13–14) but the accuracy of FDR determination is yet understudied and not regularized with the community.
Fig. 1.
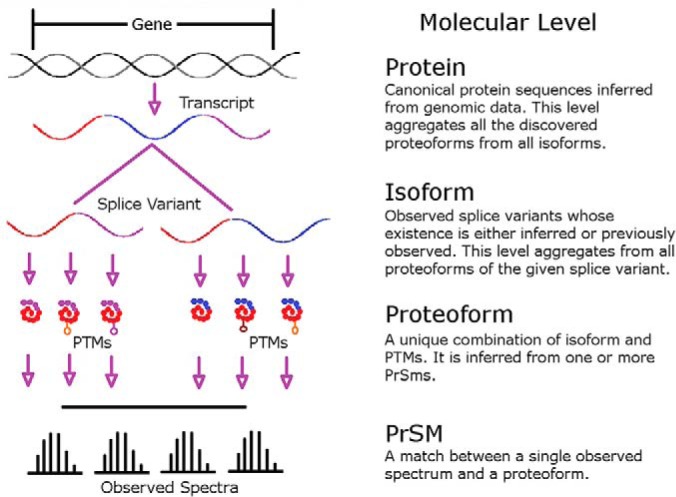
Molecular Levels Explained. Within a cell, a gene is transcribed, spliced, translated, and modified. This results in proteoforms that are the observable molecular entities for top-down. Therefore, spectral matches returned from a search engine reports on the existence of a complete proteoform. When controlling FDR at the proteoform level, all PrSMs reporting on the proteoform must be aggregated together in order to put confidence on the existence of the proteoform in the material under investigation. Likewise, all proteoforms of a given isoform must be considered when establishing confidence in the existence of the isoform. Lastly, all supporting proteoforms from all isoforms must be considered when drawing conclusions on the existence of the protein.
In high-throughput top-down proteomics, search algorithms function by scoring the match between a set of theoretical proteoforms and an observed set of MS1 and MS2 data. As in bottom-up proteomics, the MS1 and MS2 data object in top-down will here be referred to as a Spectrum, and it contains both intact and fragment masses. Likewise, a match between a Spectrum and a theoretical proteoform can be called a Proteoform Spectral Match (PrSM) (Fig. 1). Typically, spectral data are converted to the neutral mass regime (15); this is true even for most spectral alignment approaches (16–17). Matches between Spectra and theoretical proteoforms, PrSMs, can then manually validated by mass spectrometerists to determine which proteoforms are present in the sample. Although this approach is very labor intensive and subject to human interpretation, it has been used successfully in the past (1–2). Although automating this process will greatly accelerate the field of discovery top-down proteomics, it will also require calculating a reliable FDR.
In the usage of proteomics, proteoforms are not the same thing as proteins; (18) see Fig. 1. Proteins represent a collection of expressed proteoforms, and although the proteoform is a form of a given protein, a protein is usually expressed as multiple proteoforms. Each measured proteoform results from a series of molecular processing events starting with transcription and ending with post-translational modifications. Each gene typically is associated with a canonical amino acid sequence. This sequence is often different from that observed in biological samples: there may be different alleles or coding SNPs creating sequence variants, transcripts from a given gene can be alternatively spliced to form multiple isoforms (19) which also translate into different amino acid sequences, and proteoforms can have covalently-attached, site-specific features enzymatically added to form post-translational modifications (PTMs). The sum of these events leads to a population of multiple molecules, each being a unique proteoform (18). An expressed protein is the population, or family, of its expressed proteoforms (20). This is further complicated by isoforms. Some proteins, such as the human high mobility group protein (P17096–1 and P17096–2) come in multiple isoforms. These isoforms have differing amino acid sequences and different modifications (21). In systems where a confidence metric specifically at the isoform level is desired, FDRs can now be calculated for this purpose. However, we expect that most studies will focus mainly on protein and proteoform-level FDR values.
The concept of an expressed protein exists to help us simplify the complexity associated with understanding biological function at the molecular level and has worked well for bottom-up proteomics. But, the presence of multiple proteoforms arising from a single gene makes the concept of an expressed protein more complex, as it is the proteoforms that are expressed. Although unmodified protein sequence as directly encoded by a gene are frequently expressed in bacteria, in eukaryotes this appears to occur less often than the expression of modified sequences. (For example, in one study (21) only 106 of 1046 or 10.1% of the discovered proteoforms are unmodified, whereas the Catherman data set presented below has only 4.5% unmodified proteoforms.) This duality, that the protein entity encoded by a gene is rarely expressed, while modified proteoforms more commonly occur in the physical world, complicates FDR determination in top-down proteomics.
Observing proteoforms is further complicated by issues of identification and characterization. To avoid confusion, the term Protein Identification is simply the act of assigning a gene product to a gene, or in practice to a protein accession in a gene-centric protein knowledgebase. It should be noted that there may or may not be data that allow the exact determination of proteoforms with complete molecular specificity. Thus, a protein may be identified as present in a sample even if no proteoforms are fully characterized. In contrast, full characterization only occurs when the molecular specificity of a proteoform can be determined within the context of the search. Proteoforms containing unknown mass shifts, or incompletely localized PTMs are said to be partially characterized. In top-down proteomics, it is less useful to discuss characterizing an isoform or protein, except in the case of very simple systems where there is only a single proteoform produced by a given gene.
Identification can occur at three independent molecular levels (Fig. 1). The protein entry is a gene-level identification and is denoted with an accession number to a gene-centric database like UniProtKB (22–23), whereas a proteoform identification refers to one combination of modifications with a single primary structure. A proteoform should be reported with an accession number from a proteoform-centric database like the one maintained by the Consortium for Top-Down Proteomics (24). Between the protein entry and proteoform level, there exists an isoform entry level. Identifying an isoform means that there is evidence for the presence of a given sequence arising from alternative splicing or translational start site in the sample, independent of which PTMs might be present.
Top-down search engines assign a numeric score to the degree of matching between a Spectrum and a candidate proteoform. ProSight (11) uses the P-score (12). This score is a nonlinear transformation of the number of fragment ions matching between the candidate proteoform and the PrSM, where the non-linear response is governed by the search parameters. Well-suited for targeted studies, this score allows gene-level identification but cannot automatically distinguish partial characterizations, a shortcoming alleviated by the C-score (25). Other search engines use other scoring approaches (e.g. TopPIC reports p values and E-values, Informed Proteomics reports Probabilities (sic) and E-values) (16–17, 26).
The fundamental problem, regardless of search engine, is determining when a continuous score (i.e. one that can have continuous values over a given range) is sufficiently good to allow the assertion that the Spectrum represents a specific proteoform. The search engine returns a set of putative discoveries which can be ranked by score from best to worst, and a cutoff can be found which determines the so called “selected discoveries.” Ideally, the cutoff separates true discoveries from false discoveries. The level of this cutoff must be determined by the needs of the individual experiment. For example, studies interested in biomarker discovery (27) may set a more permissive proteoform level FDR, whereas studies looking for protein expression differences in specific brain regions (28) may set a more stringent 1% protein level FDR. Burger has recently reviewed this process in the context of bottom-up proteomics (6).
The distribution of scores will vary with the context of the search. The context is defined here as the set of the Spectra searched, the database searched against, the search engine, and parameters used. To determine if a score is enough to allow identification, for a given context, we need to infer the null distribution of the score within that context (6). The null distribution is an unknown probability distribution associated with a context that reports the probability of a given score (or better) occurring by chance alone.
One approach to inferring the null distribution is to reverse or scramble the searched database such that none of the candidate proteoforms in the new decoy database could represent real ions measured by the observed Spectra. Then, by duplicating the search context against this decoy database, any PrSMs returned are known to be false, and are called Decoy PrSMs. The distribution of these false scores can then be used as a surrogate for the null distribution (29).
Two approaches, parametric and non-parametric, have been used to determine the PrSM-level FDR from a decoy distribution. With a non-parametric approach, for a given list of PrSMs, the FDR is a function of the number of Decoy PrSMs scoring equal to or better than the observed Forward PrSM (29–30). A parametric FDR attempts to model the distribution of Decoy PrSMs. This can be done by itself (31), or coupled with expert-driven manual validation (21, 32). Both parametric and non-parametric approaches have their strengths and weaknesses. Non-parametric approaches are more robust against irregularities in the decoy distribution but fail to provide any information about the FDR associated with Forward PrSMs scoring above the best Decoy PrSM. Likewise, parametric solutions suffer from errors in correctly modeling the null distribution but provide FDR information about all Forward PrSMs.
Tools using non-parametric approaches are availible (17, 26). These tools use a model-free approach to empirically estimate null distributions and control the FDR at the PrSM level. Such a non-parametric system has been used by early versions of the TDPortal, a customized Galaxy search portal (33) available through the National Resource for Translational and Developmental Proteomics (27, 34–35). The TDPortal is the first top-down tool to control FDR at not just the PrSM level, but also at the proteoform, isoform, and protein levels.
Here we present a logical structure for calculating an identification FDR at the proteoform, isoform, and protein level using PrSMs from their given search context. We supply software for performing this calculation, and a large set of curated spectral results as training data. We show that the FDR functions and scales correctly on the training data and on previously published results.
EXPERIMENTAL PROCEDURES
Overview
An algorithm for calculating the context-dependent FDR (CD FDR) associated with PrSM, proteoform, isoform, and protein identification was developed. This algorithm uses a non-parametric FDR for identification but enhances this with a parametric FDR for all those molecular entities identified with a score better than the best decoy score. The algorithm calculates a separate decoy distribution at each molecular level encountered in top-down proteomics. A training dataset with 546 manually validated PrSMs was built from data from two representative publications from two different laboratories (25–26) TDCD_FDR_Calculator, software to implement the algorithm on search engine output, was developed and tested against the training dataset. Both the training datasets and the TDCD_FDR_Calculator tool are made available and described in detail below.
Non-parametric Estimation of FDR
Prior to FDR calculation, each spectral data file was deconvoluted and deisotoped. Here the algorithm was tested on ProSight Absolute Mass (36), ProSight Biomarker (36), and Informed Proteomics MSPathFinder (26), and was designed to work with results from any top-down search engine. Following the specifications for TDCD_FDR_Calculator, comma separated value (CSV) files were used for input, one for each LC-MS/MS run.
The following outline of the method for calculating CD FDR was implemented
1. Search Spectra and Pool Resulting PrSMs
All Spectra from a given run are searched separately within a single context and the resulting PrSMs are pooled across the entire experiment. The Spectra are searched against both a forward and a decoy database. Here, a decoy database was created by scrambling each isoform sequence in the forward database and then shotgun annotating all encoded PTMs at the amino acid residue of their original location. Other database scrambling strategies are possible, and the system presented here will accept any user-defined strategy.
PrSMs are defined as Spectra that match a proteoform with at least one MS2 fragment ion. Each ProSight PrSM is returned from the search engine with two scores; a P-score (12) that uses a Poisson model to estimate the probability that the Spectrum derives from a proteoform associated with a given gene-level entry, and a characterization score (25) that measures the uniqueness of the Spectrum's match relative to the other entries in the database. Each Informed Proteomics PrSM is returned with an E-value, and an FDR value, q, which we refer to as the PrSM-level FDR.
From here forward, different calculations are performed depending on the molecular entity under consideration (Fig. 1); thus, when calculating a proteoform CD FDR, only proteoforms associated with PrSMs are considered, and for protein CD FDRs only protein entries associated with PrSMs are considered.
2. Determine Context-Dependent Score for each Entity
Multiple PrSMs can support the existence of a given molecular entity within a run. However, each entity must be assigned a single score to represent it for downstream processing. This algorithm uses the best score from the set of PrSM scores. For example, at the proteoform level, multiple PrSMs may report on the same proteoform, but the PrSM with the best score (with the lowest score in the case of the P-score) is selected as the proteoform's score. The same follows at the protein level. The best score represents the protein from all the PrSMs that report on it. The same logic is used on both forward and decoy results.
3. Estimate Posterior Probability for each Forward Entity using Decoys
The scores from decoy entities are used to estimate the corresponding null distribution. Using a non-parametric approach, a posterior probability is derived for each molecular entity (PrSM, proteoforms, isoforms, and proteins) by counting the proportion of decoy to forward entities scoring better than the forward entity in question (37–38) This proportion is taken as the probability of a false identification. Note that one is added to both the rank (r) and total (n) of the decoy entity when calculating the posterior probability (30), giving r+1/n+1.
4. Filter Forward Entities before Multiple Testing Correction
The posterior probability determined from the decoy null distribution is an estimate of the probability of the Forward entity scoring as well as it did or higher because of chance alone. Yet, this probability does not consider the multiple hypothesis testing issue associated with testing a set of forward entities. As more forward entities are interrogated, the standard of evidence required for each entity increases. For this reason, it is useful to filter obviously incorrect results from the forward entity list. We require the best supporting PrSM for an Absolute Mass search to have at least 3 matching fragments, 6 for a Biomarker search, and an E-value less than 1 for MSPathFinder. This represents a heuristic rule for the minimum amount of supporting evidence required to accept an identification, regardless of its PrSM-level FDR.
5. Apply Multiple Testing Correction to obtain q values
The posterior probability scores for each molecular entity are then corrected for multiple testing (39). The critical p values derived from the Benjamini and Hochberg calculation are converted algebraically to q values (q) by multiplying the posterior probability (p) by the total number of forward entities (n) and dividing by the entity's rank (r), giving q = p × n/r. This value is the q value and represents the FDR for the entire study set at each molecular level.
6. Take Characterization into Account when Reporting Proteoforms
To avoid misrepresenting proteoform discoveries, some care should be taken to separate instances of partial characterizations from fully characterized proteoforms. Here, proteoforms from ProSight searches with a C-score greater than 40 are considered characterized and included in characterized proteoform counts (25). It should be remembered that with all search engines, proteoforms are only characterized within the context of the search. There is always the possibility that there exists another proteoform that could explain the observed data.
Aggregation to higher molecular levels: Note that Steps 2 to 6 are performed separately for each molecular level. Thus, the list of proteoforms with a CD FDR of 1% is different from the list of proteins with a CD FDR of 1%. Care must always be taken to refer correctly to each list. As a default, we anchor proteoform reporting to those that map to identifications matching a 1% CD FDR at the protein level (27–28).
Enhanced FDR: Parametric Estimation of FDR
The non-parametric estimate of the q value is robust and can estimate the FDR even in the presence of any unknown issues within the search context. Unfortunately, it provides no estimation of the q value for entities where the best scoring PrSM is better than the best decoy. In this case, the posterior probability is simply less than the reciprocal of the total number of decoy PrSMs considered. For example, if there are one thousand decoy PrSMs, any forward PrSM scoring better than the best decoy PrSM can only be said to have a posterior probability less than one in one thousand. This is enough for generating lists of identified proteoforms, but it fails to show increasing support for forward PrSMs with better scores.
If desired, a parametric model can be fit to the null distribution, and an FDR estimate calculated for entities scoring beyond the highest scoring PrSM. TDCD_FDR_Calculator fits a gamma distribution to the null data and uses the area under the curve from the forward PrSM to infinity as the parametric estimate of the posterior probability. The tool only provides these for entities scoring better than the best decoy PrSM. These scores are reported as the Enhanced FDR. Note, that even if the parameterized model is skewed, these best forward results will preserve their relative rankings (e.g. a result with a q value of 10−80 has superior information content than one with 10−40) and can be used for downstream processing such as gene-set enrichment analysis.
Manual Spectral Validation
Training data sets with known results are a useful approach to validating FDR calculations (40). With sufficiently large datasets, validating an FDR requires nothing more than verifying that the number of false and true positives are in the correct ratio. To build such a training dataset, the ProSight and MSPathFinder search engines were used to generate a list of candidate proteoforms (detailed below). Each spectra supporting each proteoform was then compared with theoretical isotopic distributions (both MS1 and MS2) generated using Mercury7 (41). A set of experts in top-down mass spectrometry then confirmed the matching PrSM using experience and a set of standardized metrics (Table I). This involves a careful examination of the averaged precursor spectrum, the averaged fragmentation spectrum, and plausibility of the proteoform candidate itself in a given biological context (e.g. the protein and proteoform levels). TDValidator (Proteinaceous Inc., Evanston, IL) was used to assist with most of the expert driven validation (42).
Table I. Criteria for Manual PrSM validation.
| Section | Metric | Heuristic |
|---|---|---|
| Precursor | Number of charge states | More charge states are better |
| Abundance | Higher is somewhat better | |
| m/z Shifts | Check for the isotopic envelope shifts, either consistently or randomly | |
| Fragments | Number of fragments | More is better |
| Location of fragments | Consecutive fragments and “golden” pairs (e.g. B and Y ions at the same position) carry more weight | |
| Preferred fragmentation | Certain fragmentation methods have preferred sites (e.g. d-P for HCD) | |
| % Ion current explained | Higher is better, but not required (co-isolation) | |
| Consistent m/z shifts | Matching error of fragments from a single spectrum should be normally, not uniformly, distributed | |
| Duplication | Check for ions counting twice (e.g. mass of B40 = mass of Y41 within tolerance) | |
| Candidate | Number of modifications | Generally, less is better |
| Types of modifications | There are tiers of modifications, where some are just more common than others | |
| Other hits, same search | Seeing the same candidate elsewhere lends support | |
| Known homology | If the candidate belongs to a family with many similar sequences (e.g. histones) ensure that another family member isn't better | |
| Family of modified forms | If one sees a highly modified form, there should also be other modified forms |
Construction of Training Set
The training set was constructed using data acquired from two laboratories and using different search engines. For each Spectrum in the set, an mzML file was generated that contains all the MS1 and MS2 scans involved. There is also a summary CSV file for each result set that maps the mzML files to the proteoform found, and a copy of the RAW data files.
From Catherman et al. 2013: Tandem MS data were acquired in the course of a previously published study on human proteins (32, 43) Briefly, in that study mitochondrial membrane proteins were isolated from H1299 cells and separated using a GELFrEE 8100 Fractionation system (Expedeon). Data from a single GELFrEE fraction containing ∼15–20 kDa proteins (with 846 MS1 and 889 MS2 spectra) were selected and Spectra were manually created by combining multiple MS1 and MS2 scans. Each Spectrum was then searched against ProSight Warehouses (.pwf files) originally built from UniProt release 2012_02 of the human proteome. Spectra with a single MS1 precursor and a single, unambiguous “correct” proteoform result were selected and verified by at least two practitioners trained in top-down proteomics data analysis, to be considered as true answers. This process resulted in 429 Spectra that show evidence for 193 unique proteoforms and 164 unique protein entries, all of which were considered true positives.
Park et al. Validated Results: Park et al. (2017) provide an ovarian tumor replicate run containing 1147 MS1 and 6882 MS2 spectra. Of the 359 protein entries (3042 Spectra) identified at 1% FDR in the manuscript (Fig. 6 of Park et al. (26)), 117 were unique to Informed Proteomics when compared with the TDPortal. These 117 protein entries and their corresponding Spectra were manually validated as above. This yielded 95 true positive and 22 true negative protein entries. In addition, further manual validation was done to generate Fig. 3A to 2% FDR.

Fig. 3.
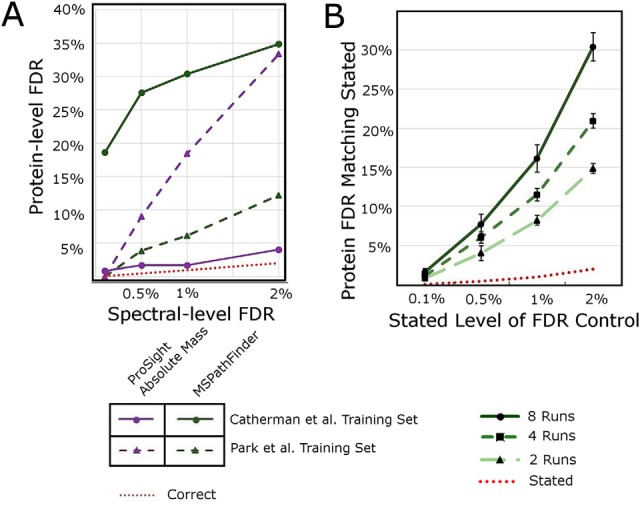
Loss of Control on Protein-level FDR with Naïve PrSM-level FDR Calculation. A, Relationship between PrSM-level FDR and Protein-level FDR for ProSight Absolute Mass search (AM) and MSPathFinder (PF) on two datasets. For each point, the x axis is the PrSM level FDR and the y axis is the corresponding protein level FDR that is achieved if the PrSM FDR is used for the study. For example, when MSPathFinder is searched against the “golden” dataset, and a 1% FDR is accepted at the PrSM level, nearly 30% of the discovered proteins are false. ProSightPC does not offer an FDR calculation, so the purple lines represent the protein-level FDR that would be achieved had ProSightPC naïvely calculated protein-level FDR as a PrSM-level FDR. B, The effect on protein-level FDR with interrogating increasing numbers of LC-MS/MS runs. Loss of FDR control for random subsets of increasing numbers of LC-MS/MS runs was estimated as described in the text. Either two or four files were selected at random at treated as if they were the entire dataset for the study. Error bars represent the Standard Error of the Mean from 5 replicate samples drawn from 10 runs in the Quantitative study of Park et al. As the number of LC-MS/MS files in a study increases, the loss of control on protein level FDR also increases.
Included with the training set, but not used here, are 2705 mzML files with corresponding protein identifications which are the Spectra from the ovarian tumor replicate from Park et al. (2017) that were also found by the TDPortal v3.0. These results represent a 1% FDR, with the TDPortal using the CD FDR described here.
TDCD_FDR_CALCULATOR Software Tool
The top-down context-dependent FDR calculator application, TDCD_FDR_Calculator, and source code perform the FDR calculation detailed here. It was implemented in C# 7.0 using Microsoft Visual Studio 2017 Update 4 and run with a .NET Core 2.0 console application. The Gamma fitting portion depends on version 3.20 of the MathNet.Numerics Nuget package. Three arguments are required: a path to the sorted forward data, a path to the sorted decoy data, and a path to write the output. The input files must be CSV files where the first column is a generic text tag and the second column is a score (where larger is better, sorted ascending). The output CSV will be the same as the forward input file, but with two additional columns: non-parametric q value and Enhanced q value. The source code for this open source tool is available at: https://github.com/NRTDP/TDCD_FDR_Calculator.
RESULTS
In discovery top-down proteomics, each context (the combination of spectra, database, and search parameters) has a unique search space. Further, each molecular level in this search space has its own decoy distribution of scores (Fig. 2). Within a given context, the silhouette of a decoy distribution will be similar between proteins and proteoforms, but they are not identical. This difference comes from multiple PrSMs supporting a single proteoform, and multiple proteoforms supporting a single protein. There is always more decoy information available to estimate the null distribution of proteoforms than for isoforms, and more information on the null distribution of isoforms than proteins.
Fig. 2.

Decoy Distributions by Context. Every Context yields a unique distribution of decoy scores. Shown here are protein-level (in green) and proteoform-level (in gray) decoy distributions for three search Contexts using the Park et al. training data set. A, shows the distribution from MSPathFinder searching the Human FASTA dataset used in Park et al. (downloaded from SwissProt 2015–10−14). This contains 20,197 unannotated protein sequences with no isoform or PTM information. B, shows a ProSightPC Biomarker search against the same FASTA file as A. Notice the overall lower decoy density and the presence of a single high-scoring decoy hit. This causes the decoy distribution to appear to be shifted to the left. C, shows the distribution of decoy scores for a ProSightPC Absolute Mass search against a highly annotated human database (Downloaded from Swissprot 4/2016, with 20,155 proteins, 42,317 isoforms, and 319,264 annotated isoform features such as PTMs and cSNPs). Both the PrSM and Protein-level decoy distributions from three search engines run on the same spectral input from validated Park et al. data are shown. Light gray background is the PrSM-level decoy distribution compared with the corresponding Protein-level decoy distribution in green. Each search engine provides a different range of values on the X-axis, so scores are scaled from lowest to highest value in that search context. Notice that each search context provides a different distribution.
The consideration immediately above implies that it is best practice to generate an FDR calculation specific to each molecular level shown in Fig. 1 (i.e. protein, isoform, etc.). The list of proteins discovered with a 1% FDR is not the same list as the list of proteins resulting from PrSMs discovered at a 1% FDR. The latter list will have a higher FDR at the protein-level than the former, and this difference can be quite striking. For example, the data used in the training set from Park et al. yields 298 proteins when aggregated with a 1% protein level CD FDR, but there 324 proteins when aggregated at the PrSM level and naïvely merged. The latter would yield an effective 8.0% FDR while appearing to have a 1%, an 8.0-fold error in FDR.
A training set with known correct answers was created from two recently published manuscripts. This allowed the magnitude of the loss of control on FDR to be observed. The training dataset contains 546 mzML files where each file containing a single Spectrum, and a spreadsheet of correct proteoform identifications and corresponding search engine scores. These represent 524 expertly validated proteoform identifications, and 22 true negatives, as described above. All files can be downloaded from MassIVE: https://massive.ucsd.edu/ProteoSAFe/dataset.jsp?task=bced230c79f849c3bd87a10e08c929fb.
Using the training dataset, it is possible to determine the true FDR for a given search context and assess the quality of FDR estimation within a given context or tool used for searching and scoring in top-down proteomics. Fig. 3A shows that for four contexts, each responds differently to increasing FDR cutoff levels (0.1%, 0.5%, 1 and 2%), yet in all cases the protein-level FDR is higher than the PrSM-level FDR—an average of 23.7 times higher overall. Therefore, PrSM-level FDRs cannot be used to accurately determine proteoform- or protein-level discoveries with a reliable FDR cutoff (Fig. 3A).
With a CD FDR algorithm calibrated against known data, it is possible to explore the role that increasing the number of runs has on FDR inflation. Park et al. describe a quantitative study with 5 LC-MS/MS runs each from two treatment categories. For each of four FDR cutoff levels (0.1%, 0.5%, 1, and 2%) either two, four, or eight runs were chosen randomly (without replacement) and the number of proteins identified was determined. This was done five times at each FDR cutoff level. In each case, the number of identified proteins was compared with the number identified using the CD FDR algorithm, and the CD FDR cutoff producing the discovered number of proteins was taken as an estimate of FDR achieved using a PrSM-level cutoff. The results are shown in Fig. 3B. Notice that for any FDR cutoff, the greater the number of runs pooled, the larger the effect of the loss of control on FDR.
Park et al. used PrSM-level FDR at 1% to identify proteins (26). The actual protein-level FDR, after manual validation, is at least 7%. This discrepancy, as in all the cases shown in Fig. 3, comes from proteins supported by a single spectrum. Given the uncorrelated nature of single spectrum proteins (supplemental Fig. S1), the number of false positives will increase when merging search results from multiple runs. Fig. 4 shows the increase in proteins and proteoforms supported by a multiple spectrum in the ten runs reported in the quantitative study in Park et al. (26). Unfortunately, one should not simply disregard proteins supported by a single PrSM as even at ten runs only 62% of the proteoforms are supported by multiple PrSMs. Discarding the single PrSM proteoforms needlessly excludes many true positives. For example, in the qualitative study reported by Park et al., no less than 44 manually-validated, true positive protein identifications were supported by only one PrSM each.
Fig. 4.
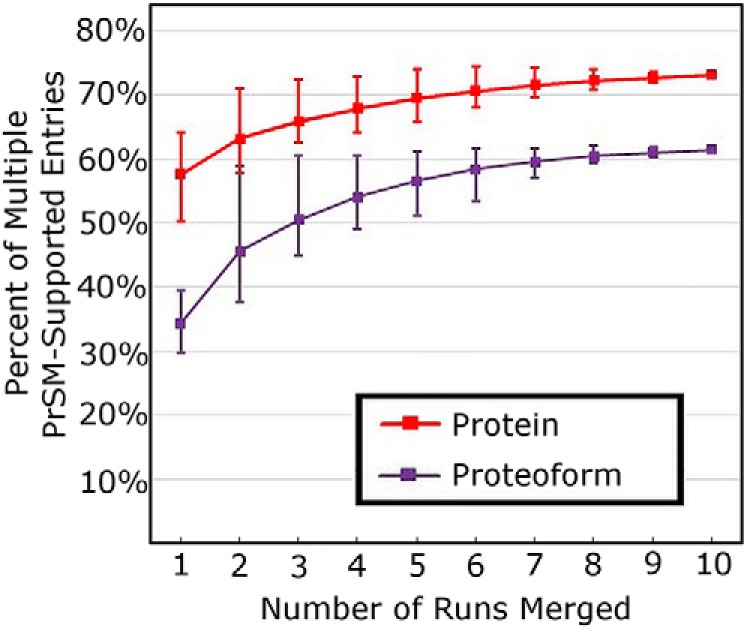
Percent of Multiple PrSM-Supported Proteins and Proteoforms by Number of Runs Merged. Using the 10 raw files from the quantitative study in Park et al., the presence of proteoforms and proteins supported by a multiple Spectra was explored. For the given number of runs, the average number of proteins and proteoforms supported by more than one PrSM is shown. The error bars show the maximum and minimum percent from all possible combinations at the level (e.g. 10 values for one run, one value for all 10 runs, and 10 choose 3 values for combining 3 Runs). This growth to a constant value is expected (See supplemental Fig. S1).
The CD FDR outperforms a naïve interpretation of PrSM-level FDR, though there is a generally monotonic relationship between the two (supplemental Fig. S2). To visualize the relationship between CD FDR and PrSM-level FDR, 1,173 putative protein identifications from the validated data in Park et al. were ranked by FDR. Fig. 5 shows the 200 proteins that span the transition from true to false discoveries. To the left on this figure are the true positives (accept) and to the right are true negatives (reject). Unfortunately, when ranked by either CD FDR or PrSM FDR the transition from true positive to true negative is not sharp, but rather the true and false positives mix together. The goal of automated proteomics is to pick a cutoff value that separates the true positives in the sample from the true negatives while controlling the FDR (and without requiring manually verification). In this case, the CD FDR is consistently conservative. As shown in Fig. 5, the CD FDR places the cutoff to the left, or below, of the true cutoff, while the PrSM-based approach used by MSPathFinder has the opposite behavior.
Fig. 5.

Visual Representation of FDR Control. A, shows vertical bars for a subset of the 1,173 proteins scored by MSPATHFINDER in Replicate 3 of the Qualitative study of Park et al. Sorted from lowest to highest q-value, the 260th protein, Q15843 (q = 0), is on the left. The 460th protein, Q8N729 (q = 0.029) is on the right. Between these two proteins, q values monotonically increase. Proteins that have been manually verified to be truly present are coded purple, while false putative discoveries are coded yellow. B, represents the FDR determination from MSPATHFINDER and the Context-Dependent FDR at three different FDR cutoff values. For each cutoff value, the 200-protein subset from A is shown relative to the proteins accepted by each FDR determination type. A vertical black bar shows the location of the cutoff yielding the stated level of FDR control. Light green represents proteins that are accepted by an FDR determination type, while those without color represent rejected proteins. While MSPATHFINDER accepts too many proteins and thus stands to lose control of its FDR, the Context-Dependent FDR cutoff errs to the conservative side. Thus, CD FDR is better suited for large-scale studies.
The first 284 protein discoveries in the Park et al. validated data all have a reported PrSM-level q value of zero. This phenomena has been reported before with Big Mascot (44), and it occurs when no decoy PrSMs score high enough to differentiate the top-scoring discovered proteins. This failure to differentiate top-scoring proteins creates a rank-ordered list with hundreds of ties for first place, even though there is a noticeable difference in spectral support among the tied proteins. Increasing the number of decoy PrSM results can potentially alleviate this problem, but that is usually impractical given computational constraints. The Enhanced FDR uses a parameterized model to estimate the FDR for all molecular entities scoring above the top decoy hit. These optional data are provided in a separate column in the TDCD_FDR_Calculator output and can be used whenever finer detail and striation of the top scoring hits in a run is desired.
DISCUSSION
In top-down proteomics, search context is critical for estimating FDRs. The context includes the MS data searched and the database search against, but it also includes the search engine used, the parameters of the search, and the molecular level (proteoform, isoform, or protein) of interest. Naïve PrSM-level FDR estimation loses control of the true FDR when reporting at the Proteoform, Isoform, and Protein level. This problem gets worse at higher molecular levels, and at the protein level the problem is significant; we found an average loss of control of 24-fold over four contexts (Fig. 3A). Therefore, it is not enough to report top-down proteomic results with a simple PrSM FDR, instead they must be calculated at the level for which they are being reported. We recommend a conservative reporting standard for discovered proteins be those with a 1% protein level FDR supported by at least one proteoform at the 1% proteoform FDR.
We have manually validated two publicly available datasets; one published by our laboratory and the other from Park et al. We have identified the correct proteoforms associated with 546 spectra. Additionally, 2705 spectra representing the proteins identified in common from two independent search engines are identified, curated, and made publicly available in a large dataset. While we have used this training set to explore the role of search context on FDR calculations, these data are available to be used to train and calibrate other search algorithms for top-down proteomics.
In our training set, the loss of control of FDR comes from proteins and proteoforms supported by a single PrSM. Unfortunately, many correct proteins and proteoforms are also supported by a single PrSM, so the simple expedient of removing all “one-hit wonders” is ill-advised. Instead, we provide TDCD_FDR_Calculator which implements a conservative algorithm which can be applied post-search to correct the FDR estimation for either ProSightPC or MSPathFinder.
TDCD_FDR_Calculator is conservative in FDR estimation. In the future, there are several things to consider. When applied to the training data, the current CD FDR algorithm is overly conservative. This may be corrected by refining the estimation process using techniques from bottom-up (45), but such an analysis will benefit from an even larger training set. In addition, multiple searches are frequently pooled to create a final list of molecular entities. This analysis provides no guidance on how to correctly pool searches while maintaining overall control on the FDR.
It is possible that statistical dependences exist within the CD FDR. Intuitively, fragment ions can belong to multiple proteins or proteoforms and therefore affect multiple scores. This violates the independence assumption of the Benjamini and Hochberg FDR analysis. The FDR analysis can be modified to account for such dependences (46). Not all dependence affects the Benjamini and Hochberg FDR analysis, specifically positive regression dependence (PRD) (46). Analyzing the role of dependence is a likely next-step in improving the CD FDR.
In conclusion, an FDR on a protein or proteoform identification is dependent on the context of the search. The entire context must be considered, including all identifications inferred from the data. We advocate a conservative approach to FDR estimation in which all data are pooled from a given study, and separate inferences made depending on the molecular level in question. Thus, the Context Dependent solution described here is accurate, designed to scale without loss of FDR control and provides conservative control regarding the inclusion of proteoforms supported by a single PrSM. This approach is suitable for use in future top-down proteomic studies run at very large scale (e.g. millions of tandem mass spectra (47)). To improve the general and perceived value of such future studies, the inclusion of less false discoveries is more desirable than the cost of excluding a few true discoveries.
DATA AVAILABILITY
A training set with known correct answers can be downloaded from MassIVE: https://massive.ucsd.edu/ProteoSAFe/dataset.jsp?task=bced230c79f849c3bd87a10e08c929fb. The source code for the TDCD_FDR_Calculator is available at: https://github.com/NRTDP/TDCD_FDR_Calculator.
Financial Conflict of Interest: Computational tools described in this work are available as either open-source, freeware or commercially so a financial conflict of interest is declared.
Supplementary Material
Footnotes
* This research was supported by NIDA P30DA018310 and the Paul G. Allen Family Foundation (Award #11715). The work was also supported by the Sherman Fairchild Foundation and performed in collaboration with the National Resource for Translational and Developmental Proteomics under Grant P41 GM108569 from the National Institute of General Medical Sciences, National Institutes of Health.
 This article contains supplemental material.
1 The abbreviations used are:
- CD FDR
- Context-dependent false discovery rate
- CSV
- Comma separated value file
- Decoy PrSM
- Proteoform spectral match to a decoy database
- FDR
- False discovery rate
- mzML
- An XML file format
- PrSM
- Proteoform spectral match
- PTM
- Post-translational modification
- SNP
- Single nucleotide polymorphism.
REFERENCES
- 1. Ntai I., and Toby T. K. (2016); LeDuc R. D., Kelleher N. L., A method for label-free, differential top-down proteomics. Methods Mol. Biol. 1410, 121–133 [DOI] [PMC free article] [PubMed] [Google Scholar]
- 2. Ntai I., LeDuc R. D., Fellers R. T., Erdmann-Gilmore P., Davies S. R., Rumsey J., Early B. P., Thomas P. M., Li S., Compton P. D., Ellis M. J., Ruggles K. V., Fenyo D., Boja E. S., Rodriguez H., Townsend R. R., and Kelleher N. L. (2016) Integrated bottom-up and top-down proteomics of patient-derived breast tumor xenografts. Mol. Cell. Proteomics 15, 45–56 [DOI] [PMC free article] [PubMed] [Google Scholar]
- 3. Serang O., and Kall L. (2015) Solution to statistical challenges in proteomics is more statistics, not less. J. Proteome Res. 14, 4099–4103 [DOI] [PubMed] [Google Scholar]
- 4. Wilhelm M., Schlegl J., Hahne H., Moghaddas Gholami A., Lieberenz M., Savitski M. M., Ziegler E., Butzmann L., Gessulat S., Marx H., Mathieson T., Lemeer S., Schnatbaum K., Reimer U., Wenschuh H., Mollenhauer M., Slotta-Huspenina J., Boese J. H., Bantscheff M., Gerstmair A., Faerber F., and Kuster B. (2014) Mass-spectrometry-based draft of the human proteome. Nature 509, 582–587 [DOI] [PubMed] [Google Scholar]
- 5. Savitski M. M., Wilhelm M., Hahne H., Kuster B., and Bantscheff M. (2015) A Scalable Approach for Protein False Discovery Rate Estimation in Large Proteomic Data Sets. Mol. Cell. Proteomics 14, 2394–2404 [DOI] [PMC free article] [PubMed] [Google Scholar]
- 6. Burger T. (2018) Gentle Introduction to the Statistical Foundations of False Discovery Rate in Quantitative Proteomics. J. Proteome Res. 17, 12–22 [DOI] [PubMed] [Google Scholar]
- 7. Noble W. S., and MacCoss M. J., (2012) Computational and statistical analysis of protein mass spectrometry data. PLoS Comput. Biol. 8, e1002296. [DOI] [PMC free article] [PubMed] [Google Scholar]
- 8. Benjamini Y., and Hochberg Y., (1995) Controlling the false discovery rate: a practical and powerful approach to multiple testing. J. Roy. Statistical Soc. 57, 289–300 [Google Scholar]
- 9. Hather G., Higdon R., Bauman A., von Haller P. D., and Kolker E. (2010) Estimating false discovery rates for peptide and protein identification using randomized databases. Proteomics 10, 2369–2376 [DOI] [PubMed] [Google Scholar]
- 10. Higdon R., Hogan J. M., Kolker N., van Belle G., and Kolker E. (2007) Experiment-specific estimation of peptide identification probabilities using a randomized database. Omics 11, 351–365 [DOI] [PubMed] [Google Scholar]
- 11. LeDuc R. D., Taylor G. K., Kim Y. B., Januszyk T. E., Bynum L. H., Sola J. V., Garavelli J. S., and Kelleher N. L., (2004) ProSight PTM: an integrated environment for protein identification and characterization by top-down mass spectrometry. Nucleic Acids Res. 32 (Web Server issue), W340–W345 [DOI] [PMC free article] [PubMed] [Google Scholar]
- 12. Meng F., Cargile B. J., Miller L. M., Forbes A. J., Johnson J. R., and Kelleher N. L. (2001) Informatics and multiplexing of intact protein identification in bacteria and the archaea. Nat. Biotechnol. 19, 952–957 [DOI] [PubMed] [Google Scholar]
- 13. LeDuc R. D., and Kelleher N. L., (2007) Using ProSight PTM and related tools for targeted protein identification and characterization with high mass accuracy tandem MS data. Current Protocols Bioinformatics Chapter 13, Unit 13.6 [DOI] [PubMed] [Google Scholar]
- 14. Frank A. M., Pesavento J. J., Mizzen C. A., Kelleher N. L., and Pevzner P. A. (2008) Interpreting top-down mass. Spectra using spectral alignment. Anal. Chem. 80, 2499–2505 [DOI] [PubMed] [Google Scholar]
- 15. Horn D. M., Zubarev R. A., and McLafferty F. W. (2000) Automated reduction and interpretation of high resolution electrospray mass spectra of large molecules. J. Am. Soc. for Mass Spectrom. 11, 320–332 [DOI] [PubMed] [Google Scholar]
- 16. Kou Q., Xun L., and Liu X. (2016) TopPIC: a software tool for top-down mass spectrometry-based proteoform identification and characterization. Bioinformatics 32, 3495–3497 [DOI] [PMC free article] [PubMed] [Google Scholar]
- 17. Liu X., Sirotkin Y., Shen Y., Anderson G., Tsai Y. S., Ting Y. S., Goodlett D. R., Smith R. D., Bafna V., and Pevzner P. A. (2012) Protein identification using top-down spectra. Mol. Cell. Proteomics 11, M111.008524 [DOI] [PMC free article] [PubMed] [Google Scholar]
- 18. Smith L. M., and Kelleher N. L. (2013) Proteoform: a single term describing protein complexity. Nat. Methods 10, 186–187 [DOI] [PMC free article] [PubMed] [Google Scholar]
- 19. Yang X., Coulombe-Huntington J., Kang S., Sheynkman G. M., Hao T., Richardson A., Sun S., Yang F., Shen Y. A., Murray R. R., Spirohn K., Begg B. E., Duran-Frigola M., MacWilliams A., Pevzner S. J., Zhong Q., Trigg S. A., Tam S., Ghamsari L., Sahni N., Yi S., Rodriguez M. D., Balcha D., Tan G., Costanzo M., Andrews B., Boone C., Zhou X. J., Salehi-Ashtiani K., Charloteaux B., Chen A. A., Calderwood M. A., Aloy P., Roth F. P., Hill D. E., Iakoucheva L. M., Xia Y., and Vidal M. (2016) Widespread expansion of protein interaction capabilities by alternative splicing. Cell 164, 805–817 [DOI] [PMC free article] [PubMed] [Google Scholar]
- 20. Shortreed M. R., Frey B. L., Scalf M., Knoener R. A., Cesnik A. J., and Smith L. M., (2016) Elucidating Proteoform. Families from proteoform intact-mass and lysine-count measurements. J. Proteome Res. 15, 1213–1221 [DOI] [PMC free article] [PubMed] [Google Scholar]
- 21. Tran J. C., Zamdborg L., Ahlf D. R., Lee J. E., Catherman A. D., Durbin K. R., Tipton J. D., Vellaichamy A., Kellie J. F., Li M., Wu C., Sweet S. M., Early B. P., Siuti N. LeDuc R. D., Compton P. D., Thomas P. M., and Kelleher N. L., (2011) Mapping intact protein isoforms in discovery mode using top-down proteomics. Nature 480, 254–258 [DOI] [PMC free article] [PubMed] [Google Scholar]
- 22. The UniProt Consortium, UniProt: the universal protein knowledgebase. Nucleic Acids Res. 2017, 45 (Database Issue), D158–D169 [DOI] [PMC free article] [PubMed] [Google Scholar]
- 23. Junker V. L., Apweiler R., and Bairoch A. (1999) Representation of functional information in the SWISS-PROT data bank. Bioinformatics 15, 1066–1067 [DOI] [PubMed] [Google Scholar]
- 24. Proteomics, C. f. T.-D. TopDownProteomics.org. (accessed 12/6/2017). [Google Scholar]
- 25. LeDuc R. D., Fellers R. T., Early B. P., Greer J. B., Thomas P. M., and Kelleher N. L. (2014) The C-score: a Bayesian framework to sharply improve proteoform scoring in high-throughput top down proteomics. J. Proteome Res. 13, 3231–3240 [DOI] [PMC free article] [PubMed] [Google Scholar]
- 26. Park J., Piehowski P. D., Wilkins C., Zhou M., Mendoza J., Fujimoto G. M., Gibbons B. C., Shaw J. B., Shen Y., Shukla A. K., Moore R. J., Liu T., Petyuk V. A., Tolic N., Pasa-Tolic L., Smith R. D., Payne S. H., and Kim S. (2017) Informed-Proteomics: open-source software package for top-down proteomics. Nat. Methods 14, 909–914 [DOI] [PMC free article] [PubMed] [Google Scholar]
- 27. Toby T. K., Abecassis M., Kim K., Thomas P. M., Fellers R. T. LeDuc R. D., Kelleher N. L., Demetris J., and Levitsky J. (2017) Proteoforms in peripheral blood mononuclear cells as novel rejection biomarkers in liver transplant recipients. Am. J. Transplantation 17, 2458–2467 [DOI] [PMC free article] [PubMed] [Google Scholar]
- 28. Davis R. G., Park H.-M., Kim K., Greer J. B., and Fellers R. T. LeDuc R. D., Romanova E. V., Rubakhin S. S., Zombeck J. A., Wu C., Yau P. M., Gao P., van Nispen A. J., Patrie S. M., Thomas P. M., Sweedler J. V., Rhodes J. S., and Kelleher N. L. (2018) Top-down proteomics enables comparative analysis of brain proteoforms between mouse strains. Anal. Chem. 90, 3802–3810 [DOI] [PMC free article] [PubMed] [Google Scholar]
- 29. Aggarwal S., Yadav A. K., False Discovery Rate Estimation in Proteomics. In Statistical Analysis in Proteomics, Jung K., Ed. Springer New York: New York, NY, 2016; pp 119–128 [DOI] [PubMed] [Google Scholar]
- 30. North B. V., Curtis D., and Sham P. C. (2002) A note on the calculation of empirical P values from Monte Carlo procedures. Am. J. Hum. Genet. 71, 439–441 [DOI] [PMC free article] [PubMed] [Google Scholar]
- 31. Tran J. C., Zamdborg L., Ahlf D. R., Lee J. E., Catherman A. D., Durbin K. R., Tipton J. D., Vellaichamy A., Kellie J. F., Li M., Wu C., Sweet S. M. M., Early B. P., Siuti N. LeDuc R. D., Compton P. D., and Thomas P. M. (2011) Kelleher, N. L., Mapping intact protein isoforms in discovery mode using top down proteomics. Nature 480, 254–258 [DOI] [PMC free article] [PubMed] [Google Scholar]
- 32. Catherman A. D., Durbin K. R., Ahlf D. R., Early B. P., Fellers R. T., Tran J. C., Thomas P. M., and Kelleher N. L. (2013) Large-scale top-down proteomics of the human proteome: membrane proteins, mitochondria, and senescence. Mol. Cell. Proteomics 12, 3465–3473 [DOI] [PMC free article] [PubMed] [Google Scholar]
- 33. Afgan E., Baker D., van den Beek M., Blankenberg D., Bouvier D., Čech M.; Chilton J., Clements D., Coraor N., Eberhard C., Grüning B., Guerler A., Hillman-Jackson J., Von Kuster G., Rasche E., Soranzo N., Turaga N., Taylor J., Nekrutenko A., and Goecks J., (2016) The Galaxy platform for accessible, reproducible and collaborative biomedical analyses: 2016 update. Nucleic Acids Res. 44 (Web Server issue), W3–W10 [DOI] [PMC free article] [PubMed] [Google Scholar]
- 34. Fornelli L., Durbin K. R., Fellers R. T., Early B. P., Greer J. B. LeDuc R. D., Compton P. D., and Kelleher N. L. (2017) Advancing top-down analysis of the human proteome using a benchtop quadrupole-orbitrap mass spectrometer. J. Proteome Res. 16, 609–618 [DOI] [PMC free article] [PubMed] [Google Scholar]
- 35. Anderson L. C., DeHart C. J., Kaiser N. K., Fellers R. T., Smith D. F., Greer J. B. LeDuc R. D., Blakney G. T., Thomas P. M., Kelleher N. L., and Hendrickson C. L. (2017) Identification and characterization of human proteoforms by top-down LC-21 Tesla FT-ICR mass spectrometry. J. Proteome Res. 16, 1087–1096 [DOI] [PMC free article] [PubMed] [Google Scholar]
- 36. Zamdborg L., LeDuc R. D., Glowacz K. J., Kim Y. B., Viswanathan V., Spaulding I. T., Early B. P., Bluhm E. J., Babai S., and Kelleher N. L. (2007) ProSight PTM 2.0: improved protein identification and characterization for top down mass spectrometry. Nucleic Acids Res. 35 (Web Server issue), W701–W706 [DOI] [PMC free article] [PubMed] [Google Scholar]
- 37. Jeong K., Kim S., and Bandeira N. (2012) False discovery rates in spectral identification. BMC Bioinformatics 13, S2. [DOI] [PMC free article] [PubMed] [Google Scholar]
- 38. Storey J. D., and Tibshirani R. (2003) Statistical significance for genomewide studies. Proc. Natl. Acad. Sci. U.S.A. 100, 9440–9445 [DOI] [PMC free article] [PubMed] [Google Scholar]
- 39. Benjamini Y., and Hochberg Y. (1995) Controlling the false discovery rate: a practical and powerful approach to multiple testing. J. Roy. Statistical Soc. 57, 289–300 [Google Scholar]
- 40. Durbin R., Eddy S. R., Krogh A., and Mitchison G., Biological Sequence Analysis: Probabilistic Models of Proteins and Nucleic Acids. Cambridge University Press: Cambridge, 1998 [Google Scholar]
- 41. Rockwood A. L., and Haimi P. (2006) Efficient calculation of accurate masses of isotopic peaks. J. Am. Soc. Mass Spectrom. 17, 415–419 [DOI] [PubMed] [Google Scholar]
- 42. Fornelli L., Srzentić K., Huguet R., Mullen C., Sharma S., Zabrouskov V., Fellers R. T., Durbin K. R., Compton P. D., and Kelleher N. L. (2018) Accurate sequence analysis of a monoclonal antibody by top-down and middle-down orbitrap mass spectrometry applying multiple ion activation techniques. Anal. Chem. 90, 8421–8429 [DOI] [PMC free article] [PubMed] [Google Scholar]
- 43. Catherman A. D., Li M., Tran J. C., Durbin K. R., Compton P. D., Early B. P., Thomas P. M., and Kelleher N. L. (2013) Top down proteomics of human membrane proteins from enriched mitochondrial fractions. Anal. Chem. 85, 1880–1888 [DOI] [PMC free article] [PubMed] [Google Scholar]
- 44. Karabacak N. M., Li L., Tiwari A., Hayward L. J., Hong P., Easterling M. L., and Agar J. N. (2009) Sensitive and specific identification of wild type and variant proteins from 8 to 669 kDa using top-down mass spectrometry. Mol. Cell. Proteomics 8, 846–856 [DOI] [PMC free article] [PubMed] [Google Scholar]
- 45. Elias J. E., and Gygi S. P. (2007) Target-decoy search strategy for increased confidence in large-scale protein identifications by mass spectrometry. Nat. Methods 4, 207–214 [DOI] [PubMed] [Google Scholar]
- 46. Benjamini Y., and Yekutieli D. (2001) The control of the false discovery rate in multiple testing under dependency. Ann. Statistics 29, 1165–1188 [Google Scholar]
- 47. Wilhelm M., Schlegl J., Hahne H., Gholami A. M., Lieberenz M., Savitski M. M., Ziegler E., Butzmann L., Gessulat S., Marx H., Mathieson T., Lemeer S., Schnatbaum K., Reimer U., Wenschuh H., Mollenhauer M., Slotta-Huspenina J., Boese J.-H., Bantscheff M., Gerstmair A., Faerber F., and Kuster B (2014) Mass-spectrometry-based draft of the human proteome. Nature 509, 582. [DOI] [PubMed] [Google Scholar]
Associated Data
This section collects any data citations, data availability statements, or supplementary materials included in this article.
Supplementary Materials
Data Availability Statement
A training set with known correct answers can be downloaded from MassIVE: https://massive.ucsd.edu/ProteoSAFe/dataset.jsp?task=bced230c79f849c3bd87a10e08c929fb. The source code for the TDCD_FDR_Calculator is available at: https://github.com/NRTDP/TDCD_FDR_Calculator.
Financial Conflict of Interest: Computational tools described in this work are available as either open-source, freeware or commercially so a financial conflict of interest is declared.