Abstract
The inner medullary collecting duct (IMCD) produces very high levels of endothelin-1 (ET-1) that acts as an autocrine inhibitor of IMCD Na+ and water reabsorption. Recent studies suggest that IMCD ET-1 production is enhanced by extracellular hypertonicity as can occur during high salt intake. Although NFAT5 has been implicated in the IMCD ET-1 hypertonicity response, no studies in any cell type have identified NFAT5 as a transcriptional regulator of the EDN1 gene; the current study examined this using a mouse IMCD cell line (IMCD3). Media hypertonicity increased IMCD3 ET-1 mRNA in a dose- and time-dependent manner associated with increased NFAT5 nuclear localization. Knockdown of NFAT5 using small-interfering RNA or by CRISPR/Cas9-mediated targeting of exon 4 of the NFAT5 gene reduced the ET-1 hypertonicity response. Chromatin immunoprecipitation using an NFAT5 antibody pulled down ET-1 promoter regions containing NFAT5 consensus binding sequences. Transfected ET-1 promoter reporter constructs revealed maximal hypertonicity-induced reporter activity in the proximal 1-kb region; mutation of the two NFAT5 consensus-binding sites in this region abolished hypertonicity-induced reporter activity. The 1-kb ET-1 promoter-reporter construct lost hypertonicity responsiveness when transfected in CRISPR/Cas9-induced NFAT5-deficient cells. In summary, these findings represent the first description that NFAT5 is a direct transcriptional regulator of the EDN1 gene in IMCD cells and point to a potentially important mechanism by which body Na+ homeostasis is maintained.
Keywords: endothelin-1, inner medullary collecting duct, NFAT5, osmolarity, promoter
INTRODUCTION
Endothelin-1 (ET-1) is a pluripotent peptide that acts in an autocrine and/or paracrine manner to modulate a broad range of physiological and pathophysiological processes (8). The fundamental biological importance of ET-1 has engendered a large body of work on the mechanisms regulating ET-1 production and secretion. Given the general lack of vesicular storage, it is thought that ET-1 secretion reflects the rate of ET-1 synthesis. ET-1 mRNA is labile (half-time ~15 min) likely because of AUUUA motifs in the 3′-untranslated region (12), suggesting that ET-1 mRNA stability may be physiologically regulated. Indeed, glyceraldehyde-3-phosphate dehydrogenase (GAPDH) can mediate rapid ET-1 mRNA degradation through binding to the AUUUA regions, while micro-RNAs have been identified that affect ET-1 mRNA levels (19). However, the preponderance of data indicates that ET-1 synthesis is primarily controlled at the transcriptional level. Numerous transcriptional regulators that bind to and regulate activity of the EDN1 gene promoter have been identified; epigenetic regulation via DNA methylation and histone modification has also been described (19). In turn, these regulatory mechanisms are induced (generally or in a cell-specific manner) by a range of stimuli, including hormones, local agents, shear stress, hypoxia, and other factors.
Although ET-1 is produced by, and acts upon, a plethora of cell types, the renal collecting duct, and particularly the inner medullary collecting duct (IMCD), is of unique importance. The IMCD produces and binds more ET-1 than any other cell type (8). IMCD ET-1 is critically important in modulating salt transport in health and in hypertension (8). IMCD ET-1 production is regulated by several factors; however, recent studies suggest that extracellular tonicity may be of particular importance. During high-salt feeding, IMCD cells are induced to produce ET-1 that acts locally to promote a natriuresis, thereby facilitating elimination of the salt load and avoiding elevated blood pressure (8). Based on in vitro studies using cultured IMCD cells, this salt load stimulation of ET-1 is partly mediated by increased tubule fluid flow (15, 16). Notably, when the flow solution’s osmolarity was increased (as would occur during high salt intake), the induction of IMCD ET-1 was markedly greater than that observed with flow alone (14). This effect of increased osmolarity was reduced by NFAT5 small-interfering RNA (siRNA), suggesting that NFAT5, a well-known tonicity response protein, could be involved in ET-1 production (14). However, no studies to date have described NFAT5 regulation of the ET-1 promoter; the current study was undertaken, therefore, to determine whether NFAT5 is a transcriptional regulator of the EDN1 gene, using mouse IMCD cells as a model.
MATERIALS AND METHODS
Cell Culture
Wild-type IMCD3 cells.
The mouse IMCD cell line (IMCD3; ATCC CRL-2123, Manassas, VA) was grown to confluence on 12-, 24-, or 96-well plastic culture plates in 50:50 Dulbecco’s modified Eagle’s medium-Ham’s F-12 (DMEM-F-12) supplemented with 10% fetal bovine serum, 1 mg/ml penicillin, and 1 mg/ml streptomycin in a 5% CO2 incubator at 37°C. Confluent cells were growth arrested in DMEM-F-12 without serum for 24 h before the day of study.
NFAT5-deficient IMCD3 cells.
The Mutation Generation and Detection Core at the University of Utah targeted a region comprising exon 4 of the NFAT5 gene in IMCD3 cells using gRNAs to flanking regions in introns 3 and 4 with a predicted deletion region of 2.78 kb. The gRNAs were encoded by a plasmid containing Cas9 and blasticidin resistance genes. Cells were dilution cloned under blasticidin selection, and deletion of exon 4 within isolated clones was assessed by PCR using primers S6 forward: GCTACCATACTGGAAAAGGAC, S6 reverse: AAGTGGGACTGTGCTTAGCC, and S9 reverse: GCAGAAGCAGAAAAGATGTAGG. The degree of NFAT5 mRNA reduction within specific clones was assessed by real-time PCR as described below.
RNA Analysis
RNA from cultured cells was isolated using the PureLink RNA Mini Kit (Invitrogen, Waltham, MA) and reverse transcribed with the High Capacity cDNA Reverse Transcription Kit (Invitrogen). ET-1, NFAT5, and GAPDH mRNA levels were determined by real-time PCR (StepOne Plus; Applied Biosystems, Foster City, CA) using the Taqman Gene Expression Assay (Applied Biosystems) with ET-1 (Mm00438656_m1), NFAT5 (Mm00467257_m1), and GAPDH (Mm99999915_g1) primers, respectively. For determination of mRNA levels in NFAT5-deficient cells, two different NFAT5 primers were used that amplified across the region encoded by exon 4 in the NFAT5 gene (TaqMan Mm00957045_g1 and Mm01247392_m1).
siRNA Studies
Mouse NFAT5 siRNA and negative controls (scrambled siRNA sequences) were purchased from Origene (Rockville, MD). Cells were grown on 24-well plates, and transfection was carried out for 48 h using Lipofectamine RNAiMax as the transfection agent (Invitrogen). At the conclusion of the 48-h period, cells were exposed to varying osmolarities (HBSS ± mannitol) followed by determination of ET-1, NFAT5, and GAPDH mRNA content using the Taqman primers described above.
Western Analysis
IMCD3 cells were exposed to 300 or 450 mosM media (HBSS ± mannitol) for 0.5 or 2 h, followed by isolation of cytoplasmic and nuclear proteins using the NE-PER kit (Thermo Scientific, Waltham, MA). Immunoblotting was performed as previously described (2). Antibodies were as follows: mouse monoclonal β-actin (1:2,000, catalog no. AM4302; Ambion, Foster City, CA), mouse monoclonal TATA-binding protein (TBP, 1:2,000, catalog no. ab51841; Abcam, Cambridge, MA), and rabbit anti-mouse NFAT5 (1:1,000, catalog no. PA1–023; Invitrogen). Secondary horseradish peroxidase-conjugated antibodies were goat anti-mouse IgG (1:2,000; Abcam) or goat anti-rabbit IgG (1:5,000; Abcam). Horseradish peroxidase was visualized using the Advance ECL System (GE Healthcare, Piscataway, NJ). Images were obtained and quantified by ImageLab (Bio-Rad, Hercules, CA). All antibodies were initially tested for linearity by loading 1, 2.5, 5, and 10 µg of protein; linear results were obtained for all antibodies between 1 and 5 µg, so 2.5 µg of protein were loaded in each lane for all experiments. Normalizing to β-actin or TBP was still performed; however, analysis of the results without β-actin or TBP did not change any significant differences between treatment groups.
Chromatin Immunoprecipitation PCR
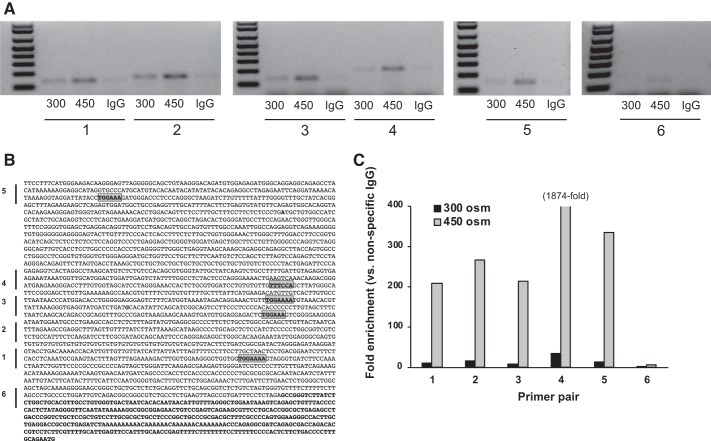
IMCD3 cells were grown to confluence and exposed to 300 or 450 mosM for 4 h. Cells were then treated with 1% formaldehyde for 10 min, and the reaction was quenched with 0.13 M glycine (10 min). Cells were harvested in lysis buffer. DNA concentration was determined by absorption at 260 nm; samples were diluted to equal concentrations and treated with micrococcal nuclease (Cell Signaling, Danvers, MA) and sonicated into 200- to 900-bp fragments. Subsequently, the NFAT5-DNA complex was captured using an NFAT5 antibody (Abcam, Burlingame, CA) and a ChIP-IT Express Chromatin Immunoprecipitation (ChIP) kit (Active Motif, Carlsbad, CA). The recovered DNA was PCR amplified with primers flanking different regions of the ET-1 promoter (see Table 1 and Fig. 5). Nonspecific antibody against rabbit IgG was used as a control.
Table 1.
Primers used for PCR amplification in ChIP-PCR assay
| Primer Pair | Forward Primer | Reverse Primer |
|---|---|---|
| 1 | CTTGCTAACTCCTGACGGAATC | CGCTCTTGAATCCCAGCTACTG |
| 2 | CATATTCAGCATCGGCAGT | GCGCCTCACATACTAAAGAGAG |
| 3 | GACATGTTGTCACTTGTGCC | GACTGCCGATGCTGAATATG |
| 4 | GCATGGACTGGATTGAGTCTA | GGCACAAGTGACAACATGTC |
| 5 | TGCCCATGCATGTACACAAT | CATCCACTCTGAGCTTCTTCTA |
| 6 | TGCTGCTCTCTGCAGGTTCT | AACGTGCAGCCAGAGATAAG |
See also Fig. 5. ChIP, chromatin immunoprecipitation.
Fig. 5.
Chromatin immunoprecipitation assay using an NFAT5 antibody in inner medullary collecting duct 3 cells exposed to 300 or 450 mosM (using mannitol) for 4 h. A is a representative gel showing PCR products of DNA pulled down by the NFAT5 antibody using primers (numbered 1–6) flanking regions in the mouse endothelin-1 (ET-1) promoter as indicated by the bars in B and as described in Table 1. Highlighted regions in the ET-1 promoter (B) indicate consensus NFAT5 binding sites. Bold font in B indicates exon 1. C: quantitative PCR results for the 6 primers. IgG, nonspecific IgG used as a control.
Promoter-Reporter Studies
IMCD3 cells were transfected with Gluc-ON promoter reporter clones (GeneCopoeia, Rockville, MD). Clones contained the mouse ET-1 promoter (1-, 2-, or 3-kb region ending at the transcription start site) driving secreted Gaussia luciferase and the CMV promoter driving secreted alkaline phosphatase (as a transfection control). A fourth clone contained the 1-kb ET-1 promoter with two mutated NFAT5 consensus sites (TGGAAA mutated to TCACGA). Each of the four clones was transfected in separate sets of cells for 48 h using Endofectin Max (GeneCopoeia). Cells were then exposed to varying osmolarities for varying times, and media were analyzed for luciferase and alkaline phosphatase activity using the Secrete-Pair Dual Luminescence assay (GeneCopoeia). Results were expressed as the ratio of relative light units of luciferase to alkaline phosphatase.
Statistical Analysis
Student’s t-test was used to compare differences in continuous parameters between treatments (protein expression, luciferase activity comparing transfected wild-type and NFAT5-deficient IMCD3 cells). Two-way analysis of variance was used to compare differences between treatment groups for all other experiments. All analysis was performed using GraphPad Prism 7 software. The criterion for significance was P < 0.05. All data are expressed as means ± SE.
RESULTS
Tonicity Regulation of ET-1 mRNA Content
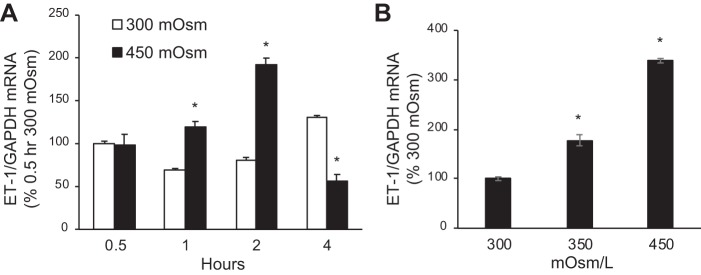
We previously reported that hypertonicity increases ET-1 mRNA in IMCD3 cells (14); however, to conduct the current studies, it was necessary to define a time course and dose response. Because the nature of the hypertonic solute does not appear to matter in stimulating IMCD3 ET-1 mRNA (14), all studies were conducted with mannitol. Increasing baseline media osmolarity (300 mosM because of HBSS alone) to 450 mosM (added mannitol) increased ET-1 mRNA by 1 h with maximal stimulation at 2 h (Fig. 1A). Further exposure (4 h) to 450 mosM reduced ET-1 mRNA associated with some cell detachment, suggesting cell toxicity. Increasing media osmolarity (for 2 h) to 350 mosM also increased ET-1 mRNA, but not as much as 450 mosM (Fig. 1B); exposure to 600 mosM caused cell detachment. Repeating the time course with 350 mosM showed similar stimulation of ET-1 mRNA at 2 and 4 h (data not shown). Note that, as previously described in IMCD3 cells (15), ET-1 mRNA, as opposed to ET-1 protein, was measured since ET-1 release or cell content is not detectable in the small numbers of cells used. ET-1 mRNA is an accurate reflection of ET-1 production since, in virtually every condition in which ET-1 mRNA and protein have been measured, ET-1 mRNA reflects ET-1 protein levels (8). As mentioned earlier, this is likely because of, at least partly, ET-1 mRNA being very short lived and because of ET-1 not typically being stored in vesicles.
Fig. 1.
Time course (A) and dose response (B) of the effect of increasing osmolarity (using mannitol) on endothelin-1 (ET-1) mRNA content [normalized to glyceraldehyde-3-phosphate dehydrogenase (GAPDH) mRNA content] in inner medullary collecting duct (IMCD) 3 cells. The data points on the x-axis refer to the length of time confluent cells were exposed to 300 or 450 mosM; n = 6 for each data point. *P < 0.05 vs. 300 mosM at the same time point (A) or vs. 300 mosM (B).
Tonicity Regulation of NFAT5 Expression and Cellular Distribution
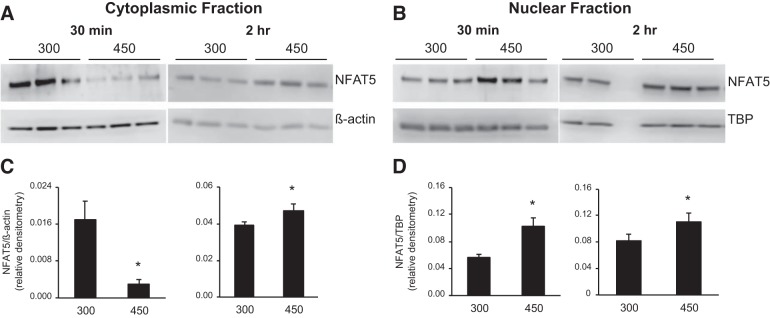
Given that we wanted to determine if NFAT5 directly regulates the ET-1 promoter, it was first necessary to demonstrate that NFAT5 expression and/or subcellular localization was modulated by hypertonicity in the particular IMCD3 cells being studied. As shown in Fig. 2, 30 min exposure to 450 mosM reduced cytoplasmic and increased nuclear NFAT5 protein content compared with 300 mosM. Exposure to 450 mosM for 2 h increased both cytoplasmic and nuclear NFAT5 protein content (Fig. 2). Note that β-actin protein content was enriched in cytoplasmic vs. nuclear extracts by 1.7-fold, whereas TATA-binding protein content (nuclear marker) was enriched in nuclear extracts vs. cytoplasmic extracts by 2.5-fold.
Fig. 2.
Effect of increasing media osmolarity for 30 min or 2 h (300 vs. 450 mosM using mannitol) on NFAT5 cytoplasmic and nuclear protein content. The cytoplasmic fraction Western blot and densitometry are shown in A and C, respectively; the nuclear fraction Western blot and densitometry and shown in B and D, respectively. n = 3 for each data point, except n = 2 for nuclear fraction 2 h. *P < 0.05 vs. 300 mosM. TBP, TATA-binding protein.
Effect of NFAT5 Knockdown on the ET-1 mRNA Hypertonicity Response
We previously reported that NFAT5 siRNA reduced the ET-1 mRNA response to combined flow and hypertonicity (14); however, we now wanted to focus on the hypertonicity response alone. NFAT5 siRNA modestly reduced the stimulatory effect of 450 mosM (for 2 h) on ET-1 mRNA (Fig. 3A). Exposure to 450 mosM for 2 h increased NFAT5 mRNA in the scrambled siRNA control group (Fig. 3B). NFAT5 siRNA caused an ~60% reduction in NFAT5 mRNA; however, exposure to 450 mosM still increased NFAT5 mRNA (Fig. 4B) although to a lesser degree than in the scrambled siRNA control group.
Fig. 3.
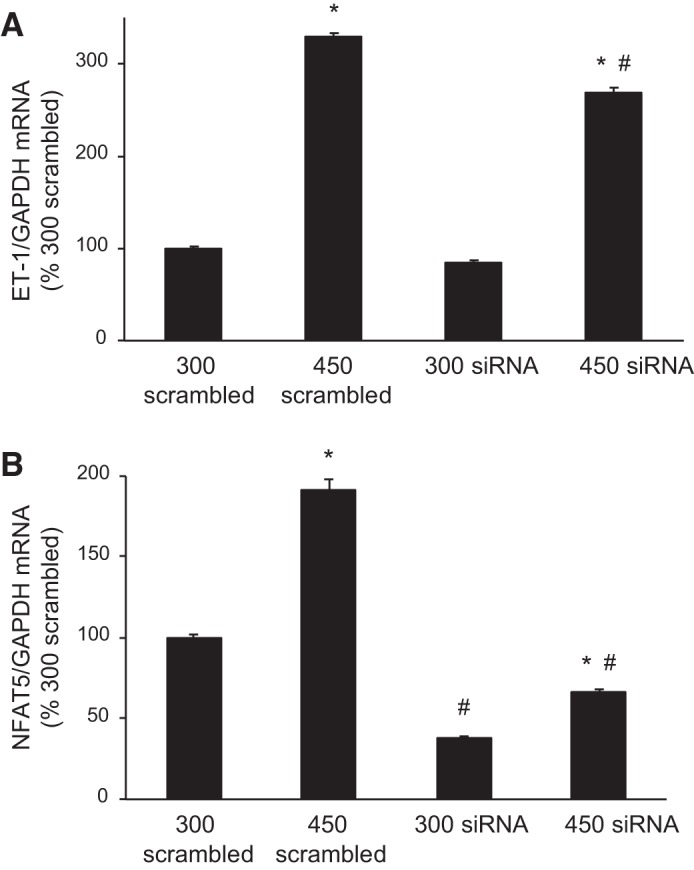
Effect of NFAT5 small-interfering RNA (siRNA) on endothelin-1 (ET-1, A) and NFAT5 (B) mRNA content [normalized to glyceraldehyde-3-phosphate dehydrogenase (GAPDH) mRNA content] after exposure to 300 or 450 mosM (using mannitol) for 2 h. Scrambled siRNA was used as a control. n = 6 for each data point. *P < 0.05 vs. 300 mosM under the same conditions (scrambled or NFAT5 siRNA); #P < 0.05 vs. 450 mosM scrambled siRNA.
Fig. 4.
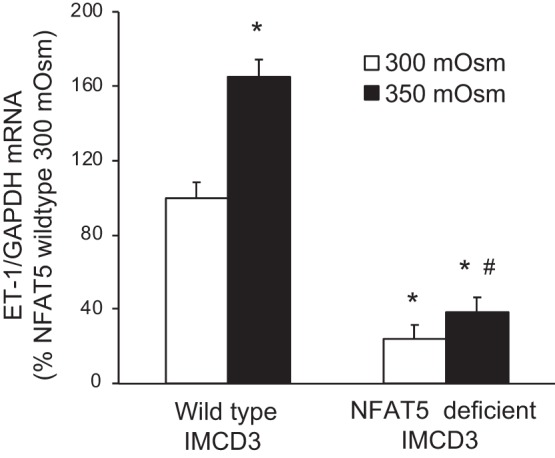
Effect of increasing media osmolarity (using mannitol) for 2 h on endothelin-1 (ET-1) mRNA content [normalized to glyceraldehyde-3-phosphate dehydrogenase (GAPDH) mRNA content] in wild-type inner medullary collecting duct (IMCD) 3 cells or in IMCD3 cells with CRISPR/Cas-mediated targeted disruption of exon 4 in the NFAT5 gene. n = 6 for each data point. *P < 0.05 vs. 300 mosM in wild-type IMCD3 cells; #P < 0.05 vs. 450 mosM in wild-type IMCD3 cells.
Because the siRNA-induced reduction in NFAT5 mRNA was moderate and hypertonicity still increased NFAT5 mRNA, the possibility existed that a greater degree of NFAT5 knockdown might result in a greater inhibitory effect on the ET-1 mRNA hypertonicity response. To examine this, CRISPR/Cas9 was used to target the critical exon 4 in the NFAT5 gene in IMCD3 cells. Targeted cells were dilution cloned under blasticidin selection; despite several rounds of attempts to achieve single cell-derived colonies, only clones with hemizygous deletion of exon 4 were detected. Consequently, several clones were analyzed for NFAT5 mRNA expression, and two clones were found with 85–90% reduction in NFAT5 mRNA content, while NFAT5 protein content was reduced to 37 ± 9% (n = 3) of that in wild-type IMCD3 cells. These two clones were exposed to hypertonicity for up to 4 h; they began to detach in 450 mosM at 2 h, but not in 350 mosM at 2 or 4 h (presumably the marked NFAT5 knockdown decreased their ability to tolerate hypertonicity). As shown in Fig. 4, 350 mosM stimulated ET-1 mRNA in wild-type IMCD3 cells; however, NFAT5-deficient cells had a marked reduction in ET-1 mRNA and failed to respond to 350 mosM (2 h exposure).
ChIP PCR Using an NFAT5 Antibody
IMCD3 cells were exposed to 300 and 450 mosM followed by ChIP with an NFAT5 antibody and PCR using primers flanking NFAT5 consensus-binding sites in the ET-1 promoter (Table 1 and Fig. 5). Products were obtained using primers flanking all NFAT5 consensus-binding sites, and a minimally detectable product was obtained using primers flanking the 3′-end of the ET-1 promoter and part of exon 1. Exposure to 450 mosM increased the intensity of the bands using all primers both qualitatively (Fig. 5A) and quantitatively (Fig. 5C).
Hypertonicity Regulation of ET-1 Promoter-Reporter Activity
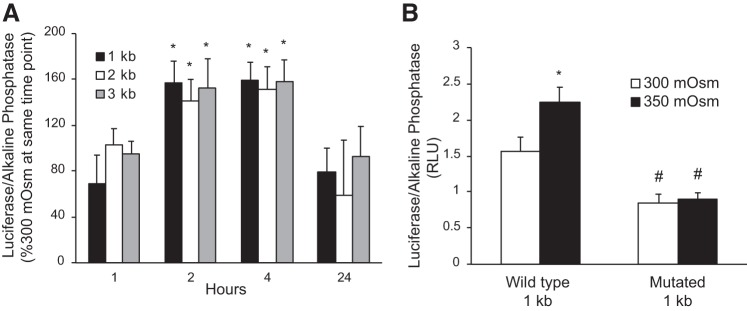
IMCD3 cells were transfected with either 1-, 2-, or 3-kb ET-1 promoter constructs, with each promoter fragment ending at the beginning of the transcription start site. The promoters drove a secreted Gaussia luciferase; secreted alkaline phosphatase was used as a control for transfection efficiency. In preliminary experiments, it was determined that 450 mosM, but not 350 mosM, reduced secretion of alkaline phosphatase; hence, all hypertonicity studies were conducted using 350 mosM. Exposure of transfected cells to 350 mosM for varying times revealed stimulation of ET-1 promoter activity at 2 and 4 h compared with 300 mosM (Fig. 6A). The magnitude of the hypertonicity stimulatory effect was similar between the 1-, 2-, and 3-kb ET-1 promoter-reporter constructs; hence, the 1-kb ET-1 promoter was used for subsequent studies. Mutation of the only two NFAT5 consensus-binding sites (TGGAAA) in the 1-kb ET-1 promoter to TCACGA reduced basal (300 mosM) ET-1 promoter activity and prevented the 350 mosM stimulatory response.
Fig. 6.
Effect of osmolarity on endothelin-1 (ET-1) promoter activity (assessed by the ratio of secreted luciferase/secreted alkaline phosphatase) in inner medullary collecting duct 3 cells. In A, cells were transfected with 1-, 2-, or 3-kb ET-1 promoter-reporter constructs and then exposed to 300 or 350 mosM (using mannitol) for varying time periods. In B, cells were transfected with a wild-type 1-kb ET-1 promoter-reporter construct or a 1-kb ET-1 promoter construct in which the two NFAT5 binding sites were mutated and then exposed to 300 or 350 mosM (using mannitol) for 4 h. n = 6–9 for each data point. *P < 0.05 vs. 300 mosM at the same time point; #P < 0.05 vs. wild-type 1-kb promoter at 300 mosM.
To further examine NFAT5 regulation of the ET-1 promoter, wild-type and NFAT5-deficient (CRISPR/Cas9 mutated) IMCD3 cells were transfected with the 1-kb ET-1 promoter reporter construct and exposed to 300 and 350 mosM for 4 h. Compared with wild-type cells, NFAT5-deficient IMCD3 cells had a reduced ET-1 promoter response to 350 mosM (Fig. 7).
Fig. 7.
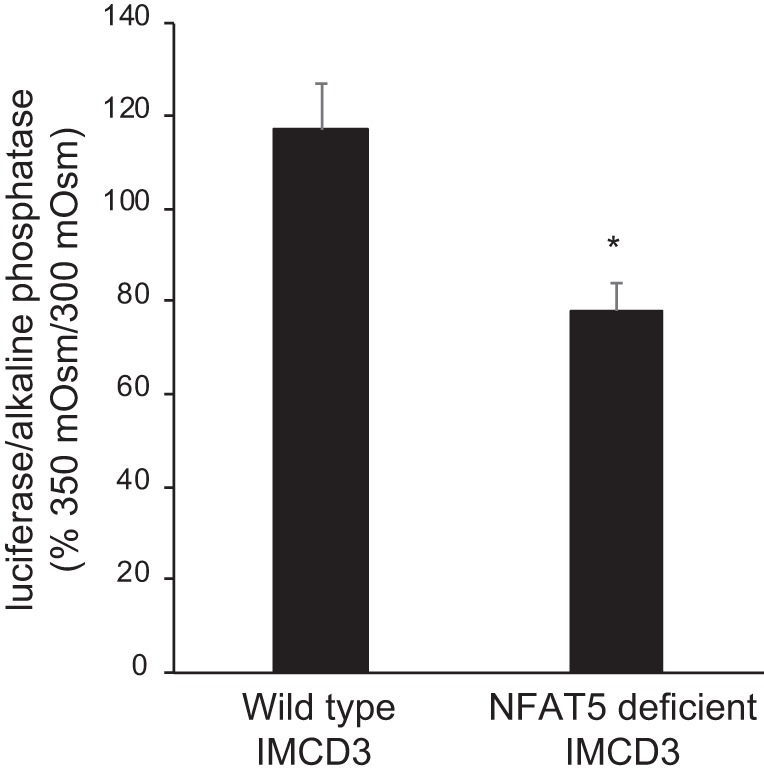
Effect of osmolarity on endothelin-1 (ET-1) promoter activity (assessed by the ratio of secreted luciferase/secreted alkaline phosphatase) in wild-type inner medullary collecting duct (IMCD) 3 cells or in IMCD3 cells with CRISPR/Cas-mediated targeted disruption of exon 4 in the NFAT5 gene. Cells were transfected with the 1-kb ET-1 promoter-reporter construct and exposed to 300 or 350 mosM (using mannitol) for 4 h. n = 9 for each data point. *P < 0.05 vs. wild-type IMCD3.
DISCUSSION
The current study demonstrates that NFAT5 directly interacts with the ET-1 promoter (ChIP-PCR and promoter mutagenesis experiments) and, as a result, stimulates ET-1 promoter activity (promoter-reporter experiments) and increases ET-1 gene transcription (ET-1 mRNA studies using wild-type, NFAT5 siRNA, and NFAT5-deficient cells). We also demonstrate that hypertonicity-induced EDN1 gene expression is primarily mediated by NFAT5. In addition, baseline (300 mosM) ET-1 promoter activity is regulated by NFAT5, suggesting that NFAT5 may control collecting duct cell ET-1 production over a wide range of tonicities, including those <300 mosM. Whereas these studies were conducted using the mouse ET-1 promoter, it is notable that there are NFAT5 consensus-binding sequences in the human ET-1 promoter (TGGAAA sites at positions 525 and 1470 5′ to the transcription start site).
The finding that NFAT5 is involved in modulating IMCD function is not surprising. The inner medulla undergoes much greater tonicity shifts than elsewhere in the body, and NFAT5 is well known to modulate many of the compensatory responses (22). For example, hypertonicity-induced increases in urea transporter A1 and aquaporins-1 and -2 in collecting duct cells are abrogated by inhibition of NFAT5 (1, 4, 10, 11). In addition to mediating tonicity responses, NFAT5 appears to respond to other stimuli in the inner medulla, including reactive oxygen species and nitric oxide (3). Beyond the kidney, NFAT5 mediates a wide variety of responses; some of these actions involve cellular homeostatic responses; however, NFAT5 also regulates blood pressure, inflammation, autoimmunity, and other functions (1). Thus, because ET-1 is found in very high levels in the kidney and is involved in regulation of renal salt and water metabolism as well as blood pressure and inflammation (8), it is perhaps not surprising that NFAT5 has now been shown to modulate ET-1 production and to do so through direct transcriptional regulation of the EDN1 gene.
Hypertonicity-stimulated ET-1 production is not unique to IMCD cells. Speed et al. found that increasing extracellular osmolarity by as little as 40 mosM for 2 h increased ET-1 synthesis in human umbilical vein endothelial cells (18). Increased media osmolarity augmented ET-1 production by cultured thick ascending limb cells (5), whereas high-salt feeding elevated ET-1 content in the aortic wall (independent of changes in arterial pressure) (20). Acute renal medullary infusion of hypertonic, but not isotonic, NaCl or mannitol increased urinary ET-1 excretion (6). It should be noted that, while our study and others (9, 13, 21) have reported that hypertonicity increases distal nephron epithelial cell ET-1 production, our original study on hypertonicity regulation of IMCD ET-1 (7) found that hypertonic NaCl or mannitol decreased ET-1 production by primary cultures of rat IMCD cells; although the reasons for the differing findings are unclear, it is possible that the primary cultured IMCD cells did not tolerate hypertonicity, i.e., had some degree of cell toxicity. Finally, a recent study found that increasing extracellular tonicity reduced ET-1 expression in primary cultured IMCD cells (17); however, these experiments were conducted on cells maintained in 10% fetal calf serum (hence potentially proliferating) as opposed to our studies wherein IMCD3 cells were growth arrested. Because kidney cells in vivo minimally proliferate and because ET-1 production is markedly affected (stimulated) by the proliferative state, it is unclear how to interpret these studies; in addition, hypertonicity could affect the proliferative state.
The biological significance of hypertonicity induction of ET-1 synthesis may relate, at least in part, to ET-1 involvement in the control of body Na+ homeostasis. As mentioned previously, high salt intake stimulates IMCD ET-1 production by the collecting duct, resulting in autocrine inhibition of Na+ reabsorption. In addition, Herrera and Garvin found that a high salt intake increased medullary tonicity in vivo and, using an in vitro system, found that hypertonic NaCl increased renal thick ascending limb ET-1 release, which activated endothelin B receptors in an autocrine manner, resulting in increased nitric oxide synthase 3 activity, increased nitric oxide, and inhibition of thick ascending limb Na+ transport (6). Another interesting possibility is that tubule fluid osmolality may contribute to upregulation of collecting duct ET-1 in response to a high salt intake. As alluded to earlier, increasing the perfusate flow or perfusate osmolality increased cultured IMCD ET-1 production by ~2-fold; however, simultaneously increasing both perfusate flow and osmolality increased IMCD ET-1 production by 12-fold (14).
The hypertonicity/ET-1 system may also be important in modulating body Na+ content through its activity in the skin. The skin has been shown to serve as a reservoir for ingested Na+, i.e., it helps buffer the effects of a salt load. In response to a high salt intake, skin Na+ concentration rises, but then the Na+ is mobilized in the circulation and eliminated by the kidneys. This mobilization appears to involve, at least in part, ET-1. Animals fed a high-salt diet have increased skin Na+ content, but such increases are significantly greater in endothelial cell-specific ET-1 knockout (18). Because, as stated above, hypertonicity increases endothelial cell ET-1 production (18), it may be that skin microvascular endothelial cell-derived ET-1, in a manner analogous to the thick ascending limb, acts in an autocrine manner via endothelin B receptors and nitric oxide to promote vasodilation and mobilization of skin Na+ stores. Thus, the hypertonicity/ET-1 system may be operative within the collecting duct, thick ascending limb, skin, and possibly other sites to modulate body Na+ homeostasis.
In summary, our study demonstrates that NFAT5 is a direct transcriptional activator of the EDN1 gene in renal collecting duct cells. We further show that NFAT5 is essential for hypertonicity-stimulated ET-1 production by collecting duct cells. We speculate that the hypertonicity-NFAT5-ET-1 axis plays a role in the regulation of body salt homeostasis; further studies are needed to examine this system in other cell types and ultimately assess its role in the regulation of salt balance and blood pressure during health and disease.
GRANTS
This work was support by NIH Grants P01-HL-36267 (to D. E. Kohan) and R01-DK-110358 (to A. R. Rodan) and by American Heart Association Grant 16CSA28530002 (to A. R. Rodan).
DISCLOSURES
No conflicts of interest, financial or otherwise, are declared by the authors.
AUTHOR CONTRIBUTIONS
D.E.K. conceived and designed research; J.L., W.W., and A.K. performed experiments; J.L., W.W., G.M., A.R.R., and D.E.K. analyzed data; J.L., W.W., A.K., and D.E.K. interpreted results of experiments; J.L., W.W., and D.E.K. prepared figures; J.L. and D.E.K. drafted manuscript; J.L., W.W., A.K., G.M., A.R.R., and D.E.K. edited and revised manuscript; J.L., W.W., A.K., G.M., A.R.R., and D.E.K. approved final version of manuscript.
REFERENCES
- 1.Cheung CY, Ko BC. NFAT5 in cellular adaptation to hypertonic stress - regulations and functional significance. J Mol Signal 8: 5, 2013. doi: 10.1186/1750-2187-8-5. [DOI] [PMC free article] [PubMed] [Google Scholar]
- 2.Gao Y, Stuart D, Takahishi T, Kohan DE. Nephron-specific disruption of nitric oxide synthase 3 causes hypertension and impaired salt excretion. J Am Heart Assoc 7: e009236, 2018. doi: 10.1161/JAHA.118.009236. [DOI] [PMC free article] [PubMed] [Google Scholar]
- 3.Halterman JA, Kwon HM, Wamhoff BR. Tonicity-independent regulation of the osmosensitive transcription factor TonEBP (NFAT5). Am J Physiol Cell Physiol 302: C1–C8, 2012. doi: 10.1152/ajpcell.00327.2011. [DOI] [PMC free article] [PubMed] [Google Scholar]
- 4.Hasler U, Jeon US, Kim JA, Mordasini D, Kwon HM, Féraille E, Martin PY. Tonicity-responsive enhancer binding protein is an essential regulator of aquaporin-2 expression in renal collecting duct principal cells. J Am Soc Nephrol 17: 1521–1531, 2006. doi: 10.1681/ASN.2005121317. [DOI] [PubMed] [Google Scholar]
- 5.Herrera M, Garvin JL. Endothelin stimulates endothelial nitric oxide synthase expression in the thick ascending limb. Am J Physiol Renal Physiol 287: F231–F235, 2004. doi: 10.1152/ajprenal.00413.2003. [DOI] [PubMed] [Google Scholar]
- 6.Herrera M, Garvin JL. A high-salt diet stimulates thick ascending limb eNOS expression by raising medullary osmolality and increasing release of endothelin-1. Am J Physiol Renal Physiol 288: F58–F64, 2005. doi: 10.1152/ajprenal.00209.2004. [DOI] [PubMed] [Google Scholar]
- 7.Kohan DE, Padilla E. Osmolar regulation of endothelin-1 production by rat inner medullary collecting duct. J Clin Invest 91: 1235–1240, 1993. doi: 10.1172/JCI116286. [DOI] [PMC free article] [PubMed] [Google Scholar]
- 8.Kohan DE, Rossi NF, Inscho EW, Pollock DM. Regulation of blood pressure and salt homeostasis by endothelin. Physiol Rev 91: 1–77, 2011. doi: 10.1152/physrev.00060.2009. [DOI] [PMC free article] [PubMed] [Google Scholar]
- 9.Kramer HJ, Hashemi T, Bäcker A, Bokemeyer D. Hyperosmolality induced by betaine or urea stimulates endothelin synthesis by differential activation of ERK and p38 MAP kinase in MDCK cells. Kidney Blood Press Res 25: 65–70, 2002. doi: 10.1159/000063510. [DOI] [PubMed] [Google Scholar]
- 10.Lanaspa MA, Andres-Hernando A, Li N, Rivard CJ, Cicerchi C, Roncal-Jimenez C, Schrier RW, Berl T. The expression of aquaporin-1 in the medulla of the kidney is dependent on the transcription factor associated with hypertonicity, TonEBP. J Biol Chem 285: 31694–31703, 2010. doi: 10.1074/jbc.M109.093690. [DOI] [PMC free article] [PubMed] [Google Scholar]
- 11.Li SZ, McDill BW, Kovach PA, Ding L, Go WY, Ho SN, Chen F. Calcineurin-NFATc signaling pathway regulates AQP2 expression in response to calcium signals and osmotic stress. Am J Physiol Cell Physiol 292: C1606–C1616, 2007. doi: 10.1152/ajpcell.00588.2005. [DOI] [PubMed] [Google Scholar]
- 12.Mawji IA, Robb GB, Tai SC, Marsden PA. Role of the 3′-untranslated region of human endothelin-1 in vascular endothelial cells. Contribution to transcript lability and the cellular heat shock response. J Biol Chem 279: 8655–8667, 2004. doi: 10.1074/jbc.M312190200. [DOI] [PubMed] [Google Scholar]
- 13.Migas I, Bäcker A, Meyer-Lehnert H, Kramer HJ. Endothelin synthesis by porcine inner medullary collecting duct cells. Effects of hormonal and osmotic stimuli. Am J Hypertens 8: 748–752, 1995. doi: 10.1016/0895-7061(95)00115-6. [DOI] [PubMed] [Google Scholar]
- 14.Pandit MM, Gao Y, van Hoek A, Kohan DE. Osmolar regulation of endothelin-1 production by the inner medullary collecting duct. Life Sci 159: 135–139, 2016. doi: 10.1016/j.lfs.2015.10.037. [DOI] [PMC free article] [PubMed] [Google Scholar]
- 15.Pandit MM, Inscho EW, Zhang S, Seki T, Rohatgi R, Gusella L, Kishore B, Kohan DE. Flow regulation of endothelin-1 production in the inner medullary collecting duct. Am J Physiol Renal Physiol 308: F541–F552, 2015. doi: 10.1152/ajprenal.00456.2014. [DOI] [PMC free article] [PubMed] [Google Scholar]
- 16.Pandit MM, Strait KA, Matsuda T, Kohan DE. Na delivery and ENaC mediate flow regulation of collecting duct endothelin-1 production. Am J Physiol Renal Physiol 302: F1325–F1330, 2012. doi: 10.1152/ajprenal.00034.2012. [DOI] [PMC free article] [PubMed] [Google Scholar]
- 17.Schulze Blasum B, Schröter R, Neugebauer U, Hofschröer V, Pavenstädt H, Ciarimboli G, Schlatter E, Edemir B. The kidney-specific expression of genes can be modulated by the extracellular osmolality. FASEB J 30: 3588–3597, 2016. doi: 10.1096/fj.201600319R. [DOI] [PubMed] [Google Scholar]
- 18.Speed JS, Heimlich JB, Hyndman KA, Fox BM, Patel V, Yanagisawa M, Pollock JS, Titze JM, Pollock DM. Endothelin-1 as a master regulator of whole-body Na+ homeostasis. FASEB J 29: 4937–4944, 2015. doi: 10.1096/fj.15-276584. [DOI] [PMC free article] [PubMed] [Google Scholar]
- 19.Stow LR, Jacobs ME, Wingo CS, Cain BD. Endothelin-1 gene regulation. FASEB J 25: 16–28, 2011. doi: 10.1096/fj.10-161612. [DOI] [PMC free article] [PubMed] [Google Scholar]
- 20.Tsai YH, Ohkita M, Gariepy CE. Chronic high-sodium diet increases aortic wall endothelin-1 expression in a blood pressure-independent fashion in rats. Exp Biol Med (Maywood) 231: 813–817, 2006. [PubMed] [Google Scholar]
- 21.Yang T, Terada Y, Nonoguchi H, Ujiie K, Tomita K, Marumo F. Effect of hyperosmolality on production and mRNA expression of ET-1 in inner medullary collecting duct. Am J Physiol Renal Fluid Electrolyte Physiol 264: F684–F689, 1993. doi: 10.1152/ajprenal.1993.264.4.F684. [DOI] [PubMed] [Google Scholar]
- 22.Zhou X. How do kinases contribute to tonicity-dependent regulation of the transcription factor NFAT5? World J Nephrol 5: 20–32, 2016. doi: 10.5527/wjn.v5.i1.20. [DOI] [PMC free article] [PubMed] [Google Scholar]


