

Abstract
Coronary artery disease (CAD) is the principal cause of death in patients with nonalcoholic fatty liver disease (NAFLD). The aim of the present study was to investigate whether NAFLD is causally involved in the pathogenesis of CAD. For this, previously reported NAFLD susceptibility genes were clustered and tested for an association with CAD in the Coronary Artery Disease Genome‐Wide Replication and Meta‐Analysis plus the Coronary Artery Disease Genetics (CARDIoGRAMplusC4D) Consortium data set. The role of plasma lipids as a potential mediator was explored by using data from the Global Lipids Genetics Consortium. Statistical analyses revealed that the combination of 12 NAFLD genes was not associated with CAD in 60,801 CAD cases and 123,504 controls (odds ratio [OR] per NAFLD risk allele, 1.0; 95% confidence interval [CI], 0.99‐1.00). In a subsequent sensitivity analysis, a positive relationship was observed after exclusion of gene variants that are implicated in NAFLD through impaired very low‐density lipoprotein secretion (i.e., microsomal triglyceride transfer protein [MTTP], patatin‐like phospholipase domain containing 3 [PNPLA3], phosphatidylethanolamine N‐methyltransferase [PEMT], and transmembrane 6 superfamily member 2 [TM6SF2]) (OR, 1.01; 95% CI, 1.00‐1.02). Clustering of the excluded genes showed a significant negative relationship with CAD (OR, 0.97; 95% CI, 0.96‐0.99). A substantial proportion of the observed heterogeneity between the individual NAFLD genes in relation to CAD could be explained by plasma lipids, as reflected by a strong relationship between plasma lipids and CAD risk conferred by the NAFLD susceptibility genes (r = 0.76; P = 0.004 for low‐density lipoprotein cholesterol). Conclusion: NAFLD susceptibility genes do not cause CAD per se. The relationship between these genes and CAD appears to depend to a large extent on plasma lipids. These observations strongly suggest taking plasma lipids into account when designing a new drug to target NAFLD.
Abbreviations
- ADIPOQ
adiponectin, C1Q and collagen domain containing
- CAD
coronary artery disease
- CARDIoGRAMplusC4D
Coronary Artery Disease Genome‐Wide Replication and Meta‐Analysis plus the Coronary Artery Disease Genetics
- CI
confidence interval
- CVD
cardiovascular disease
- ERLIN1‐CHUK‐CWF19L
endoplasmic reticulum lipid raft associated 1–conserved helix‐loop‐helix ubiquitous kinase–CWF19‐like cell cycle control factor 1
- FADS
fatty acid desaturase
- GCKR
glucokinase regulator
- GWAS
genome‐wide association study
- HDL
high‐density lipoprotein
- LDL
low‐density lipoprotein
- LYPLAL1
lysophospholipase‐like 1
- MBOAT7
membrane bound O‐acyltransferase domain containing 7
- MTTP
microsomal triglyceride transfer protein
- NAFLD
nonalcoholic fatty liver disease
- OR
odds ratio
- PEMT
phosphatidylethanolamine N‐methyltransferase
- PNPLA3
patatin‐like phospholipase domain containing 3
- PPP1R3B
protein phosphatase 1 regulatory subunit 3B
- SNP
single‐nucleotide polymorphism
- TM6SF2
transmembrane 6 superfamily member 2
- TRIB1
tribbles pseudokinase 1
- VLDL
very low‐density lipoprotein
Nonalcoholic fatty liver disease (NAFLD) is an emerging cause of progressive liver inflammation, fibrosis, cirrhosis, end‐stage liver failure, and hepatocellular carcinoma in Western society. It has been estimated that NAFLD will be the principal cause of end‐stage liver disease requiring liver transplantation by 2025.1
However, despite these alarming data concerning liver‐related outcomes, most patients with NAFLD eventually die of cardiovascular complications.2 In their meta‐analysis, Targher and colleagues recently showed that NAFLD is indeed associated with cardiovascular disease (CVD).3 These studies were, by design, not capable of designating NAFLD as either a causal factor or an innocent bystander. Because many patients with NAFLD display features of the metabolic syndrome, other factors, such as dyslipidemia, hypertension, and hyperglycemia, could account for the relationship between NAFLD and CVD.2 On the other hand, it has been suggested that NAFLD, in particular nonalcoholic steatohepatitis, is by itself linked to CVD by proinflammatory cytokines.4
Genetic epidemiology may provide a solution to this conundrum. Because an individual is “randomized” at birth to receive either a gene variant that protects from or predisposes to a particular trait (in this case NAFLD), the association between this gene variant and CVD will provide an answer as to whether or not that trait is causally involved in the pathophysiologic process. Such a Mendelian randomization approach has already identified plasma low‐density lipoprotein (LDL) cholesterol, triglycerides, and (postprandial) glucose levels as causal factors, whereas the inflammatory factor C‐reactive protein has been ruled out.5
To date, data on NAFLD genes in relation to CVD have been scarce. Previous studies on the transmembrane 6 superfamily member 2 (TM6SF2) gene have convincingly shown that variants in this gene predispose to all stages of NAFLD but protect from CVD.6, 7, 8 We recently reported a similar disentanglement for the patatin‐like phospholipase domain containing 3 (PNPLA3) gene,9 the most replicated NAFLD gene.10, 11 These findings question the presence of a causal, positive relationship between NAFLD/nonalcoholic steatohepatitis and CVD, although both PNPLA3 and TM6SF2 are also associated with lower secretion of very low‐density lipoprotein (VLDL) particles,8, 12 which may account for the protection from CVD.
In the current study, we sought to gain more insight into the causal relationship between NAFLD and coronary artery disease (CAD). For this, we clustered previously reported common NAFLD gene variants and tested for an association with CAD. Given the complex relationship between NAFLD and dyslipidemia, which is a major cardiovascular risk factor by itself, we additionally studied the association of these variants with plasma lipids and their role in explaining the relationship with CAD.
Materials and Methods
Selection of NAFLD Susceptibility Genes
Selection of NAFLD susceptibility genes started with recent concise overviews on this topic13, 14, 15, 16 and was subsequently expanded by a Medline search for “NAFLD” and “gene.” Because some genetic association studies have been conducted in relatively small populations and are therefore more likely to be underpowered, a stringent selection procedure was applied. A NAFLD gene was included in the present study when one of the following criteria was fulfilled: (1) The gene was identified by genome‐wide association studies (GWASs) for NAFLD, as diagnosed by either histology or imaging; (2) the gene was identified by GWASs for a NAFLD‐related trait, e.g., liver enzymes or alcoholic fatty liver disease (AFLD), and subsequently confirmed in a NAFLD cohort; or (3) the gene was reported by multiple case‐control studies in NAFLD cohorts and subsequently confirmed by meta‐analysis.
Association of NAFLD Susceptibility Genes with CAD
The association between the NAFLD genes and CAD was assessed under the assumption of an additive mode of inheritance in the Coronary Artery Disease Genome‐Wide Replication and Meta‐Analysis plus the Coronary Artery Disease Genetics(CARDIoGRAMplusC4D) Consortium cohort. This cohort contains 8.6 million genetic variants from 48 GWASs, either case‐control studies (~75%) or (population‐based) prospective cohort studies. The median number of participants per study was 2,874 (interquartile range, 1,557‐5,291). The overall data set includes 60,801 cases with CAD and 123,504 controls of predominantly European and Asian ancestry.17 Although the definition of CAD differed to some extent between the studies that were part of the CARDIoGRAMplusC4D cohort, it generally included myocardial infarction, acute coronary syndrome, coronary artery bypass grafting, coronary angioplasty, (un)stable angina, and/or coronary stenosis >50%. Approximately 70% of the CAD cases had a reported history of myocardial infarction, which was generally defined as the combination of symptoms, typical abnormalities on electrocardiogram, and elevation of cardiac enzymes.17
The association between NAFLD susceptibility genes and myocardial infarction was studied as a secondary outcome.
The summarized data on CAD and myocardial infarction were contributed by CARDIoGRAMplusC4D investigators and downloaded from www.cardiogramplusc4d.org (data set “CARDIoGRAMplusC4D 1000 Genomes‐based GWAS”).
Association of NAFLD Susceptibility Genes with Plasma Lipids
Because plasma lipid levels were not available in CARDIoGRAMplusC4D, the relationships between the NAFLD‐associated polymorphisms and plasma lipids, i.e., total cholesterol, LDL cholesterol, high‐density lipoprotein (HDL) cholesterol, and triglycerides, were studied by using the published joint Metabochip and GWAS data from the Global Lipids Genetics Consortium (n = 188,577 European‐ancestry individuals).18
In case a genetic variant was not present in this database, the analysis was conducted with a neighboring variant that is in strong linkage disequilibrium (r 2 > 0.8).
Statistical Analyses
Clustering of the NAFLD susceptibility genes to test for an association with CAD and myocardial infarction was done by constructing a weighted fixed‐effects model, which is similar to an inverse‐variance weighted meta‐analysis19 (see Supporting Materials for more details). The effect sizes and variances of the individual genes were derived from the CARDIoGRAMplusC4D data set. The final weighted‐fixed effects model provides an estimate of the weighted average of the true effects in the set of genes. Because an additive model was used, this weighted average should be interpreted as the CAD risk conferred by one (average) NAFLD risk allele. To study the impact of genes that affect NAFLD risk by impairment of VLDL secretion (and thereby at the same time decreased plasma lipid levels), we additionally conducted a sensitivity analysis after exclusion of these genes.
Because NAFLD status was not present in CARDIoGRAMplusC4D and previous genetic studies have assessed NAFLD by different methods (e.g., biopsy, computed tomography, ultrasound) and expressed NAFLD in different ways (e.g., dichotomous, ordinal, and continuous), an analysis in which the gene‐exposure relationship is regressed against the gene‐outcome relationship was deemed unreliable.
Finally, the contribution of plasma lipids in explaining the observed heterogeneity was evaluated with meta‐regression. All analyses were conducted with R statistical software using the metafor package.19
Results
Selection of NAFLD Susceptibility Genes
The literature search resulted in 12 NAFLD susceptibility variants, of which five were selected based on previous GWASs for NAFLD (lysophospholipase‐like 1 [LYPLAL1], glucokinase regulator, [GCKR], protein phosphatase 1 regulatory subunit 3B [PPP1R3B], PNPLA3, and TM6SF2),8, 10, 20 four from previous GWASs for NAFLD‐related traits combined with at least one case‐control study in NAFLD (tribbles pseudokinase 1 [TRIB1], fatty acid desaturase [FADS1‐2‐3], endoplasmic reticulum lipid raft associated 1–conserved helix‐loop‐helix ubiquitous kinase–CWF19‐like cell cycle control factor 1 [ERLIN1‐CHUK‐CWF19L1], and membrane bound O‐acyltransferase domain containing 7 [MBOAT7]),21, 22, 23, 24, 25, 26, 27 and three from case‐control studies in NAFLD that were subsequently confirmed by meta‐analysis (adiponectin, C1Q and collagen domain containing [ADIPOQ], microsomal triglyceride transfer protein [MTTP], and phosphatidylethanolamine N‐methyltransferase [PEMT])28, 29, 30 (Table 1). The tissue expression and global function of the genes presumed to underlie these associations are listed in Supporting Table S1. Only one, GCKR, is specifically expressed in the liver.
Table 1.
Selection of Nafld Susceptibility SNPs
| Chr | Gene | Variant* | A1/A2*,† | Effect Allele (A1) Frequency* | Inclusion Based On | Ref. | ||
|---|---|---|---|---|---|---|---|---|
| GWAS for NAFLD | GWAS for Related Trait‡ | Meta‐Analysis on NAFLD | ||||||
| 1 | LYPLAL1 | rs12137855 | C/T | 0.80 | + | ‐ | ‐ | 20 |
| 2 | GCKR | rs1260326 | T/C | 0.39 | + | ‐ | ‐ | 20 |
| 3 | ADIPOQ | rs2241766 | G/T | 0.12 | ‐ | ‐ | + | 28 |
| 4 | MTTP | rs1800591 | T/G | 0.26 | ‐ | ‐ | + | 29 |
| 8 | PPP1R3B | rs4240624 | A/G | 0.87 | + | ‐ | ‐ | 20 |
| 8 | TRIB1 | rs2954021 | A/G | 0.50 | ‐ | + | ‐ | 21, 22 |
| 10 | ERLIN1–CHUK–WF19L1 | rs11597086 | A/C | 0.64 | ‐ | + | ‐ | 24, 25 |
| 11 | FADS1 | rs174546 | T/C | 0.31 | ‐ | + | ‐ | 21, 23 |
| 17 | PEMT | rs7946 | A/G | 0.65 | ‐ | ‐ | + | 30 |
| 19 | MBOAT7 | rs641738 | T/C | 0.43 | ‐ | + | ‐ | 26, 27 |
| 19 | TM6SF2 | rs58542926 | T/C | 0.07 | + | ‐ | ‐ | 8 |
| 22 | PNPLA3 | rs738409 | G/C | 0.24 | + | ‐ | ‐ | 10, 20 |
In CARDIoGRAMplusC4D.
Effect allele (A1) refers to the allele that predisposes to NAFLD.
In combination with a genetic association study for NAFLD (see Materials and Methods).
Relationship Between NAFLD Gene Variants and CAD
Clustering of all 12 NAFLD single‐nucleotide polymorphisms (SNPs) did not result in an association with CAD (odds ratio [OR], 1.0; 95% confidence interval [CI], 0.99‐1.00; P = 0.63) (Fig. 1). Similar results were obtained when myocardial infarction was used as the outcome (OR, 1.0; 95% CI, 0.99‐1.01; P = 0.93) (Supporting Fig. S1). Furthermore, results were not essentially different when only the most validated NAFLD genes, i.e., PNPLA3, GCKR, TM6SF2, and MBOAT7, were used for analysis (Supporting Fig. S2). Additional sensitivity analyses revealed a positive association with CAD (OR, 1.01; 95% CI, 1.00‐1.02; P = 0.02) after exclusion of those SNPs that affect NAFLD through impaired VLDL secretion, i.e., PEMT, MTTP, PNPLA3, and TM6SF2 (Supporting Table S1; Supporting Fig. S3). As expected, clustering of the four excluded genes resulted in a negative relationship with CAD (OR, 0.97; 95% CI, 0.96‐0.99; P < 0.0001) (Supporting Fig. S3).
Figure 1.
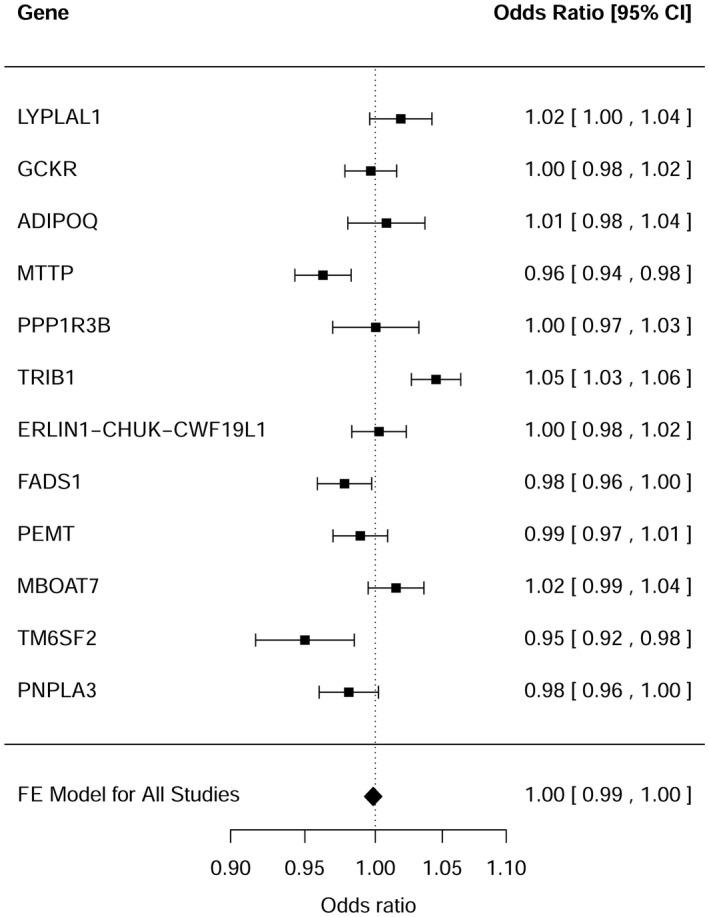
Relationship between NAFLD susceptibility genes and CAD.
Relationship Between NAFLD Gene Variants and Plasma Lipids
The association of the individual NAFLD SNPs with plasma lipids was subsequently assessed to evaluate the impact of plasma lipids on the observed relationships with CAD. Results for total cholesterol, LDL cholesterol, HDL cholesterol, and triglyceride levels were obtained from the Global Lipids Genetics Consortium and listed in Table 2. The effects of the individual NAFLD SNPs on plasma lipids were subsequently plotted (on the x axis) versus their effects on CAD risk (on the y axis) (Fig. 2). A strong correlation was observed for both total cholesterol and LDL cholesterol with CAD (r = 0.73 and P = 0.008; r = 0.76 and P = 0.004; Fig. 2, panels A and B, respectively) but not for plasma triglycerides and HDL cholesterol (r = 0.57 and P = 0.05; r = –0.14 and P = 0.66; Fig. 2, panels C and D, respectively). Similar results were observed when myocardial infarction was used as an outcome (Supporting Fig. S4).
Table 2.
Nafld Susceptibility SNPs in Relation to Plasma Lipids
| Gene | Variant | A1/A2* | A1 Freq | n† (×103) | Total Cholesterol | LDL Cholesterol | HDL Cholesterol | Triglycerides | ||||
|---|---|---|---|---|---|---|---|---|---|---|---|---|
| β (SE) | P Value | β (SE) | P Value | β (SE) | P Value | β (SE) | P Value | |||||
| LYPLAL1 | rs12137855 | C/T | 0.78 | 90 | 0.0026 (0.006) | 0.38 | 0.0074 (0.006) | 0.13 | –0.0061 (0.006) | 0.25 | 0.0054 (0.006) | 0.85 |
| GCKR | rs1260326 | T/C | 0.41 | 173 | 0.051 (0.004) | 3 × 10–42 | 0.021 (0.003) | 2 × 10⁻⁷ | –0.011 (0.004) | 2 × 10⁻³ | 0.11 (0.003) | 2 × 10–239 |
| ADIPOQ | rs266729 | G/C | NA | 90 | –0.0043 (0.006) | 0.60 | –0.006 (0.006) | 0.48 | 0.0028 (0.006) | 0.98 | 0.0028 (0.006) | 0.49 |
| MTTP | rs3816873 | C/T | 0.25 | 90 | –0.025 (0.006) | 4 × 10⁻⁵ | ‐0.027(0.006) | 2 × 10⁻⁵ | –0.0007 (0.005) | 0.77 | –0.012 (0.005) | 0.02 |
| PPP1R3B | rs4240624 | A/G | 0.92 | 172 | 0.078 (0.006) | 3 × 10–35 | 0.067 (0.006) | 3 × 10–23 | 0.082 (0.006) | 1 × 10–45 | –0.028 (0.006) | 1 × 10⁻⁶ |
| TRIB1 | rs2954029 | A/T | 0.53 | 173 | 0.062 (0.004) | 2 × 10–65 | 0.056 (0.004) | 2 × 10–50 | –0.041 (0.003) | 3 × 10–29 | 0.076 (0.003) | 1 × 10–107 |
| ERLIN1–CHUK–CWF19L1 | rs11597086 | A/C | 0.58 | 90 | –0.019 (0.005) | 5 × 10⁻⁵ | –0.009 (0.005) | 0.05 | –0.018 (0.005) | 2 × 10⁻⁴ | –0.0077 (0.005) | 0.07 |
| FADS1 | rs174546 | T/C | 0.36 | 173 | –0.048 (0.004) | 3 × 10–37 | –0.051 (0.004) | 2 × 10–39 | –0.039 (0.004) | 8 × 10–28 | 0.045 (0.003) | 7 × 10–38 |
| PEMT | rs7946 | A/G | 0.71 | 88 | –0.0037 (0.006) | 0.61 | –0.002 (0.006) | 0.93 | 0.0038 (0.006) | 0.42 | –0.012 (0.005) | 0.04 |
| MBOAT7 | rs641738 | T/C | 0.45 | 75 | 0.0058 (0.006) | 0.26 | 0.0009 (0.006) | 0.61 | 0.018 (0.006) | 1 × 10⁻³ | –0.0036 (0.005) | 0.18 |
| TM6SF2 | rs58542926 | T/C | 0.07 | 83 | –0.13 (0.009) | 4 × 10–45 | –0.13 (0.01) | 2 × 10–38 | 0.013 (0.009) | 0.17 | –0.13 (0.009) | 1 × 10–49 |
| PNPLA3 | rs738409 | G/C | NA | 88 | –0.022 (0.006) | 6 × 10⁻⁴ | –0.015 (0.006) | 0.02 | –0.016 (0.006) | 1 × 10⁻² | 0.005 (0.006) | 0.25 |
Data derived from the Global Lipids Genetics Consortium (see Materials and Methods).
Effect allele (A1) refers to the allele that predisposes to NAFLD.
n individuals included for the analysis with LDL cholesterol (analyses for the other lipid traits generally include more individuals).
Figure 2.
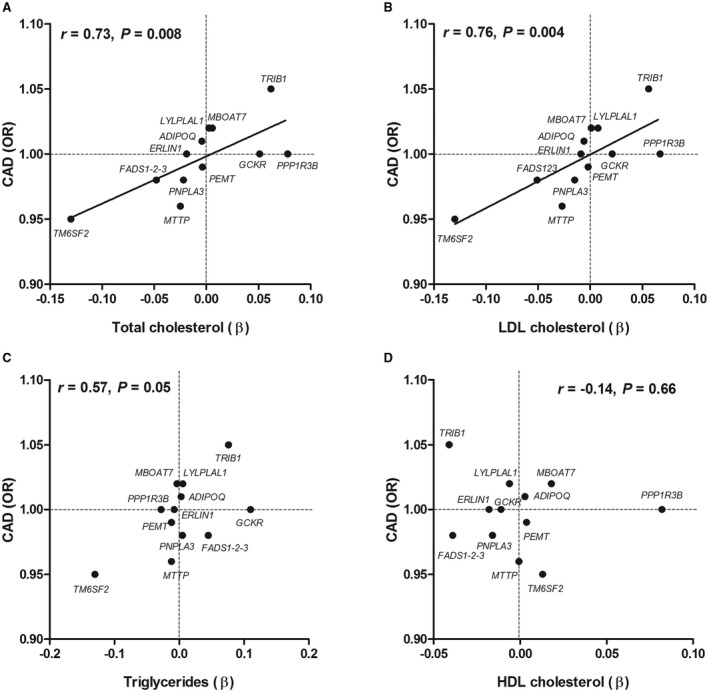
Relationship between (A) total cholesterol, (B) LDL cholesterol, (C) triglycerides, and (D) HDL cholesterol and CAD conferred by NAFLD susceptibility genes.
When the original analysis (Fig. 1) was repeated after adjustment for LDL cholesterol, the degree of heterogeneity was indeed reduced, albeit not completely (from Q = 58.4 and P < 0.0001 in the primary analysis [Fig. 1] to Q = 26.9 and P = 0.005 after correction for LDL cholesterol).
Discussion
The Mendelian randomization approach has demonstrated its utility in identifying causal factors in the pathogenesis of CAD not only for plasma biomarkers (e.g., LDL cholesterol) but also for traits such as body mass index and waist‐to‐hip ratio.31 The current study shows that NAFLD susceptibility genes do not cause CAD per se.
One of the key assumptions of the Mendelian randomization approach is that the gene variants that affect the exposure of interest do not exert pleiotropic effects. The risk of pleiotropy increases when the exposure of interest is a complex, nonprotein phenotype,5 as is the case for NAFLD. Given the central role the liver plays in (systemic) metabolic processes, it is difficult to identify genes that only affect NAFLD risk. In this respect, a distinction should be made between vertical and horizontal pleiotropy (Supporting Fig. S5). Pleiotropy is vertical when the gene variant is associated with a trait or biomarker that is downstream in the pathway that relates the exposure of interest with the clinical endpoint (CAD). Because this is a mediating effect, it does not invalidate the Mendelian randomization assumptions. In contrast, pleiotropy is horizontal when the gene variant affects pathways other than the exposure of interest.31 The complex intertwined relationship between NAFLD genes and plasma lipids probably results in both horizontal and vertical pleiotropy in the present study. Stable isotope studies have demonstrated that an increased flux of fatty acids and de novo lipogenesis contribute to the development of hepatic fat accumulation and consequently drive VLDL production.32 The observed associations of SNPs affecting fatty acid flux and de novo lipogenesis with plasma lipids (e.g., TRIB1 and GCKR) are therefore likely downstream effects of NAFLD and hence an example of vertical pleiotropy. Those SNPs that predispose to NAFLD through impaired VLDL secretion (i.e., MTTP, PEMT, PNPLA3, and TM6SF2) simultaneously decrease plasma lipids. Because NAFLD does in this case not precede the effect on plasma lipids, it could be viewed as an example of horizontal pleiotropy (Supporting Fig. S5). Of interest, when we conducted a sensitivity analysis without the latter genes, a positive relationship with CAD was observed.
Exclusion of those SNPs that affect NAFLD through impaired VLDL secretion does not necessarily eliminate all horizontal pleiotropy. Many SNPs were not specifically expressed in the liver (Supporting Table S1). Furthermore, the neutral effect of one liver‐specific gene (GCKR) on CAD may be explained by reported protective effects on kidney function.33 The use of a polygenic risk score, as done in the present study, may “balance out” horizontal pleiotropy.31 This can be formally tested by using Mendelian randomization–Egger regression or a weighted median method. Both methods require both gene‐exposure and gene‐outcome data.34, 35 Unfortunately, gene‐exposure data were not available for reasons outlined in the Materials and Methods section. This should be regarded as a limitation of this study.
The putative mechanism linking NAFLD to CAD has been a topic of interest in comprehensive reviews. Although low‐grade inflammation has often been suggested as the principal mediator,4, 36 the present study strongly suggests that plasma lipids are more important. Many of the NAFLD genes that were included in the present study not only predispose to hepatic fat accumulation but also to steatohepatitis.8, 10, 20, 22, 26, 37 Nevertheless, there was a strong relationship between plasma lipids and CAD, as conferred by the 12 NAFLD susceptibility SNPs, which is very much in line with a previous Mendelian randomization study in which 185 lipid‐susceptibility variants from these same cohorts were used to examine the causal relation between plasma lipids and CAD.38 Moreover, the intercepts of these relationships included zero (Fig. 2), which implicates that when the NAFLD susceptibility SNPs do not have any effect on plasma lipids, there is also no effect on CAD. This suggests that other vertical pleiotropic effects (such as low‐grade inflammation) or unbalanced horizontal pleiotropy do not play a major role in our analyses because they would have resulted in an intercept deviating from zero. Unfortunately, we did not dispose of a set of inflammatory markers to formally investigate the mediating role of inflammation on the relationship between NAFLD and CAD.
The current observations have important implications for future therapies that target NAFLD. Genetic studies have been instructive in predicting pharmacologic effects. An illustrative example is proprotein convertase subtilisin kexin type 9. Studies demonstrating that lipid‐lowering variants in the proprotein convertase subtilisin kexin type 9 gene protected from CAD preceded the recently reported results from phase 3 clinical trials.39, 40, 41, 42 The strong relationship between plasma lipids and CAD risk conferred by the NAFLD susceptibility variants strongly suggests that the design of an anti‐NAFLD drug should take into account any effects on plasma lipids. Otherwise, the beneficial effects on NAFLD may be offset by an increased risk to develop CAD. Genes in the right upper quadrant (Fig. 2A‐C) therefore appear to be the best therapeutic candidates.
This study has some strengths and limitations besides the previously mentioned issues regarding (horizontal) pleiotropy. The CARDIoGRAMplusC4D data set with more than 180,000 individuals genotyped for common and low‐frequency variants allowed us to study the relationship between reported NAFLD susceptibility genes and CAD with sufficient statistical power. Because this data set contains summarized data, it was not possible to perform subgroup analyses stratified for sex or ethnicity.
Common gene variants generally have small effect sizes,43 which probably explains the modest CAD risks conferred by the NAFLD genes. Of interest, gene variants in TM6SF2 have been shown to confer a large effect on NAFLD, plasma lipids, and CAD risk.6 In contrast, previous studies have reported a large effect size for the association between PNPLA3 and NAFLD,44 whereas a small effect was observed for the association with plasma lipids and CAD in the current study. These data corroborate the suggestion that the effect size of NAFLD gene variants on CAD risk is related to their effects on plasma lipids and not on liver disease per se, which was indeed confirmed in a recent Mendelian randomization study in which PNPLA3 was used as an instrument.45
PNPLA3 and TM6SF2 as well as MBOAT7 have not only been associated with NAFLD but also with other liver diseases, such as alcoholic fatty liver disease (AFLD).27 Although NAFLD is currently the most common liver disease in Western society,46 it is likely that patients with AFLD have also been included in CARDIoGRAMplusC4D. The conclusions drawn in the present study are therefore probably not confined to NAFLD but to hepatic fat accumulation in general.
Unfortunately, data on plasma lipids or other potential mediators/confounders of the relationship between NAFLD and CAD, such as type 2 diabetes, were not present in the CARDIoGRAMplusC4D data set. Previous GWASs have shown that variants in PNPLA3 and TM6SF2 are also associated with type 2 diabetes.47 We tried to resolve this, at least for plasma lipids, by using data from the well‐recognized Global Lipids Genetics Consortium, in line with previous reports.38 Although, the consequential strong relationship between plasma lipids and CAD, as conferred by the NAFLD susceptibility genes (Fig. 2), suggests an active role of plasma lipids, the lack of individual lipid data in CARDIoGRAMplusC4D limits strong inferences on the role of plasma lipids as a mediator of the relationship between NAFLD and CAD.
We applied stringent selection criteria for the NAFLD susceptibility genes, which makes the inclusion of false‐positive NAFLD variants unlikely. A disadvantage is that the number of genes included in the analyses was relatively low, which may have reduced statistical power. Finally, these gene variants can be in linkage disequilibrium with a variant in another gene, which is actually responsible for the observed association.
In summary, the present study nuances previous epidemiologic studies by demonstrating that NAFLD susceptibility genes do not unequivocally cause CAD. Further studies that focus on the mediating effects of plasma lipids are warranted because plasma lipids accounted for a substantial degree of the observed heterogeneity. These observations have important implications for future therapeutic strategies against NAFLD.
Supporting information
Supported by the Netherlands Heart Foundation (grant #2015T042 to M.B.).
Potential conflict of interest: Nothing to report.
References
Author names in bold designate shared co‐first authorship.
- 1. Charlton MR, Burns JM, Pedersen RA, Watt KD, Heimbach JK, Dierkhising RA. Frequency and outcomes of liver transplantation for nonalcoholic steatohepatitis in the United States. Gastroenterology 2011;141:1249‐1253. [DOI] [PubMed] [Google Scholar]
- 2. Ong JP, Pitts A, Younossi ZM. Increased overall mortality and liver‐related mortality in non‐alcoholic fatty liver disease. J Hepatol 2008;49:608‐612. [DOI] [PubMed] [Google Scholar]
- 3. Targher G, Byrne CD, Lonardo A, Zoppini G, Barbui C. Non‐alcoholic fatty liver disease and risk of incident cardiovascular disease: a meta‐analysis. J Hepatol 2016;65:589‐600. [DOI] [PubMed] [Google Scholar]
- 4. Adams LA, Anstee QM, Tilg H, Targher G. Non‐alcoholic fatty liver disease and its relationship with cardiovascular disease and other extrahepatic diseases. Gut 2017;66:1138‐1153. [DOI] [PubMed] [Google Scholar]
- 5. Jansen H, Samani NJ, Schunkert H. Mendelian randomization studies in coronary artery disease. Eur Heart J 2014;35:1917‐1924. [DOI] [PubMed] [Google Scholar]
- 6. Dongiovanni P, Petta S, Maglio C, Fracanzani AL, Pipitone R, Mozzi E, et al. Transmembrane 6 superfamily member 2 gene variant disentangles nonalcoholic steatohepatitis from cardiovascular disease. Hepatology 2015;61:506‐514. [DOI] [PubMed] [Google Scholar]
- 7. Holmen OL, Zhang H, Fan Y, Hovelson DH, Schmidt EM, Zhou W, et al. Systematic evaluation of coding variation identifies a candidate causal variant in TM6SF2 influencing total cholesterol and myocardial infarction risk. Nat Genet 2014;46:345‐351. [DOI] [PMC free article] [PubMed] [Google Scholar]
- 8. Kozlitina J, Smagris E, Stender S, Nordestgaard BG, Zhou HH, Tybjaerg‐Hansen A, et al. Exome‐wide association study identifies a TM6SF2 variant that confers susceptibility to nonalcoholic fatty liver disease. Nat Genet 2014;46:352‐356. [DOI] [PMC free article] [PubMed] [Google Scholar]
- 9. Simons N, Isaacs A, Koek GH, Kuc S, Schaper NC, Brouwers MC. PNPLA3, TM6SF2, and MBOAT7 genotypes and coronary artery disease. Gastroenterology 2017;152:912‐913. [DOI] [PubMed] [Google Scholar]
- 10. Romeo S, Kozlitina J, Xing C, Pertsemlidis A, Cox D, Pennacchio LA, et al. Genetic variation in PNPLA3 confers susceptibility to nonalcoholic fatty liver disease. Nat Genet 2008;40:1461‐1465. [DOI] [PMC free article] [PubMed] [Google Scholar]
- 11. Sookoian S, Pirola CJ. Meta‐analysis of the influence of I148M variant of patatin‐like phospholipase domain containing 3 gene (PNPLA3) on the susceptibility and histological severity of nonalcoholic fatty liver disease. Hepatology 2011;53:1883‐1894. [DOI] [PubMed] [Google Scholar]
- 12. Pirazzi C, Adiels M, Burza MA, Mancina RM, Levin M, Stahlman M, et al. Patatin‐like phospholipase domain‐containing 3 (PNPLA3) I148M (rs738409) affects hepatic VLDL secretion in humans and in vitro. J Hepatol 2012;57:1276‐1282. [DOI] [PubMed] [Google Scholar]
- 13. Dongiovanni P, Valenti L. Genetics of nonalcoholic fatty liver disease. Metabolism 2016;65:1026‐1037. [DOI] [PubMed] [Google Scholar]
- 14. Kahali B, Halligan B, Speliotes EK. Insights from genome‐wide association analyses of nonalcoholic fatty liver disease. Semin Liver Dis 2015;35:375‐391. [DOI] [PMC free article] [PubMed] [Google Scholar]
- 15. Macaluso FS, Maida M, Petta S. Genetic background in nonalcoholic fatty liver disease: a comprehensive review. World J Gastroenterol 2015;21:11088‐11111. [DOI] [PMC free article] [PubMed] [Google Scholar]
- 16. Anstee QM, Day CP. The genetics of nonalcoholic fatty liver disease: spotlight on PNPLA3 and TM6SF2. Semin Liver Dis 2015;35:270‐290. [DOI] [PubMed] [Google Scholar]
- 17. Nikpay M, Goel A, Won HH, Hall LM, Willenborg C, Kanoni S, et al. A comprehensive 1,000 genomes‐based genome‐wide association meta‐analysis of coronary artery disease. Nat Genet 2015;47:1121‐1130. [DOI] [PMC free article] [PubMed] [Google Scholar]
- 18. Willer CJ, Schmidt EM, Sengupta S, Peloso GM, Gustafsson S, Kanoni S, et al. Global Lipids Genetics Consortium . Discovery and refinement of loci associated with lipid levels. Nat Genet 2013;45:1274‐1283. [DOI] [PMC free article] [PubMed] [Google Scholar]
- 19. Viechtbauer W. Conducting meta‐analyses in R with the metafor package. J Stat Softw 2010;36:1‐48. [Google Scholar]
- 20. Speliotes EK, Yerges‐Armstrong LM, Wu J, Hernaez R, Kim LJ, Palmer CD, et al. GOLD Consortium. Genome‐wide association analysis identifies variants associated with nonalcoholic fatty liver disease that have distinct effects on metabolic traits. PLoS Genet 2011;7:e1001324. [DOI] [PMC free article] [PubMed] [Google Scholar]
- 21. Chambers JC, Zhang W, Sehmi J, Li X, Wass MN, Van der Harst P, et al. Alcohol Genome‐wide Association (AlcGen) Consortium; Diabetes Genetics Replication and Meta‐analyses (DIAGRAM+) Study; Genetic Investigation of Anthropometric Traits (GIANT) Consortium; Global Lipids Genetics Consortium; Genetics of Liver Disease (GOLD) Consortium; International Consortium for Blood Pressure (ICBP‐GWAS); Meta‐analyses of Glucose and Insulin‐Related Traits Consortium (MAGIC). Genome‐wide association study identifies loci influencing concentrations of liver enzymes in plasma. Nat Genet 2011;43:1131‐1138. [DOI] [PMC free article] [PubMed] [Google Scholar]
- 22. Kitamoto A, Kitamoto T, Nakamura T, Ogawa Y, Yoneda M, Hyogo H, et al. Association of polymorphisms in GCKR and TRIB1 with nonalcoholic fatty liver disease and metabolic syndrome traits. Endocr J 2014;61:683‐689. [DOI] [PubMed] [Google Scholar]
- 23. Wang L, Athinarayanan S, Jiang G, Chalasani N, Zhang M, Liu W. Fatty acid desaturase 1 gene polymorphisms control human hepatic lipid composition. Hepatology 2015;61:119‐128. [DOI] [PMC free article] [PubMed] [Google Scholar]
- 24. Yuan X, Waterworth D, Perry JR, Lim N, Song K, Chambers JC, et al. Population‐based genome‐wide association studies reveal six loci influencing plasma levels of liver enzymes. Am J Hum Genet 2008;83:520‐528. [DOI] [PMC free article] [PubMed] [Google Scholar]
- 25. Feitosa MF, Wojczynski MK, North KE, Zhang Q, Province MA, Carr JJ, et al. The ERLIN1‐CHUK‐CWF19L1 gene cluster influences liver fat deposition and hepatic inflammation in the NHLBI Family Heart Study. Atherosclerosis 2013;228:175‐180. [DOI] [PMC free article] [PubMed] [Google Scholar]
- 26. Mancina RM, Dongiovanni P, Petta S, Pingitore P, Meroni M, Rametta R, et al. The MBOAT7‐TMC4 variant rs641738 increases risk of nonalcoholic fatty liver disease in individuals of European descent. Gastroenterology 2016;150:1219‐1230.e1216. [DOI] [PMC free article] [PubMed] [Google Scholar]
- 27. Buch S, Stickel F, Trepo E, Way M, Herrmann A, Nischalke HD, et al. A genome‐wide association study confirms PNPLA3 and identifies TM6SF2 and MBOAT7 as risk loci for alcohol‐related cirrhosis. Nat Genet 2015;47:1443‐1448. [DOI] [PubMed] [Google Scholar]
- 28. Wang J, Guo XF, Yu SJ, Song J, Zhang JX, Cao Z, et al. Adiponectin polymorphisms and non‐alcoholic fatty liver disease risk: a meta‐analysis. J Gastroenterol Hepatol 2014;29:1396‐1405. [DOI] [PubMed] [Google Scholar]
- 29. Zheng W, Wang L, Su X, Hu XF. MTP ‐493G>T polymorphism and susceptibility to nonalcoholic fatty liver disease: a meta‐analysis. DNA Cell Biol 2014;33:361‐369. [DOI] [PubMed] [Google Scholar]
- 30. Tan HL, Mohamed R, Mohamed Z, Zain SM. Phosphatidylethanolamine N‐methyltransferase gene rs7946 polymorphism plays a role in risk of nonalcoholic fatty liver disease: evidence from meta‐analysis. Pharmacogenet Genomics 2016;26:88‐95. [DOI] [PubMed] [Google Scholar]
- 31. Dale CE, Fatemifar G, Palmer TM, White J, Prieto‐Merino D, Zabaneh D, et al. UCLEB Consortium; METASTROKE Consortium. Causal associations of adiposity and body fat distribution with coronary heart disease, stroke subtypes, and type 2 diabetes mellitus: a Mendelian randomization analysis. Circulation 2017;135:2373‐2388. [DOI] [PMC free article] [PubMed] [Google Scholar]
- 32. Fabbrini E, Mohammed BS, Magkos F, Korenblat KM, Patterson BW, Klein S. Alterations in adipose tissue and hepatic lipid kinetics in obese men and women with nonalcoholic fatty liver disease. Gastroenterology 2008;134:424‐431. [DOI] [PMC free article] [PubMed] [Google Scholar]
- 33. Kottgen A, Pattaro C, Boger CA, Fuchsberger C, Olden M, Glazer NL, et al. New loci associated with kidney function and chronic kidney disease. Nat Genet 2010;42:376‐384. [DOI] [PMC free article] [PubMed] [Google Scholar]
- 34. Bowden J, Davey Smith G, Haycock PC, Burgess S. Consistent estimation in Mendelian randomization with some invalid instruments using a weighted median estimator. Genet Epidemiol 2016;40:304‐314. [DOI] [PMC free article] [PubMed] [Google Scholar]
- 35. Bowden J, Davey Smith G, Burgess S. Mendelian randomization with invalid instruments: effect estimation and bias detection through Egger regression. Int J Epidemiol 2015;44:512‐525. [DOI] [PMC free article] [PubMed] [Google Scholar]
- 36. Targher G, Day CP, Bonora E. Risk of cardiovascular disease in patients with nonalcoholic fatty liver disease. N Engl J Med 2010;363:1341‐1350. [DOI] [PubMed] [Google Scholar]
- 37. Gambino R, Cassader M, Pagano G, Durazzo M, Musso G. Polymorphism in microsomal triglyceride transfer protein: a link between liver disease and atherogenic postprandial lipid profile in NASH? Hepatology 2007;45:1097‐1107. [DOI] [PubMed] [Google Scholar]
- 38. Do R, Willer CJ, Schmidt EM, Sengupta S, Gao C, Peloso GM, et al. Common variants associated with plasma triglycerides and risk for coronary artery disease. Nat Genet 2013;45:1345‐1352. [DOI] [PMC free article] [PubMed] [Google Scholar]
- 39. Kathiresan S; Myocardial Infarction Genetics Consortium . A PCSK9 missense variant associated with a reduced risk of early‐onset myocardial infarction. N Engl J Med 2008;358:2299‐2300. [DOI] [PubMed] [Google Scholar]
- 40. Cohen JC, Boerwinkle E, Mosley TH Jr, Hobbs HH. Sequence variations in PCSK9, low LDL, and protection against coronary heart disease. N Engl J Med 2006;354:1264‐1272. [DOI] [PubMed] [Google Scholar]
- 41. Sabatine MS, Giugliano RP, Wiviott SD, Raal FJ, Blom DJ, Robinson J, et al. Open‐Label Study of Long‐Term Evaluation against LDL Cholesterol (OSLER) Investigators. Efficacy and safety of evolocumab in reducing lipids and cardiovascular events. N Engl J Med 2015;372:1500‐1509. [DOI] [PubMed] [Google Scholar]
- 42. Robinson JG, Farnier M, Krempf M, Bergeron J, Luc G, Averna M, et al.;ODYSSEY LONG TERM Investigators . Efficacy and safety of alirocumab in reducing lipids and cardiovascular events. N Engl J Med 2015;372:1489‐1499. [DOI] [PubMed] [Google Scholar]
- 43. Manolio TA, Collins FS, Cox NJ, Goldstein DB, Hindorff LA, Hunter DJ, et al. Finding the missing heritability of complex diseases. Nature 2009;461:747‐753. [DOI] [PMC free article] [PubMed] [Google Scholar]
- 44. Valenti L, Dongiovanni P, Ginanni Corradini S, Burza MA, Romeo S. PNPLA3 I148M variant and hepatocellular carcinoma: a common genetic variant for a rare disease. Dig Liver Dis 2013;45:619‐624. [DOI] [PubMed] [Google Scholar]
- 45. Lauridsen BK, Stender S, Kristensen TS, Kofoed KF, Kober L, Nordestgaard BG, et al. Liver fat content, non‐alcoholic fatty liver disease, and ischaemic heart disease: Mendelian randomization and meta‐analysis of 279 013 individuals. Eur Heart J 2018;39:385‐393. [DOI] [PubMed] [Google Scholar]
- 46. Younossi ZM, Stepanova M, Afendy M, Fang Y, Younossi Y, Mir H, et al. Changes in the prevalence of the most common causes of chronic liver diseases in the United States from 1988 to 2008. Clin Gastroenterol Hepatol 2011;9:524‐530.e521. [DOI] [PubMed] [Google Scholar]
- 47. Liu DJ, Peloso GM, Yu H, Butterworth AS, Wang X, Mahajan A, et al. Exome‐wide association study of plasma lipids in >300,000 individuals. Nat Genet 2017;49:1758‐1766. [DOI] [PMC free article] [PubMed] [Google Scholar]
Associated Data
This section collects any data citations, data availability statements, or supplementary materials included in this article.
Supplementary Materials