Abstract
The mouse has become an influential model system for investigating the mammalian nervous system. Technologies in mice enable recording and manipulation of neural circuits during tasks where they respond to sensory stimuli by licking for liquid rewards. Precise monitoring of licking during these tasks provides an accessible metric of sensory-motor processing, particularly when combined with simultaneous neural recordings. There are several challenges in designing and implementing lick detectors during head-fixed neurophysiological experiments in mice. First, mice are small, and licking behaviors are easily perturbed or biased by large sensors. Second, neural recordings during licking are highly sensitive to electrical contact artifacts. Third, submillisecond lick detection latencies are required to generate control signals that manipulate neural activity at appropriate time scales. Here we designed, characterized, and implemented a contactless dual-port device that precisely measures directional licking in head-fixed mice performing visual behavior. We first determined the optimal characteristics of our detector through design iteration and then quantified device performance under ideal conditions. We then tested performance during head-fixed mouse behavior with simultaneous neural recordings in vivo. We finally demonstrate our device’s ability to detect directional licks and generate appropriate control signals in real time to rapidly suppress licking behavior via closed-loop inhibition of neural activity. Our dual-port detector is cost effective and easily replicable, and it should enable a wide variety of applications probing the neural circuit basis of sensory perception, motor action, and learning in normal and transgenic mouse models.
NEW & NOTEWORTHY Mice readily learn tasks in which they respond to sensory cues by licking for liquid rewards; tasks that involve multiple licking responses allow study of neural circuits underlying decision making and sensory-motor integration. Here we design, characterize, and implement a novel dual-port lick detector that precisely measures directional licking in head-fixed mice performing visual behavior, enabling simultaneous neural recording and closed-loop manipulation of licking.
Keywords: closed-loop optogenetics, head-fixed behavior, licking, mouse, silicon probe
INTRODUCTION
The mouse has become a main model system for understanding the mammalian brain. This is largely due to three recent developments. First, a surge of genetic technology allows precise interrogation of specific neurons and circuits throughout the mouse nervous system (Madisen et al. 2012). Second, these technologies have facilitated creation of genetically defined mouse models of human neurological diseases (Rosenfeld et al. 1988; Schroeder et al. 2015). Third, the small size of mice enables sophisticated experiments combining neural recording and stimulation during well-controlled behavioral tasks (Guo et al. 2014b).
Many laboratories have developed behavioral tasks investigating learning, sensory-motor processing, and decision making in head-fixed mice. In such tasks, mice learn to respond to sensory cues or perform motor actions, typically for liquid rewards. These rewards are usually obtained by licking a spout. Most tasks deliver rewards at a single spout, without constraints on the exact path of the tongue; more recently, the utility of licking as a direct behavioral readout has been improved by training mice to lick at two distinct ports requiring directional control of licking (Guo et al. 2014a; Mayrhofer et al. 2013; Siniscalchi et al. 2016). In these tasks, the mouse must choose to lick left or lick right in response to an appropriate stimulus. Such tasks enable the study of specific neural circuits involved in complex decision making and sensory-motor integration, with the stability of head-fixed conditions (Burgess et al. 2017; Resulaj and Rinberg 2015; Sanders and Kepecs 2012; Siniscalchi et al. 2016).
There remain several engineering challenges for high-resolution lick detection, simultaneous neural recording, and stimulation during these tasks. One constraint is the method of sensing licks. Many existing strategies use electrical contact sensors or capacitive sensors (Micallef et al. 2017; Sippy et al. 2015; Slotnick 2009), but these can create artifacts with comparable amplitudes and time courses as neural or behavioral signals (Schwarz et al. 2010), or they require specific electrical conditions for accurate sensing (Hayar et al. 2006). Artifacts can be eliminated through filtering circuits (Rinberg 2012) or signal processing algorithms, but such circuits often contain many additional components, and online algorithms require sophisticated signal processing and modeling strategies (Chen et al. 2013). Contactless photosensors avoid many of these complications, and single-port photosensors are a reliable method for detecting licks (Isett et al. 2018). These have been used by our own laboratory and others for detecting licks in a single direction during visual, auditory, and somatosensory tasks (Isett et al. 2018; Sanders and Kepecs 2012; Speed et al. 2018). Extending a contactless photosensor design for use in a two-port directional licking task requires first characterizing sensors and optimal detector performance and then measuring detector performance simultaneous with neural recordings during behavior.
A second constraint is provided by the temporal characteristics of licking. The frequency of licking in mice is ~7 Hz, depending on strain (Boughter et al. 2007). However, the profile of individual licks is much faster, where accurate sensing of lick onset and offset requires submillisecond resolution. This is particularly important if real-time lick detection serves as a control signal for other devices, such as computer control of behavioral tasks, or gating electrical or optical stimulation of the brain (Bolus et al. 2018). Control signals triggered on licking should operate much faster than the millisecond time scale of electrical communication in neural circuits. Submillisecond resolution has been achieved and characterized in a professionally designed detector, but this is a contact-type detector that only has a rigid single port (Resulaj and Rinberg 2015; Rinberg 2012).
A final constraint is that mice are small, and their behavior is easily perturbed by large devices that obstruct orofacial access. A main challenge is to ensure easy and unbiased access of the mouse’s tongue to both reward spouts, while not blocking the visual field or perturbing the whiskers. Although many laboratories have implemented two-alternative directional licking tasks (Guo et al. 2014a; Marques et al. 2018; Mayrhofer et al. 2013), there is currently no open-source and fully characterized device that fits all the desired performance criteria described here (summarized in Table 1). Such a device would greatly facilitate the adoption, reproducibility, and interpretability of dual-lick-port paradigms and tasks.
Table 1.
Summary of desired performance criteria for dual-port detector
| Desired Characteristics | Rinberg et al. (2012) | Isett et al. (2018) | Current Design |
|---|---|---|---|
| Detection resolution: >14 Hz for licking; >1 kHz for onset detection and control signals | 1 kHz | 200 Hz (estimated) | 800 kHz |
| Signal noise: maximum 10% | N/A | N/A | <1% |
| Detection time: max 70 ms | <1 ms | 5 ms (estimated) | <1 μs |
| Dimensions: <1 cm wide (mouse snout) | N/A | 23 × 19 × 22 mm3 (estimated) | 23 × 20 × 22 mm3 |
| Lick port size: <10 mm wide (mouse tongue) | N/A | 6 mm | 8 mm |
| Simple and robust amplification/filtering circuit | >50 components | 7 components | 5 components |
Estimated values are based on provided measurements or pictured data. For example, Isett (2018) describes a single-port detector; however, its dimensions as a dual-port detector in our configuration were estimated. The lick detector of (Resulaj and Rinberg 2015; Rinberg 2012) describes a filtering circuit but not dimensions of a physical sensor; thus its dimensions are not available. N/A, not applicable.
We therefore designed a novel, contactless, dual-port lick detector that fulfills these desired characteristics. We first detail the design strategy and performance characteristics of the dual-port detector. We next show detector performance during mouse visual behavior with simultaneous electrical recording of neural signals. Finally, we implement the detector for closed-loop behavioral experiments, where detected licks trigger precisely timed optical activation of inhibitory neurons and cessation of licking behavior within milliseconds of detection. Our dual-port detector is cost effective and easily replicable, and it should enable a wide-variety of applications probing the neural basis of sensory perception, motor action, and learning.
METHODS
Detector assembly.
A detailed parts list and instructions for detector assembly are given in the appendix, and all relevant files for 3D printing and further assembly are included in the Distribution Package available online (https://github.com/haiderlab/DP-Lick-Detector). Briefly, Omron transmissive photomicrosensors (ee-sx4070) were glued (Loctite) to a 3D-printed polylactic acid (PLA) base and soldered to the open end of a Cat 5e Ethernet cable. A custom amplification/filtering circuit (described in the appendix) was soldered to a female Ethernet (RJ45) connector, and to power (2.5-mm female barrel connector) and BNC leads. Connecting the sensor and the circuit at the Ethernet joint completed the construction of the detector.
Characterization in ideal conditions.
Detector performance was tested in ideal benchtop conditions. Each side of two dual-port detectors was connected individually to an oscilloscope (four detectors total). Since the design described above is modular between the photosensor and the amplification circuit, each photosensor was assigned a circuit and these together were considered a detector. Each “dual-port detector” houses two such detectors. Detectors were connected to a Tektronix oscilloscope (TBS1064) using a short BNC cable and powered using a 12-V power supply. The photosensor was triggered manually using a flat object (e.g., flathead screwdriver) to mimic the dimensions of a mouse tongue. The oscilloscope was set to capture the onset or offset of the triggered signal, and after each trigger the data was saved to a USB drive. Each detector was triggered 101 times for onset and 101 times for offset. Each data set contained 2,500 samples (sampling rate = 500 MHz or 2-ns resolution).
Characterization in experimental conditions.
All experiments with head-fixed, water-restricted mice were approved by the Georgia Institute of Technology Institutional Animal Care and Use Committee. Detector performance was first characterized during simplified experimental conditions. A water-restricted mouse was head-fixed and placed in front of the detector, and water rewards were passively delivered to elicit licking. In a second set of conditions, we performed the same measurements in the context of a visual detection task, where the mouse had to actively detect and respond to visual stimuli to obtain rewards at a particular detector. Mice learned to lick for rewards at each individual detector, depending on the location of the visual stimulus. For example, if the visual stimulus appeared in the left visual field, the mouse could obtain a water reward by licking at the left lick port during the stimulus response window (typically 1 s). The first trial after the switch of the stimulus location contained a grace period (~1.5 s) where licks to either detector during stimulus presentation were rewarded; thereafter, licks to the wrong detector were unrewarded and penalized with a time-out interval. Details of animal preparation, visual stimulus properties, and behavioral training can be found elsewhere (Speed et al. 2018). Each detector was connected to the computer-controlled behavioral apparatus as shown in Fig. 1, and copies of signals sent to an oscilloscope for high-resolution sampling (as described for testing in ideal conditions). In the behavioral experiments, ~15′ BNC cables are used between the detector and the oscilloscope, producing small but measurable microsecond delays in the absolute latency of detection (Fig. 5).
Fig. 1.
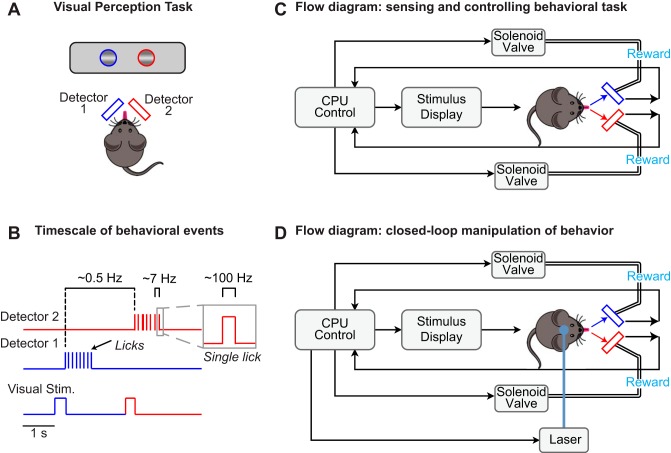
Conceptual diagrams for dual-port lick detection during behavior. A: behavioral task where head-fixed mice report perception of visual stimuli by licking. Gratings appear unpredictably in either the left or right visual fields. Mice report stimulus detection with directional licking (left or right) and receive rewards only at one of the lick ports. Two detectors independently measure licks to each port. B: relevant behavioral events span multiple time scales: directional lick bouts between trials of visual stimulus (Stim.) presentation (~0.5 Hz), detection of individual licks at each detector (~7 licks/s per bout), and rapid onset and offset detection of each individual lick (onset/offset <1-ms resolution; duration ~30 ms). C: conceptual flow diagram for sensing licks and controlling behavioral task parameters. A CPU controls the display of visual stimuli and triggers solenoid valve delivery of rewards upon sensing licks at the appropriate detector only during stimulus display. D: conceptual flow diagram as in C, with addition of closed-loop control of laser light that directly drives or inhibits neural activity upon detection of directional licking.
Fig. 5.
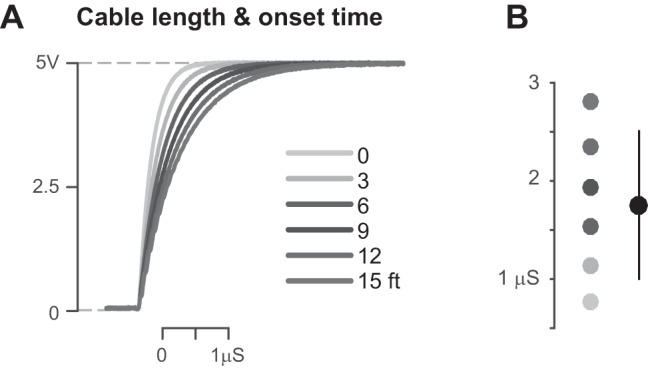
Cable length and the delay of signal onset. A: detected onset time increases with increase in cable length between detector and oscilloscope. Onset time was recorded 20 times each for 6 lengths of cable. Mean traces of 20 trials shown for each length. Adding cables elsewhere in the system produces this same effect. B: onset time as a function of cable length in system (shading as in A). Means are 0.76 (SD 0.03), 1.1 (SD 0.06), 1.5 (SD 0.09), 1.9 (SD 0.1), 2.4 (SD 0.18), 2.8 (SD 0.21) μs [mean (SD), n = 20]. Overall, mean onset time is 1.8 (SD 0.76) μs.
Neural recordings and analysis.
Detailed procedures for laminar local field potential recordings have been presented elsewhere (Saleem et al. 2017; Speed et al. 2018). Briefly, recordings were done with multisite silicon probes (NeuroNexus) consisting of a single 32-channel shank. Electrodes were advanced ~1,000 μm below the cortical surface, and signals were acquired at 30 kHz (Blackrock Microsystems). Spectral analysis of local field potential (LFP) power during licks was performed by extracting windows of LFP data ±0.5 s surrounding each lick. LFP data was averaged across all channels, and the autocorrelation of LFP was used to calculate the power spectral density (fast Fourier transform of the autocorrelation, squared and normalized by maximum value). This data was then averaged across all recording days.
Optogenetic stimulation.
For optogenetic inactivation experiments, we crossed PV-Cre × Ai32(ChR2) mice and trained them in the visual detection task. A small craniotomy (~100 μm) was made over the left anterolateral motor cortex (ALM) and a fiber-coupled laser (473 nm) delivered pulses of light (0.1-s pulses triggered on first lick in a bout, 7 mW measured at the cranium) to inactivate ALM. All regions of the skull surrounding the craniotomy were covered with opaque dental cement. Pulses were triggered in response to spontaneous lick bouts in the intertrial intervals on 50% of randomly selected trials. We focused on spontaneous, unrewarded lick bouts to remove potential effects of visual stimuli and reward anticipation on neural activity. To smoothly estimate the time course of licking with and without optogenetic stimulation, we computed the envelope of all lick bouts (aligned at first lick in the bout). Bout envelopes were defined by Rect functions of unit amplitude that lasted from the first to the last lick in the bout and were averaged across trials within each condition.
Lick detector data processing.
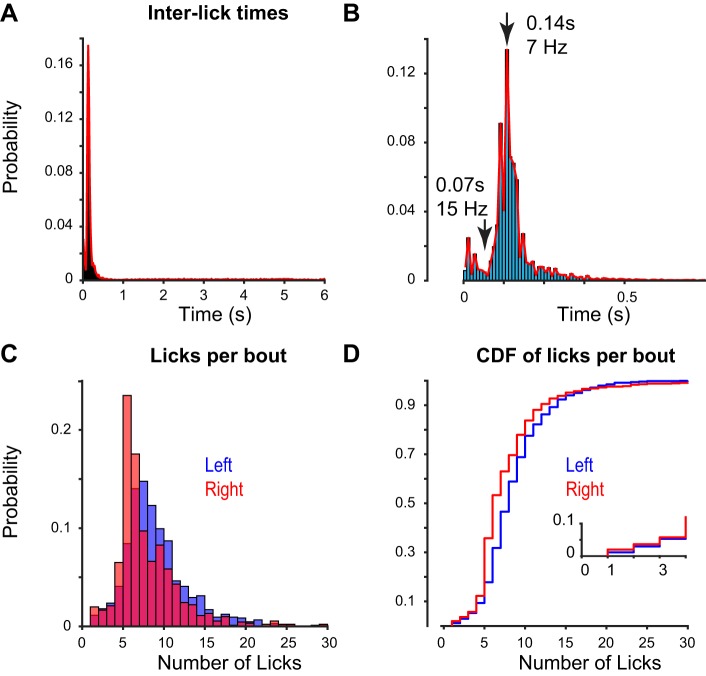
Lick onset time was defined as time at which the signal rose from 10 to 97% of the final high signal (~5 V). For onset curves, low signal was taken as signal before onset start. Offset time was defined as time from 97% to 2% of high signal. For offset curves, high signal was taken as signal before offset start. Low signal was taken as signal after offset end. For each detector, time domain average of all traces (onset or offset) was taken as mean trace for that detector. Pearson correlation coefficients were calculated between mean traces for the four detectors, then squared to obtain r2 values. Onset time, offset time, and signal noise were calculated for each individual trace and then averaged for each detector to give mean onset time, mean offset time, and mean signal noise (high and low) for each detector. These values were used to obtain reported mean and standard deviation across detectors. In left/right bias analysis, data from three mice were sorted into lick bouts. Lick bouts are the natural action of a mouse licking and rapidly consuming liquid reward. Lick bouts were defined as groups of licks with interlick time <0.5 s and >0.0667 s (15 Hz upper limit; summarized in Fig. 7). A histogram of the number of licks between presentations of rewarded stimuli (separated for left and right licks) shows that most rewarded lick bouts contain four or more licks (Fig. 7C). Therefore, to eliminate “exploratory” bouts of one to three stray licks, only bouts containing four or more licks were used in further lick frequency analysis. These lick bouts were identified, and the reciprocal of interlick time was used to calculate mean licking frequency within each bout. All bouts were averaged to obtain overall mean licking frequency for each mouse on a detector. This analysis was carried out separately for left and right licks.
Fig. 7.
Determination of lick bouts and lick frequency within bouts. A: interlick times for all behavioral sessions (n = 24,000 licks; 174 behavioral sessions in 3 mice over 20 days). Time scale is limited to 0–6 s. Behavioral task parameters define interstimulus intervals to fall between 0.5 and 6 s, randomly per trial. Histogram shows >75% of interlick intervals fall below 0.5 s, with no secondary peaks between 0.5 and 6 s. Therefore consecutive licks with intervals <0.5 s were grouped into the same lick bout. B: higher resolution binning of data in A. Local minimum of histogram (0.07 s) defined the upper frequency limit for interlick data within bouts (93% of licks < 15 Hz). C: number of licks per bout following reward delivery during visual task, at left and right detectors. D: cumulative distribution function (CDF) of data in C. Bouts containing 4 or more licks (~95% of data) are considered consummatory lick bouts.
Maximum detection frequency was calculated as follows. For each detector, mean onset and offset time were calculated and combined in the following formula:
MATLAB was used for all statistical analyses.
RESULTS
Design strategy and iterations for optimal two-port detector.
Figure 1 shows conceptual flow diagrams for integration of a two-port lick detector with a visual spatial perception task and neurophysiological experiments. Mice learn to detect the onset of a single visual stimulus and to lick to the left or right depending on its spatial location (Fig. 1A). Only licks to the appropriate port are rewarded, and rewards are delivered only if the first lick occurs while the stimulus is on the screen (typically ~1 s). Aside from a single trial grace period (see methods), licks to the incorrect port are unrewarded and lead to a time-out period. Real-time lick detection updates computer control of behavioral parameters on a trial-by-trial basis (Fig. 1B). The full functionality of the detector is tested in these conditions and then extended so that real-time lick detection provides a control signal for optogenetic stimulation of neural activity.
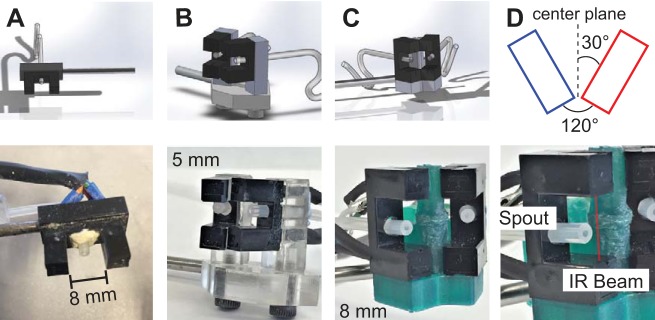
The design of the dual-port lick detector went through several stages of iteration and optimization. The starting point was a single-port detector with an 8-mm opening positioned horizontally (Fig. 2A). This design and hardware works well for the single-detector task (Speed et al. 2018). A key constraint for the dual-port detector was the need for two sensors to fit within reach of the mouse’s tongue, while maintaining a separation distance that enforces detection of licks only at a single port. We first tested these iterations outside of the full behavioral task and only measured licking to passive water delivery in water-restricted mice. Mice were head-fixed within an apparatus that ensures stable head and pupil position during the visual task, as described elsewhere (Burgess et al. 2017; Haider et al. 2016; Speed et al. 2018).
Fig. 2.
Design iterations for dual-port lick detectors. A: the single-port optical lick detector design (top), and implementation during behavioral experiments (bottom). Scale bar indicates 8-mm opening. Elastomer isolates circuitry from silicone tubing dispensing water. B: first iteration of dual-port design (top). Detectors had a 5-mm opening and were mounted on an acrylic base for variable angle and vertical positioning of sensors (bottom). C: final design (top) further optimized after testing with mice. Detectors were widened to 8-mm opening, and 3D-printed base was customized to have a smaller footprint and an optimal fixed angle (120°) between detectors. D: expanded view of detector in C, showing position of infrared (IR) beam and spout.
We started with multiple iterations using horizontal detector placement. We found that mice have a narrow maximum directional angle of licking that inhibited normal behavior with horizontal detectors. The key solution to this problem was vertical positioning of the sensors (Fig. 2B). This first iteration used sensors with 5-mm openings mounted on a custom laser-cut acrylic base, in an effort to reduce the overall profile of the device. This design also allowed the angle between the detectors to be adjusted for anticipated variability between mice. This iteration proved successful for directional licking behavior, but it provided two drawbacks. First, 5-mm detectors were too small to detect every single lick (confirmed with simultaneous high-speed video). Second, the acrylic base allowed too many degrees of freedom for tongue entry at either detector port, often leading to tongue motion being detected at both ports.
After further testing with mice, we found the optimum angle from the vertical center plane for directional tongue entry to be 30°. We designed a fixed base using this angle, increased the opening of the detectors to 8 mm, and tested sensor performance and mouse behavior with this iteration (Fig. 2C). The final iteration proved optimal, and the fixed-angle, 3D-printable base is easy to manufacture and facilitates repeatable detector assembly. We constructed four replicates of this detector for further testing.
Dual-port detector displays repeatability, low-noise, and submillisecond resolution.
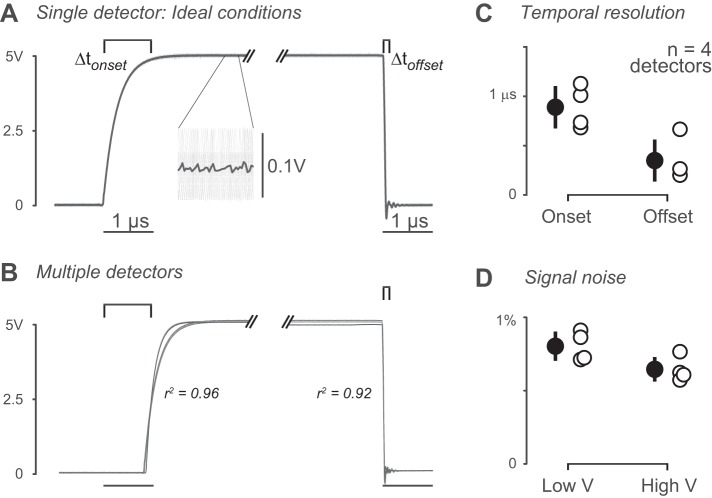
The performance of the detector was next characterized in ideal, benchtop conditions. Four dual-port detectors were connected to an oscilloscope and triggered manually (see Characterization in ideal conditions under methods), and 101 lick-onset and -offset traces were captured separately for each detector. High signal was defined as 5 V, low signal as 0 V. Onset time was defined as time from 10 to 97% of high signal (0.5 to 4.88 V). Offset time was defined as time from 97% to less than 2% of high signal (4.88 to 0.1 V) (Fig. 3A). Mean onset and offset traces were similar across detectors (Fig. 3B). Across detectors, the mean r2 value between onset curves was 0.96 (SD 0.06) (n = 4 detectors, 404 trials). For offset curves, r2 = 0.92 (SD 0.12) (n = 4 detectors, 404 trials).
Fig. 3.
Characterization of detectors in ideal conditions. A: example onset and offset curves (Δtonset and Δtoffset, respectively). Low signal = 0 V, high signal = 5 V. Onset is time from 10 to 97% of high signal (0.5 to ~4.88 V). Offset is time from 97% to less than 2% of high signal (4.88 to 0.1 V). Inset shows mean (dark gray) across individual trials (light gray). B: overlaid onset and offset curves of detectors tested in ideal conditions (n = 4). For onset, mean r2 = 0.96 (SD 0.06) (n = 4 detectors, 404 trials). For offset, r2 = 0.92 (SD 0.12) (n = 4 detectors, 404 trials). C: onset and offset time for each detector. Mean onset time = 0.9 (SD 0.21) μs (n = 404 trials, 4 detectors). Mean offset time = 0.35 (SD 0.2) μs (n = 404 trials). D: signal noise for each detector. Mean low signal (0 V) noise = 0.80 (SD 0.10)% (% of high signal, n = 404 trials, 4 detectors). Mean high signal (5 V) noise = 0.65 (SD 0.08)% (n = 404 trials).
We next calculated the temporal resolution of onset and offset detection in ideal conditions (Fig. 3C). Mean onset time was 0.9 (SD 0.21) μs [mean (SD); n = 4], and mean offset time was 0.35 (SD 0.2) μs (n = 4). The maximum theoretical detection frequency is based on the mean onset and offset time of traces in ideal conditions (see Lick detector data processing under methods). Maximum detection frequency = 850 (SD 210) kHz (n = 404 traces). Taking into account the Nyquist rate for data sampling, this permits sampling of data up to 425 kHz. Signal noise was calculated as percent of the average high or low signal on individual trials (Fig. 3D). Noise for the low signal was 0.80 (SD 0.10)% of the maximum signal [mean (SD); n = 4]. Noise for the high signal was 0.65 (SD 0.08)% of the mean low signal value (n = 4).
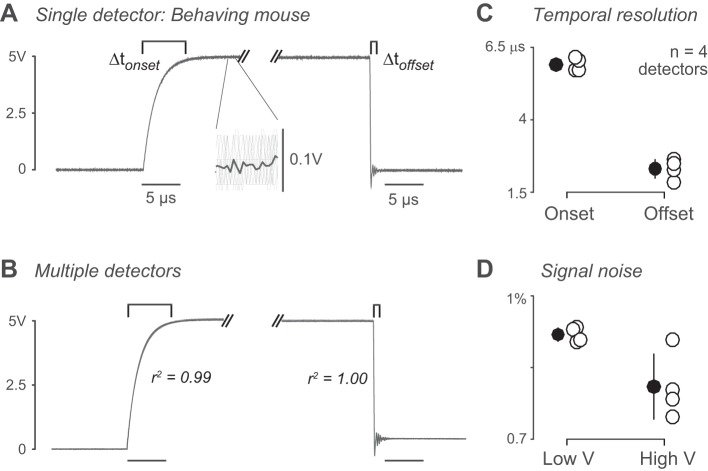
We next characterized detector performance during directional licking. We used a mouse trained in the visual perception task and first measured licks in simplified conditions. We measured licks in response to passive reward presentation outside of the behavioral task (see methods). Two dual-port detectors were connected to an oscilloscope, and each side of the dual-port detector was tested individually. Twenty onset and offset traces were captured separately for each detector; four detectors were tested in total. High signal was defined as 4.9 V, low signal as 0 V. Onset and offset times were calculated as in benchtop conditions (0.49 to 4.75 V and 4.75 to 0.098 V, respectively) (Fig. 4A). Onset and offset traces were again highly repeatable across detectors (Fig. 4B). The mean r2 value between onset curves was 0.99 (SD 0.0001) (n = 4 detectors, 80 trials). For offset curves, r2 = 1.0 (SD 0.00002) (n = 4 detectors, 80 trials). However, the absolute latency of detection was longer than in ideal conditions, owing to the additional cable lengths required for connecting detectors to the behavioral apparatus and computer control (Fig. 5). Mean onset and offset times were calculated for each detector (Fig. 4C). Mean onset time was 6.0 (SD 0.23) μs [mean (SD); n = 4]. Mean offset time was 2.3 (SD 0.34) μs (n = 4). Signal noise was again well below 1% of the mean high or low signals, respectively [Fig. 4D; 0.92 (SD 0.02) and 0.81 (SD 0.07)%; mean (SD); n = 4].
Fig. 4.
Characterization of detectors during mouse behavior. A: example onset and offset curves (Δtonset and Δtoffset, respectively) of licking recorded in head-fixed mice. Low signal = 0 V, high signal = 4.9 V. Onset is time from 10 to 97% of high signal (0.49 to ~4.75 V). Offset is time from 97% to less than 2% of high signal. Inset shows mean (dark gray) across individual trials (light gray). B: overlaid onset and offset curves of 4 tested detectors. For onset, mean r2 value = 0.99 (SD 0.0001) (n = 4 detectors, 80 trials). For offset, r2 = 1.0 (SD 0.00002 (n = 4 detectors, 80 trials). C: onset and offset time for each detector. Mean onset time = 6.0 (SD 0.23) μs (n = 4 detectors, 80 trials). Mean offset time = 2.3 (SD 0.34) μs (n = 4, 80 trials). See Fig. 5. D: signal noise for each detector. Mean low signal (0 V) noise = 0.92 (SD 0.02)% (% of high signal, n = 4 detectors, 80 trials). Mean high signal (5 V) noise = 0.81 (SD 0.07)% (n = 80 trials). V, Volts.
Detection shows no bias for left vs. right licking.
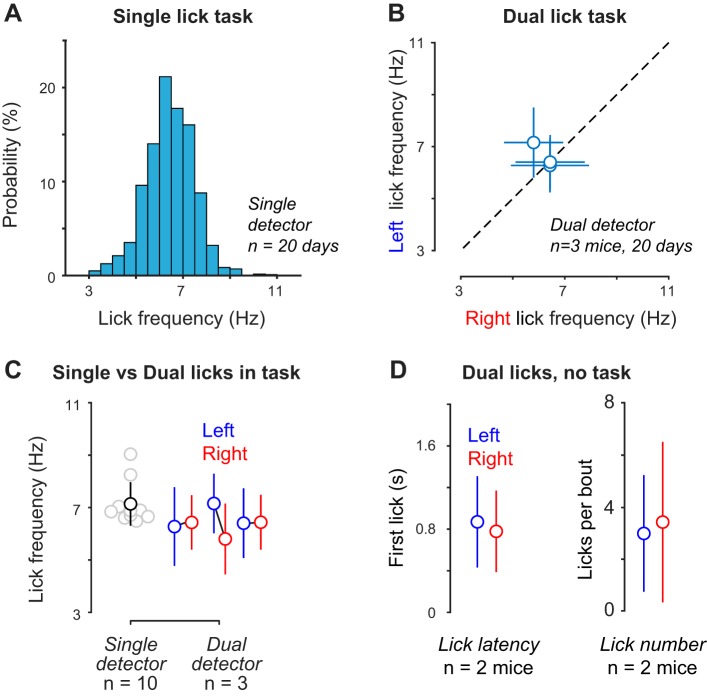
We next characterized detector performance during the visual perception task. We determined whether the detector design encouraged a bias for licking to the left or right ports during behavioral performance (Fig. 6) and during passive reward delivery (Fig. 7). We first analyzed data from 351 behavioral sessions (15,419 trials) recorded across 20 days in three well-trained mice performing the dual-lick visual spatial task as described. Mice naturally lick multiple times during a single response (“bout”) to obtain and consume the reward. We analyzed the distribution of left vs. right licks during the visual task and grouped licks with intervals < 0.5 s into the same bout (Fig. 7, A and B; mean interbout frequency: 0.4 (SD 0.1) Hz; n = 3 mice, 382 bouts). The reciprocal of the time intervals between each lick within a bout was taken as lick frequency per bout. A typical distribution of lick frequencies within a bout centered around 7 Hz [Fig. 6A; 6.4 (SD 1.0) Hz; mean (SD); n = 8,995 licks], consistent with previous studies of head-fixed licking behavior (Guo et al. 2014a) and licking in freely moving mice (Boughter et al. 2007). To determine whether there was a bias in lick direction or detection, we used the same dual-port detector across three mice performing the task and calculated mean lick frequencies at the left sensor vs. right sensor. Across hundreds of behavioral sessions spanning 20 days, we observed no significant bias in left vs. right lick frequencies within each mouse [Fig. 6B; left vs. right: 6.3 (SD 1.5) vs. 6.4 (SD 1.0); 7.2 (SD 1.1) vs. 5.8 (SD 1.4); 6.4 (SD 1.3) vs. 6.4 (SD 1.0) Hz; mean (SD)]. The overall mean licking frequency of mice during dual-lick visual behavior was 6.4 (SD 0.43) Hz (n = 3 mice, 6 detectors, 37,951 licks). These values overlapped with lick frequencies in our single lick visual task [Fig. 6C; 7.1 (SD 0.83) Hz; mean (SD); n = 10 mice; 34,009 (SD 12,839) licks]. Finally, to control for the possibility that extensive training in the visual task compensates for licking biases inherent to the detector, we measured lick latency and lick number outside of the visual task (passive reward delivery). In these conditions, we did not observe a significant difference in lick latency or lick number per bout at the left vs. right ports [Fig. 6D; latency: 0.87 (SD 0.44) s vs. 0.78 (SD 0.39) s, P = 0.19; lick number: 3.0 (SD 2.3) vs. 3.4 (SD 3.1) licks per bout, P = 0.18; mean (SD); Wilcoxon rank-sum test]. Fewer licks per bout with passive reward delivery can be attributed to lower motivation (satiety) outside of the visual task; nonetheless, in both behavioral contexts, there was no significant difference in the number of licks at left vs. right ports of the same detector. Accordingly, 95% confidence intervals for lick frequencies in free reward conditions (left, 6.4−7.0 Hz; right, 6.0−6.5 Hz) overlapped with corresponding lick frequencies during the visual task (left, 6.7−6.8 Hz; right, 6.3−6.4 Hz). These data indicate that our detector does not induce a bias in licking frequency as a function of lick direction or behavioral context.
Fig. 6.
Characterization of lick frequency across detectors. A: example distribution of licking frequency for single lick detector during 75 behavioral sessions over 20 days for 1 mouse (n = 8,995 licks). Mean frequency is 6.4 (SD 1.0) Hz. B: comparison of mean licking frequency for left vs. right licking using the same dual detector across 20 days within the same mouse (n = 3 different mice). Means for left vs. right licking were 6.3 (SD 1.5) vs. 6.4 (SD 1.0) Hz, 7.2 (SD 1.1) vs. 5.8 (SD 1.4) Hz, and 6.4 (SD 1.3) vs. 6.4 (SD 1.0) Hz [left vs. right; mean (SD) within mouse]. Data for the three mice were sampled across 20 days each; 59 (SD 11) sessions; 1,179 (SD 734) left lick bouts; 1,204 (SD 732) right lick bouts; 6,609 (SD 4,425) left licks; 6,041 (SD 2,840) right licks. C: comparison of mean lick frequency for dual and single detectors. Single-detector data was sampled from 10 mice using a single-port detector each for 20 days. Single-detector mean is 7.1 (SD 0.83) Hz; n = 10 mice; 34,009 (SD 12,839 licks). Dual-detector data was sampled from 3 mice using the same dual-port detector for 20 days each. Dual-detector means are as in B, left vs. right. D: comparison of dual-lick latency and dual-lick number outside of visual task. No significant difference in either metric for left vs. right licks (n = 2 mice, 120 trials each).
Dual-port detector does not interfere with neural recording.
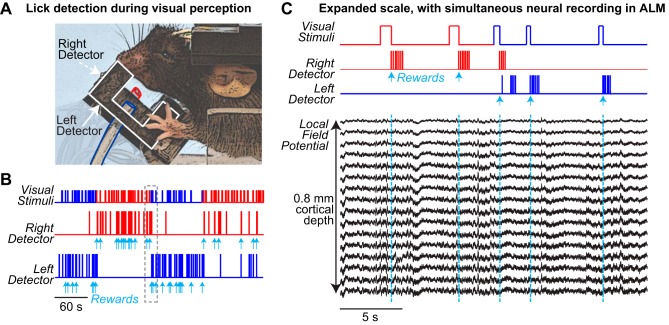
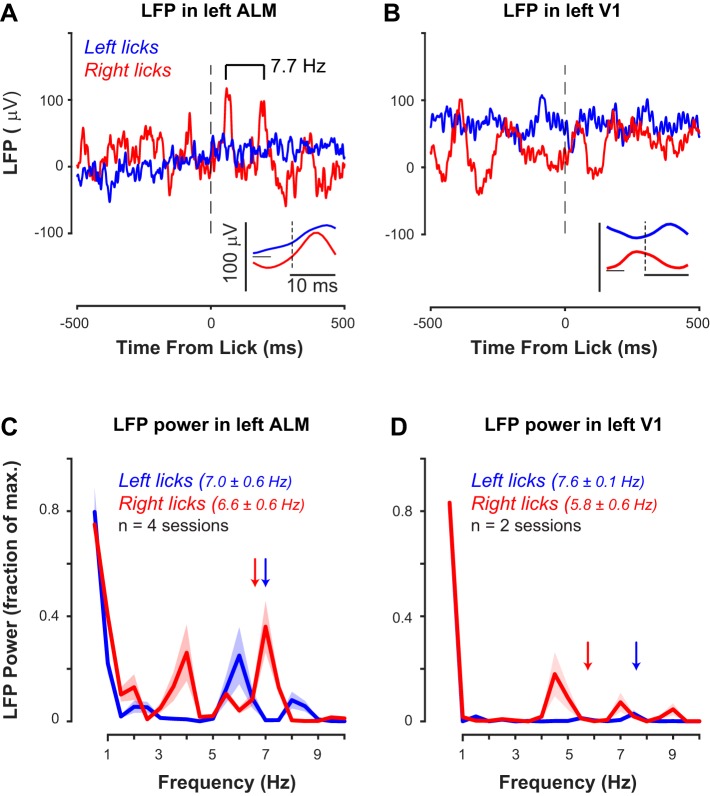
We next tested performance of the dual-port detector during the visual perception task along with simultaneous neural recording. A well-trained mouse accurately reported the onset and location of the visual stimulus with responses at the appropriate lick port (Fig. 8, A and B). We simultaneously performed intracranial neural recordings as described in our prior studies (Saleem et al. 2017; Speed et al. 2018), but from ALM, a cortical area that generates and controls licking (Fig. 8C). Across the layers of ALM (spanning 800 μm), there were no observable electrical transients within ±10 ms surrounding each lick in the LFP; similarly, there were no detectable artifacts in recordings from the visual cortex (V1) in the same mice (Fig. 9). As expected for a cortical area involved in generating licking, LFP spectral power at ~7 Hz was strongest in recordings from left ALM for right (contralateral) licks (Fig. 9C); importantly, there was little LFP power near 7 Hz in LFP recordings from V1 of the same animals during comparable behavioral sessions with the same detector (Fig. 9D).
Fig. 8.
Dual-port detection during behavior with simultaneous neural recording. A: fully assembled detector during behavioral sessions in a head-fixed mouse. White outline indicates left detector, colored outlines indicate silicone tubing for water delivery at left (blue) and right (red) detector ports. Right detector is invisible in this view. B: example behavioral session, from a different mouse. Top row shows onsets of visual stimuli in left (blue) or right (red) visual fields. Bottom 2 traces show licks detected at each sensor. Individual licks are not visible at this scale. The mouse reports perception of stimulus onset in each location by licking at the appropriate detector. Cyan arrows indicate reward delivery at each individual detector (one reward per correct trial). C: expanded view of session in B, with simultaneous neural recording from anterolateral motor cortex (ALM). Mouse performs 2 correct trials of rightward detection, and then switches to leftward detection on third trial after a few erroneous licks. Local field potential (LFP) recorded with a multisite linear silicon probe throughout the cortical depth of ALM (0.8 mm below surface, 50-μm spacing between contacts) shows no artifacts during licking (see Fig. 9).
Fig. 9.
Local field potential (LFP) triggered on detected lick onsets. A: LFP recorded from left anterolateral motor cortex (ALM), triggered on all licks during a single behavioral and recording session (n = 224 left, 156 right). LFP recorded across 32 channels spanning 800 μm was averaged and then aligned ±0.5 s at each lick. Segments were averaged across all lick events. Note absence of transients centered at lick onset (vertical dashed lines; inset shows expanded ±10-ms scale). During the same recording, ipsilateral left licks (blue) also showed no evidence of sharp transients. Contralateral right licks (red) produce rhythmic LFP activation at licking frequency (7.7 Hz), and LFP activation (negativity) precedes time zero, indicating ALM activity precedes detected lick onset. Modulation is absent for ipsilateral licks during the same recording. Single-unit spiking data (not shown here) supported these observations. B: same mouse and same detector during recording in primary visual cortex (V1). Same conventions as in A. Note absence of any sharp transients centered on lick onsets (n = 217 left, 111 right). In V1, there is no ~7 Hz LFP activation associated with motor commands. Same experimental conditions as A. C: LFP spectral power in left ALM during behavioral sessions (n = 4). Note peak ~7 Hz) during right (contralateral, red trace) licks (6.6 (SD 0.6) Hz licking, red arrow). D: same as C, for LFP power in V1 (n = 2 sessions). Note absence of LFP power at licking frequencies (arrows).
Dual-lick-port detector provides rapid control signals for closed-loop optogenetic inhibition of licking behavior.
Finally, we implemented the dual-port detector to cause closed-loop modulation of neural activity and licking behavior during the visual task (Fig. 10A). We utilized transgenic mice that expressed channelrhodopsin (ChR2) in parvalbumin (PV)-positive inhibitory neurons (PV-ChR2) throughout cortex. Shining blue laser light through a small region of the thinned cranium activates these inhibitory neurons, resulting in rapid inhibition of the underlying cortical area (Guo et al. 2014a). We sought to combine these methods with high-resolution lick detection to provide real-time feedback for a device where sensing licking itself actively modulates the behavior.
Fig. 10.
Closed-loop optogenetic stimulation triggered on lick detection. A: schematic for closed-loop sensing and optogenetic perturbation of licking during visual perception. Control signals from either the left or right detectors gate delivery of laser light to the left anterolateral motor cortex (ALM) area involved in generating licking. Light activates inhibitory neurons in a transgenic mouse (Pv-Cre × Ai32-ChR2; see methods). In this configuration, right licks are contralateral to the inhibited cortical region. B: lick-triggered optical inhibition of left motor cortex reduces ipsilateral (left) licks within >100 ms of sensing the first lick within a bout. Interleaved control trials (black) show no deficit. Mean lick times per condition indicated with circles [control: 0.16 (SD 0.16) s; stimulated: 0.13 (SD 0.13) s; n = 14 interleaved behavioral sessions each condition]. Inset shows 5 individual trials for each condition during a single session. C: same experiment, during contralateral right licks. Licking frequency is reduced almost immediately (< 0.01 s), and mean lick time is significantly shorter for lick-triggered laser trials vs. control trials [control: 0.25 (SD 0.2) s; stimulated: 0.09 (SD 0.13) s; n = 7 control sessions; n = 14 interleaved optogenetic sessions] in comparison to ipsilateral licks. Inset shows 5 individual trials (tick marks show individual licks) for each condition during a single session.
We trained a PV-ChR2 mouse in the dual-lick visual perception task. We detected licks at both detectors and then used these signals to cause real-time laser illumination of the left ALM on a fraction of trials; ALM has been shown to be intimately involved in generating licking during perceptual tasks (Li et al. 2016). We observed that contralateral licking was potently and rapidly inhibited (within tens of milliseconds) on trials where the first detected lick of a bout was used to optogenetically inhibit ALM (Fig. 10C). Using the same detector, and during the same behavioral sessions, ipsilateral licking was less strongly and more slowly inhibited (hundreds of milliseconds; Fig. 10B). This experiment is a clear proof of concept that our low-noise, high-resolution dual-port lick detector can be readily implemented as part of a closed-loop interface to probe the dynamics and neural basis of behavior at millisecond time scales.
DISCUSSION
Here we engineered and characterized performance of a novel, contactless, dual-port lick detector for studies of neural system function during sensory-motor behavior in mice. Our detector fulfills several engineering requirements that have so far been unmet in commercial or open-source designs. The device performs with high temporal resolution adequate for detecting directional lick onsets, shows no left/right bias compared with single-lick detectors, produces no detectable electrical noise, and can be implemented in a closed-loop system for optogenetic control of behavior. The output signals of the detector are easily processed and amenable for integration with a variety of different hardware and software systems and behaviors. In addition, our device is cost effective and easily manufactured and can help accelerate interrogation of neural circuits driving complex sensory-motor behaviors in the mammalian nervous system.
Our device meets or surpasses most of the desired engineering criteria for measuring directional licking at high resolution and simultaneously recording and manipulating neural circuit activity (Table 1). The dual-port detector itself consists of only six components and is readily assembled using commercially available parts. The assembled detectors are modular, allowing implementation in single- or dual-port configurations. The detector has an excellent signal-to-noise ratio (noise level <2% of the ~5-V high signal). This is a result of both the contactless detection and the amplification circuit. Such small amounts of noise did not affect neural recordings, rendering additional signal-processing algorithms unnecessary for this device. These characteristics may be advantageous for users integrating our device with sensitive electrophysiological recording systems. The detector circuit is likewise compact and simple, requiring only five components to make, and is easily shielded/grounded for integration into a wide variety of recording setups.
The shape and dimensions of the final assembled detector were optimized for behaving mice through an iterative design process. The resulting profile maintains unobstructed views of the binocular and monocular visual fields, permitting stimulus delivery and detection in a large region of visual space. Our design was strongly constrained by a requirement for unobstructed visual fields during behavior; future iterations examining behaviors without these constraints for vision could provide further design improvements. Our detector’s dimensions allowed rapid and unbiased access to both reward spouts and did not interfere with whisking or grooming behaviors. With correct positioning of the spout, the device detects licking at the instant the tongue reaches the reward spout; whether the spout contact time and beam break time are exactly identical will require direct comparison with an integrated contact-based sensor. The device itself shows no bias for detection of directional mouse licks when compared with our single-port detectors. The frequency of detected licks is highly similar on each sensor of the dual-port design and within expected values for wild-type mice. Our values agree with recent studies of head-fixed directional licking during somatosensory behaviors (Guo et al. 2014a), supporting the accuracy of our final design in measuring licking behavior.
The performance of our detector enabled high-resolution monitoring and closed-loop manipulation of neural activity underlying directional licking behavior. To our knowledge, this is the first such demonstration of closed-loop neural control of rhythmic licking motor responses that report sensory perception. The detector’s temporal resolution was between 1 and 3 μs. This provided rapid and accurate control signals for direct closed-loop optogenetic modulation of licking responses during visual perception. Our device signaled the control system to trigger the laser in response to the first lick and resulted in temporally aligned inhibition of subsequent licks (observable within <100 ms). These latencies for detectable behavioral effects reflect the time course for photactivation of the opsin, the ensuing cascade of effects across polysynaptically connected neurons, and downstream effects on brain stem circuits that drive orofacial muscles (Moore et al. 2014). Our device thus performs as an interactive tool for investigation into the neural basis of perceptual behavior and sensory-motor integration.
Our device was designed to detect the rising edge of tongue motion rather than mechanical contact with the spout, providing both advantages and constraints. For most stimulus detection tasks in head-fixed mice, the first lick in a bout is the earliest external indication of the full behavioral response. Thus detecting the rising edge of the first lick provides an earlier measure of response onset than spout contact. Moreover, the tongue remains unobstructed in air as it breaks the detector beam, providing a reliable, temporally precise measure of response onset across trials. In contrast, the exact position of an elastomer spout is subject to repeated mechanical force from the tongue and the water delivery system during behavior, potentially altering its exact position (and thus contact latency) across trials. This confound could be avoided by using piezoelectric sensors that measure spout displacement (Sippy et al. 2015) rather than first contact, but such implementations appear to generate qualitatively noisier and less precise signals (i.e., lick traces show variable amplitudes and ringing) that may require additional filtering or signal conditioning in software or offline (Micallef et al. 2017). Direct comparison of signal reliability and temporal jitter of contactless detection vs. contact-based detection is an important topic for further investigation; this could be done by extending our current design with integrated contact sensors. Nonetheless, we show that this current design can precisely measure and interact with licking behavior at submillisecond time scales; this temporal resolution is thus readily compatible with other millisecond time scale signals that could be used for system and behavioral control, such as signals driven by online detection of single action potentials (Bolus et al. 2018).
There are several ways in which our detector design could be extended to enable a wide range of two-choice behavioral tasks and neurophysiological experiments in head-fixed mice. Our device design was optimized for a visual perception task, where the visual fields had to remain unobstructed for detection of stimuli and behavioral performance. Future iterations could extend the basic design to allow further study of somatosensory tasks involving the whiskers (Guo et al. 2014a). For example, although our device footprint is small, further refinements could allow better access to the rostral whiskers. Auditory tasks would be easily implemented with the current design, allowing study of auditory decision making. Finally, our design seems ideally suited for future studies of multisensory integration involving vision. Taken together, this detector can be a useful device that helps accelerate implementation and replication of studies into the neural circuit basis of complex discriminative behaviors in normal and transgenic mice.
GRANTS
This work was funded by the National Science Foundation (IRFP 0965110), the GT Neural Engineering center (1241384), and the Whitehall Foundation.
DISCLOSURES
No conflicts of interest, financial or otherwise, are declared by the authors.
AUTHOR CONTRIBUTIONS
B.W. and A.S. performed experiments; B.W., A.S., and B.H. analyzed data; B.W., A.S., and B.H. interpreted results of experiments; B.W., A.S., and B.H. prepared figures; B.W., A.S., and B.H. drafted manuscript; B.W., A.S., and B.H. edited and revised manuscript; B.W., A.S., and B.H. approved final version of manuscript.
ENDNOTE
At the request of the authors, readers are herein alerted to the fact that additional materials related to this manuscript may be found at the institutional website of one of the authors, which at the time of publication they indicate is https://github.com/haiderlab/DP-Lick-Detector. These materials are not a part of this manuscript and have not undergone peer review by the American Physiological Society (APS). APS and the journal editors take no responsibility for these materials, for the website address, or for any links to or from it.
ACKNOWLEDGMENTS
The authors thank Aman Saleem, Chris Burgess, and the University College London Institute of Neurology for feedback in designing prototypes of the single-lick detector.
APPENDIX: PARTS LIST AND DETAILED ASSEMBLY INSTRUCTIONS
PARTS LIST
Parts and suggested sources are presented in Table A1.
ASSEMBLY INSTRUCTIONS
Note: All figures below are also included in high resolution in the accompanying distribution package. The distribution package is available at https://github.com/haiderlab/DP-Lick-Detector.
Step 1.
Carefully drill holes in the centers of the Omron photosensors. We used a 2.5-mm drill bit. The tubing we used fits snugly through the resulting hole. The use of a vise to hold the sensor while drilling is recommended.
Step 2.
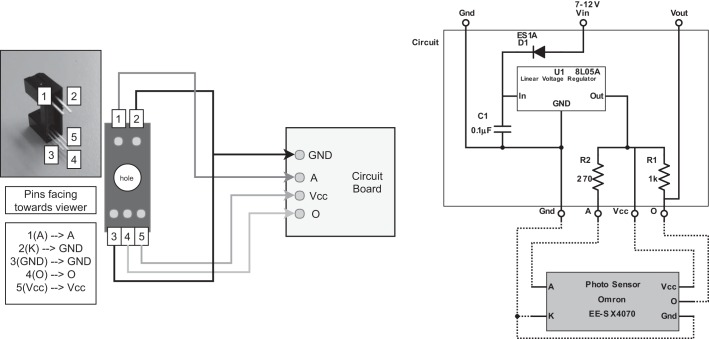
Solder wires to Omron photosensors (later used to connect sensor to circuit). Refer to the circuit schematic and the diagram in Fig. A1 for details. Each sensor has five leads, but the ground and cathode can be the same wire, and in fact they are soldered together at the circuit. It is highly recommended to use heat shrink at the connections to keep the leads from shorting. If making the modular design, use an Ethernet cable and refer to Modular Option below.
Step 3.
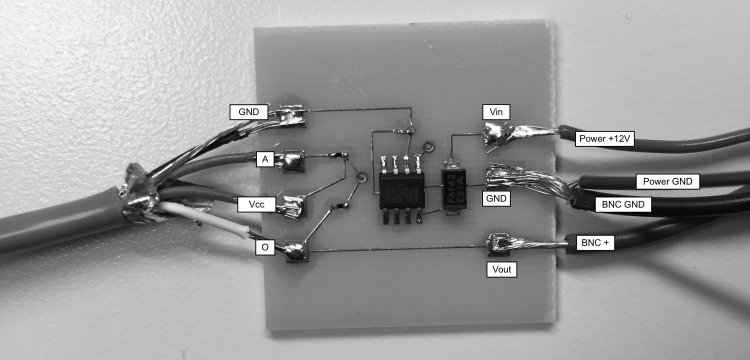
Make the circuits. Refer to the circuit schematic (in Fig. A1) for details. We had custom printed circuit boards (PCBs) made with appropriate traces and pads (PCB Express), but this circuit could also be assembled on a breadboard. A microscope is recommended if soldering onto a custom PCB. See Fig. A2.
Step 4.
3D print the base, using STL file DividedDualPort.stl. Once printed, the base may require a bit of sanding, depending on the resolution and reliability of the 3D printer. Our bases were printed out of polylactic acid (PLA).
Step 5.
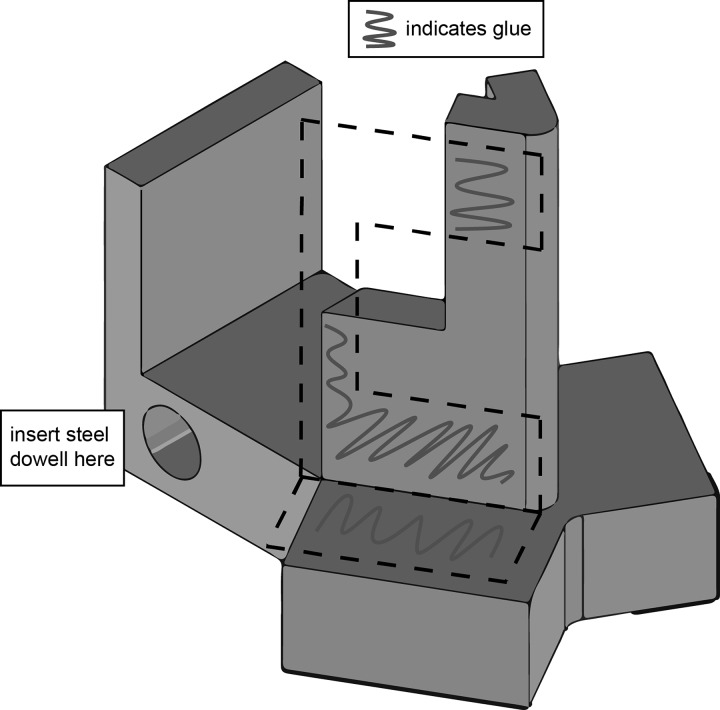
Glue the Omron sensors to the base. Loctite or superglue is recommended. Make sure to glue the sides and the bottoms of the sensors. Also, insert the steel dowel with a bit of glue on the end into the hole at the back of the base. See Fig. A3.
Step 6.
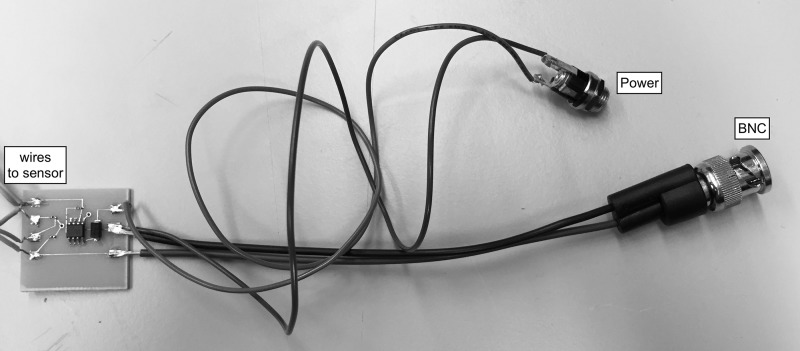
Solder the wires from the sensors to the circuits (one circuit per sensor). Refer to the diagrams in Fig. A1 for details. Also, solder the BNC and power leads to the circuits. Both circuits may be consolidated to one power source by soldering the power lead in parallel to both circuits. See Fig. A4.
Step 7.
Testing: plug into a 12-V power source and an oscilloscope. Unperturbed, the signal should be at 0 V. When an object is passed through the sensor to break the infrared beam, the signal should jump to 5 V.
MODULAR OPTION
In our design, the sensors and circuits are modular, meaning sensors can be readily unplugged and swapped, if desired. This may be advantageous for applications where different mice have been trained to perform behavior with the very same detector for months. This is also useful for cases where a circuit or sensor gets damaged and needs to be replaced. Instructions for pursuing this option are below.
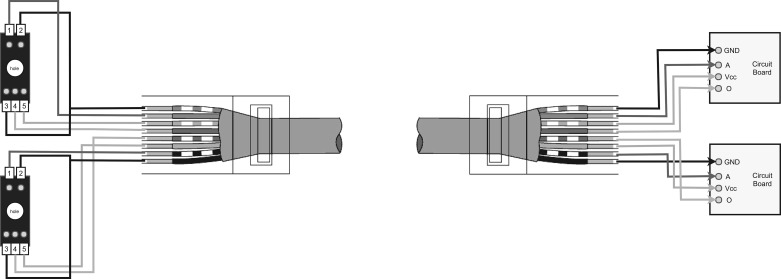
In step 2 above, use an eight-wire Ethernet cable instead of loose cables to connect to the sensors (and later the circuits). Four of the wires will connect to one sensor, and four of the wires will connect to the other sensor. Figure A5 illustrates how this can be done.
Option 1.
Solder the other end of the Ethernet cable to the male RJ45 connector. Both circuits will be soldered to the same female connector and will be inseparable from each other. In this case, power leads may be soldered together to use one power source.
Option 2.
Solder the four wires from one sensor to one RJ45 connector, and the other four wires to the other connector. Each circuit will have its own female connector and can be separated at will.
Note: when testing the modular option, be aware that, with our circuit design, a circuit without a sensor plugged into it will show 5 V on an oscilloscope. This is a good way to test that the circuit is working by itself.
Fig. A1.
Sensor wiring diagram and circuit schematic.
Fig. A2.
Example circuit inputs and outputs.
Fig. A3.
Sensor base and suggested gluing locations.
Fig. A4.
Power and BNC leads from circuit.
Fig. A5.
Sensor connections with 8-wire Ethernet cable.
Table A1.
Parts list
| Quantity | Part | Purpose | Part Number | Cost |
|---|---|---|---|---|
| Detector | Total: $8–10 | |||
| 2 | Omron 4070 photosensor | Detection of licks | Mouser: 653-EE-SX4070 | $2.31 each |
| 1 | 3D-printed base | Positioning of sensors | not applicable | <$5 |
| 2 | 1/32″ silicone tubing | Delivery of water reward | US Plastic: 57286 | $1.15/ft |
| 1 | M3 steel dowel | Provide way to hold base | Mcmaster: 91595A140 | $0.36 each |
| Circuit (×2) | Total: $2.28 | |||
| 1 | 0.1 μF capacitor | Circuit components | Digikey: 311-1338-1-ND | $0.10 each |
| 1 | 270 Ω resistor | Digikey: 311-270JRCT-ND | $0.10 each | |
| 1 | 1 kΩ resistor | Digikey: 311-1.0KJRCT-ND | $0.10 each | |
| 1 | 8L05A voltage regulator | Mouser: 863-MC78L05ABDR2G | $0.46 each | |
| 1 | ES1A diode | Digikey: ES1AFSCT-ND | $0.38 each | |
| Recommended parts | Total: ~$45 | |||
| 2 | Female BNC connector | Output signal to BNC | E.g., Digikey: 314-1189-ND | $10.89 each |
| 2 | 2.5-mm barrel connector jack | Power the circuit | E.g., Digikey: EJ501A-ND | $2.70 each |
| 1 | 12-V power supply, barrel connector | E.g., Newark: 54X7759 | $15.05 each | |
| 14-gauge wires OR (optional) 8-wire Ethernet cable | Connect photosensors to circuit | E.g., Digikey: A541419B-100-ND | $0.41/ft | |
| (optional) RJ45 Ethernet jack, male and female | Make circuit and sensor modular | E.g., Digikey: 553–2274-1-ND | $0.97 each | |
| E.g., Digikey: AE10316-ND | $0.35 each | |||
REFERENCES
- Bolus MF, Willats AA, Whitmire CJ, Rozell CJ, Stanley GB. Design strategies for dynamic closed-loop optogenetic neurocontrol in vivo. J Neural Eng 15: 026011, 2018. doi: 10.1088/1741-2552/aaa506. [DOI] [PMC free article] [PubMed] [Google Scholar]
- Boughter JD Jr, Baird JP, Bryant J, St John SJ, Heck D. C57BL/6J and DBA/2J mice vary in lick rate and ingestive microstructure. Genes Brain Behav 6: 619–627, 2007. doi: 10.1111/j.1601-183X.2006.00293.x. [DOI] [PubMed] [Google Scholar]
- Burgess CP, Lak A, Steinmetz NA, Zatka-Haas P, Bai Reddy C, Jacobs EAK, Linden JF, Paton JJ, Ranson A, Schröder S, Soares S, Wells MJ, Wool LE, Harris KD, Carandini M. High-yield methods for accurate two-alternative visual psychophysics in head-fixed mice. Cell Reports 20: 2513–2524, 2017. doi: 10.1016/j.celrep.2017.08.047. [DOI] [PMC free article] [PubMed] [Google Scholar]
- Chen JL, Pfäffli OA, Voigt FF, Margolis DJ, Helmchen F. Online correction of licking-induced brain motion during two-photon imaging with a tunable lens. J Physiol 591: 4689–4698, 2013. doi: 10.1113/jphysiol.2013.259804. [DOI] [PMC free article] [PubMed] [Google Scholar]
- Guo ZV, Hires SA, Li N, O’Connor DH, Komiyama T, Ophir E, Huber D, Bonardi C, Morandell K, Gutnisky D, Peron S, Xu NL, Cox J, Svoboda K. Procedures for behavioral experiments in head-fixed mice. PLoS One 9: e88678, 2014b. [Erratum in PLOS One 9: e101397; 10.1371/journal.pone.0101397] 10.1371/journal.pone.0088678. [DOI] [PMC free article] [PubMed] [Google Scholar]
- Guo ZV, Li N, Huber D, Ophir E, Gutnisky D, Ting JT, Feng G, Svoboda K. Flow of cortical activity underlying a tactile decision in mice. Neuron 81: 179–194, 2014a. doi: 10.1016/j.neuron.2013.10.020. [DOI] [PMC free article] [PubMed] [Google Scholar]
- Haider B, Schulz DP, Häusser M, Carandini M. Millisecond coupling of local field potentials to synaptic currents in the awake visual cortex. Neuron 90: 35–42, 2016. doi: 10.1016/j.neuron.2016.02.034. [DOI] [PMC free article] [PubMed] [Google Scholar]
- Hayar A, Bryant JL, Boughter JD, Heck DH. A low-cost solution to measure mouse licking in an electrophysiological setup with a standard analog-to-digital converter. J Neurosci Methods 153: 203–207, 2006. doi: 10.1016/j.jneumeth.2005.10.023. [DOI] [PMC free article] [PubMed] [Google Scholar]
- Isett BR, Feasel SH, Lane MA, Feldman DE. Slip-based coding of local shape and texture in mouse S1. Neuron 97: 418–433.e5, 2018. doi: 10.1016/j.neuron.2017.12.021. [DOI] [PMC free article] [PubMed] [Google Scholar]
- Li N, Daie K, Svoboda K, Druckmann S. Robust neuronal dynamics in premotor cortex during motor planning. Nature 532: 459–464, 2016. [Erratum in Nature 537: 122; 10.1038/nature18623] 10.1038/nature17643. [DOI] [PMC free article] [PubMed] [Google Scholar]
- Madisen L, Mao T, Koch H, Zhuo JM, Berenyi A, Fujisawa S, Hsu YW, Garcia AJ III, Gu X, Zanella S, Kidney J, Gu H, Mao Y, Hooks BM, Boyden ES, Buzsáki G, Ramirez JM, Jones AR, Svoboda K, Han X, Turner EE, Zeng H. A toolbox of Cre-dependent optogenetic transgenic mice for light-induced activation and silencing. Nat Neurosci 15: 793–802, 2012. doi: 10.1038/nn.3078. [DOI] [PMC free article] [PubMed] [Google Scholar]
- Marques T, Summers MT, Fioreze G, Fridman M, Dias RF, Feller MB, Petreanu L. A role for mouse primary visual cortex in motion perception. Curr Biol 28: 1703–1713, 2018. doi: 10.1016/j.cub.2018.04.012. [DOI] [PMC free article] [PubMed] [Google Scholar]
- Mayrhofer JM, Skreb V, von der Behrens W, Musall S, Weber B, Haiss F. Novel two-alternative forced choice paradigm for bilateral vibrotactile whisker frequency discrimination in head-fixed mice and rats. J Neurophysiol 109: 273–284, 2013. doi: 10.1152/jn.00488.2012. [DOI] [PubMed] [Google Scholar]
- Micallef AH, Takahashi N, Larkum ME, Palmer LM. A reward-based behavioral platform to measure neural activity during head-fixed behavior. Front Cell Neurosci 11: 156, 2017. doi: 10.3389/fncel.2017.00156. [DOI] [PMC free article] [PubMed] [Google Scholar]
- Moore JD, Kleinfeld D, Wang F. How the brainstem controls orofacial behaviors comprised of rhythmic actions. Trends Neurosci 37: 370–380, 2014. doi: 10.1016/j.tins.2014.05.001. [DOI] [PMC free article] [PubMed] [Google Scholar]
- Resulaj A, Rinberg D. Novel behavioral paradigm reveals lower temporal limits on mouse olfactory decisions. J Neurosci 35: 11667–11673, 2015. doi: 10.1523/JNEUROSCI.4693-14.2015. [DOI] [PMC free article] [PubMed] [Google Scholar]
- Rinberg D. Modulated lick port detector, 2012. https://www.janelia.org/open-science/modulated-lick-port-detector.
- Rosenfeld MG, Crenshaw EB III, Lira SA, Swanson L, Borrelli E, Heyman R, Evans RM. Transgenic mice: applications to the study of the nervous system. Annu Rev Neurosci 11: 353–372, 1988. doi: 10.1146/annurev.ne.11.030188.002033. [DOI] [PubMed] [Google Scholar]
- Saleem AB, Lien AD, Krumin M, Haider B, Rosón MR, Ayaz A, Reinhold K, Busse L, Carandini M, Harris KD. Subcortical source and modulation of the narrowband gamma oscillation in mouse visual cortex. Neuron 93: 315–322, 2017. doi: 10.1016/j.neuron.2016.12.028. [DOI] [PMC free article] [PubMed] [Google Scholar]
- Sanders JI, Kepecs A. Choice ball: a response interface for two-choice psychometric discrimination in head-fixed mice. J Neurophysiol 108: 3416–3423, 2012. doi: 10.1152/jn.00669.2012. [DOI] [PMC free article] [PubMed] [Google Scholar]
- Schroeder JC, Reim D, Boeckers TM, Schmeisser MJ. Genetic animal models for autism spectrum disorder. Curr Top Behav Neurosci 30: 311–324, 2015. doi: 10.1007/7854_2015_407. [DOI] [PubMed] [Google Scholar]
- Schwarz C, Hentschke H, Butovas S, Haiss F, Stüttgen MC, Gerdjikov TV, Bergner CG, Waiblinger C. The head-fixed behaving rat—procedures and pitfalls. Somatosens Mot Res 27: 131–148, 2010. doi: 10.3109/08990220.2010.513111. [DOI] [PMC free article] [PubMed] [Google Scholar]
- Siniscalchi MJ, Phoumthipphavong V, Ali F, Lozano M, Kwan AC. Fast and slow transitions in frontal ensemble activity during flexible sensorimotor behavior. Nat Neurosci 19: 1234–1242, 2016. doi: 10.1038/nn.4342. [DOI] [PMC free article] [PubMed] [Google Scholar]
- Sippy T, Lapray D, Crochet S, Petersen CC. Cell-type-specific sensorimotor processing in striatal projection neurons during goal-directed behavior. Neuron 88: 298–305, 2015. doi: 10.1016/j.neuron.2015.08.039. [DOI] [PMC free article] [PubMed] [Google Scholar]
- Slotnick B. A simple 2-transistor touch or lick detector circuit. J Exp Anal Behav 91: 253–255, 2009. doi: 10.1901/jeab.2009.91-253. [DOI] [PMC free article] [PubMed] [Google Scholar]
- Speed A, Del Rosario JP, Burgess CP, Haider B. Cortical states control visual spatial perception (Preprint). bioRxiv 316398, 2018. doi: 10.1101/316398. [DOI] [PMC free article] [PubMed]


