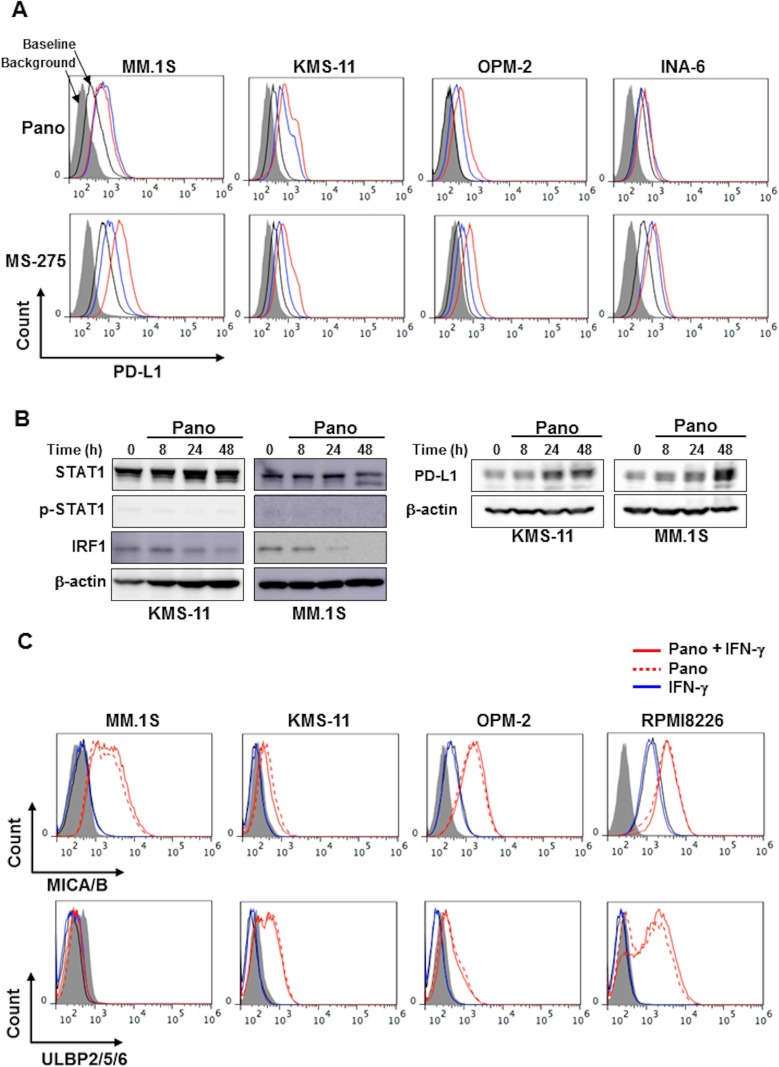
Figure 2. HDAC inhibition upregulates PD-L1 expression in MM cells without activating the STAT1-IRF1 pathway.
(A) Surface expression of PD-L1 on MM cells. MM cell lines as indicated were cultured with either panobinostat at 25 nM (blue) or 100 nM (red) (upper) or MS-275 at 0.25 μM (blue) or 1 μM (red) (lower) for 24 hours. The surface expression of PD-L1 was then analyzed by flow cytometry. (B) Analysis of the STAT1-IRF1 pathway. KMS-11 and MM.1S cells were incubated in the presence of panobinostat at 25 nM for the indicated time periods. The cells were then harvested, and STAT1, phosphorylated STAT1 (p-STAT1), IRF1 and PD-L1 protein levels were examined by Western blot analysis. β-actin was blotted as a loading control. (C) Surface expression of NKG2D ligands on MM cells. MM cell lines as indicated were cultured with panobinostat at 25 nM in the presence or absence of 100 U/ml of IFN-γ for 24 hours. The surface expression of MICA/B (upper) and ULBP2/5/6 (lower) was then analyzed by flow cytometry. Gray areas indicate background staining with isotype controls. Pano, panobinostat.

