

ABSTRACT
Background: Nearly one-half of Guatemalan children experience growth faltering, more so in indigenous than in nonindigenous children.
Objectives: On the basis of ethnographic interviews in Totonicapán, Guatemala, which revealed differences in maternal perceptions about food needs in infant girls and boys, we predicted a cumulative sex difference in favor of girls that occurred at ∼6 mo of age and diminished markedly thereafter. We examined whether the predicted differences in age-sex patterns were observed in the village, replicated the examination nationally for indigenous children, and examined whether the pattern in nonindigenous children was different.
Design: Ethnographic interviews (n = 24) in an indigenous village were conducted. Anthropometric measurements of the village children aged 0–35 mo (n = 119) were obtained. National-level growth patterns were analyzed for indigenous (n = 969) and nonindigenous (n = 1374) children aged 0–35 mo with the use of Demographic and Health Survey (DHS) data.
Results: Mothers reported that, compared with female infants, male infants were hungrier, were not as satisfied with breastfeeding alone, and required earlier complementary feeding. An anthropometric analysis confirmed the prediction of healthier growth in indigenous girls than in indigenous boys throughout the first year of life, which resulted in a 2.98-cm height-for-age difference (HAD) between sexes in the village and a 1.61-cm HAD (P < 0.001) in the DHS data between 6 and 17 mo of age in favor of girls. In both data sets, the growth sex differences diminished in the second year of life (P < 0.05). No such pattern was seen in nonindigenous children.
Conclusions: We propose that the differences in the HAD that first favor girls and then favor boys in the indigenous growth patterns are due to feeding patterns on the basis of gendered cultural perceptions. Circumstances that result in differential sex growth patterns need to be elucidated, in particular the favorable growth in girls in the first year of life.
Keywords: child growth, exclusive breastfeeding, gender, infant and young child feeding, sex
INTRODUCTION
Nearly one-half of Guatemalan children experience growth faltering (1). Compared with nonindigenous children of European and mixed-European and indigenous descent, indigenous children of predominantly Mayan descent are disproportionately affected by growth faltering. An estimated 66% of indigenous children compared with 36% of nonindigenous children <5 y of age are stunted, which is defined as height-for-age z score (HAZ)6 less than −2 in the 2006 WHO Child Growth Standards (1, 2). The high level of growth failure has profound adverse consequences for the physical, cognitive, and economic development of affected children, their communities, and the country overall (3–7).
Growth faltering in Guatemalan children has been shown to start in utero and has been associated with maternal height and nutritional status (8–12). In indigenous children in Guatemala, as elsewhere, postnatal deterioration in growth has been broadly attributed to the following 2 major determinants: undernutrition and infections (11, 13–19). However, to our knowledge, potential contributions of more distal social and cultural factors to illness and malnutrition have not been systematically explored in this setting to identify potential beneficial interventions.
For our study of the effects of paternal migration on child health (20), we conducted an ethnographic study in an indigenous village in the Department of Totonicapán. As the study progressed, an intriguing theme developed in the interviews whereby caregivers perceived gender differences in the feeding behaviors of indigenous infants (0–12 mo of age) and young children. Taking advantage of this natural experiment (21) and being cognizant of the relation in infant and young child (IYC) feeding practices, morbidity, and growth (13, 18, 22–32), this finding led us to predict that sex would be associated with the growth pattern of children 0–35 mo of age who were living in the village. Subsequently, we conducted an anthropometric survey in the village to examine this prediction. The results of the village anthropometric survey confirmed the predicted growth patterns. We analyzed national [Demographic and Health Survey (DHS)] data to determine whether the village growth age-sex patterns were seen in children nationwide.
METHODS
Definitions of gender and sex
This article rests on the central distinction between sex and gender. The concept of sex refers to the biological differences between males and females in any species. These differences are determined by genetics, the environment, and the interaction of the 2 factors. The concept of gender refers to the socially constructed beliefs, attitudes, perceptions, and behaviors that humans ascribe to differences between sexes. Differences in child caregiving behaviors that have their origins in gender-associated beliefs and perceptions can lead to biological differences between girls and boys, including differences in growth patterns that may be incorrectly ascribed to inherent, genetically determined sex differences.
Definition of indigenous and nonindigenous in Guatemala
The Guatemalan population of ∼12 million people is roughly divided into the following 2 groups: indigenous and nonindigenous. In the indigenous population, there are 21 Mayan linguistic groups as well as the non-Mayan Xinca and Garifuna. Mayans are the descendants of pre-Colombian inhabitants of Southern Mexico and Central America. Many aspects of Mayan social organization, calendars, religion, and other sociocultural behaviors are also of pre-Colombian origin. According to the last national census conducted in 2002, 39% of the total population self-reported as Mayan, 3.7% of the total population self-reported as Xinca, and 4.9% of the total population self-reported as Garifuna (33). The concept of ethnicity is fluid in Guatemala because many indigenous people culturally assimilate into the mainstream nonindigenous culture after migration out of their communities of origin to urban centers or abroad (34, 35). As a result, the nonindigenous population, which is also referred to as the “ladino” population, includes people of European, indigenous, and mixed European and indigenous descent. Although ethnic identity in Guatemala is occasionally determined by observation (36), it is largely self-determined and depends more on cultural practices, including dress and language, than on genetics. Socioeconomic status is associated with the indigenous and nonindigenous distinction. More than 75% of the indigenous population has been estimated to be impoverished compared with 35% of the nonindigenous population (37).
Study 1: village ethnographic study
The Department of Totonicapán, which is located 203 km from the nation’s capital and with an average altitude >2500 m, was chosen as the region of focus for the research on the basis of its prevalence of chronic malnutrition. An estimated 82% of children <5 y of age are stunted (1). The department is renowned for preserving Maya K’iche’ culture and language; 95% of women identify themselves as Maya K’iche’ (38) and most women dress in the colorful, traditional embroidered huipil (blouse) and woven corte (skirt). A rural village was selected as the study site because of personal contacts with a nongovernmental organization that provided primary health care services in the village and the willingness of local officials to participate in the study. These features made it possible to conduct ethnographic and health research in the village. In 2003, the village had a population of ∼12,000 people who resided in 22 locally recognized sectors; 5 sectors were randomly chosen for the study.
This first study was approved by the Institutional Review Board for Human Participants at Cornell University. The study details, including the objectives, selection procedure, methods, and sponsoring organization (Cornell University), were verbally communicated in K’iche’ or Spanish depending on the language preference of the interviewee. Consent forms were obtained according to the standards of the Institutional Review Board for Human Participants at Cornell University.
Data collection included repeated participant observation, field notes, and multiple informal and semistructured interviews for 18 mo starting in May 2003. The study team was composed of the lead researcher (AT) who originated from the United States, 4 local community health workers, and 3 local university-trained professionals. Bilingual (Spanish and K’iche’) community health workers acted as ambassadors to their village for the researchers and assisted in anthropometric measurements. The university-trained professionals, who were all fluent in K’iche’, assisted in wording interview questions, conducting interviews in K’iche’, and analyzing the qualitative data.
Semistructured interviews were conducted with 24 mothers of children 0–35 mo old. The sample was selected on the basis of the migratory status of fathers because of our interest in the effect of paternal migration to the United States. However, we did not report on that distinction in the current study because we showed no sex differences in childcare on the basis of male migration status. In the study area, 8 households had fathers in the United States; all 8 of the mothers of those households were invited to participate, and all of the mothers agreed to be part of the study. An additional 16 mothers with husbands who were not in the United States were selected on the basis of a similar family composition to that of the migrant families and were invited and agreed to participate in the study. Mothers were visited by the research team an average of 7 times over the course of the fieldwork. All of the mothers interviewed identified themselves as indigenous.
All interviews were recorded, translated, and transcribed. The professional research assistants independently checked interview translations and transcripts for accuracy. In addition to transcripts, the researcher recorded field notes of observations and interview summaries after household visits. The professional research assistants and lead researcher discussed their impressions of the interviews at the end of each day in the village. The data-analysis process was ongoing during the investigation and guided, to the extent possible, the direction of subsequent interviews and follow-up questions. The QSR International qualitative software application NVivo was used to organize data and facilitate coding (39). An identification of themes and coding followed the recommended procedures for this type of analysis (40). Measures to ensure reliability and validity included collecting rich data with verbatim transcripts of taped interviews; member checks with the solicitation of feedback about the data and emerging themes from local community health workers; and the triangulation of interviews and observations over an extended duration of fieldwork (41, 42).
Study 2: village anthropometric survey
On the basis of partial analyses done by April 2004 of the village ethnographic data, we expected differences in growth between sexes; thus from May 2004 to November 2004, we collected anthropometric data from all children (0–35 mo old) in the 5 sectors (60 girls and 59 boys), except for 3 boys and 6 girls who were absent. The lead researcher, who is a registered dietitian with training in anthropometric measures, measured the children with the assistance of the community health workers. Children younger than 24 mo of age were measured in a supine position (recumbent length), whereas older children were measured standing up (height). Length and height are often referred to as height, which is a convention that we follow in this article. The second study was approved by the Institutional Review Board for Human Participants at Cornell University.
Study 3: national anthropometric study
To determine whether the prediction confirmed in a single village could be extrapolated beyond the village, we turned to anthropometric data of the 1998–1999 DHS national sample, in which subjects were identified by ethnic group. This nationally representative data set is in the public domain and is available from the DHS website (43) as is the description of its complex, multistage probability sampling design. The sampling frame of households within 281 sampling units was stratified by 6 urban and rural regions, which encompass the 14 departments of the country. Each sampling unit had 10–20 households. The overall response rate was 83.4%. Anthropometric data were collected from 2343 of children 0–35 mo old
We tested our prediction about national sex differences in growth patterns on data from 463 and 506 indigenous girls and boys in the DHS data set. We also analyzed the growth in 694 nonindigenous girls and 680 nonindigenous boys to see whether similar growth patterns existed in the nonindigenous population. The analysis of these data was approved by the Institutional Review Board for Human Participants at Cornell University.
Growth indexes
Growth faltering is assessed with the use of the mean of individual deficits, which are calculated as the difference between the measured height and the median age- and sex-specific height obtained from the growth standards. This height-for-age difference (HAD) can be used analytically in absolute terms or relative to the SD to calculate the HAZ as follows (44):
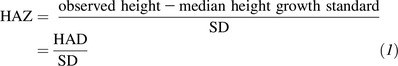 |
Because of the adjustment to each child’s height relative to the median and the distribution of the child’s expected height for his or her age and sex, the HAZ provides a mean value for groups of children with different sex and age compositions, which has been used for comparisons across populations. The HAZ is also used to evaluate changes in the nutritional status of children at different ages. However, the calculation of a HAZ uses, as denominator, the SD of the growth standard, which increases substantially from birth to 5 y of age (45). As a consequence, changes in the HAZ with age can be due to changes in the numerator (the magnitude of the difference HAD) or to changes in the denominator (the increasing SD with age). These effects mean that changes in the HAZ do not directly correspond to absolute changes in height (HAD) across ages. If the HAD remains constant as children age (reflecting the absence of improvement over time), the HAZ will converge toward zero, thereby incorrectly suggesting an improvement with age simply because the denominator (i.e., the SD) increases with age (45). Therefore, the HAD, rather than the HAZ, should be used to describe and compare longitudinal changes in height as individual children or populations of children get older (45). In our analysis, we use the HAD means to examine sex differences in growth from 0 to 35 mo of age. We also compare the differences in results with the use of the HAD vs. HAZ.
We calculated the HAD (in cm) and the HAZ (in SD units) with the use of the WHO 2006 Child Growth Standards available on the WHO website (46). The WHO 2006 growth standards are based on a worldwide sample of healthy breastfed infants and provide a better tool than other references do for analyzing the growth of breastfed infants (47). Deviations from these norms that are due to the environment reflect the health and nutrition of the child and are overwhelmingly determined by childcare circumstances and processes at these young ages (44).
Cross-sectional anthropometric data are used extensively to infer past growth (44, 48). The representation of the cross-sectional data is a close approximation of the mean evolution of the height-for-age of the children over the span of ages studied (49, 50). Therefore, in this article, we refer to the mean growth of this population of children although the data are not longitudinal.
Statistical analysis of village data
The analysis for the village data were confirmatory (51) for the prediction that there would be a sequence of differences between boys and girls beginning with a large difference by midinfancy and diminishing to a much smaller difference thereafter. The mean HAD at 6-mo age intervals (i.e., 0–5, 6–11, 12–17, 18–23, 24–29, and 30–35 mo) was calculated and plotted for each sex. The confirmatory test was visual.
The village-data analysis was exploratory relative to the intervals in which this sequence would occur because there was no empirical or theoretically sound basis to specify exact age intervals beforehand. Therefore, we chose the intervals that seemed most revealing in the village data and developed a single statistical test to examine differences between sexes at the 2 age intervals (differences of the differences test). However, note that any resulting statistical significance of this test is difficult to interpret because the intervals were not chosen a priori, and the test overestimates the significance because of the multiple possible comparisons at different intervals that could have been examined (51).
Statistical analysis of DHS data
The analysis of the DHS growth data were confirmatory for the hypotheses designed to replicate the findings from the village data including the age intervals. For our overall inference about the pattern of sex differences, we used the single statistical test developed for the village data to avoid any multiple testing on the DHS data set. The significance of the differences of the differences would confirm our prediction for the Guatemalan indigenous population.
Statistics were computed with the use of the Intercooled Stata 9.2 statistical software package (StataCorp LP) (52). For the DHS data, survey (svy in Stata) commands were used that were appropriate for the analysis of survey data with clustering. SEs of the means that were related to the estimation of significances of differences between means were calculated for table and figure presentations. One-tailed statistical significance was set at P < 0.05 because the expected directions of differences were specified beforehand.
RESULTS
Study 1: village ethnographic study
A common saying and recurrent theme in interviews concerned gender differences. For example, women commonly said “The man is the head of the woman.” Most women in the village were expected to be submissive to men. Many women needed the permission of their husbands to leave the household, even when the husband was not physically present. The following quotation is from a woman whose husband was in the United States:
I ask. I have to ask his permission. As long as he is alive, I have to ask permission. Because there is no way that I am going to decide alone to do things. Now if I have to go to visit my parents, well I have to ask, I am not in charge of myself, and even more now that there is a telephone in the house. What if he calls? He calls constantly, sometimes when I am not here and then he asks me where I was! So I always tell him where I am going!
In the community, women’s passivity compared with that of men was culturally attributed to innate differences between sexes and thought to be observable even in early infancy. For example, one respondent said, with respect to the differences in the sounds of a male baby’s and a female baby’s cry, “The boy cries with a strong voice. It is the same as when a man talks, with a strong voice, and the woman with a soft voice. Well, because it is a boy! Girl’s voice in fact is soft, less strong, or what do you think? Men and women are not the same!”
As the ethnographic interviews progressed, an important theme emerged. Mothers not only believed girls and boys were innately different but also reported a pattern of perceived differences in how they breastfed and how the children should be fed. Mothers perceived that boys were hungrier than girls were. This perception was derived from the belief that boys are fussier as described in the following quotation:
Boys cry more. Yes, the girls are different. Girls cry because they want to breastfeed or are wet, but they cry more because they are wet. In comparison, the boys are big eaters! Boys cry because they want to breastfeed, and also because they are wet or want to be held. Boys are more demanding because they are boys! In comparison, we, the girls, the little women, well, we are calmer.
Mothers also perceived that boys emptied the breast more quickly and fully than girls did and demanded the breast more often (“Who breastfeeds more are the boys, maybe because their stomach is bigger, more often they breastfeed than the girls, sometimes the girls after breastfeeding stay sleeping, however, the boys ask for the breast very soon”).
Because boys were perceived to be hungry sooner and less satisfied, mothers perceived that their breast milk “runs out” for boys, saying, “If it is a boy, the milk runs out. Boys breastfeed well, they breastfeed, now the girls do not finish [the breast milk], they breastfeed less.”
Compared with boys, girls were characterized as more patient, less demanding, requiring less time to breastfeed, and requiring less complementary food. For example, mothers reported that female infants need to eat less frequently than do male infants, saying, “Well, here, the boy always eats more. You have to give [the boy] a snack. Sometimes, when you breastfeed him, well, he always stays fussy, and if you give him a snack, he stays satisfied, sometimes boys eat up to 4 times per day! In comparison, the girl eats 3 times! The girl eats less than the boy.”
A common snack or between-meals food in the village, which is given to infants and young children, is atole (in Spanish) or aki’a (in K’iche’), which is a thin gruel made from ground corn dough mixed with water and sugar.
On the basis of these ethnographic findings, and cognizant of the relations in IYC feeding practices, morbidity, and growth (13, 18, 22–32) as explicated in the Discussion section of this article, we predicted that the villages girls and boys would have different growth patterns. We expected a cumulative difference in favor of girls by midinfancy that might continue but would diminish over time. At this stage of the study, we did not have a hypothesis about the magnitude and timing of these differences between sexes because that would have depended on the relative rates of growth faltering of sexes.
Study 2: village anthropometric survey
Figure 1 presents the growth curves generated by plotting HAD means for 6-mo age intervals of girls and boys aged 0–35 mo with the use of the Totonicapán village data. Figure 1 visually bears out our expectation of a greater deficit in the HAD of boys than of girls beginning in midinfancy and followed by a marked diminution of the differences in deficit thereafter. The pattern in Figure 1 confirms our theory, which was based on the ethnographic findings preceding the analysis of these data.
FIGURE 1.

Growth curves generated by plotting mean ± SE HADs (in cm) for 6-mo age intervals of indigenous girls and boys with the use of Totonicapán village data disaggregated by age group and sex. n values for age groups were as follows: 0–5 mo, 6 girls, 10 boys; 6–11 mo, 11 girls, 12 boys; 12–17 mo, 4 girls, 10 boys; 18–23 mo, 16 girls, 6 boys; 24–29 mo, 7 girls, 15 boys; and 30–35 mo, 16 girls, 6 boys. HAD, height-for-age difference.
A statistical confirmation depended on facts about timing, which we could not specify on the basis of the ethnographic findings alone. However, an analysis of Figure 1 shows that boys’ growth began to deteriorate in the first 6 mo of infancy, whereas the girls’ growth was healthy until the end of infancy when the girls’ growth began to deteriorate more than those of boys. A significant sex difference in the mean HAD was shown in the 6–17-mo interval. The difference of the HAD between girls (−3.51 cm) and boys (−6.49 cm) was 2.98 cm (P < 0.03) (Table 1).
TABLE 1.
Differences in mean HADs between girl and boy indigenous children aged 6–17 and 18–29 mo, Totonicapán village data1
| Age and sex | n | Mean HAD | Girls minus boys, cm | P > t2 | Difference of the differences | P > t2 |
| 6–17 mo | — | — | ||||
| Girls | 15 | −3.51 ± 1.133 | 2.98 ± 1.48 | 0.025 | ||
| Boys | 22 | −6.49 ± 0.95 | ||||
| 18–29 mo | — | — | ||||
| Girls | 23 | −10.27 ± 0.52 | 0.07 ± 0.81 | 0.468 | ||
| Boys | 21 | −10.34 ± 0.63 | ||||
| Difference of the differences | — | — | — | — | 2.92 | 0.0438 |
HAD, height-for-age difference.
One-tailed test.
Mean ± SE (all such values).
Because of more growth retardation in girls than in boys after 12 mo, the difference in favor of girls seen in the 6–17-mo interval diminished over time, as expected, so that it was only a 0.07-cm HAD by the 18–29-mo interval. The difference of the differences (2.98 − 0.07) was significant (P < 0.05). As discussed in Methods, the significance of these findings in the village data were not interpretable.
Study 3: national anthropometric study
Findings in Guatemalan indigenous children
The analyses of the DHS data investigated whether the village pattern was replicated nationally. We amended our village prediction for a new prediction that specified the 6–17- and 18–29-mo intervals chosen from the village data. Figure 2 presents the growth curves generated by plotting the HAD means for 6-mo age intervals of indigenous girls and boys aged 0–35 mo with the use of the national DHS data (Supplemental Table 1). Nationwide, the HAD mean differences between sexes in indigenous children (Figure 2) showed a pattern similar to that shown in Figure 1 of the village study.
FIGURE 2.
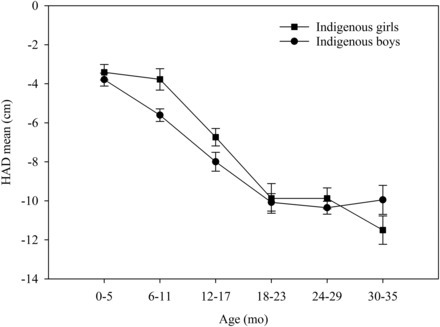
Growth curves generated by plotting mean ± SE HADs (in cm) for 6-mo age intervals of Guatemalan indigenous girls and boys with the use of national Demographic and Health Survey data disaggregated by age group and sex. n values for age groups were as follows: 0–5 mo, 83 girls, 77 boys; 6–11 mo, 73 girls, 91 boys; 12–17 mo, 74 girls, 90 boys; 18–23 mo, 78 girls, 85 boys; 24–29 mo, 80 girls, 96 boys; and 30–35 mo, 75 girls, 67 boys. HAD, height-for-age difference.
In the DHS data, as in the village data, the boys’ growth began to deteriorate in the first 6 mo of infancy, and the girls’ growth deteriorated very little until 12 mo. As shown in Table 2, the resulting difference in the 6–17-mo interval in the HAD between girls (−5.14 cm) and boys (−6.75) was 1.61 cm (P < 0.001).
TABLE 2.
Differences in mean HADs between girl and boy indigenous children aged 6–17 and 18–29 mo, DHS data1
| Age and sex | n | Mean HAD | Girls minus boys, cm | P > t2 | Difference of the differences | P > t2 |
| 6–17 mo | — | — | ||||
| Girls | 147 | −5.14 ± 0.423 | 1.61 ± 0.50 | <0.001 | ||
| Boys | 181 | −6.75 ± 0.32 | ||||
| 18–29 mo | — | — | ||||
| Girls | 158 | −9.88 ± 0.48 | 0.35 ± 0.44 | 0.213 | ||
| Boys | 181 | −10.23 ± 0.28 | ||||
| Difference of the differences | — | — | — | — | 1.26 | 0.0440 |
DHS, Demographic and Health Survey; HAD, height-for-age difference.
One-tailed test.
Mean ± SE (all such values).
The HAD deteriorated in the 18–29-mo interval for boys at the same rate as in the previous year. Girls not only began to deteriorate in this interval but did so more severely than boys did. The 6–17-mo interval 1.61 cm HAD difference in favor of girls diminished to 0.35 cm in the 18–29-mo interval. The test of the difference of the differences confirmed the prediction that was refined on the basis of the village anthropometric survey (P < 0.05) and was generalizable nationally. The national data also replicated the village finding that the girl HAD deteriorated little in infancy.
The pattern of differences between sexes reported in the current article became apparent only when the analyses used sufficiently narrow intervals to capture the periods in which the differential growth occurred. An examination that used large intervals, such as 0–23- and 0–35- mo intervals, resulted in mean HAD differences of 1.12 cm (P < 0.001) and 0.61 cm (P < 0.05), respectively, in favor of girls. These mean differences masked the greater growth retardation in girls relative to that in boys in the second year of life, which was revealed by examination across narrower intervals.
The analysis with the use of the HAZ resulted in the same conclusions as for the HAD regarding differences in the timing of growth faltering between sexes. The HAZ mean difference in the 6–17-mo interval in the HAZ between girls (−1.97) and boys (−2.76) was 0.79 (P < 0.001); and the 6–17-mo interval 0.79 HAZ difference in favor of girls diminished to 0.30 in the 18–29-mo interval (P < 0.05) (Table 3). However, the use of the HAD vs. the HAZ resulted in markedly different patterns of growth-deficit accumulation between girls and boys (Figure 3). The growth curves that were based on the HAZ (Figure 3) showed an improvement in boys and stabilization in girls from 24 to 35 mo of age. In contrast, the growth curves that were based on the HAD (Figure 2) showed stabilization but no improvement in boys and further deterioration for girls after 24–35 mo of age. An extension of the HAZ growth curves to 60 mo of age resulted in continued improvement in both girls and boys, whereas the HAD growth curves to 60 mo of age showed a continued decline (an increase in deficit) in both girls and boys (data not shown).
TABLE 3.
Differences in mean HAZs between girl and boy indigenous children aged 6–17 and 18–29 mo, DHS data1
| Age and sex | n | Mean HAZ | Girls minus boys, cm | P > t2 | Difference of the differences | P > t2 |
| 6–17 mo | — | — | ||||
| Girls | 147 | −1.97 ± 0.163 | 0.79 ± 0.17 | <0.001 | ||
| Boys | 181 | −2.76 ± 0.13 | ||||
| 18–29 mo | — | — | ||||
| Girls | 158 | −3.06 ± 0.15 | 0.30 ± 0.14 | 0.033 | ||
| Boys | 181 | −3.36 ± 0.10 | ||||
| Difference of the differences | — | — | — | — | 0.492 | 0.022 |
DHS, Demographic and Health Survey; HAZ, height-for-age z score.
One-tailed test.
Mean ± SE (all such values).
FIGURE 3.

Growth curves generated by plotting mean ± SE HAZs for 6-mo age intervals of Guatemalan indigenous girls and boys with the use of national Demographic and Health Survey data disaggregated by age group and sex. n values for age groups were as follows: 0–5 mo, 83 girls, 77 boys; 6–11 mo, 73 girls, 91 boys; 12–17 mo, 74 girls, 90 boys; 18–23 mo, 78 girls, 85 boys; 24–29 mo, 80 girls, 96 boys; and 30–35 mo, 75 girls, 67 boys. HAZ, height-for-age z score.
Findings in Guatemalan nonindigenous children
Figure 4 shows that nonindigenous children were less stunted than indigenous children were. In contrast to the indigenous children, there were no consistent differences in the growth patterns of nonindigenous girls and boys or any statistical difference in the HAD between sexes in the 6–17-mo age interval.
FIGURE 4.

Growth curves generated by plotting mean ± SE HADs (in cm) for 6-mo age intervals of Guatemalan nonindigenous and indigenous girls and boys with the use of national Demographic and Health Survey data disaggregated by age group and sex. n values for nonindigenous age groups were as follows: 0–5 mo, 123 girls, 114 boys; 6–11 mo, 116 girls, 115 boys; 12–17 mo, 118 girls, 116 boys; 18–23 mo, 116 girls, 123 boys; 24–29 mo, 128 girls, 115 boys; and 30–35 mo, 93 girls, 97 boys. n values for indigenous age groups were as follows: 0–5 mo, 83 girls, 77 boys; 6–11 mo, 73 girls, 91 boys; 12–17 mo, 74 girls, 90 boys; 18–23 mo, 78 girls, 85 boys; 24–29 mo, 80 girls, 96 boys; and 30–35 mo, 75 girls, 67 boys. HAD, height-for-age difference.
DISCUSSION
In the village ethnographic interviews, we showed that mothers gave foods to complement breast milk early to boys because they perceived that their breast milk was insufficient. Unfortunately, this action was counterproductive because the too-early introduction of food other than breast milk reduces breast-milk production because vigorous suckling and emptying of the breast are necessary to maintain breast-milk production (53). Thus, giving complementary food in response to the perception that boys are hungry leads to a vicious cycle of less milk, more hunger, feeding of more complementary foods, and even less milk production. Complementary feeding also exposes the boys to pathogens and illnesses (14, 54, 55), which is compounded by less ingestion of breast milk’s health-promoting factors (14). Illnesses compromise growth (56) and do so more in children with poor nutrition than in well-nourished children (57). Thus, a poor diet and illnesses potentiate each other in impairing growth. We expected that all of these detrimental effects of the early introduction of complementary food to boys would lead to a cumulative difference in growth in favor of girls, which would become apparent by ∼6 mo of age.
After the first half of infancy, the advantages of exclusive breastfeeding are outweighed by an increasing nutritional deficit in girls relative to in boys. Starting at ∼6 mo of age, both girls and boys need food to complement breast milk (30), but in the study village, mothers reported that girls were fed less food than boys were fed. These considerations led us to predict that boys’ growth would falter in the first half of infancy because of the early introduction of foods, and sometime thereafter, girls would falter more than boys would because the girls were fed less food.
An inspection of the anthropometric data collected in the village confirmed our prediction from the natural experiment of the effect of mothers’ gender perceptions and behaviors on the sequencing of the growth differences between sexes. We chose appropriate age intervals from the village findings to improve our prediction about the timing of the sex-difference patterns. We used this improved prediction to test the national DHS data.
The DHS data replicated the pattern of the growth differences identified in the village study, including a large difference between girls and boys in the 6–17-mo interval followed by a marked diminution in the 18–29-mo interval. The statistical test of these findings (P < 0.05) is generalizable nationally to Guatemalan indigenous children.
Nonindigenous children were also growth retarded but much less so than were the indigenous children. The nonindigenous children did not exhibit the sex differences in growth patterns shown in the indigenous children. Indigenous children of refugee families who were living in the United States with better economic and social resources have been shown to be substantially taller and heavier than were indigenous children who were living in Guatemala (58). This result substantiates the conclusions in the literature that a variation in growths of height and weight during the first years of life in children of diverse ethnic groups is, above all, regulated by the environment (2, 44, 59). Therefore, ethnic differences in growth patterns in Guatemala are attributable to cultural and socioeconomic differences.
The use of the HAZ vs. HAD did not alter the conclusions regarding sex differences in growth patterns from 0 to 29 mo of age. However, as documented previously (60), the HAZ masks the actual continued accumulation of a growth deficit after 24 mo of age.
Although there is widespread belief that appropriate breastfeeding promotes growth, there is little evidence of this effect during infancy (29, 55). In our study, the causal link with gendered child feeding and growth was very strong because the analyses of growth confirmed the impact of a natural experiment in which confounding was controlled for by the fact that girls and boys were in the same kinds of families. The link would be even more plausible (61) if the path from gendered perceptions was shown not to be mediated through other paths such as a differential exposure to pathogens. We showed no evidence of gender perceptions or behaviors relative to the exposure to pathogens or the care of sick children. If the difference in favor of girls was indeed due to more exclusive breastfeeding, it allays concerns that breastfeeding alone might not compensate for the exposure to infections in the first half of infancy in these kinds of populations.
In the second half of infancy, we were surprised by the finding in the village data, which was replicated in the DHS data, that the indigenous girls continued to grow well throughout the first year of life. This result might have been because of the continuing fuller breastfeeding in girls, which was information received during the ethnographic interviews. Growth benefits from breastfeeding have been reported even into the second year of life in a Peruvian population with poor complementary feeding (62).
We also showed that the comparison of the mean growth between sexes over large age intervals obscured the more-severe growth faltering that girls experienced in the second year of life and could have led to the erroneous conclusion that girls experienced less growth retardation than boys did. Most studies that have analyzed sex differences in anthropometric measures reported multiyear means and have not disaggregated age by narrow-enough age intervals to reveal subtle differences in growth patterns early in childhood (63–72). Few previous investigations have reported differences between sexes in the timing of growth faltering. These studies, as reviewed in the discussion that follows, were exploratory and not confirmatory.
An incidental finding in a Guatemalan rural village study reported a difference of a 0.32 HAZ in favor of girls at 3 mo but did not comment on this finding or on the difference of a 0.26 HAZ at 6 mo (12). In Bangladesh, girls showed less growth faltering than boys did at 6 mo of age but faster faltering thereafter (73). In a population of Filipino children, stunting in boys exceeded that of girls in the first year of life. During the second year of life, there were more new cases of stunting in girls (22). A study of Malawian children (74) was most similar to our study in the comparison of 2 ethnic groups. In one of the ethnic groups, the Yao, boys had a lower mean HAZ than did girls between the ages of 6 and 23 mo; however, there was a reversal in the means at older ages. To our knowledge, the only study that examined possible determinants of the sex pattern was the Filipino study (22). The study cited a previous study by the same investigator group that showed that “males are given supplemental foods earlier, are fed larger quantities of supplemental foods and have higher rates of diarrhea compared with females” (75). These findings correspond to the gendered cultural behaviors reported in our Guatemalan village study.
To facilitate future studies on the interactions of biological and sociocultural dynamics of growth faltering, we propose an explanatory model for the observed differences between sexes in growth (Figure 5). This model involves the convergence of several biological-cultural-ecologic factors in the pathway that produce differences between sexes in growth patterns. Sex-based biology modifies the effect of living conditions on infectious disease because males are more prone to disease episodes (76). Increased illness subsequently increases macronutrient and micronutrient requirements and affects hunger. Sex-based biology may also indirectly affect hunger considering that healthy male infants are born slightly larger, grow at a faster pace, and, as a result, have higher energy needs than females do (77, 78). These biological facts are interpreted in the context of gender-based beliefs about IYC care, which are based on broader cultural gender beliefs as well as sex-based biological differences in hunger. Finally, the gender-based beliefs determine the breastfeeding and complementary feeding practices, which both reinforce the children’s behaviors and the mothers’ feeding responses and, compounded by illness, result in differences between sexes in growth retardation.
FIGURE 5.

Biological-cultural-ecologic influences on differences in growth-faltering patterns between sexes. Lines that end in an arrowhead denote an additive effect of the determinant. Lines that end in a crossbar represent interactive or modifying effects (synergistic or antagonistic). IYC, infant and young child.
In conclusion, ethnography and the observational assessment of feeding and hygiene behaviors of girls and boys in populations where girls grow as well as they did in the current study should be a high priority for investigation because this inquiry will reveal feeding and other protective behaviors that are effective in promoting healthy growth in very-poor populations. The promotion of these beneficial behaviors would likely not require food supplementation in the early complementary feeding period. In our study, infant girls who lived in one of the most stunted populations in the world (45) did not require added resources beyond those that were available in the household. The improvement of mothers’ foods may nevertheless be necessary to maintain or increase breast-milk production to meet infant demands for prolonging breastfeeding (79). Furthermore, the improvement of complementary feeding practices for both sexes remains a challenge as shown by the serious deterioration of height after infancy in both girls and boys.
Supplementary Material
Acknowledgments
We thank the study team: Calixto Torres Santay, Eduardo Elias, and Genoveva Vicente Ajxup. We also are thankful for the invaluable editorial assistance of Jeff Feldmesser.
The authors’ responsibilities were as follows—AT: analyzed the village-level data, conducted the research, and had primary responsibility for the final content of the manuscript; AT, GP, and DLP: designed the research study at the village level; GP and DLP: supervised the analysis of the village-level data; AT and J-PH: analyzed the DHS data; AT, J-PH, and GP: wrote the manuscript; and all authors: read and approved the manuscript. None of the authors reported a conflict of interest related to the study.
ABBREVIATIONS
- DHS
Demographic and Health Survey
- HAD
height-for-age difference
- HAZ
height-for-age z score
- IYC
infant and young child
FOOTNOTES
Supported by the US Student Fulbright Program and an NIH under award T32-DK007158.
REFERENCES
- 1. Ministerio de Salud Pública y Asistencia Social (MSPAS), Instituto Nacional de Estadística (INE), United States Centers for Disease Control and Prevention (CDC). [Encuesta Nacional de Salud Materno Infantil National Maternal and Child Health Survey (ENSMI) 2008/09]. Guatemala/Atlanta (GA): MSPAS/INE/CDC; 2010. (in Spanish). [Google Scholar]
- 2. WHO Multicentre Growth Reference Study Group. WHO Child Growth Standards: length/height-for-age, weight-for-age, weight-for-length, weight-for-height and body mass index-for-age: methods and development. Geneva (Switzerland): WHO; 2006. [Google Scholar]
- 3. Black RE, Victora CG, Walker SP, Bhutta ZA, Christian P, de Onis M, Ezzati M, Grantham-McGregor S, Katz J, Martorell R, et al. Maternal and child undernutrition and overweight in low-income and middle-income countries. Lancet 2013;382:427–51. [DOI] [PubMed] [Google Scholar]
- 4. Pelletier DL, Frongillo E, Habicht JP.. Epidemiological evidence for a potentiating effect of malnutrition on child mortality. Am J Public Health 1993;83:1130–3. [DOI] [PMC free article] [PubMed] [Google Scholar]
- 5. Hoddinott J, Behrman JR, Maluccio JA, Melgar P, Quisumbing AR, Ramirez-Zea M, Stein AD, Yount KM, Martorell R.. Adult consequences of growth failure in early childhood. Am J Clin Nutr 2013;98:1170–8. [DOI] [PMC free article] [PubMed] [Google Scholar]
- 6. Dewey KG, Begum K.. Long-term consequences of stunting in early life. Matern Child Nutr 2011;7:5–18. [DOI] [PMC free article] [PubMed] [Google Scholar]
- 7. Victora CG, Adair L, Fall C, Hallal PC, Martorell R, Richter L, Sachdev HS.. Maternal and child undernutrition: consequences for adult health and human capital. Lancet 2008;371:340–57. [DOI] [PMC free article] [PubMed] [Google Scholar]
- 8. Rivera J, Ruel MT.. Growth retardation starts in the first three mo of life among rural Guatemalan children. Eur J Clin Nutr 1997;51:92–6. [DOI] [PubMed] [Google Scholar]
- 9. Neufeld LM, Haas JD, Grajéda R, Martorell R.. Changes in maternal weight from the first to second trimester of pregnancy are associated with fetal growth and infant length at birth. Am J Clin Nutr 2004;79:646–52. [DOI] [PubMed] [Google Scholar]
- 10. Addo OY, Stein AD, Fall CH, Gigante DP, Guntupalli AM, Horta BL, Kuzawa CW, Lee N, Norris SA, Prabhakaran P, et al. Maternal height and child growth patterns. J Pediatr 2013;163:549–54. [DOI] [PMC free article] [PubMed] [Google Scholar]
- 11. Ruel MT.. The natural history of growth failure: Importance of intrauterine and postnatal periods. In:R. Matorell RH, editors. Nutrition and growth. Nestle Nutrition Workshop Series, Pediatric Program. Philadelphia: Nestec Ltd., Vevey/Lippincott Williams & Wilkins; 2001. [Google Scholar]
- 12. Berngard SC, Berngard JB, Krebs NF, Garcés A, Miller LV, Westcott J, Wright LL, Kindem M, Hambidge KM.. Newborn length predicts early infant linear growth retardation and disproportionately high weight gain in a low-income population. Early Hum Dev 2013;89:967–72. [DOI] [PMC free article] [PubMed] [Google Scholar]
- 13. Martorell R, Habicht JP, Yarbrough C, Lechtig A, Klein RE, Western KA.. Acute morbidity and physical growth in rural Guatemalan children. Am J Dis Child 1975;129:1296–301. [DOI] [PubMed] [Google Scholar]
- 14. Stephensen CB.. Burden of infection on growth failure. J Nutr 1999;129(2S Suppl):534S–8S. [DOI] [PubMed] [Google Scholar]
- 15. Marini A, Gragnolati M.. Malnutrition and poverty in Guatemala. Washington (DC): International Bank for Reconstruction and Development, World Bank; 2003. [Google Scholar]
- 16. Martorell R, Flores R, Hickey M.. Stunting in Guatemala, analyses of change over 15 years. Bethesda (MD): Abt Associates Inc.; 2002. [Google Scholar]
- 17. Pebley AR, Goldman N.. Social inequality and children’s growth in Guatemala. Health Transit Rev 1995;5:1–20. [PubMed] [Google Scholar]
- 18. Habicht JP, Martorell R, Rivera JA.. Nutritional impact of supplementation in the INCAP longitudinal study: analytic strategies and inferences. J Nutr 1995;125(4 Suppl):1042S–50S. [DOI] [PubMed] [Google Scholar]
- 19. Mata LJ, Gangarosa EJ, Cáceres A, Perera DR, Mejicanos ML.. Epidemic shiga bacillus dysentery in Central America. I. Etiologic investigations in Guatemala, 1969. J Infect Dis 1970;122:170–80. [DOI] [PubMed] [Google Scholar]
- 20. Tumilowicz A.. Gender constraints and constructs and paternal migration to the United States: influences on child health and growth in indigenous Guatemalan households. Division of Nutritional Sciences. Ithaca (NY): Cornell University; 2006. [Google Scholar]
- 21. Porta M.. A dictionary of epidemiology. 5th ed.Oxford (United Kingdom): Oxford University Press; 2008. [Google Scholar]
- 22. Adair LS, Guilkey DK.. Age-specific determinants of stunting in Filipino children. J Nutr 1997;127:314–20. [DOI] [PubMed] [Google Scholar]
- 23. de Onis M, Garza C, Victora CG, Onyango AW, Frongillo EA, Martines J.. The WHO Multicentre Growth Reference Study: planning, study design, and methodology. Food Nutr Bull 2004;25:15S–26S. [DOI] [PubMed] [Google Scholar]
- 24. Bhutta ZA, Das JK, Rizvi A, Gaffey MF, Walker N, Horton S, Webb P, Lartey A, Black RE.. Evidence-based interventions for improvement of maternal and child nutrition: what can be done and at what cost? Lancet 2013;382:452–77. [DOI] [PubMed] [Google Scholar]
- 25. Guzmán MA, Scrimshaw NS, Bruch HA, Gordon JE.. Nutrition and infection field study in Guatemalan villages, 1959–1964. Arch Environ Health 1968;17:107–18. [DOI] [PubMed] [Google Scholar]
- 26. Allen LH.. Malnutrition and human function: a comparison of conclusions from the INCAP and nutrition CRSP studies. J Nutr 1995;125(4 Suppl):1119S–26S. [DOI] [PubMed] [Google Scholar]
- 27. Kramer M, Kakuma R.. The optimal duration of exclusive breastfeeding. In:Pickering L, Morrow A, Ruiz-Palacios G, Schanler R, editors. Protecting infants through human milk. New York: Springer; 2004. p. 63–77. [Google Scholar]
- 28. Adair L, Popkin BM, VanDerslice J, Akin J, Guilkey D, Black R, Briscoe J, Flieger W.. Growth dynamics during the first two years of life: a prospective study in the Philippines. Eur J Clin Nutr 1993;47:42–51. [PubMed] [Google Scholar]
- 29. WHO. The optimal duration of exclusive breastfeeding: report of an expert consultation, 28–30March2001. Geneva (Switzerland): WHO; 2001. [Google Scholar]
- 30. WHO. Complementary feeding: report of the global consultation, and summary of guiding principles for complementary feeding of the breastfed child. Geneva (Switzerland): WHO; 2003. [Google Scholar]
- 31. Beard AS, Blaser MJ.. The ecology of height: the effect of microbial transmission on human height. Perspect Biol Med 2002;45:475–98. [DOI] [PubMed] [Google Scholar]
- 32. Rogers IS, Emmett PM, Golding J.. The growth and nutritional status of the breast-fed infant. Early Hum Dev 1997;49(Suppl):S157–74. [DOI] [PubMed] [Google Scholar]
- 33. INE. Censos nacionales xi de población y vi de habitación, características de la población y de los locales de habitación censados. [National Census XI of Population and VI of Household]. (Guatemala): INE; 2002. (in Spanish). [Google Scholar]
- 34. van den Berghe PL.. Ethnic membership and cultural change in Guatemala. Soc Forces 1968;46(4):514–22. [Google Scholar]
- 35. Yoshioka H.. The impact of international migration on ethnic relations and ethnic identity shift in Guatemala and Nicaragua. Austin (TX): University of Texas at Austin; 2012. [Google Scholar]
- 36. MSPAS, INE, United States Agency for International Development (USAID), United Nation Children’s Fund (UNICEF), United Nations Population Fund (UNFPA). Encuesta Nacional de Salud Materno Infantil [National Maternal and Child Health Survey (ENSMI)] 1998/1999. (Guatemala): MSPAS/INE/USAID/UNICEF/UNFPA; 1999. (in Spanish). [Google Scholar]
- 37. World Bank. Guatemala - poverty assessment: good performance at low levels. Washington (DC): World Bank; 2009. [Google Scholar]
- 38. Chaparro C.. Household food insecurity and nutritional status of women of reproductive age and children under 5 years of age in five departments of the western highlands of Guatemala: an analysis of data from the National Maternal-Infant Health Survey 2008-09 of Guatemala. Washington (DC): FHI 360/FANTA; 2012. [Google Scholar]
- 39. QSR International. NVivo. 2.0 ed. Doncaster (Australia): QSR International; 2002. [Google Scholar]
- 40. Strauss A, Corbin J.. Basics of qualitative research: techniques and procedures for developing grounded theory, 2nd ed.Thousand Oaks (CA): Sage Publications; 1998. [Google Scholar]
- 41. Bernard HR.. Research methods in anthropology: qualitative and quantitative approaches. 3rd ed.Walnut Creek (CA): Altamira Press; 2002. [Google Scholar]
- 42. Maxwell JA.. Qualitative research design: an interactive approach. Thousand Oaks (CA): Sage Publications; 1996. [Google Scholar]
- 43. Demographic and Health Survey (DHS) Program. Guatemala: Interim DHS, 1998. –99. Washington (DC): 1999. [cited 2015February1]. Available from: http://www.dhsprogram.com/ (accessed February 2015). [Google Scholar]
- 44. WHO, editor. Physical status: the use and interpretation of anthropometry: a report of a WHO expert committee. Geneva (Switzerland): WHO; 1995. [PubMed] [Google Scholar]
- 45. Leroy JL, Ruel MT, Habicht JP, Frongillo E.. Using height-for-age difference instead of height-for-age Z-scores for the meaningful measurement of catch-up growth in children less than 5 years of age In:Sahn DE, editor. The fight against hunger and malnutrition: the role of food, agriculture, and targeted policies. Oxford: Oxford University Press; 2015. [Google Scholar]
- 46. WHO. The WHO Child Growth Standards [Internet]. Geneva (Switzerland): WHO, 2006. 2015. [cited 2015May12]. Available from: http://www.who.int/childgrowth/en/. [Google Scholar]
- 47. de Onis M, Onyango AW, Borghi E, Garza C, Yang H.. Comparison of the World Health Organization (WHO) Child Growth Standards and the National Center for Health Statistics/WHO international growth reference: implications for child health programmes. Public Health Nutr 2006;9:942–7. [DOI] [PubMed] [Google Scholar]
- 48. Shen T, Habicht JP, Chang Y.. Effect of economic reforms on child growth in urban and rural areas of China. N Engl J Med 1996;335:400–6. [DOI] [PubMed] [Google Scholar]
- 49. Victora CG, de Onis M, Hallal PC, Blössner M, Shrimpton R.. Worldwide timing of growth faltering: revisiting implications for interventions. Pediatrics 2010;125:e473–80. [DOI] [PubMed] [Google Scholar]
- 50. Shrimpton R, Victora CG, de Onis M, Lima RC, Blossner M, Clugston G.. Worldwide timing of growth faltering: implications for nutritional interventions. Pediatrics 2001;107:E75. [DOI] [PubMed] [Google Scholar]
- 51. Bender R, Lange S.. Adjusting for multiple testing—when and how? J Clin Epidemiol 2001;54:343–9. [DOI] [PubMed] [Google Scholar]
- 52. StataCorp. Intercooled Stata 9.2. College Station (TX): StataCorp; 2005. [Google Scholar]
- 53. Lawrence RA, Lawrence RM.. Breastfeeding: a guide for the medical professional. Maryland Heights (MI): Elsevier Health Sciences; 2011. [Google Scholar]
- 54. Martines JC, Habicht JP, Ashworth A, Kirkwood BR.. Weaning in southern Brazil: is there a “weanling’s dilemma”? J Nutr 1994;124:1189–98. [DOI] [PubMed] [Google Scholar]
- 55. Kramer MS, Kakuma R.. Optimal duration of exclusive breastfeeding. Cochrane Database Syst Rev 2012;8:CD003517 [DOI] [PMC free article] [PubMed] [Google Scholar]
- 56. Martorell R, Habicht JP, Yarbrough C, Lechtig A, Klein RE, Western KA.. Acute morbidity and physical growth in rural Guatemalan children. Am J Dis Child 1975;129:1296–301. [DOI] [PubMed] [Google Scholar]
- 57. Lutter CK, Habicht JP, Rivera JA, Martorell R.. The relationship between energy intake and diarrheal disease in their effects on child growth: biological model, evidence, and implications for public health policy. Food Nutr Bull 1992;14:36–42. [Google Scholar]
- 58. Bogin B, Loucky J.. Plasticity, political economy, and physical growth status of Guatemala Maya children living in the United States. Am J Phys Anthropol 1997;102:17–32. [DOI] [PubMed] [Google Scholar]
- 59. Habicht JP, Yarborough C, Martorell R, Malina R, Klein F.. Height and weight standards for pre-school children. Lancet 1974;1:611. [DOI] [PubMed] [Google Scholar]
- 60. Leroy JL, Ruel M, Habicht JP, Frongillo EA.. Linear growth deficit continues to accumulate beyond the first 1000 days in low- and middle-income countries: global evidence from 51 national surveys. J Nutr 2014;144:1460–6. [DOI] [PubMed] [Google Scholar]
- 61. Habicht JP, Victora CG, Vaughan JP.. Evaluation designs for adequacy, plausibility and probability of public health programme performance and impact. Int J Epidemiol 1999;28:10–8. [DOI] [PubMed] [Google Scholar]
- 62. Marquis GS, Habicht JP, Lanata CF, Black RE, Rasmussen KM.. Breast milk or animal-product foods improve linear growth of Peruvian toddlers consuming marginal diets. Am J Clin Nutr 1997;66:1102–9. [DOI] [PubMed] [Google Scholar]
- 63. Adekanmbi VT, Kayode GA, Uthman OA.. Individual and contextual factors associated with childhood stunting in Nigeria: a multilevel analysis. Matern Child Nutr 2013;9:244–59. [DOI] [PMC free article] [PubMed] [Google Scholar]
- 64. Engebretsen IM, Tylleskär T, Wamani H, Karamagi C, Tumwine JK.. Determinants of infant growth in Eastern Uganda: a community-based cross-sectional study. BMC Public Health 2008;8:418. [DOI] [PMC free article] [PubMed] [Google Scholar]
- 65. Espo M, Kulmala T, Maleta K, Cullinan T, Salin ML, Ashorn P.. Determinants of linear growth and predictors of severe stunting during infancy in rural Malawi. Acta Paediatr 2002;91:1364–70. [DOI] [PubMed] [Google Scholar]
- 66. Gewa CA, Yandell N.. Undernutrition among Kenyan children: contribution of child, maternal and household factors. Public Health Nutr 2012;15:1029–38. [DOI] [PubMed] [Google Scholar]
- 67. Hien NN, Kam S.. Nutritional status and the characteristics related to malnutrition in children under five years of age in Nghean, Vietnam. J Prev Med Public Health 2008;41:232–40. [DOI] [PubMed] [Google Scholar]
- 68. Lesiapeto MS, Smuts CM, Hanekom SM, Du Plessis J, Faber M.. Risk factors of poor anthropometric status in children under five years of age living in rural districts of the Eastern Cape and KwaZulu-Natal provinces, South Africa. South Afr J Clin Nutr 2010;23(4):202–207. [Google Scholar]
- 69. Medhin G, Hanlon C, Dewey M, Alem A, Tesfaye F, Worku B, Tomlinson M, Prince M.. Prevalence and predictors of undernutrition among infants aged six and twelve mo in Butajira, Ethiopia: the P-MaMiE Birth Cohort. BMC Public Health 2010;10:27. [DOI] [PMC free article] [PubMed] [Google Scholar]
- 70. Meshram II, Laxmaiah A, Gal Reddy C, Ravindranath M, Venkaiah K, Brahmam G.. Prevalence of under-nutrition and its correlates among under 3-year-old children in rural areas of Andhra Pradesh, India. Ann Hum Biol 2011;38:93–101. [DOI] [PubMed] [Google Scholar]
- 71. Olwedo MA, Mworozi E, Bachou H, Orach CG.. Factors associated with malnutrition among children in internally displaced person’s camps, northern Uganda. Afr Health Sci 2008;8:244–52. [PMC free article] [PubMed] [Google Scholar]
- 72. Wamani H, Åstrøm AN, Peterson S, Tumwine JK, Tylleskär T.. Boys are more stunted than girls in sub-Saharan Africa: a meta-analysis of 16 demographic and health surveys. BMC Pediatr 2007;7:17. [DOI] [PMC free article] [PubMed] [Google Scholar]
- 73. Moestue H.. Can anthropometry measure gender discrimination? An analysis using WHO standards to assess the growth of Bangladeshi children. Public Health Nutr 2009;12:1085–91. [DOI] [PubMed] [Google Scholar]
- 74. Pelletier DL, Msukwa LAH.. The use of national sample surveys for nutritional surveillance: lessons from Malawi’s National Sample Survey of Agriculture. Soc Sci Med 1991;32:887–98. [DOI] [PubMed] [Google Scholar]
- 75. Popkin BM, Adair LS, Akin JS, Black RE, Briscoe J, Flieger W.. Breast-feeding and diarrheal morbidity. Pediatrics 1990;86:874–82. [PubMed] [Google Scholar]
- 76. Waldron I.. Sex differences in human mortality: the role of genetic factors. Soc Sci Med 1983;17:321–33. [DOI] [PubMed] [Google Scholar]
- 77. Brown KH, Dewey KG, Allen L.. Complementary feeding of young children in developing countries: a review of current scientific knowledge. Geneva (Switzerland): WHO; 1998. [Google Scholar]
- 78. Foman SJ.. Nutrition of normal infants. St. Louis: Mosby; 1993. [Google Scholar]
- 79. González-Cossío T, Habicht JP, Rasmussen KM, Delgado HL.. Impact of food supplementation during lactation on breast-milk intake and on the proportion of infants exclusively breast-fed. J Nutr 1998;128:1692–702. [DOI] [PubMed] [Google Scholar]
Associated Data
This section collects any data citations, data availability statements, or supplementary materials included in this article.