

Abstract
Oxidative cleavage of docosahexaenoate (DHA) in retinal pigmented epithelial (RPE) cells produces 4-hydroxy-7- oxohept-5-enoic acid (HOHA) esters of 2-lysophosphatidylcholine (PC). HOHA-PC spontaneously releases a membrane- permeant HOHA lactone that modifies primary amino groups of proteins and ethanolamine phospholipids to produce 2-(ω-carboxyethyl)pyrrole (CEP) derivatives. CEPs have significant pathological relevance to age-related macular degeneration (AMD) including activation of CEP-specific T-cells leading to inflammatory Ml polarization of macrophages in the retina involved in “dry AMD” and TLR2-dependent induction of angiogenesis that characterizes “wet AMD”. RPE cells accumulate DHA from shed rod photoreceptor outer segments through phagocytosis and from plasma lipoproteins secreted by the liver through active uptake from the choriocapillaris. As a cell model of light-induced oxidative damage of DHA phospholipids in RPE cells, ARPE-19 cells were supplemented with DHA, with or without the lipofuscin fluorophore A2E. In this model, light exposure, in the absence of A2E, promoted the generation HOHA lactone-glutathione (GSH) adducts, depletion of intracellular GSH and a competing generation of CEPs. While DHA-rich RPE cells exhibit an inherent proclivity toward light-induced oxidative damage, photosensitization by A2E nearly doubled the amount of lipid oxidation and expanded the spectral range of photosensitivity to longer wavelengths. Exposure of ARPE-19 cells to 1 μM HOHA lactone for 24 h induced massive (50%) loss of lysosomal membrane integrity and caused loss of mitochondrial membrane potential. Using senescence-associated β-galactosidase (SA β-gal) staining that detects lysosomal β-galactosidase, we determined that exposure to HOHA lactone induces senescence in ARPE-19 cells. The present study shows that products of light-induced oxidative damage of DHA phospholipids in the absence of A2E can lead to RPE cell dysfunction. Therefore, their toxicity may be especially important in the early stages of AMD before RPE cells accumulate lipofuscin fluorophores.
Keywords: age-related macular degeneration, carboxyethylpyrrole, A2E, mitochondrial membrane potential, lipid oxidation, lysosome
1. Introduction
1.1. Photo-induced retinal damage contributes to RPE dysfunction and the pathogenesis AMD.
Age-related macular degeneration (AMD), a chronic, degenerative disorder in the maculae of the retina, is the leading cause of irreversible blindness among the elderly (Beatty et al., 2000; de Jong, 2006; Nowak, 2013; Wang et al., 2012). Although the pathogenesis of AMD is complex and remains poorly understood, the retinal pigment epithelium (RPE) is considered to be a primary site of AMD pathology (Wang et al., 2012; Yang et al., 2011). The RPE, a monolayer of cells interposed between the photoreceptors and the Bruch’s membrane-choroid complex, is critical for the maintenance and survival of the photoreceptors. RPE cell dysfunction and death play a vital role in the pathogenesis of AMD (Flores-Bellver et al., 2014; Wang et al., 2012; Yang et al., 2011). RPE cells accumulate aging pigments that aggregate as RPE lipofuscin that is associated with the progression of AMD (Delori et al., 2001; Holz et al., 1999a; von Ruckmann et al., 1997). Lipofuscin consists of a poorly characterized highly complex mixture of lipids, lipid-modified proteins, chromophores and fluorophores. Multiple studies reported progressive accumulation of lipofuscin in aging human retina (Rodriguez-Muela et al., 2013; Wolf, 2003), AMD (Gliem et al., 2016; Katz, 2002; Kliffen et al., 1997) and Stargardt disease (Ciccone et al., 2017; Dysli et al., 2016; Rozanowska and Sarna, 2005) with lipofuscin occupying as much as 19% of cell volume in macular RPE cells from octogenerian donors (Feeney-Burns et al., 1984; Rozanowska and Sarna, 2005). Nevertheless, clinical studies suggest that this accumulation is more likely a result, and not a cause of RPE cell death (Biarnes et al., 2015; Rudolf et al., 2013). Two mechanisms postulated for photochemical retinal damage are class I photooxidation, the Noell photodamage mechanism, which has an action spectrum resembling rhodopsin photolysis (Harwerth and Sperling, 1975; Noell, 1980; Noell et al., 1966; Reme, 2005) and class II photodamage (“blue light”), and the Ham mechanism (Ham et al., 1979; Ham et al., 1978; Ham et al., 1980) with the majority of photolysis occurring in RPE cells that may be related to lipofuscin photochemical changes.
1.2. Docosahexaenoyl phospholipids are targets of photooxidative damage in the retina.
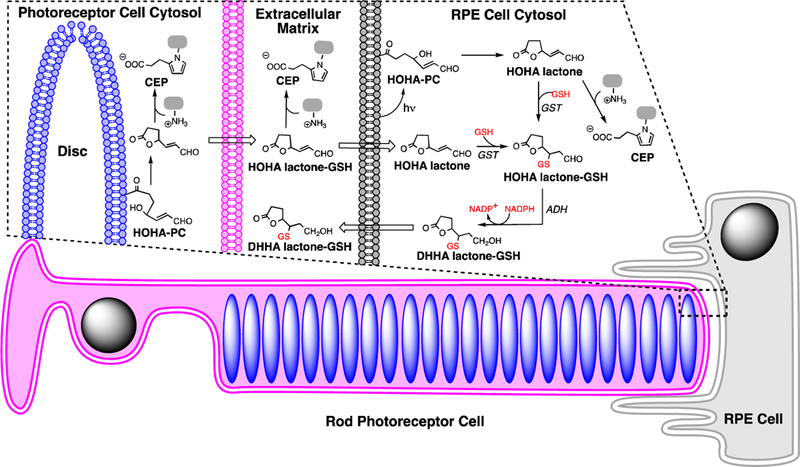
In the outer retina, the photoreceptor is enriched in DHA-containing phospholipids. Retina contains high levels of lipids that are highly susceptible to oxidation, with docosahexaenoate (DHA) accounting for more than 80% of polyunsaturated fatty acyls (PUFAs), mainly esterified into phospholipids in photoreceptor disk membranes (Beatty et al., 2000; Liang and Godley, 2003; Nowak, 2013; SanGiovanni and Chew, 2005). The retina is especially prone to the generation of reactive oxygen species (ROS) because it experiences high levels of oxygen consumption, cumulative irradiation within the visible sector of sunlight and contains an abundance of photosensitizers. DHA-containing phospholipids are highly susceptible to light-induced peroxidation. Active phagocytosis of photoreceptor outer segments by the RPE cells removes oxidatively damaged photoreceptor discs that accumulate in rod outer segment tips. Under physiological conditions, ROS are neutralized by enzymatic and non-enzymatic defence mechanisms. However, excess ROS production results in an imbalance between pro- and anti-oxidant processes, leading to oxidative stress (Hidalgo et al., 2001; Nowak, 2013). We previously identified a family of truncated phospholipids that are generated by myeloperoxidase- or copper ion-promoted free radical-induced oxidative cleavage of DHA- phosphatidylcholine (PC) in liposomes (Gu et al., 2003b). Primary products are a phospholipid aldehyde, the 4-hydroxy-7-oxohept-5-enoic acid (HOHA) ester of 2-lyso-phosphatidylcholine (HOHA-PC) and 4- hydroxyhex-2-enal (HHE). See Fig 1 for product structures and acronyms.
Fig. 1.
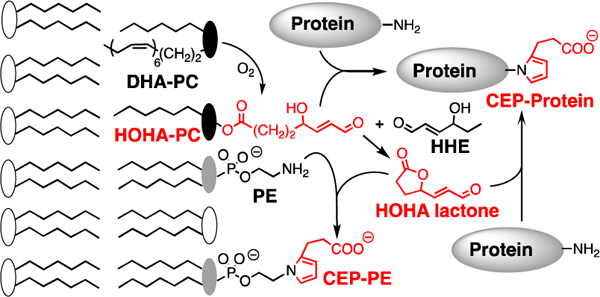
Oxidative cleavage of DHA-PC delivers HOHA-PC. HOHA lactone is released from bilayer phospholipid membranes by spontaneous intramolecular transesterification. Covalent adduction of HOHA-PC and HOHA lactone to primary amino groups of protein lysyl residues and phosphatidyl ethanolamines (PE) produces CEP derivatives.
HOHA-PC undergoes spontaneous deacylation to HOHA lactone (Fig. 1) (Choi et al., 2011). HOHA lactone is of special interest because it is a reactive membrane-penetrant molecule that can diffuse from photoreceptor disc membranes into RPE cells or into the vasculature. Covalent adduction of HOHA with primary amino groups of protein lysyl residues (Gu et al., 2003b) or ethanolamine phospholipids (Wang et al., 2014) generates 2-(ω-carboxyethyl)pyrrole (CEP) derivatives (Fig. 1). Elevated CEP and anti-CEP autoantibody levels are present in blood from AMD patients (Gu et al., 2009, 2010; Gu et al., 2003a). HOHA is generated and CEP accumulates mainly in two thin regions of the retina where DHA is concentrated, in photoreceptor disc membranes of photoreceptor outer segments and in RPE cells that endocytose the oxidatively damaged tips of those photoreceptor cells (Gu et al., 2003a). In vivo, exposure of rats to bright (~1200 lux; 200 microwatts/cm2) green light generates oxidatively-truncated DHA-derived phospholipids in their retinas with the level of HOHA-PC reaching 1.5 times that of residual DHA-PC after 1 h (Sun et al., 2006).
1.3. Generation of HOHA esters, their GSH adducts and CEP derivatives in cell free and RPE cell models.
Previously, we discovered that HOHA lactone, e.g., generated in oxidatively damaged photoreceptor discs, can diffuse through cell membranes into RPE cells where it is metabolized by conjugation with glutathione (GSH) producing HOHA lactone-GSH adducts (Wang et al., 2016). The present study, for the first time, demonstrated light-induced generation of HOHA lactone-GSH adducts in cell-free bovine retina extracts and then established two in vitro RPE cell models that exhibit light-induced generation of HOHA lactone-GSH adducts and CEP derivatives. Thus, upon photo-oxidative insult of RPE cells CEP formation competes with interception of HOHA intermediates by glutathionylation. In the retina, RPE cells can accumulate DHA from shed rod photoreceptor outer segments through phagocytosis and from plasma lipoproteins secreted by the liver through active uptake from the choriocapillaris (Kato et al.). By replacing oleic (18:1) phospholipids, unesterified DHA is gradually incorporated into RPE cell membranes through phospholipid turnover (Rodriguez de Turco et al., 1999). As a simple model system, to recapitulate the DHA-rich environment in the retina, we examined photo-induced oxidative damage of ARPE-19 cells whose membrane phospholipids were enriched in DHA by preincubation with unesterified DHA. We also examined the effect of doping the DHA-rich ARPE-19 cells with N-retinyl-N-retinylidene ethanolamine (A2E) (Sparrow et al., 2000), the first component of lipofuscin that has been structurally characterized (Eldred and Katz, 1988; Eldred and Lasky, 1993; Gaillard et al., 2004; Liu et al., 2000; Parish et al., 1998; Rozanowska and Sarna, 2005; Sparrow et al., 2002). Although we found that the presence of A2E approximately doubles the level of oxidative DHA damage as quantified by HOHA lactone-GSH adduct production, we also found that A2E is not required to photo-induce DHA oxidative damage in RPE cells leading to RPE dysfunction. Finally, we demonstrated the deleterious effects of exposure to HOHA lactone on RPE cell lysosomal membrane integrity and mitochondrial membrane potential, and found that HOHA lactone can cause senescence in RPE cells.
2. Materials and methods
2.1. Reagents
Dulbecco’s modified Eagle’s cell culture medium and Ham’s F12 cell culture medium F-12 (1:1 mixture, DMEM/F12), Dulbecco’s phosphate-buffered saline (DPBS), Hank’s balanced salt solution (HBSS), 3-(4,5- dimethylthiazol-2-yl)-2,5-diphenyltetrazolium bromide (MTT) were purchased from Fisher Scientific (Pittsburgh, PA). Fetal bovine serum (FBS) was from Equitech-Bio, Inc. (Kerrville, TX). Texas Red-X Goat anti-Rabbit IgG (H+L) cross-adsorbed secondary antibody (T-6391) was from ThermoFisher Scientific (Waltham, MA). Flash Phalloidin™ Green 488 was from Biolegend (San Diego, CA). β -NADPH and docosahexaenoic acid (DHA) were obtained from Cayman Chemical (Ann Arbor, MI). All other chemicals and reagents, including L-glutathione (reduced), glutathione reductase (250 units/mL), 5,5’-dithiobis(2- nitrobenzoic acid) (DTNB), and all-trans retinal were purchased from Sigma-Aldrich (St. Louis, MO). 4- Hydroxy-7-oxohept-5-enoic acid (HOHA) lactone (Wang et al., 2015), HOHA lactone-GSH, HOHA lactone- (glycine-13C2,15N)GSH, 4,7-dihydroxyhept-5-enoic acid (DHHA)-GSH, i.e., reduced HOHA lactone-GSH, and DHHA lactone-(glycine-13C2,15N)GSH were synthesized as described previously (Wang et al., 2016). MitoOct, MitoAzide, MitoClick, d30-MitoClick and Tet were synthesized as reported elsewhere (Logan et al., 2016). A polyclonal rabbit anti-CEP antibody was raised and characterized as described previously (Gu et al., 2003a). Bovine retina was obtained from InVision BioResources (Seattle, WA). The Pierce 660 nm assay was obtained from ThermoFisher Scientific (Waltham, MA) and used to determine a protein concentration in the lysates in accordance to the manufacture’s manual.
2.2. General methods
NMR spectra were acquired on a 500 MHz Bruker Ascend Avance III HDTM equipped with a Prodigy ultra-high sensitivity multinuclear broadband CryoProbe operating at 500 and 125 MHz for 1H and 13C, respectively. They were referenced internally according to residual solvent signals. All ESI mass spectra were obtained from a Thermo Finnigan LCQ Deca XP (ThermoFisher Scientific, Waltham, MA). Highperformance liquid chromatography (HPLC) was performed on a Shimadzu UFLC system equipped with a 5 μm Phenomenex Luna C-18 column (Torrance, CA). Flash column chromatography was performed on 230-400 mesh silica gel supplied by Sigma-Aldrich (St. Louis, MO) with ACS grade solvent. Rf values are quoted for plates with thickness of 0.25 mm. The plates were visualized with iodine, UV, and phosphomolybdic acid reagents. All reactions were carried out under an argon atmosphere. All reagents were obtained commercially unless otherwise noted. Reactions were performed using glassware that was oven- dried at 120 °C. Air- and moisture sensitive liquids and solutions were transferred via syringe or stainless- steel cannula.
2.3. Cell culture
The cell line ARPE-19 (ATCC; CRL-2302) derived from spontaneously arising retinal pigment epithelia of a healthy person (Naggar et al., 2005) was obtained from the American Type Culture Collection (Manassas, VA). The stock cells were grown on 100-mm dishes in a humidified CO2 incubator at 37 °C and 5% CO2 in Ham’s F12 medium and Dulbecco’s modified Eagle’s medium (DMEM) (50:50 ratio), containing L-glutamine and 10% heat-inactivated FBS. Cells were trypsinized and passaged every 2-3 days. Cell passages 20-30 were used.
2.4. Microscopy
Images were collected on a Leica DMI 6000B inverted fluorescence microscope (Leica Microsystems, Wetzlar, Germany) using a Retiga EXI camera (QImaging, Vancouver, British Columbia). Image analysis was performed using MetaMorph Imaging Software (Molecular Devices, Downington, PA).
2.5. Synthesis
The synthesis of A2E was performed according to the previous report (Parish et al., 1998). In brief, A2E was synthesized by combining all-trans retinal (100 mg, 2 equiv) and ethanolamine (7 mg, 1 equiv) in ethanol (10 mL) solution with 9.3 μL of acetic acid (1 equiv). The reaction mixture was allowed to stir for 3 days at room temperature in the dark. At the end of the reaction, the mixture was concentrated on a rotary evaporator, the residue was purified by silica gel column chromatography running with methanol (MeOH):dichloromethane (CH2Cl2) (5:95) as eluent, further elution with MeOH:CH2Cl2:trifluoroacetic acid (TFA) (8:92:0.001) and then the fractions containing the bulk of the crude A2E were combined and further purified by HPLC (Luna C18, 4.6 × 150 mm, 85-96% H2O/MeOH + 0.1% TFA for 20 min, 1.0 ml/min flow, monitor wavelength: 430 nm).
2.6. Irradiation of bovine retina extract
Two bovine retinas were homogenized in 10 mM pH 7.4 sodium phosphate buffer (1 mL) on ice for 1 min and the resulting homogenate was centrifuged (14,000 g, 10 min, 4 °C). The supernatant was transferred to a 1.5 mL microcentrifuge tube and centrifuged again (14,000 g, 10 min, 4 °C). The last supernatant was used for irradiation after dilution to a protein concentration of 2 mg/mL. 3 mL this retina extract was transferred to a quartz cuvette resting on ice and irradiated 10 cm from the light sources in a UV Stratalinker 1800 equipped with a bank of either five black (1 mW/cm2; F8T5/BL, wavelength range 350~400 nm peak wavelength 365 nm), warm white (7 mW/cm2; F8T5/WW, 3000K, wavelength range 400~700 nm, peak wavelength 400, 430, 480, 530, 590, 680 nm) or cool white (5 mW/cm2; F8T5/CW, 4100K, wavelength range 400~700 nm, peak wavelength 400, 430, 480, 530, 590, 680 nm) light tubes. Aliquots (300 μL) of the reaction mixture were withdrawn at each time point and incubated in the dark at 23 °C for 1 h before snap- freezing on dry ice.
2.7. Irradiation of ARPE-19 cells
ARPE-19 cells (75,000 or 200,000 cells/dish) were seeded in a 35 mm or 60 mm dish in 2 or 3 mL of complete DMEM/F12 cell culture medium supplemented with 10% FBS, respectively, and allowed to attach to the cell culture plates in a humidified CO2 incubator at 37 °C and 5% CO2. After 3 days of incubation, the cells were incubated with 1.5 mL or 2 mL of complete DMEM/F12 cell culture medium supplemented with 10% FBS containing 50 μg/mL DHA for another 2 days followed by incubation with 10 μM A2E in basal DMEM/F12 cell culture medium for 24 h under dimmed light conditions. The cells were starved in fresh basal DMEM/F12 cell culture medium for another 24 h before being irradiated as described above for various times in 1 mL or 2 mL HBSS, respectively.
2.8. HOHA lactone treatment
As described previously (Wang et al., 2015), ARPE-19 cells (10,000 cells/ per well) were seeded into a 96-well flat bottom plate in 200 μL of complete DMEM/F12 medium supplemented with 10% FBS and allowed to attach to culture plates in a humidified CO2 incubator at 37 °C and 5% CO2. After the cells reached ~80% confluence, they were starved in 200 μL of basal DMEM/F12 cell culture medium for 4-5 h. Then the cell culture medium was aspirated followed by the addition of DMEM/F12 (180 μL) and 10x solutions of HOHA lactone in DPBS (20 μL) were added to create 0 to 40 μM final concentrations of HOHA lactone, in 6 replicate wells for each concentration, followed by 24 h incubation in a humidified CO2 incubator at 37 °C and 5% CO2.
2.9. MTT cell viability assays
After treatment with HOHA lactone or irradiation, the cell culture medium was aspirated from each well and the cells were incubated for 2 h at 37 °C with 10x solution of filter-sterilized MTT solution (5 mg/mL in DPBS) into the medium. The medium was then aspirated from each well, dimethyl sulfoxide (DMSO) was added to each well (200 μL for a 96 well plate or 1.5 mL for a 35 mm dish) to dissolve water-insoluble intracellular formazan crystals by carefully pipetting the contents of the wells. The optical density (OD) of formazan solutions at λ = 540 nm were measured with a plate reader (Spectramax M2, Molecular Devices, San Jose, CA) with a reference wavelength set λ = 670 nm.
2.10. Resazurin (Alamar Blue) cell viability assay (Anoopkumar-Dukie et al, 2005)
ARPE-19 cells (10,000 cells/ per well) were seeded in a 96-well flat bottom plate in 200 μL of complete DMEM/F12 cell culture medium supplemented with 10% FBS and allowed to attach to culture plates in a humidified CO2 incubator at 37 °C and 5% CO2. Once the cells reached ~80% confluence, they were starved in 200 μL of basal DMEM/F12 cell culture medium for 4-5 h. The cell culture medium was then aspirated followed by the addition of 180 μL of DMEM/F12 and 20 μL of 10x stock solutions of HOHA lactone in DPBS to create 0 to 40 μM final concentrations of HOHA lactone (6 replicate wells for each concentration) followed by 24 h incubation in a humidified CO2 incubator at 37 °C and 5% CO2. The medium was aspirated from each well and the cells were incubated for 4 h at 37 °C with a mixture of 10 μL of filter-sterilized Resazurin stock solution (440 μM in DPBS) with 90 μL of DMEM/F12 cell culture medium. Fluorescence was finally measured by a fluorescence microplate reader (Spectramax M2, Molecular Device) set at λEx/Em = 545/595 nm
2.10. Mitochondrial membrane potential measurement
2.10.1. JC-10 assay (Li et al., 2016; Pietila et al., 2012)
The assay was performed by the method described previously (Li et al., 2016) with slight modifications. Briefly, after HOHA lactone treatment or 24 h after the execution of the standard light exposure model protocol described above, to ARPE-19 cells in a 96-well flat bottom plate in 100 μL of basal DMEM/F12 cell culture medium was added 100 μL of 5 μg/mL stock solutions of JC-10 in DPBS to establish 2.5 μg/mL final concentrations of JC-10. After subsequent incubation in a humidified CO2 incubator for 30 min at 37 °C and 5% CO2, the fluorescence was immediately measured with a fluorescence microplate reader (Spectramax M2, Molecular Device) set at λEx/Em = 490/525 nm (cut off at 515 nm) for the green monomer and 540/590 nm (cut off at 570 nm) for the red aggregate. Changes in mitochondrial membrane potential were derived from the green/red fluorescence ratio.
2.10.2. MitoClick assay
The assay was performed using a previously described method (Logan et al., 2016) with slight modifications. Briefly, after HOHA lactone treatment or 24 h after the execution of standard light exposure model protocol, to ARPE-19 cells in a 60 mm dish in 2 mL of basal DMEM/F12 cell culture medium was added MitoOct and MitoAzide both to 5 μM final concentration followed by 3 h incubation in a humidified CO2 incubator at 37 °C and 5% CO2. After a cell culture medium aspiration, 1 mL of 50 μM 3-phenyl- 1,2,4,5-tetrazine (Tet) in DPBS was added to each dish followed by incubation for 5 min at 23 °C followed by washing with 1 mL DPBS. The cells were then scraped into a 1.5 mL microcentrifuge tube and pelleted by centrifugation (16,000 g, 3 min, 4 °C). The supernatant was discarded and the pellet was snap-frozen on dry ice. For analysis, the pellet was resuspended in 250 μL of 100% acetonitrile (ACN) with 0.1% formic acid (FA) and 50 μM Tet, spiked with 50 pmol of d30-MitoClick and the mixture was water-sonicated for 5 min. After the sample was carefully vortexed for 2 min and centrifuged (16,000 g, 15 min, 4 °C), the resulting solution was filtered into a fresh tube and 200 μL of each sample was transferred to another fresh tube and dried by Speed Vac. The sample was then resuspended in 200 μL of 20% ACN with 0.1% FA, sonicated for 5 min, vortexed for 1 min and centrifuged (16,000 g, 10 min, 4 °C). The supernatant was transferred to a fresh tube and diluted 10 times with 20% ACN with 0.1% FA before LC-MS/MS analysis. The LC-MS/MS system for the analysis consisted of a Thermo Finnigan LCQ Deca XP with a Surveyor LC system. Liquid chromatography was performed using a Luna 5 μ Phenyl-Hexyl column (1 × 50 mm, 5 μm) with a Phenyl-Hexyl guard column (2 × 4 mm) (both from Phenomenex). The mobile phase consisted of 0.1% FA in water (buffer A) and 95% ACN/0.1% FA (buffer B) delivered as a linear gradient as follows: 0-2 min, 5% B; 2-3 min, 5-25% B; 3-5 min, 25-75% B; 5-7 min, 75-100% B; 7-10 min 100% B; 10-12 min, 100-5% B; 12-20 min, 5% B. The flow rate was 50 μL/min and a 10 μL volume was injected. Electrospray ionization mass spectrometry in the positive ion mode was employed to measure MitoClick product. The instrument parameters were as follows: the heated capillary temperature was 300 °C, the source voltage 4.5 kV, and the capillary voltage 11.00 V. Nitrogen was used as sheath and auxiliary gas. All data were processed with the Qual browser in Xcalibur software. MS/MS experiments were performed by selecting an ion with an isolation width of 2 m/z. See Table S1 for detailed mass spectrometer parameters and collision energy for each ion. The changes in mitochondrial membrane potential were calculated using a MitoClick calibration curve built from authentic and labeled standard and normalized by the total protein concentration of the precipitated protein obtained from acetonitrile extraction.
2.11. Quantification of Total Intracellular GSH in ARPE-19 Cells (Rahman et al., 2006)
The assay was performed using the method described previously (Rahman et al., 2006). Aliquots (20 μL) of ARPE cell lysates from light irradiation time-course studies were assayed to determine total intracellular GSH levels using a 96-well microplate format described earlier (Rahman et al., 2006). In these experiments, all of the reagents were prepared in 0.1 M potassium phosphate buffer with 5 mM EDTA disodium salt, pH 705 (KPE buffer). Briefly, 20 μL of KPE buffer, GSH standards, or samples were added to the respective microplate wells, followed by the addition of 120 μL of a freshly prepared 1:1 mixture of DTNB (2 mg/3 mL) and glutathione reductase (10 U/3 mL). Then, 60 μL of NADPH (2 mg/3 mL) was added and the plate was mixed well. The absorbance was read immediately at λ = 412 nm in a microplate reader (Spectramax M2, Molecular Devices). Measurements were taken every 20 s for 5 min (15 readings in total from 0-300 s). The total GSH concentration in the samples was determined by linear regression to calculate the values obtained from a standard curve.
2.12. Measurement of cell senescence associated β-galactosidase activity assay
The assay was performed using the method described previously (Debacq-Chainiaux et al., 2009). ARPE- 19 cells (4.5 × 10⁴ cells/ per well) were plated on an 8-chamber well (Lab-Tek II Chamber Slide System, Nunc, Rochester, NY) in DEME/F12 with 10% FBS and incubated at 37 °C and 5% CO2. On the following day, the cells were starved in basal DMEM/F12 medium for 12-16 h and then were treated with 5 μM HOHA lactone every 12 h once, twice or 3 times. After HOHA lactone treatments, the cells were incubated in the DEME/F12 with 1%FBS for 5 days (total treatment time: 7 days). After the chambers were aspirated and washed twice with DPBS, the cells were fixed with 3% formaldehyde in DPBS for 5 min. After washing twice with DPBS, the cells were incubated at 37 °C without CO2 overnight in staining solution (40 mM citric acid/pH 6.0 sodium phosphate buffer, 1 mg/mL 5-bromo-4-chloro-3-indolyl- β -D-galacto-pyranoside (X- gal), 5 mM potassium ferrocyanide, 5 mM ferricyanide, 150 mM sodium chloride, and 2 mM magnesium chloride). All images were acquired with a Leica DMI 6000 B inverted fluorescent microscope under bright field and phase contrast combined mode using a Retiga EXI camera. The images were taken at 10x and 20x magnification. Image analysis was performed using ImageJ software and 10x images were used for quantitation of staining area.
2.13. Acridine Orange staining of ARPE-19 cells
ARPE-19 cells (7,500 cells/ per well) were plated on an 8-chamber well (Lab-Tek II Chamber Slide System, Nunc, Rochester, NY) in DEME/F12 with 10% FBS and then incubated at 37 °C in 5% CO2 for three days until they reach 70-75% confluence. They were then starved in basal DMEM/F12 medium for 12-16 h and the basal DMEM/F12 medium was then changed to Phenol Red-free medium immediately prior to HOHA lactone treatment. After incubation with 0-10 μM HOHA lactone for 24 h, the medium was replaced with 1 μg/mL acridine orange in DMEM/F12 basal medium. After incubation at 37 °C in 5% CO2 for 30 min, the chambers were aspirated and washed twice with DPBS. The cells were fixed with 3% formaldehyde in DPBS for 15 min. After washing twice with DPBS, slides were mounted in DAPI Fluoromount-G (Southern Biotech, Birmingham, AL). All images were acquired with a Leica DMI 6000 B inverted fluorescence microscope using a Retiga EXI camera. An FITC filter set was used for green fluorescence and a TX-red filter set for red fluorescence. Images were taken at 10x magnification.
2.14. Detection of CEP in ARPE-19 cells
ARPE-19 cells (1 × 10⁴ cells/ per well) were plated on an 8-chamber well (Lab-Tek II Chamber Slide System, Nunc, Rochester, NY) in the DEME/F12 with 10% FBS and incubated at 37 °C in 5% CO2 for three days. After 10 μM HOHA lactone treatment or 24 h after the execution of the standard light exposure model protocol, the chambers were aspirated and washed twice with DPBS. The cells were fixed with cold acetone (−20 °C) for 12 min at −25 °C. After washing with PBST 3 times, the slides were blocked with 3% BSA in PBST for 1 h at 23 °C. The cells were probed with rabbit anti-CEP polyclonal antibody (in 3% BSA in PBST,18 ng/mL) overnight at 4 °C, and washed exhaustively with PBST the next day. The slides were treated with Texas Red-X goat anti-rabbit antibody (1:100 dilution in 3% BSA in PBST; T-6391, ThermoFisher Scientific, Waltham, MA) overnight at 4 °C, washed exhaustively with PBST and then aspirated. The slides were further incubated with 1:20 diluted in PBS stock solution of Flash Phalloidin™ Green 488 (Biolegend, 0.2 U/μL) in the dark for 30 min at 23 °C protected from light. After washing with PBST, slides were mounted in DAPI Fluoromount-G (Southern Biotech, Birmingham, AL). All images were acquired with a Leica DMI 6000 B inverted fluorescent microscope using a Retiga EXI camera. Image analysis was performed using Metamorph imaging software (Molecular Devices, Downington, PA). The images were taken at 20x magnification.
2.15. HOHA lactone GSH adduct extraction and quantitation by LC-MS/MS
2.15.1. From bovine retina extract
To an aliquot (300 μL) of light exposed retina extract or an aliquot of retina extract kept in the dark, was added dichloromethane (225 μL), methanol (300 μL) spiked with 250 fmol of isotopically labeled HOHA lactone-GSH and labeled DHHA lactone-GSH. The mixture was vortexed vigorously for 1 min and then centrifuged (9,000 g, 10 min, 4 °C). The upper aqueous layer of the resulting three layers (aqueous/protein/DCM) was collected in a 1.5 mL Eppindorff LoBind tube (Fisher Scientific, Pittsburgh, PA), and to the remaining layers were then added 250 μL of 0.2% FA/H2O. The mixture was vortexed and then centrifuged (9,000 g, 10 min, 4 °C). The new upper aqueous layer was combined with the first aqueous layer, and dried to ~50 μL by SpeedVac. The dried sample was resuspended in 600μL with 0.2%FA/H2O, sonicated 10 min, vortexed for 1 min and then loaded onto the first solid phase extraction (SPE) column: Strata X-C spin column, spin column (Nest group Inc., Southborough, MA) packed with 30 mg of Strata XC material (Phenomenex, Torrance, CA). See Table S2 for SPE purification workflow.
The eluates from the Strata X-C spin column were combined and diluted 4 times with 0.2% FA/H2O before loading onto the second SPE column, a Hypercarb cartridge (50 mg/1 mL, ThermoFisher Scientific, Waltham, MA). See Table S3 for SPE purification workflow.
The Hypercarb SPE eluate was dried to ~50 μL by SpeedVac and then reconstituted to 180 μL with 0.2%FA/H2O before LC-MS/MS injection. Chromatographic separation was achieved with a Waters Acquity UPLC system (Waters, Milford, MA) equipped with a Hypercarb column (1.0 mm i.d. * 100 mm length, 3 μm, ThermoFisher Scientific, Waltham, MA). Mobile phase A consisted of HPLC grade water containing 0.2% FA. Mobile phase B was HPLC grade acetonitrile containing 0.2% FA. Injection volume was 75 μL (PLNO, partial loop with needle overfill). The total run time was 40 min, the flow rate was 40 μL/min during elution and the linear elution gradient was from 5% to 95% solvent B in 9 min (see Table S4 for details).
The analytes were detected with an API 3000 triple quadrupole electrospray mass spectrometer (AB Sciex, Framingham, MA) operated in the positive ion mode in the multiple reaction monitoring (MRM) scan mode. The source temperature was maintained at 300 °C, the heating gas (N2) was maintained at 3.5 L/min, nebulizer gas was set at 10, curtain gas was set at 10 and CAD was set at 8. Optimized parameters for detecting each analyte were determined using authentic samples. MS scans time was set at 100 msec for one cycle. The optimum collision energy and other parameters were determined for each individual analyte (see Table S5 for details).
2.15.2. From ARPE-19 cells
After one hour irradiation followed by one hour incubation in a humidified CO2 incubator at 37 °C and 5% CO2, the cells were scraped into a 5 mL Eppendorf tube and centrifuged (1000 RPM, TX-400 rotor, 4 °C, 5 min), the supernatant (extracellular medium, 2 mL) was loaded onto a Strata X-33u SPE cartridge (Phenomenex). See Table S6 for SPE purification workflow. The Strata X-33u SPE eluent was dried to ~10 μL on a Speedvac and was reconstituted to 200 μL with 0.2% FA/H2O before LC-MS/MS injection.
Chromatographic separation was carried out with a Surveyor LC system equipped with a Hypersil GOLD C18 column (2.0 mm i.d. x 150 mm length, 5 μm, ThermoFisher Scientific, Waltham, MA). Mobile phase A consisted of HPLC grade water containing 0.1% FA. Mobile phase B was HPLC grade acetonitrile containing 0.1% FA. ESI mass spectrometry was performed with a Thermo Finnigan LCQ Deca XP instrument in the positive ion mode using nitrogen as the sheath and auxiliary gas. The heated capillary temperature was 300 °C, the source voltage was 5 kV, and the capillary voltage was 11.00 V. All data were processed with the Qual browser in Xcalibur software (ThermoFisher Scientific, Waltham, MA). For analysis of HOHA lactone-GSH or DHHA lactone-GSH, the injection volume was 50 μL, the total run time was 29 min, the flow rate was 200 μL/min and linear gradient used for elution was from 5% to 95% solvent B in 9 min (see Table S7 for details). MS/MS experiments were performed by selecting an ion with an isolation width of 2 m/z. See T able S8 for detailed mass spectrometer parameters and collision energy for each ion.
2.16. Statistical Analysis
Unless specified in the text or legends, comparisons were made using one-way ANOVA followed by Holm-Sidak’s post-hoc multiple comparison test. If the normality test failed (Fig. 6C and Fig. 15), the Dunn’s rank test was used. Statistical significance is shown as follows: *, p < 0.05; **, p < 0.01; ***, p < 0.001. Data are presented as mean ± standard deviation (SD).
Fig. 6.
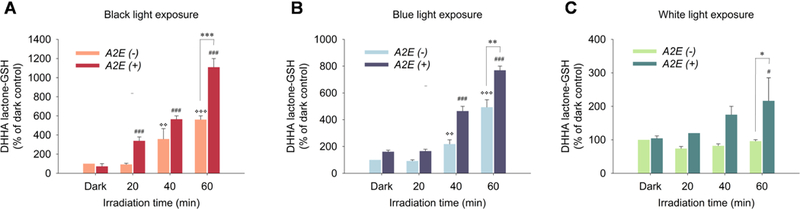
Generation of DHHA lactone-GSH upon exposure to black light (Panel A), blue light (Panel B) or white light (Panel C) in ARPE-19 cells (A2E(−)) pre-incubated with 50 μg/mL DHA for 48 h or cells (A2E(+)) pre-incubated with DHA for 48 h followed by 10 A2E for 24 h with 24 h recovery in basal medium. Levels of GSH derivatives were determined by LC-MS/MS. The adduct MRM transition monitored for DHHA lactone-GSH was 450.1→321.1. The data are presented as mean ± SD, n = 3. Student’s t-test: *-P˂0.05, **- P˂0.01, ***- P˂0.001,*> = significant difference from A2E(−)/dark control; # = significant difference from A2E(+)/dark control.
Fig. 15.
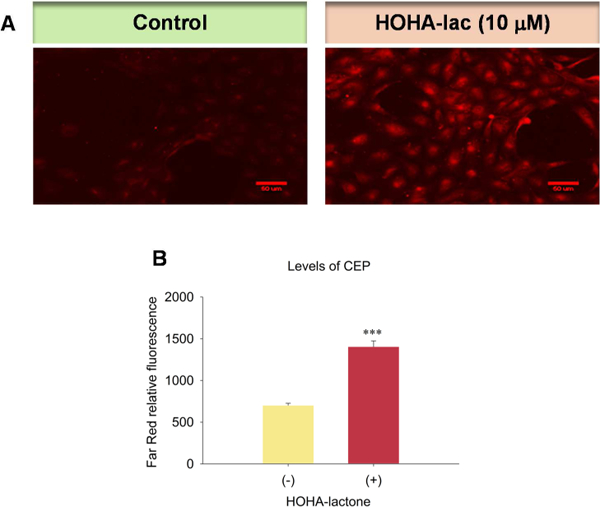
Generation of CEP in ARPE-19 cells upon exposure to HOHA lactone. Panel A: Images revealing the generation of CEP in ARPE-19 cells (Left: Control; Right: cells exposed to 10 μM HOHA lactone). Panel B: Quantification of the levels of CEP in ARPE-19 cells. ARPE-19 cells were exposed to 10 μM HOHA lactone for 24 h and then immunostained with rabbit anti-CEP polyclonal antibody/goat anti-rabbit Texas Red-X antibodies. The figure is representative of two independent experiments that showed very similar results. Student’s t-test: ***- P˂0.001.
3. Results
3.1. HOHA/DHHA lactone-GSH adducts are generated in bovine retina extract exposed to UVA
As a cell-free model of light-induced oxidative retinal damage, we irradiated bovine retina extracts in phosphate buffer with light sources emitting black light (1 mW/cm2), warm white light (7 mW/cm2) and cool white light (5 mW/cm2), respectively for one hour at room temperature. Two derivatives of HOHA lactone were detected. The first product was HOHA lactone-GSH that was quantified by quadrupole LC-MS/MS (448.1→301.1 as quantifier, 448.1→319.1 as qualifier) (Fig. 2A and 2A’). The second product was the reduced HOHA lactone-GSH adduct, DHHA lactone-GSH, (450.1→286.1 as quantifier, 450.1→373.1 as qualifier) (Fig 2B and 2B’) using isotope-labeled internal standard (glycine-13C2,15N)-GSH derivatives; MW increase = +3 au). There is an exponential increase in the formation of both HOHA lactone derivatives (Fig. 2C) with respect to the duration of irradiation. After one hour of light exposure at room temperature (23 °C, black light, 365nm), the levels of HOHA lactone-GSH and DHHA lactone-GSH reached a total 3057 ± 284 fmol/mg protein.
Fig. 2.
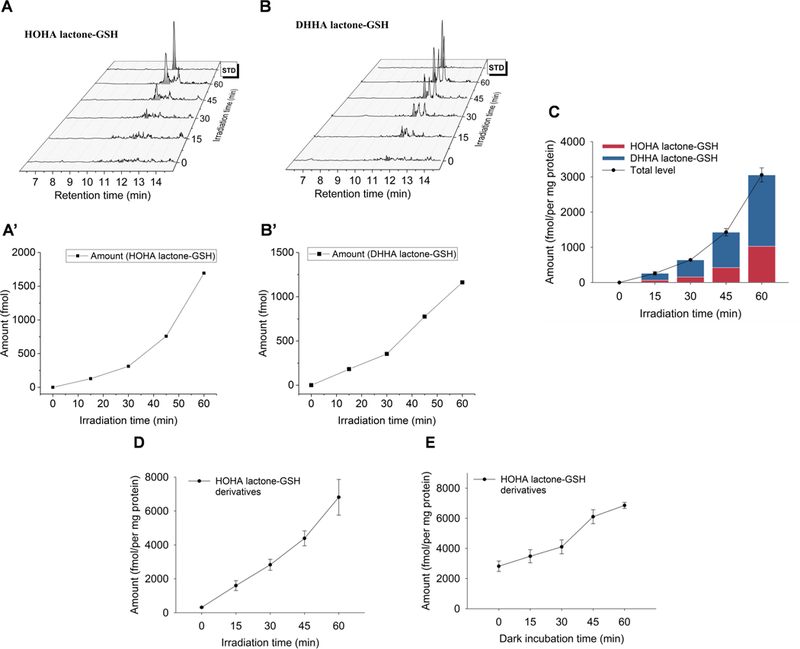
Time-course of the formation of HOHA lactone GSH derivatives: aldehyde (HOHA lactone-GSH, Panel A) and alcohol (DHHA lactone-GSH, Panel B) in bovine retina extracts as the result of black light (UV) exposure determined by LC-MS/MS. The MRM transition in the Panel A for the HOHA lactone-GSH is 448.1→301.1 and the MRM transition in Panel B for the DHHA lactone-GSH is 450.1→321.1. Fig. 2A’ and Fig. 2B’ show the levels of HOHA lactone-GSH and DHHA lactone-GSH in the Fig.2A and Fig.2B time- course experiments, respectively. Panel C shows the accumulation of HOHA lactone-GSH (blue) and DHHA lactone-GSH (red) in bovine retina extract as the result of light exposure. Panel D: irradiation time dependence of total GSH derivative (HOHA lactone-GSH plus DHHA lactone-GSH) production after UV treatment for various time periods at 0 °C followed by 1 h incubation at 23 °C; Panel E: post irradiation incubation time dependence of total GSH derivative (HOHA lactone-GSH plus DHHA lactone-GSH) production after irradiation at 0 °C for 1 h followed by various periods of incubation at 23 °C. The data are presented as mean ± SD, n = 3 (three independent experiments).
We expected that light-induced oxidative damage of DHA-rich retina phospholipids would produce HOHA-containing phospholipids (Fig. 3). Our previous findings that HOHA-PC undergoes spontaneous deacylation to HOHA lactone (Choi et al., 2011) and that HOHA lactone is metabolized by conjugation with GSH (Wang et al., 2016), suggested that oxidative damage of DHA-phospholipids in retina extracts would produce HOHA lactone-GSH derivatives. We now find an irradiation time-dependent increase in the formation of HOHA lactone-GSH derivatives when retina extracts are irradiated at 0 °C for 0 to 1 h followed by incubation for 1 h in the dark at 23 °C (Fig. 4, Panel A). We also observed a time-dependent increase in HOHA lactone-GSH derivative levels during incubation in the dark after irradiation at 0 °C for 1 h (Fig. 4, Panel B).
Fig. 3.
Photogeneration of HOHA-PC from DHA-PC is followed by release of HOHA lactone. HOHA lactone-GSH adduct is generated by glutathionylation of HOHA lactone. NADPH-dependent reduction of the HOHA lactone-GSH adduct delivers the reduced GSH adduct, DHHA lactone-GSH, that is also produced by RPE cells exposed to HOHA lactone, e.g., that may be released by oxidatively damaged photoreceptor cells.
Fig. 4.
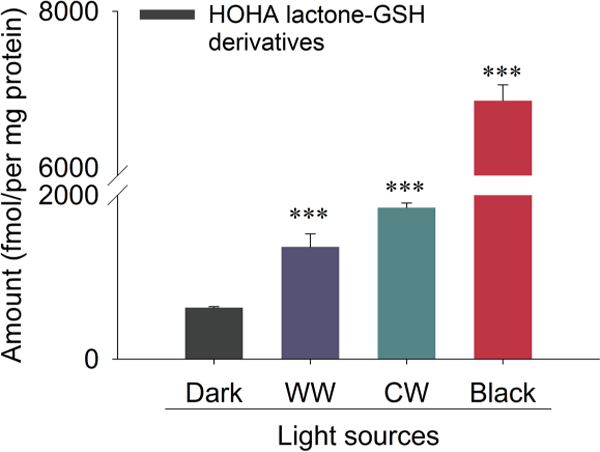
Quantitative LC-MS/MS analysis of HOHA lactone GSH derivatives (HOHA lactone-GSH plus DHHA lactone-GSH) production induced in bovine retina extracts by light sources of various wavelengths. (The adduct MRM transition for the HOHA lactone-GSH is 448.1→301.1 and the MRM transition for the DHHA lactone-GSH is 450.1μ321.1). The data are presented as mean ± SD, n = 3. Student’s t-test: ***- P<0.001
UV light is especially effective in promoting oxidative damage of retinal lipids in bovine retina extracts (Fig. 4). We also found that even ambient light can induce oxidative damage of DHA-containing phospholipids in retina extracts resulting in the formation of HOHA lactone-GSH adducts. Exposure of bovine retina extracts to 400 ~ 700 nm wavelength light sources (warm white and cool white light) present in ambient indoor lighting induced the formation of HOHA lactone-GSH derivatives even at low light fluencies (total GSH derivatives: 1354 ± 159 fmol /mg protein for warm white light; 1854 ± 58 fmol/mg protein for cool white light; 623 ± 12 fmol/mg protein for dark control (Fig. 4). Although visible light caused less oxidative damage than UV light, chronic exposure to ambient indoor lighting can damage retinal lipids. Addition of NADPH cofactor to retina extracts after irradiation caused the ratio of the reduced to unreduced HOHA lactone-GSH adduct to increase approximately two-fold (data not shown), implicating the involvement of aldo-ketose reductase catalysis (Alary et al., 2003), e.g., by aldose reductase (Dixit et al., 2000) or alcohol dehydrogenase, in the formation of the reduced adduct DHHA lactone-GSH.
3.2. Light induces the generation of DHHA lactone-GSH in ARPE-19 cells supplemented with DHA ± A2E.
Our previous demonstration that UV irradiation of DHA-PC liposomes results in the generation of HOHA-PC (Sun et al., 2006) led us to anticipate that RPE cells enriched in DHA phospholipids would also yield HOHA phospholipids, HOHA lactone and its GSH derivatives. A2E is a pyridinium bisretinoid component of lipofuscin (Ben-Shabat et al., 2002) that accumulates with age in the RPE, absorbs light and serves as a light-responsive sensitizer (Winkler et al., 1999). Previously, irradiation of ARPE-19 cells doped with physiological concentrations of A2E with blue light was shown to induce oxidative stress, i.e., production of H2O2, O2- and 1O2 (Marie et al., 2018; Sparrow et al., 2010), and caused downregulation of the ROS-detoxifying enzymes SOD2 and catalase concomitant with the increase in GSSG levels (Marie et al., 2018). Therefore, in a second cell model, to promote light-induced oxidative damage, after loading with DHA and prior to light exposure, we supplemented DHA-rich ARPE-19 cells with A2E. Loading of RPE cells with A2E (Fig. 5) by the procedure we employed results in accumulation of intracellular granules, detectable by fluorescence confocal imaging, that colocalize with lysosomes (Sparrow et al., 1999). The levels of A2E accumulating in cells incubated with 10 to 25 μM A2E are comparable to the amounts present in equal numbers of RPE cells harvested from human eyes. Because A2E can act as an amphiphilic detergent that perturbs membrane integrity and concentration-dependent membrane leakage (Sparrow et al., 1999), after incubation for 24 h with A2E, extracellular A2E was removed and the cells were extensively washed with warm basal DMEM/F12 cell culture medium. Previous studies demonstrated that incubation with 10 - 25μM A2E achieves cell-associated levels that approximate the A2E levels (34 - 134 ng/105 cells) measured in human RPE isolated from healthy donor eyes (Sparrow et al., 1999). The DHA/A2E laden cells were finally given one day of quiescence before light exposure to allow recovery of the cell membrane in surviving cells and the attrition of any membrane-damaged cells (see Scheme 1 in Section 2.7 above).
Fig. 5.
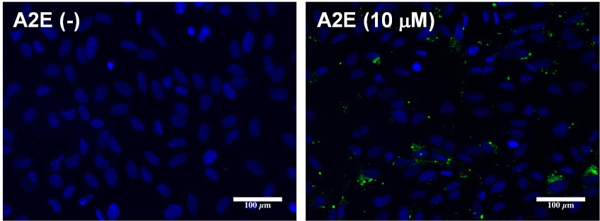
Internalization of A2E: representative images showing green A2E autofluorescence in ARPE-19 cells preloaded 24 h with A2E.
Scheme 1.
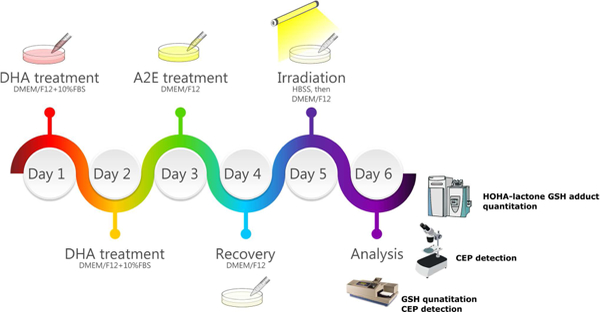
The work-flow of the ARPE-19 cell light damage model.
To determine the wavelength dependence of light-induced oxidative damage in our RPE cell models, we used three different light sources: black light (1 mW/cm2), blue light (3 mW/cm2) and cool-white light (5 mW/cm2) to induce oxidative stress in ARPE-19 cells (Fig. 6). Both black light (365nm) and blue light (430nm) caused an irradiation time-dependent increase of DHHA lactone-GSH in ARPE-19 cells supplemented only with DHA. Cells supplemented with both DHA and A2E underwent a significantly greater increase of DHHA lactone-GSH compared to DHA-rich cells that do not contain A2E. A 10-fold increase of DHHA lactone-GSH after 1 h black light exposure and 7-fold increase after 1h blue light exposure in A2E-laden cells compared to dark control groups. White light exposure also caused an increase of the DHHA lactone-GSH but to a somewhat lesser extent than black or blue light irradiation of A2E-laden RPE cells (2-fold increase after 1h irradiation) but not in cells not supplemented with A2E. Cells not supplemented with A2E exhibited a greater than 400% of dark control level of DHHA lactone-GSH with blue light but no increase over the dark control level with white light. Thus, the blue light component of white light did not make a detectable contribution to DHA oxidation. On the other hand, ARPE-19 cells supplemented with DHA respond to higher wavelength UVA or visible light with oxidative damage of DHA and the response is enhanced by the presence of A2E. Although ambient white light does not induce DHA oxidation in the absence of A2E, the presence of this sensitizer confers susceptibility to ambient white light- induced oxidative stress in RPE cells, e.g., containing lipofuscin. Consequently, the light-induced generation of HOHA-PC and HOHA lactone from DHA phospholipids is expected in all individuals, i.e., not only those sensitive to UV but also those exposed to visible light. The age-related accumulation of A2E in lipofuscin granules in RPE cells is expected to exacerbate but not be essential for the production of HOHA lactone and its GSH adducts and CEP derivatives.
3.3. Light exposure decreases GSH levels in DHA-rich A2E-laden ARPE-19 cells
The GSH level in DHA-rich A2E-laden ARPE-19 cells was assessed immediately after exposure to blue light. Irradiation for only 10 min caused a massive (80%) depletion of the GSH level, from 49 ± 2 nmol/mg protein to 10 ± 1 nmol/mg protein, and a 90% decrease to 7 ± 2 nmol/mg protein was detected after 20 min. The GSH level did not decrease further and recovered slightly to 11 nmol/mg protein and greatly after 40 min to 37 nmol/mg protein after 60 min (Fig. 7A). The decrease of GSH level inversely correlates with the generation of HOHA lactone-GSH adduct. Thus, GSH is consumed to detoxify electrophilic lipid oxidation products, e.g., HOHA lactone and probably other unsaturated aldehydic degradation products of ω−6 and ω−3 PUFAs (Csallany et al., 2000; Sadhukhan et al., 2014) generated upon irradiation. We also found that the GSH level in DHA-rich cells not supplemented with A2E showed a similar decrease after 10 min, but recovered much faster than the cells containing A2E. Also for A2E-laden cells not supplemented with DHA, the decrease of GSH level was slower and only a slight recovery occurred by 60 min.
Fig. 7.
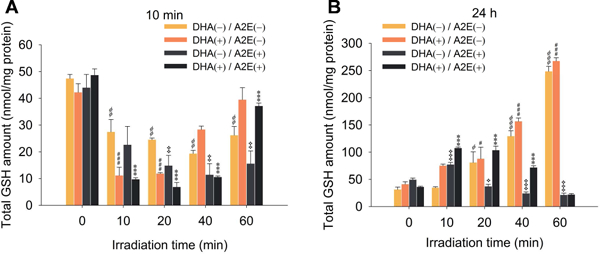
Quantitation of GSH levels remaining in DHA/A2E-laden ARPE-19 cells 10 min (Panel A) or 24 h (Panel B) after irradiation for various times from 0 to 60 min. The data are presented as mean ± SD, n = 3. Student’s t-test: *=P˂0.05, **=P˂0.01, ***=P˂0.001
Furthermore, GSH levels in cells 24 h after light exposure for 10 min contained 3 times the levels of GSH (107 ± 2 nmol/mg protein) present in dark controls (36 ± 1 nmol/mg protein), but cells exposed to longer irradiation showed no return of their GSH level to dark control values. Apparently, GSH biosynthesis is upregulated in response to massive depletion by light-induced oxidative injury leading to cell recovery after short term irradiation. But the damage accompanying catastrophic light-induced GSH depletion was more extensive and not recoverable (Fig. 7B). Interestingly, in the non-A2E containing cells, a dramatic increase of GSH level was observed (6 - 7 fold increase after 60 min) and DHA-enriched cells showed a slightly higher level. In contrast, in the A2E-laden cells without DHA treatment, the recovery was not significant. According to these observations, it is possible that after exposure to light, oxidized DHA or DHA could upregulate detoxification pathways promoting the synthesis of more GSH, but irradiation in the presence of A2E exacerbated the light damage resulting in no recovery of the GSH level. Apparently, the level of oxidative damage in the presence of A2E overwhelms the cells capacity to protect itself by upregulating antioxidant defences.
3.4. Light exposure generates CEP in DHA-rich A2E-laden ARPE-19 cells
Previously, we found that HOHA lactone is a major precursor of CEP derivatives, which have significant pathological and physiological relevance to AMD, cancer and wound healing (Salomon, 2017; Salomon and Gu, 2011; West et al., 2010). After exposure of DHA-rich, A2E-laden ARPE-19 cells to blue light for 20 min, they were washed, fixed with cold acetone and immunostained using primary rabbit anti-CEP polyclonal antibodies and goat anti-rabbit Texas Red-X secondary antibodies to detect CEP-epitopes on these cells (Fig. 8A). These antibodies detect both CEP-protein and CEP-ethanolamine derivatives in contrast with LC- MS/MS analyses that have independently confirmed the occurrence of CEP-ethanolamine derivatives in vivo (Guo et al., 2016b; Wang et al., 2014). Light exposure caused a 50% increase of CEP in DHA(+)/A2E(+) cells indicated by red fluorescence intensity owing to immunostaining with anti-CEP antibody (Fig. 8C: 820 ± 92 RFU in the light exposed versus 414 ± 27 RFU in the dark control). Thus, although the precursor of CEP, i.e., HOHA lactone, is captured by covalent adduction of GSH and aldehyde reduction to produce the unreactive end product DHHA-GSH, reaction with primary amino groups, e.g., of ethanolamine phospholipids and protein lysyl residue ε-amino groups, to form CEPs, competes with GSH adduction.
Fig. 8.
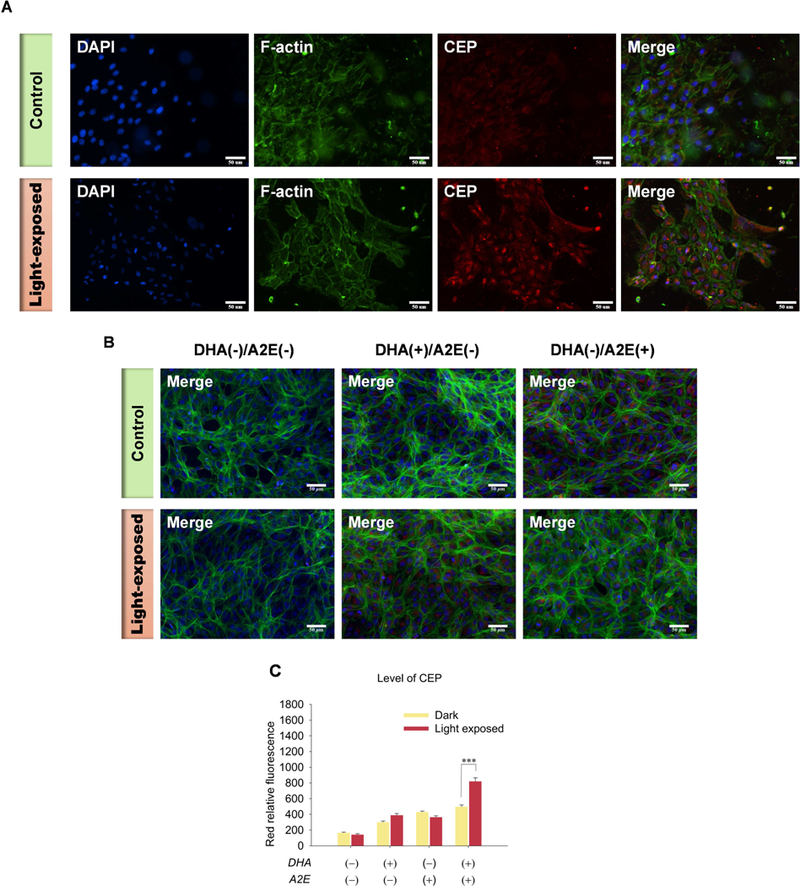
Generation of CEP in ARPE-19 cells after 20 min exposure to blue light. Panel A: Images of the generation of CEP in DHA-rich A2E-laden ARPE-19 cells (Top panel: Control; Bottom panel: light-exposed). Panel B: Images of CEP immunostaining in ARPE-19 cells (Top panel: Control; Bottom panel: light-exposed; From Left to right: DHA(−)/A2E(−), DHA(+)/A2E(−), DHA(−)/A2E(+)). Panel C: Quantification CEP levels in ARPE-19 cells. A2E-laden ARPE-19 cells were exposed to blue light for 20 min followed by 24 h incubation and then immunostained with rabbit anti-CEP polyclonal antibody/goat anti-rabbit Texas Red-X antibodies (red), Flash Phalloidin™ Green 488 (green, F-actin) and DAPI (blue). The figure is representative of 4~6 independent experiments, which showed very similar results. Student’s t-test: ***- P˂0.001.
3.5. Light exposure induces mitochondrial damage and death of DHA-rich A2E-laden ARPE-19 cells.
Mitochondrial dysfunction is associated with various pathological states (Green and Reed, 1998; Petit et al., 1995). Decrease of mitochondrial membrane potential (ΔΨm) is a point of no return in the classical apoptosis pathway (Susin et al., 1997). We utilized two different probes to examine the mitochondrial membrane potential of ARPE-19 cells affected by light-induced oxidative stress. MitoClick is a highly specific and sensitive ΔΨm quantitative probe, which contains a triphenylphosphonium (TPP) lipophilic cation, in a “click chemistry” molecule that forms and accumulates specifically in mitochondria in response to ΔΨm (Logan et al., 2016). It is formed when one component containing an azido moiety (MitoAzide) and the other component, a cyclooctyne (MitoOct), react in a concentration-dependent manner by “click” chemistry to form the product MitoClick. An increase in ΔΨm accelerates mitochondrial MitoClick formation relative to that in the cytosol and even a miniscule increase of ΔΨm leads to a compounded increase of MitoClick that results in its utility to assess even miniscule changes of ΔΨm in vitro and in vivo and give an exact quantitation of ΔΨm by LC-MS/MS with normalization with total protein concentration rather the relative ratio. After light exposure, the TPP probe showed a dramatic decrease in the amount of MitoClick product indicating a decrease of mitochondrial membrane potential in the DHA-rich A2E-laden APRE-19 cells. ΔΨm dropped 84% and 87% respectively after 1h exposure to blue light (Fig. 9A) and black light (Fig. 9B), respectively. In contrast, DHA-rich cells not laden with A2E preserved healthy mitochondria after exposure to blue or black light (Fig. 9).
Fig. 9.
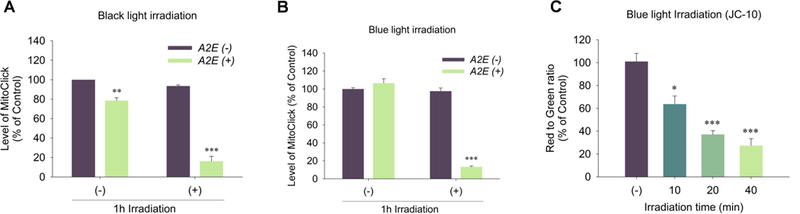
Measurement of mitochondrial membrane potential in light exposed DHA-rich A2E-laden ARPE-19 cells. Panel A: to cells exposed to black light (365 nm) for 0 and 1 h, after 24 h recovery, were added TPP probes for 3 h and the amount of MitoClick was quantified by LC-MS/MS; Panel B: to DHA-rich A2E-laden ARPE-19 cells exposed to blue light (430 nm) for 0 and 1 h, after 24 h recovery, were added the TPP probes for 3 h and the amount of MitoClick produced was quantified by LC-MS/MS; Panel C: DHA-rich A2E-laden ARPE-19 cells were exposed to blue light (365 nm) for 0 to 40 min and, after 24 h recovery, the ΔΨm was measured by JC-10. The data are presented as mean ± SD of %control, n = 3. The cells without light exposure (−) served as control. Student’s t-test: *- P˂0.05, **- P˂0.01, ***- P˂0.001.
We confirmed the decreased mitochondrial membrane potential detected with the new MitoClick probe using another probe that is widely applicable to in vitro studies of cellular mitochondrial membrane potential changes. JC-10, a 5,5’,6,6’-tetrachloro-1,1’,3,3’-tetraethylbenzimidazoylcarbocyanine iodide derivative, is a cationic dye that accumulates in energized mitochondria. In healthy cells, the dye aggregates yielding red to orange fluorescent emission while in apoptotic cells, the dye remains in the cytoplasm in its monomeric form showing green fluorescence (Li et al., 2016). JC-10, showed an irradiation time-dependent decrease in the ratio of red aggregate to green monomer from 37% to 77% after exposure to blue light for 10 minutes to 40 minutes indicating a decrease of ΔΨm due to the light-induced damage (Fig. 9C). The dysregulation of mitochondrial potential was accompanied by a decrease in cell viability. Thus, A2E-laden DHA-rich ARPE-19 cells also exhibited irradiation time-dependent cell death resulting from exposure to blue light as assessed by MTT assay. Cell viability decreased to 60% after 5 min irradiation, while only 10% of cells remained viable after irradiation for 60 minutes (Fig. 10).
Fig. 10.
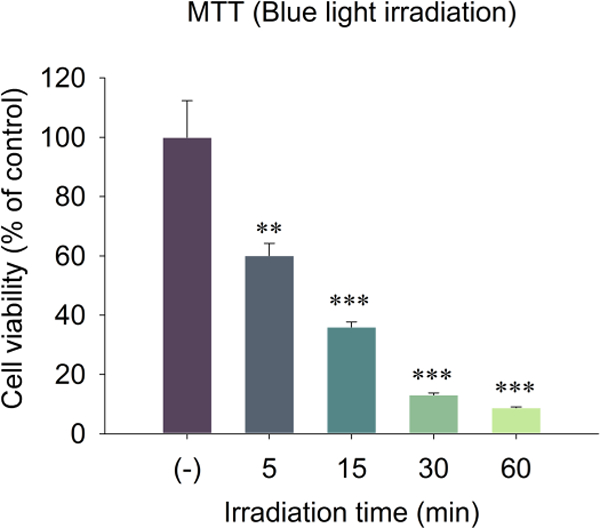
Measurement of the cell viability by MTT assay 24 h after A2E-laden ARPE-19 cells were exposed to blue light (430 nm) for 0 to 60 min. The data are presented as mean ± SD of % control, n = 3. Student’s t-test: **- P˂0.01, ***- P˂0.001. The cells without light exposure (−) served as control.
3.6. HOHA lactone can cause mitochondrial damage, cellular senescence and induce cell death
The identification of HOHA lactone derivatives of GSH and proteins, i.e. CEPs, provided presumptive evidence that light-induced generation of HOHA lactone in DHA-rich ARPE-19 cells contributes to mitochondrial dysfunction and death. We treated ARPE-19 cells with HOHA lactone to confirm these pathological effects. After exposure to 20 μM HOHA lactone for 3 h, we observed a 1.5-fold increase of MitoClick levels in mitochondria (Fig. 11A) that indicated slightly higher mitochondrial membrane potential. Such mitochondrial hyperpolarization is generally exhibited by early apoptotic cells (Giovannini et al., 2002; Kadenbach, 2003). In contrast, treatment with 5 to 20 μM HOHA lactone for 24 h, induced a dose-dependent mitochondrial depolarization as measured by TPP MitoClick (Fig. 11B) and JC-10 (Fig. 11C) probes. The levels of MitoClick decreased by 40% with exposure to 20 μM HOHA lactone and JC-10 showed a 60% decline in the ratio of red aggregate to green monomer fluorescence. This demonstrated severe damage of mitochondria by HOHA lactone that caused an irreversible loss of mitochondrial membrane potential characteristic of late apoptotic cells.
Fig. 11.
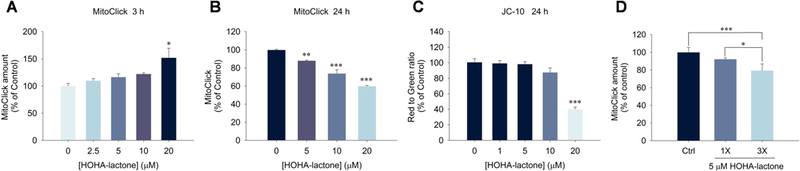
Measurement of mitochondrial membrane potential changes in ARPE-19 cells upon exposure to HOHA lactone. Panel A: dose- dependent effect of 3 h exposure to HOHA lactone on ARPE-19 cell mitochondrial membrane potential measured with the TPP MitoClick probe; Panel B: dose-dependent effect of 24 h exposure to HOHA lactone on ARPE-19 cell mitochondrial membrane potential measured with the TPP MitoClick probe; Panel C: effect of 24 h exposure to HOHA lactone on ARPE-19 cell mitochondrial membrane potential measured with the JC-10 probe; Panel D: effects of a single treatment (1X) with 5 μM HOHA lactone incubated for 8 h or a triple treatment (3X) with 5 μM HOHA lactone every 8 h, total incubation time was 24 h, measured with the TPP MitoClick probe. The data are presented as mean ± SD of % control, n = 3 (MitoClick) or n = 6 (JC-10). Student’s t-test: *-P˂0.05, **- P˂0.01, ***- P˂0.001.
Having found that photo-induced oxidative damage of DHA-rich ARPE-19 cells leads to the formation of HOHA lactone-GSH adducts (Fig. 5 and Fig. 6) and that both light exposure (Fig. 9) and HOHA lactone treatment of these cells leads to a significant decline in the cell’s mitochondrial membrane potential (Fig. 11), we used two metabolic indicators, MTT and Alamar Blue (AB) to gauge the extent to which the decrease in mitochondrial membrane potential in these cells affects overall cell viability. MTT is reduced by mitochondrial reductases as well as by “reducing equivalents” such as NADPH, FADH, FMNH, and NADH generated in viable cells by passing electrons to the tetrazolium salt to form insoluble intracellular formazan as the result of the cellular metabolism. However, MTT cannot be reduced by mitochondrial cytochromes and other cytosolic reducing enzymes. On the other hand, AB can be reduced by mitochondrial reductases and cytochromes, as well as enzymes located in the cytoplasm, e.g., dihydrolipoamide dehydrogenase (Matsumoto et al., 1990), NAD(P)H-quinone oxidoreductase (Belinsky and Jaiswal, 1993) and flavin reductase (Chikuba et al., 1994). Hence, AB reduction can also reveal impairments of cellular metabolism besides the direct measure of interrupted electron transport and mitochondrial dysfunction revealed by MTT (Rampersad, 2012). The AB assay (Fig. 12) clearly shows that HOHA lactone-induced damage goes beyond impairment of the mitochondria. At 20 μM HOHA lactone, the MTT assay revealed a 25% decline in viability of ARPE-19 cells (Fig. 12A) while the AB assay indicated a 50% decline (Fig. 12B). On the other hand, impairment of mitochondrial function is significant after exposure to10 μM HOHA lactone.
Fig. 12.
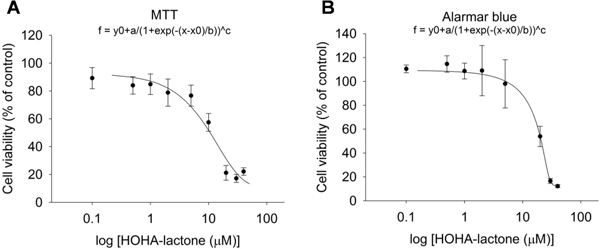
Measurement of the cell viability of ARPE-19 cells after exposure to 0 to 40 μM HOHA lactone for 24 h assessed by MTT assay (Panel A) and by Alamar Blue assay (Panel B). The data are presented as mean ± SD of % control, n = 8.
Since replicative senescence can be induced by oxidative stress (Marazita et al., 2016), and since we previously showed that low concentrations (0.1 - 1.0 μ M) of HOHA lactone can induce oxidative stress in ARPE-19 cells (Guo et al., 2016a), we tested the hypothesis that exposure to HOHA lactone can induce replicative senescence in ARPE-19 cells. Using senescence-associated β-galactosidase (SA β-gal) staining (Dimri et al., 1995) that detects lysosomal β-galactosidase (Lee et al., 2006), we determined that exposure to HOHA lactone induces senescence in ARPE-19 cells. After 12 h incubation of ARPE-19 cells with 5 μM HOHA lactone, SA β-gal staining was 3.5 times greater in the HOHA lactone treated than in the control ARPE-19 cells (1X in Fig. 13A). This indicates that a sub-lethal dose of HOHA lactone produces a prematurely senescent phenotype in ARPE-19 cells which results in a permanent loss of the ability to proliferate and a lower the resistance to apoptosis (Campisi and d’Adda di Fagagna, 2007). However, repeated treatments did not cause an increase in positive SA β-gal staining (3X, Fig. 13B). As noted above, we found that repeated (3X) treatment of ARPE-19 cells with HOHA lactone caused a greater decrease in mitochondrial membrane potential than a single (1X) treatment (Fig. 11D). The decrease level was almost identical to 24 h treatment with 10 μM HOHA lactone and at 10 μM concentration, ARPE-19 cells showed a dramatic cell death. This phenomenon indicated the low dosage of HOHA lactone might lead to cellular senescence in RPE cells, but due to less resistance to apoptosis, chronic exposure of the same concentration of HOHA lactone could further induce cell death.
Fig. 13.
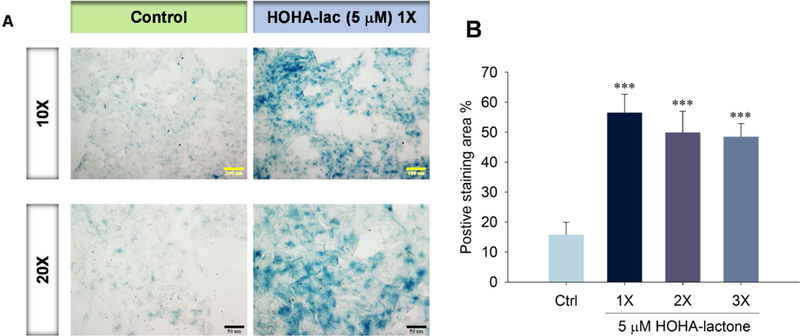
Senescence in ARPE-19 cells exposed to HOHA lactone. Panel A: SA-P-Gal activity in ARPE-19 cells treated with 5 μM HOHA lactone and then maintained in fresh medium (DMEM/F12 containing 1% FBS) for a total of 7 days. Micrographs were obtained with bright field/phase contrast combined mode microscopy; Panel B: Quantification of SA-β-Gal positive cells shown in panel A (1X) and in those treated again after 12 h (2X) and 24 h (3X) with 5 mM HOHA lactone. SA-P-Gal positive regions were scored in 3 fields in duplicate wells. Results are expressed as the percentage of stained area (mean ± SD).
3.7. HOHA lactone induces lysosomal membrane permeabilization
Lysosomal membrane permeabilization and loss of lysosomal integrity has been observed during oxidative stress-induced apoptosis and during the progression of cellular senescence (Chen et al., 2008; Law et al., 2016). Perturbation of the lysosomal membrane leads to lysosome leakage and loss their acidity (Gomez-Sintes et al., 2016; Serrano-Puebla and Boya, 2016). To determine the effect of HOHA lactone on RPE cell lysosomal integrity, we used Acridine Orange (AO), a weak base metachromatic dye capable of crossing plasma membranes. AO accumulates within lysosomes because it becomes protonated under lysosomal acidic conditions. At low concentrations AO can differentiate lysosomes (reddish-orange granules) from other cellular components (diffuse green) (Sohaebuddin and Tang, 2013; Uchimoto et al., 1999). Accumulation of AO in lysosomes leads to a shift in emission wavelength from λ = 530 nm (green) to λ = 620 nm (red) (Lovelace and Cahill, 2007; Sohaebuddin and Tang, 2013). If the integrity of the lysosomal membrane is compromised to the point that lysosomal pH rises, AO becomes deprotonated and its fluorescence emission shifts back from red to green (Sohaebuddin and Tang, 2013; Zareba et al., 2006). AO- treated ARPE-19 cells showed both green fluorescence emitted from the cytosol and nucleus and red fluorescence associated with lysosomes (Fig. 14A, control). Addition of 1 HOHA lactone to ARPE-19 cells followed by 24 h incubation drastically diminished AO red fluorescence emission to 51.0 ± 2.0 % of the fluorescence level in untreated ARPE-19 cells. An even more profound decrease to 24.4 ± 1.2% of control was seen in the cells treated with 10 μM HOHA lactone (Fig. 14B). Thus, upon exposure to HOHA lactone, lysosomes in ARPE-19 cells apparently lose their acidity indicating that low micromolar concentrations of HOHA lactone can induce lysosomal membrane permeabilization and loss of lysosomal integrity.
Fig. 14.
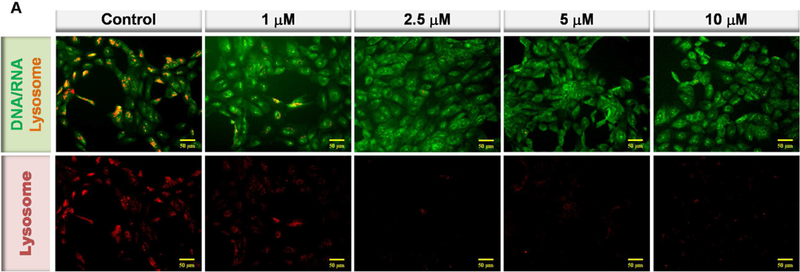
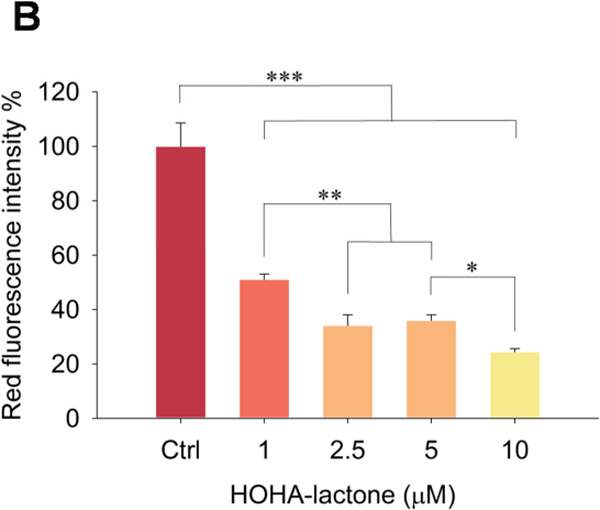
Lysosomal membrane perturbation in ARPE-19 cells after incubation with HOHA lactone. Panel A: Inverted fluorescence microscope images (10X) of Acridine Orange sequestered in ARPE-19 intact lysosomes (red) or bound to DNA, RNA and other cell constituents (green). Panel B: Relative fluorescence intensity of AO-stained lysosomes in the control and in the HOHA lactone treated ARPE-19 cells after 24 h of incubation under standard conditions. ARPE-19 cells were incubated with 0~10 HOHA lactone for 24 h incubation and then stained with Acridine Orange. Lysosomal fluorescence was quantified in the raw image after background subtraction using Metamorph sofware. The figure is representative of 4 independent experiments, which showed very similar results. Student’s t-test: *-P˂0.05, **- P˂0.01, ***- P˂0.001.
3.8. HOHA lactone increases the level of CEP in ARPE-19 cells
Previously, we reported that upon treatment of ARPE-19 cells with 10 μM HOHA lactone, less than 5% was incorporated into GSH adducts (Wang et al., 2016). Thus, most of the HOHA lactone was not trapped by GSH and instead can react with other nucleophiles such as primary amino groups in biomolecules to generate CEPs. After treating ARPE-19 cells with 10 μM HOHA lactone, we observed a 100% increase in their far- red fluorescence intensity owing to immunostaining with anti-CEP antibody (Fig. 15) corresponding to a significant increase in levels of CEP. Thus, GSH did not capture all of the HOHA lactone. Some of it reacted with proteins and ethanolamine phospholipids to generate CEP derivatives.
4. Discussion
Interventional clinical studies on age-related eye disease that used antioxidants (e.g. vitamins C and E) (Age-Related Eye Disease Study Research, 2001) and zinc (Newsome et al., 1988) show association of oxidative damage with AMD progression. While the data on the connection between exposure of the human eye to blue light and long-term chronic sunlight exposure haven’t produced a clear link between the involvement of these factors and the progression of AMD, some studies support the hypothesis. There is a significant association of blue light exposure and neovascular AMD in patients with low antioxidant levels according to the European Eye Study (Fletcher et al., 2008). The Beaver Dam Study showed that sunlight exposure is significantly associated with early AMD (Tomany et al., 2004). There is a significant association between long-term visible or blue light exposure and geographic atrophy or disciform scarring according the Chesapeake Bay Watermen Study (Taylor et al., 1992).
Although the human lens can absorb most of the UV light >295 nm passing through the cornea by UV- absorbing chromophores, these must first accumulate to protect the human retina against damage by UVA light to which it is highly susceptible (Rozanowska, 2012). More than 75% of 300 to 400 nm UV radiation is transmitted through lenses of individuals under 10 years of age (Lerman, 1987). The accumulation of UV absorbing chromophores as the lens ages provides a lenticular UV filter that protects the retina from potentially harmful continuous UV radiation exposure. UV transmission through lenses of individuals 25 or more years old is very low, i.e., ~1% (Artigas et al., 2012; Lerman, 1987). Nevertheless, long wavelength UV radiation may play a role in degenerative processes in older patients, e.g., macular degeneration and retinitis pigmentosa, owing to a substantial increase in UV radiation reaching the retina after removal of their cataractous crystallin lenses by cataract surgery (Mainster, 1986). Therefore, not only children but also some adults could be susceptible to light-induced damage of their retinas when exposed to UV light. Previous studies found a positive correlation between increased exposure to certain spectral ranges of light (UV or blue light) and increased susceptibility to AMD (Fletcher, 2010). In the present study, we explored oxidative damage of DHA phospholipids that are especially abundant in retina. We monitored oxidative cleavage of DHA induced by light of various spectral ranges to produce HOHA lactone-GSH adducts with in vitro models based on bovine retina extract and ARPE-19 cells enriched with DHA ± A2E.
4.1. Exposure to light induces the generation of HOHA lactone-GSH adducts in bovine retina extracts.
We previously discovered that spontaneous phospholipolysis of HOHA-PC releases HOHA lactone by a non-enzymatic transesterification (Choi et al., 2011) and that HOHA lactone readily diffuses through cell membranes (see Fig. 3). RPE cells metabolize HOHA lactone producing and reducing the aldehyde group in the HOHA lactone-GSH adduct producing and excreting DHHA lactone-GSH (Wang et al., 2016). In a simple in vitro model of photo-induced PUFA oxidation in the retina, we now exposed an extract from bovine retina to longer wavelength UV light and monitored the levels of HOHA lactone-GSH adducts. We developed an enrichment protocol including liquid-liquid extraction followed by two consecutive solid-phase extractions that eliminates interference by the complex tissue matrix and enables their detection by LC- MS/MS. A continuous increase in levels of the GSH adducts of HOHA lactone and DHHA lactone with increasing light exposure time was observed.
4.2. Photo-oxidative damage and lipofuscin accumulation in AMD retina.
A few cell types in the human eye are especially susceptible to the photo-oxidative damage. They include rods and cones that are photosensitive owing to the presence of visual pigments, retinoids and mitochondrial chromophores (Hunter et al., 2012; Rozanowska, 2012; van Norren and Gorgels, 2011). These cells use UV and visible light responsive pigments to absorb photons as the first step in visual object perception (Maeda et al., 2009; Maeda et al., 2008; Maeda et al., 2012; Organisciak and Vaughan, 2010). RPE cells are also photosensitive owing to the presence of melanin, lipofuscin and intermediate products of the visual cycle. Components of lipofuscin granules are phototoxic, and upon exposure to short and mid-range wavelengths of visible light under aerobic conditions generate ROS including superoxide anion, hydrogen peroxide, lipid hydroperoxides and singlet oxygen (Dontsov et al., 1999; Rozanowska et al., 1995). Elucidation of the excited states of purified lipofuscin showed that extractable chromophores from lipofuscin, which, upon excitation with blue light, form a triplet excited state which can transfer energy to molecular oxygen, resulting in the generation of singlet oxygen (Gaillard et al., 1995; Reszka et al., 1995; Rozanowska et al., 1998). Apparently, the ability of lipofuscin to interact with molecular oxygen and photo-generate superoxide radical is significantly enhanced with advancing age (Rozanowska et al., 2004). In a cell culture model in which human RPE cells were loaded with lipofuscin granules and exposed light, only cells exposed to 390–550 nm light showed significant morphological changes, loss of lysosomal integrity, enhanced peroxidation of lipids and decreased viability (Feeney-Burns et al., 1984; Rozanowska and Sarna, 2005; Sparrow et al., 1999). Along with increased susceptibility of RPE to light-induced cell damage (Davies et al., 2001; Schutt et al., 2000), lipofuscin accumulation adversely affects RPE cell homeostasis and function (Bergmann et al., 2004; Liu et al., 2008). Accumulation of excessive levels of lipofuscin in RPE cell lysosomes, which often manifests in their apoptosis, subsequent death of photoreceptor cells (Suter et al., 2000) and the formation of drusen in the region of Bruch’s membrane, have been considered initial steps in the pathogenesis of AMD, and may promote light-induced oxidative damage in the disease process (de Jong, 2006; Kersten et al.,2018). It has been hypothesized that early steps in AMD pathogenesis begin when RPE cells can no longer handle the accumulated lipofuscin and begin to excrete post-translationally modified debris. This includes biomolecules modified by 4-hydroxynon-2-enal (HNE) or malondialdehyde and other oxidative posttranslational protein modifications, e.g., advanced glycation end products (AGE) or CEP derivatives which deposit with possible cross-linking (de Jong, 2006) to the inner collagenous layer of Bruch’s membrane and contribute to drusen accumulation (Kersten et al., 2018).
A2E, a pyridinium bisretinoid derivative of all-trans-retinal, accumulates in RPE cells (Eldred and Lasky, 1993). Besides serving as a photosensitizer of oxidative damage, A2E inhibits lysosomal enzyme activities (Finnemann et al., 2002; Poliakov et al., 2014) and the resulting incomplete lysosomal degradation of phagocytosed photoreceptor tips leads to accumulation of a granular residue in RPE cells with age, forming lipofuscin (Bergmann et al., 2004; Finnemann et al., 2002; Vives-Bauza et al., 2008). The A2E containing lipofuscin absorbs light and acts as a photosensitizer that induces additional oxidative stress upon light exposure leading to damage of RPE cells. A2E accumulation contributes to the role of lipofuscin as a light absorber and photosensitizer in RPE cells. A previous model demonstrated susceptibility of RPE cells to photooxidative damage with flourophore-laden RPE cells that were generated by phagocytosis of A2E (Sparrow et al., 2000). Nevertheless, the importance of A2E in the etiology of AMD has been challenged by the finding that, although the human retina has significant RPE lipofuscin throughout the periphery, there is no correlation between the distribution of A2E and lipofuscin. Furthermore, the levels of A2E were highest in the far periphery and decreased toward the macula (Ablonczy et al., 2013). The spatial relationship between autofluorescence patterns and geographic atrophy progression in patients with AMD suggests that fundus accumulation of A2E is a consequence of retinal atrophy rather than an essential driver of RPE cell death (Biarnes et al., 2015). Nevertheless, A2E accumulation could contribute to apoptosis by promoting photo-induced generation of HOHA lactone and other toxic lipid oxidation products and by serving as one of the mitochondria damaging factors released from permeabilized lysosomes.
4.3. Photooxidative generation of HOHA in A2E-free RPE cells may be an early step in AMD etiology.
We postulated that before the accumulation of A2E and lipofuscin, photooxidative generation of toxic HOHA-PC, HOHA lactone and CEP from DHA phospholipids can foster the early stages of RPE cell dysfunction and AMD. In the present study to mimic the continuous uptake in vivo of DHA by RPE cells, we enriched ARPE-19 cells with DHA. We found that DHA supplemented ARPE-19 cells undergo photoinduced oxidative damage by UV and blue light, but not white light, in the absence of lipofuscin or A2E (Fig. 6). This suggests that AMD pathology can be initiated by photo-induced oxidation of DHA before accumulation of lipofuscin. Incorporation of A2E into these DHA-enriched ARPE-19 cells almost doubled their proclivity to light-induced lipid oxidation and expanded the spectral range of their photosensitivity to white light (Fig. 6). Therefore, the accumulation of A2E can accelerate the disease process. The observation that levels of A2E in the macula are relatively low does not preclude an important role for A2E-promoted generation of HOHA lactone because it readily diffuses from its site of generation. Although the amounts of oxidative damage induced by white light with sensitization by A2E are small relative to those induced by intense blue light, cumulative A2E-induced oxidative damage resulting from chronic exposure to ambient white light might make a significant contribution to the progression of AMD pathology. Upon the exposure to longer wavelength UVA, blue light or even white light, the DHA-enriched ARPE-19 cells with longer light exposure times produced increasing levels of DHHA-GSH, the reduced adduct of HOHA lactone with GSH.
4.4. CEP is coproduced with GSH adducts of photooxidatively generated HOHA in RPE cells.
The most abundant PUFA in photoreceptor disk membranes, DHA, is the unique source of HOHA that in turn is the precursor of CEP. In the retina HOHA is generated and CEP accumulates mainly in two thin regions of the retina where DHA is concentrated, in photoreceptor disc membranes of photoreceptor outer segments and in RPE cells that endocytose the oxidatively damaged tips of those photoreceptor cells. Glutathione is an important antioxidant for scavenging reactive oxygen species and detoxifying electrophiles, especially the α,β-unsaturated aldehydes that are produced when cells are subjected to oxidative stress. We previously found that exposure of ARPE-19 cells to sublethal concentrations of HOHA lactone delivers HOHA lactone-GSH adducts, but the yield of GSH adducts was less than 5%. Apparently, the capacity for cells to detoxify this electrophile can be overwhelmed. The present study showed that exposure of DHA-rich A2E-laden ARPE-19 cells to blue light for only 10 min caused the production of HOHA lactone-GSH adducts (see Fig. 6) and a massive (60%) depletion of the GSH level (see Fig. 7). Although GSH serves as a first line of defense against oxidative stress, depletion of GSH seemed likely to limit its ability to completely neutralize all the lipid peroxidation metabolites or reactive oxygen species generated as a consequence of light exposure.
In the present study, immunostaining with anti-CEP antibody revealed elevation of CEP levels in A2E- laden ARPE-19 cells after exposure to blue light (see Fig. 8) as well as in HOHA lactone treated ARPE-19 cells (see Fig. 14). By modifying biomolecules, e.g., by reacting with primary amino groups to generate CEP derivatives, HOHA lactone that is not trapped by GSH can induce various adverse events in the cells. CEP activates CEP-specific T -cells involved in “dry AMD” and TLR2-dependent expression and activation of the NLRP3 inflammasome and induction of angiogenesis that characterizes “wet AMD” (Salomon, 2017). CEP derivatives accumulate in the retinas and blood plasma of individuals with AMD and are a biomarker of AMD (Crabb et al., 2002; Gu et al., 2003a; Wang et al., 2014). Some animal models that show phenotypic similarities with AMD also show statistically significant elevated levels of CEP in retina and exhibit significantly elevated CEP autoantibody titer (Crabb et al., 2002; Gu et al., 2003a; Justilien et al., 2007; Renganathan et al., 2013; Wang et al., 2014). These models include superoxide dismutase 2 ribozyme knockdown mice (Justilien et al., 2007) and rodents exposed to intense green (Marc et al., 2008; Organisciak et al., 2013; Organisciak and Vaughan, 2010) or blue light (Collier et al., 2011; Renganathan et al., 2013). Animal model studies also demonstrated that CEP derivatives induce choroidal neovascularization and promote wound healing and tumor growth in a toll-like receptor 2 (TLR2)-dependent manner (Ebrahem et al., 2006; Wang et al., 2014; West et al., 2010). Furthermore, immunization of mice with CEP-modified mouse serum albumin induces AMD-like lesions in their retinas (Hollyfield et al., 2008). CEP immunized mice also exhibit monocyte and macrophage migration into the interphotoreceptor matrix and elevated complement deposition in Bruch’s membrane (Hollyfield et al., 2008). CEP immunization causes interferongamma (IFN-γ) and interleukin-17 (IL-17) production by CEP-specific T cells that promote inflammatory M1 polarization of macrophages indicating that T cells and M1 macrophages activated by oxidative damage to DHA cooperate in AMD pathogenesis (Cruz-Guilloty et al., 2014). No similar biological activities have been observed for the analogous pentylpyrrole or ethylpyrrole derivatives produced by adduction of other γ- hydroxy-α,β-unsaturated aldehyde lipid oxidation products HNE or 4-hydroxyhex-2-enal, respectively, to proteins or ethanolamine phospholipids.
4.5. HOHA lactone causes mitochondrial damage
The mitochondrion is the main site of intracellular ROS production which could be photo-generated upon light exposure (Dorey et al., 1990). It is also the target of reactive lipid peroxidation products, including acrolein, malondialdehyde and HNE (Li et al., 2008). Reactive electrophilic lipid oxidative degradation products generated from cell plasma membrane or inner mitochondrial membrane (Kirkinezos et al., 2005) could inhibit the activity of mitochondrial enzymes, impair the mitochondrial functions and trigger apoptosis of RPE cells. The mitochondrial membrane potential is a major determinant and indicator of cell fate. During apoptosis, the opening of permeability transition pores leads to swelling of the mitochondrial matrix, rupture of the outer membrane and eventually causes irreversible collapse of the mitochondrial membrane potential (ΔΨm ) (Ly et al., 2003). Therefore, the decrease of mitochondrial membrane potential is a point of no return in the classical apoptosis pathway. In this study, we utilized a novel sensitive triphenylphosphonium (TPP) probe to quantitatively measure the ΔΨm. Changes in ΔΨm are proportional to the accumulation of the click chemistry product “MitoClick”. We also confirmed the results of these experiments with another orthogonal widely-used probe, JC-10. We observed that the ARPE-19 cells showed a dose dependent decrease of mitochondrial membrane potential after 24 h treatment with HOHA lactone (see Fig. 11 B). As expected, an MTT cell viability assay showed that mitochondrial dehydrogenase activity also decreased after treatment with HOHA lactone (Fig. 12). On the other hand, at an earlier time point, 3h after treatment of ARPE-19 cells with HOHA lactone, we detected hyperpolarization of mitochondria (Fig. 11A). Such mitochondrial hyperpolarization is generally exhibited by early apoptotic cells (Giovannini et al., 2002; Kadenbach, 2003). These observations indicate that HOHA lactone can trigger apoptosis of RPE cells. It is tempting to speculate that this induction of apoptosis starts with inhibition of ATP synthase or dephosphorylation of cytochrome c oxidase causing elevation of ΔΨm that leads to uncoupling of oxidative phosphorylation that, in turn, dissipates ΔΨm, damages inner mitochondrial membrane integrity and could eventually result in the cell death (Perl et al., 2004). These observations in our in vitro model suggest that HOHA lactone, and presumably other α,β-unsaturated aldehyde electrophiles generated in vivo by chronic photo-induced oxidative cleavage of PUFAs, can contribute to RPE cell dysfunction. We also observed that upon exposure to intense light, DHA-rich A2E-laden APRE-19 cells showed an irradiance dependent mitochondrial depolarization and a decrease in mitochondrial dehydrogenase activity (MTT cell viability) indicating light-induced mitochondrial damage. Oxidative damage of DHA and the consequent production of HOHA-PC and HOHA lactone can contribute to reduction of mitochondrial potential induced in DHA-rich RPE cells by light exposure. But the presence of A2E less than doubles the levels of HOHA-derived DHHA-GSH produced upon exposure of these cells to light (Fig. 8) and the effect of 5 μM HOHA lactone in the absence of A2E is modest (Fig. 11). Therefore, the massive (90%) light-induced decrease of mitochondrial membrane potential in the presence of A2E but not in DHA-rich RPE cells lacking A2E (Fig. 9) suggests that mechanisms besides the effects of HOHA lactone are important. One putative mechanism is a light-induced conversion of A2E into a more toxic derivative, e.g. by epoxidation (Radu et al., 2004; Sparrow et al., 2003). Another possibility is a synergistic mechanism where HOHA lactone facilitates the release of A2E from lysosomes into the cytosol and subsequent mitochondrial accumulation while A2E sensitizes lipid oxidation leading to the production of more toxic α, β-unsaturated aldehydes including 4-HHE and HOHA lactone.
4.6. HOHA lactone causes lysosomal leakage
Probably due to its deleterious effects on the cell plasma membrane, feeding A2E to ARPE-19 cells inhibits the lysosomal ATP-driven proton pump (Bergmann et al., 2004), increases intralysosomal pH (Holz et al., 1999b) and selectively inhibits phagolysosomal degradation of photoreceptor phospholipids (Finnemann et al., 2002). Lipofuscin/A2E is sequestered in lysosomes, and when exposed to blue light, causes lysosomal membrane permeabilization (Brandstetter et al., 2015; Davies et al., 2001; Schutt et al., 2000). Blue light/A2E-driven lysosomal membrane permeabilization in ARPE-19 cells leads to activation of the NLRP3 inflammasome by leaking lysosomal enzymes resulting in secretion of inflammatory cytokines IL-1 p and IL-18 (Brandstetter et al., 2015). A2E is a photosensitizer and if excited with blue light in the presence of molecular oxygen it generates ROS (Rozanowska et al., 1995; Rozanowska et al., 1998; Sparrow et al., 2002). Therefore, it promotes light-dependent lipid peroxidation (Wassell et al., 1999), that inactivates acid phosphatase and ROS detoxifying enzymes (Marie et al., 2018; Wassell et al., 1999), and causes RPE cell death (Brandstetter et al., 2015; Marie et al., 2018).
We now discovered that light-induced oxidative damage of DHA-enriched ARPE-19 cells does not require the presence of A2E to produce the GSH adducted and reduced derivative, DHHA lactone-GSH, of HOHA lactone (Fig. 6), and exposure to 1 μM HOHA lactone causes massive (50%) lysosomal leakage in ARPE-19 cells (Fig. 14). Consequently, oxidative fragmentation of DHA can promote lysosomal leakage in the early stages of AMD before lipofuscin or A2E accumulate. Nevertheless, the ability of A2E, and potentially other components of lipofuscin to double the efficiency of photo-induced production of HOHA lactone-GSH suggests that the accumulation of lipofuscin/A2E in lysosomes exacerbates HOHA lactone- induced lysosamal leakage, i.e., by photosensitizing the oxidative fragmentation of DHA phospholipids to produce more HOHA lactone in the advanced stages of AMD.
Apoptosis may be initiated by escape of lysosomal enzymes, such as cathepsin B, D, or L, into the cytosol. Lysosomal proteases activate caspases (Isahara et al., 1999) and cleave the Bcl-2 family member, Bid to a form that causes cytochrome c release from mitochondria (Stoka et al., 2001). Consequently, lysosomal leakage, even in the absence of A2E, may cause mitochondrial dysfunction leading to release of cytochrome c, activation of caspase-9, and induction of apoptosis (Krajewski et al., 1999; Rodrigues et al., 2000; Xu et al., 2001). A recent study found that exposure of ARPE-19 cells to 5 μM HNE causes lysosomal permeabilization, cathepsin B release into the cytoplasm, and apoptotic death (Rajapakse et al., 2017). Our finding that HOHA-lactone induces ARPE-19 cell lysosomal permeabilization indicates that this biological activity is dependent on the α, β-unsaturated aldehyde functionality common to HNE and HOHA lactone, and that the γ-hydroxyl functionality in HNE is not essential. HHE, an α, β-unsaturated aldehyde homologue of HNE that is coproduced with HOHA-PC during oxidative fragmentation of DHA-PC (Fig. 1), is also likely to cause lysosomal permeabilization in analogy with the effects of HNE and HOHA lactone (Fig. 16).
4.7. HOHA lactone and A2E can synergistically induce apoptosis in RPE cells.
Exposure of RPE cells to A2E results in accumulation of more than 90% in the lysosomes (Sparrow et al., 1999), and any A2E released from the lysosome into the cytosol accumulates specifically in the mitochondria (Schutt et al., 2007). The induction of lysosomal membrane permeability by HOHA lactone, HHE and HNE might promote release of A2E from the lysosome that then specifically targets the outer mitochondrial membrane and initiates apoptosis (Fig. 16). Thus, we postulate that A2E and a family of α, β-unsaturated aldehyde products of lipid oxidative cleavage contribute synergistically to cause light-induced apoptosis of RPE cells. We postulate that the α, β-unsaturated aldehydes are especially effective in disrupting lysosomal membranes while A2E is especially effective in disrupting mitochondrial membranes, presumably as a consequence of the favorable interaction of the negatively charged mitochondrial membrane and the positively charged A2E molecule. A2E photosensitization can produce reactive oxygen species (ROS) that promote the oxidative fragmentation of membrane phospholipids to generate α, β-unsaturated.
4.8. HOHA lactone causes senescence of RPE cells.
Stress-induced premature cellular senescence (Campisi and Robert, 2014) is one mechanism through which oxidative stress is postulated to contribute to the pathogenesis of AMD (Honda et al., 2002; Kozlowski, 2012; Matsunaga et al., 1999). Exposure to a variety of stresses, such as oxidizing or DNA damaging agents can induce cellular senescence that corresponds to a permanent loss of the ability to proliferate, resistance to apoptosis and an altered pattern of gene expression. Hydrogen peroxide, an endogenous inducer of oxidative stress, which is produced in the retina under photo-oxidation conditions, was previously shown to induce senescence in ARPE-19 cells (Marazita et al., 2016). Furthermore, we previously showed that low concentrations ( 0.1 - 1.0 μ M) of HOHA lactone induce oxidative stress in ARPE-19 cells (Guo et al., 2016a). Therefore, we hypothesized that HOHA lactone-induced oxidative stress could elicit a senescence response in RPE cells. We now find that treatment of ARPE-19 cells with a sub- lethal concentration of HOHA lactone produced elevated levels of senescence associated-β-galactosidase (SA-β-Gal) activity. Since oxidative stress promotes lipid oxidation that produces HOHA-PC and HOHA lactone, even small amounts of these endogenously photo-generated electrophiles can contribute to chronic generation of more HOHA leading to senescence in RPE cells and contributing to the pathogenesis of AMD.
5. Conclusions
Previously, we discovered CEP (Salomon, 2017), a biologically active posttranslational protein modification that is abundant in AMD retinas and contributes to the pathogenesis of AMD. Light induces oxidative cleavage of DHA phospholipids to generate the HOHA precursor of CEP in vivo. The level of HOHA-PC reaches 1.5 times that of residual DHA-PC after 1 h exposure of dark adapted albino rats to bright (~1200 lux; 200 microwatts/cm2) green light (Sun et al., 2006). CEP accumulates mainly in two thin regions of the retina where DHA is concentrated, the photoreceptor outer segments and RPE cells (Gu et al., 2003a). Previously, we also found that GSH in RPE cells traps HOHA lactone leading to the production of an unreactive reduced HOHA lactone-GSH end product, DHHA-GSH.
In the present study, model systems were developed and used to demonstrate that HOHA and CEP can be generated by light-induced oxidative cleavage of DHA in RPE cells, and to explore possible contributions of this biochemistry to pathology induced in the retina upon exposure to light. In a cell-free model of light- induced oxidative retinal damage, we irradiated bovine retina supernatants in phosphate buffer and observed the production of HOHA lactone-GSH adducts. The same products were photo-generated in ARPE-19 cells that were supplemented with DHA. Additional doping with the lipofuscin fluorophore A2E expanded the spectral range of ARPE-19 cell photosensitivity to longer wavelengths and nearly doubled the levels of HOHA lactone-GSH adducts produced. However, presumptive evidence is presented that the accumulation of lipofuscin fluorophores is not essential to promote photo-induced oxidation of DHA in RPE cells. Such generation of lipid-derived reactive electrophilic photo-oxidation products, e.g., HOHA lactone, and their derivatives, e.g., CEP, may be especially important in the early stages of AMD pathogenesis before the accumulation of lipofuscin that characterizes the advanced stages of the disease. This conclusion is consistent with the clinical observation that fundus autofluorescence, which is primarily ascribable to A2E, correlates with advanced RPE alteration in AMD retinas, but not early RPE changes, as seen by histologic examination (Rudolf et al., 2013). A clinical study that characterized geographic atrophy progression in patients with AMD concluded that fundus autofluorescence patterns may be a consequence of enlarging atrophy and that the role of lipofuscin in promoting geographic atrophy growth is modest at best (Biarnes et al., 2015). Rather than being an essential driver of RPE death and geographic atrophy, fundus accumulation of A2E seems to be a consequence of retinal atrophy.
Although we found that HOHA alone can foster loss of mitochondrial membrane potential, an additional mechanism is needed to account for the massive A2E-dependent photo-induced loss of mitochondrial membrane potential that we observed in DHA-rich ARPE-19 cells loaded with A2E versus those without A2E. A possible mechanism is based on our discovery that low micromolar concentrations of HOHA lactone disrupt lysosomal membrane integrity in ARPE cells. A2E enters RPE cells in lysosomes and targets mitochondria upon leakage from lysosomes. We postulate that by disrupting lysosomal membranes, HOHA lactone and possibly other α, β-unsaturated aldehyde products of lipid oxidation facilitate entry of A2E into the cytosol that is required for it to attack mitochondria. A2E is especially effective in disrupting mitochondrial membranes, presumably as a consequence of the favorable interaction of the negatively charged mitochondrial membrane and the positively charged A2E molecule (Fig. 16). Thus, A2E and possibly other a, b-unsaturated aldehyde products of lipid oxidative cleavage could contribute synergistically to cause light-induced apoptosis of RPE cells. A2E can modestly (~2x) increase the yield of photo-induced HOHA production, and HOHA lactone can facilitate the escape of A2E from lysosomes leading to mitochondrial damage and apoptosis. Finally, the discovery that HOHA lactone induces RPE cell senescence provides an additional potential contribution of oxidative DHA damage to the pathogenesis of AMD.
Supplementary Material
Highlights:
Docosahexaenoate-rich retinal pigmented epithelial (RPE) cells are light sensitive
Lipofusion is not required for photooxidation of docosahexaenoate (DHA) in RPE cells
Light induces 4-hydroxy-7-oxohept-5-enoate (HOHA) generation from DHA in RPE cells
HOHA is a potent inducer of the loss of lysosomal membrane integrity in RPE cells
A2E doubles the yield of HOHA photogeneration in docosahexaenoate-rich RPE cells
HOHA generation is not a major contributor to A2E-induced mitochondrial photodamage
A2E confers susceptibility of RPE cells to ambient white light-induced oxidative stress
Acknowledgements
This research was supported by National Institutes of Health grant R01EY016813 from the National Eye Institute and Core Grant P30 EY11373 (to Case Visual Sciences Research Center). We thank Dr. Geeng-Fu Jang and Dr. John Crabb for assistance with LC-MS/MS analyses at the Cleveland Clinic.
Footnotes
Publisher's Disclaimer: This is a PDF file of an unedited manuscript that has been accepted for publication. As a service to our customers we are providing this early version of the manuscript. The manuscript will undergo copyediting, typesetting, and review of the resulting proof before it is published in its final citable form. Please note that during the production process errors may be discovered which could affect the content, and all legal disclaimers that apply to the journal pertain.
References
- Ablonczy Z, Higbee D, Anderson DM, Dahrouj M, Grey AC, Gutierrez D, Koutalos Y,L,SK, Hanneken A, Crouch RK, 2013. Lack of correlation between the spatial distribution of A2E and lipofuscin fluorescence in the human retinal pigment epithelium. Invest Ophthalmol Vis Sci. 54, 5535–5542. [DOI] [PMC free article] [PubMed] [Google Scholar]
- Age-Related Eye Disease Study Research, G., 2001. A randomized, placebo-controlled, clinical trial of high-dose supplementation with vitamins C and E, beta carotene, and zinc for age-related macular degeneration and vision loss: AREDS report no. 8. Arch Ophthalmol 119, 1417–1436. [DOI] [PMC free article] [PubMed] [Google Scholar]
- Alary J, Fernandez Y, Debrauwer L, Perdu E, Gueraud F, 2003. Identification of intermediate pathways of 4-hydroxynonenal metabolism in the rat. Chem Res Toxicol 16, 320–327. [DOI] [PubMed] [Google Scholar]
- Anoopkumar-Dukie S, Carey JB, Conere T, O’Sullivan E, van Pelt FN, Allshire A, 2005. Resazurin assay of radiation response in cultured cells. Br J Radiol 78, 945–947. [DOI] [PubMed] [Google Scholar]
- Artigas JM, Felipe A, Navea A, Fandino A, Artigas C, 2012. Spectral transmission of the human crystalline lens in adult and elderly persons: color and total transmission of visible light. Invest Ophthalmol Vis Sci 53, 4076–4084. [DOI] [PubMed] [Google Scholar]
- Beatty S, Koh H-H, Phil M, Henson D, Boulton M, 2000. The Role of Oxidative Stress in the Pathogenesis of Age-Related Macular Degeneration. Survey of Ophthalmology 45, 115–134. [DOI] [PubMed] [Google Scholar]
- Belinsky M, Jaiswal AK, 1993. NAD(P)H:quinone oxidoreductase1 (DT-diaphorase) expression in normal and tumor tissues. Cancer Metastasis Rev 12, 103–117. [DOI] [PubMed] [Google Scholar]
- Ben-Shabat S, Parish CA, Vollmer HR, Itagaki Y, Fishkin N, Nakanishi K, Sparrow JR, 2002. Biosynthetic studies of A2E, a major fluorophore of retinal pigment epithelial lipofuscin. J Biol Chem 277, 7183–7190. [DOI] [PubMed] [Google Scholar]
- Bergmann M, Schutt F, Holz FG, Kopitz J, 2004. Inhibition of the ATP-driven proton pump in RPE lysosomes by the major lipofuscin fluorophore A2-E may contribute to the pathogenesis of age-related macular degeneration. FASEB J 18, 562–564. [DOI] [PubMed] [Google Scholar]
- Biarnes M, Arias L, Alonso J, Garcia M, Hijano M, Rodriguez A, Serrano A, Badal J, Muhtaseb H, Verdaguer P, Mones J, 2015. Increased Fundus Autofluorescence and Progression of Geographic Atrophy Secondary to Age-Related Macular Degeneration: The GAIN Study. Am J Ophthalmol 160, 345–353 e345. [DOI] [PubMed] [Google Scholar]
- Brandstetter C, Mohr LK, Latz E, Holz FG, Krohne TU, 2015. Light induces NLRP3 inflammasome activation in retinal pigment epithelial cells via lipofuscin-mediated photooxidative damage. J Mol Med (Berl) 93, 905–916. [DOI] [PMC free article] [PubMed] [Google Scholar]
- Campisi J, d’Adda di Fagagna F, 2007. Cellular senescence: when bad things happen to good cells. Nature reviews. Molecular cell biology 8, 729–740. [DOI] [PubMed] [Google Scholar]
- Campisi J, Robert L, 2014. Cell senescence: role in aging and age-related diseases. Interdiscip Top Gerontol 39, 45–61. [DOI] [PMC free article] [PubMed] [Google Scholar]
- Chen Y, McMillan-Ward E, Kong J, Israels SJ, Gibson SB, 2008. Oxidative stress induces autophagic cell death independent of apoptosis in transformed and cancer cells. Cell Death Differ 15, 171–182. [DOI] [PubMed] [Google Scholar]
- Chikuba K, Yubisui T, Shirabe K, Takeshita M, 1994. Cloning and nucleotide sequence of a cDNA of the human erythrocyte NADPH-flavin reductase. Biochem Biophys Res Commun 198, 1170–1176. [DOI] [PubMed] [Google Scholar]
- Choi J, Zhang W, Gu X, Chen X, Hong L, Laird JM, Salomon RG, 2011. Lysophosphatidylcholine is generated by spontaneous deacylation of oxidized phospholipids. Chem Res Toxicol 24, 111–118. [DOI] [PMC free article] [PubMed] [Google Scholar]
- Ciccone L, Lee W, Zernant J, Tanaka K, Schuerch K, Tsang SH, Allikmets R, 2017. Hyperreflective Deposition in the Background of Advanced Stargardt Disease. Retina. [DOI] [PMC free article] [PubMed] [Google Scholar]
- Collier RJ, Patel Y, Martin EA, Dembinska O, Hellberg M, Krueger DS, Kapin MA, Romano C, 2011. Agonists at the serotonin receptor (5-HT(1A)) protect the retina from severe photo-oxidative stress. Invest Ophthalmol Vis Sci 52, 2118–2126. [DOI] [PubMed] [Google Scholar]
- Crabb JW, Miyagi M, Gu X, Shadrach K, West KA, Sakaguchi H, Kamei M, Hasan A, Yan L, Rayborn ME, Salomon RG, Hollyfield JG, 2002. Drusen proteome analysis: an approach to the etiology of age-related macular degeneration. Proc Natl Acad Sci U S A 99, 14682–14687. [DOI] [PMC free article] [PubMed] [Google Scholar]
- Cruz-Guilloty F, Saeed AM, Duffort S, Cano M, Ebrahimi KB, Ballmick A, Tan Y, Wang H, Laird JM, Salomon RG, Handa JT, Perez VL, 2014. T cells and macrophages responding to oxidative damage cooperate in pathogenesis of a mouse model of age-related macular degeneration. PLoS One 9, e88201. [DOI] [PMC free article] [PubMed] [Google Scholar]
- Csallany AS, Kim SS, Gallaher DD, 2000. Response of urinary lipophilic aldehydes and related carbonyl compounds to factors that stimulate lipid peroxidation in vivo. Lipids 35, 855–862. [DOI] [PubMed] [Google Scholar]
- Davies S, Elliott MH, Floor E, Truscott TG, Zareba M, Sarna T, Shamsi FA, Boulton ME, 2001. Photocytotoxicity of lipofuscin in human retinal pigment epithelial cells. Free Radic Biol Med 31, 256–265. [DOI] [PubMed] [Google Scholar]
- de Jong PT, 2006. Age-related macular degeneration. N Engl J Med 355, 1474–1485. [DOI] [PubMed] [Google Scholar]
- Debacq-Chainiaux F, Erusalimsky JD, Campisi J, Toussaint O, 2009. Protocols to detect senescence- associated beta-galactosidase (SA-betagal) activity, a biomarker of senescent cells in culture and in vivo. Nature protocols 4, 1798–1806. [DOI] [PubMed] [Google Scholar]
- Delori FC, Goger DG, Dorey CK, 2001. Age-related accumulation and spatial distribution of lipofuscin in RPE of normal subjects. Invest Ophthalmol Vis Sci 42, 1855–1866. [PubMed] [Google Scholar]
- Dimri GP, Lee X, Basile G, Acosta M, Scott G, Roskelley C, Medrano EE, Linskens M, Rubelj I, Pereira-Smith O, et al. , 1995. A biomarker that identifies senescent human cells in culture and in aging skin in vivo. Proc Natl Acad Sci U S A 92, 9363–9367. [DOI] [PMC free article] [PubMed] [Google Scholar]
- Dontsov AE, Glickman RD, Ostrovsky MA, 1999. Retinal pigment epithelium pigment granules stimulate the photo-oxidation of unsaturated fatty acids. Free Radic Biol Med 26, 1436–1446. [DOI] [PubMed] [Google Scholar]
- Dorey CK, Delori FC, Akeo K, 1990. Growth of cultured RPE and endothelial cells is inhibited by blue light but not green or red light. Current eye research 9, 549–559. [DOI] [PubMed] [Google Scholar]
- Dysli C, Wolf S, Hatz K, Zinkernagel MS, 2016. Fluorescence Lifetime Imaging in Stargardt Disease: Potential Marker for Disease Progression. Invest Ophthalmol Vis Sci 57, 832–841. [DOI] [PubMed] [Google Scholar]
- Ebrahem Q, Renganathan K, Sears J, Vasanji A, Gu X, Lu L, Salomon RG, Crabb JW, Anand- Apte B, 2006. Carboxyethylpyrrole oxidative protein modifications stimulate neovascularization: Implications for age-related macular degeneration. Proc Natl Acad Sci U S A 103, 13480–13484. [DOI] [PMC free article] [PubMed] [Google Scholar]
- Eldred GE, Katz ML, 1988. Fluorophores of the human retinal pigment epithelium: separation and spectral characterization. Exp Eye Res 47, 71–86. [DOI] [PubMed] [Google Scholar]
- Eldred GE, Lasky MR, 1993. Retinal age pigments generated by self-assembling lysosomotropic detergents. Nature 361, 724–726. [DOI] [PubMed] [Google Scholar]
- Feeney-Burns L, Hilderbrand ES, Eldridge S, 1984. Aging human RPE: morphometric analysis of macular, equatorial, and peripheral cells. Invest Ophthalmol Vis Sci 25, 195–200. [PubMed] [Google Scholar]
- Finnemann SC, Leung LW, Rodriguez-Boulan E, 2002. The lipofuscin component A2E selectively inhibits phagolysosomal degradation of photoreceptor phospholipid by the retinal pigment epithelium. Proc Natl Acad Sci U S A 99, 3842–3847. [DOI] [PMC free article] [PubMed] [Google Scholar]
- Fletcher AE, 2010. Free radicals, antioxidants and eye diseases: evidence from epidemiological studies on cataract and age-related macular degeneration. Ophthalmic Res 44, 191–198. [DOI] [PubMed] [Google Scholar]
- Fletcher AE, Bentham GC, Agnew M, Young IS, Augood C, Chakravarthy U, de Jong PT, Rahu M, Seland J, Soubrane G, Tomazzoli L, Topouzis F, Vingerling JR, Vioque J, 2008. Sunlight exposure, antioxidants, and age-related macular degeneration. Arch Ophthalmol 126, 1396–1403. [DOI] [PubMed] [Google Scholar]
- Flores-Bellver M, Bonet-Ponce L, Barcia JM, Garcia-Verdugo JM, Martinez-Gil N, Saez-Atienzar S, Sancho-Pelluz J, Jordan J, Galindo MF, Romero FJ, 2014. Autophagy and mitochondrial alterations in human retinal pigment epithelial cells induced by ethanol: implications of 4-hydroxy-nonenal. Cell Death Dis 5, e1328. [DOI] [PMC free article] [PubMed] [Google Scholar]
- Gaillard ER, Atherton SJ, Eldred G, Dillon J, 1995. Photophysical studies on human retinal lipofuscin. Photochem Photobiol 61, 448–453. [DOI] [PubMed] [Google Scholar]
- Gaillard ER, Avalle LB, Keller LM, Wang Z, Reszka KJ, Dillon JP, 2004. A mechanistic study of the photooxidation of A2E, a component of human retinal lipofuscin. Exp Eye Res 79, 313–319. [DOI] [PubMed] [Google Scholar]
- Giovannini C, Matarrese P, Scazzocchio B, Sanchez M, Masella R, Malorni W, 2002. Mitochondria hyperpolarization is an early event in oxidized low-density lipoprotein-induced apoptosis in Caco-2 intestinal cells. FEBS letters 523, 200–206. [DOI] [PubMed] [Google Scholar]
- Gliem M, Muller PL, Finger RP, McGuinness MB, Holz FG, Charbel Issa P, 2016. Quantitative Fundus Autofluorescence in Early and Intermediate Age-Related Macular Degeneration. JAMA Ophthalmol 134, 817–824. [DOI] [PubMed] [Google Scholar]
- Gomez-Sintes R, Ledesma MD, Boya P, 2016. Lysosomal cell death mechanisms in aging. Ageing Res Rev 32, 150–168. [DOI] [PubMed] [Google Scholar]
- Green DR, Reed JC, 1998. Mitochondria and apoptosis. Science 281, 1309–1312. [DOI] [PubMed] [Google Scholar]
- Gu J, Pauer GJ, Yue X, Narendra U, Sturgill GM, Bena J, Gu X, Peachey NS, Salomon RG, Hagstrom SA, Crabb JW, Clinical G, Proteomic AMDSG, 2009. Assessing susceptibility to age- related macular degeneration with proteomic and genomic biomarkers. Mol Cell Proteomics 8, 1338–1349. [DOI] [PMC free article] [PubMed] [Google Scholar]
- Gu J, Pauer GJ, Yue X, Narendra U, Sturgill GM, Bena J, Gu X, Peachey NS, Salomon RG, Hagstrom SA, Crabb JW, Clinical G, Proteomic AMDSG, 2010. Proteomic and genomic biomarkers for age-related macular degeneration. Adv Exp Med Biol 664, 411–417. [DOI] [PubMed] [Google Scholar]
- Gu X, Meer SG, Miyagi M, Rayborn ME, Hollyfield JG, Crabb JW, Salomon RG, 2003a. Carboxyethylpyrrole protein adducts and autoantibodies, biomarkers for age-related macular degeneration. J Biol Chem 278, 42027–42035. [DOI] [PubMed] [Google Scholar]
- Gu X, Sun M, Gugiu B, Hazen S, Crabb JW, Salomon RG, 2003b. Oxidatively truncated docosahexaenoate phospholipids: total synthesis, generation, and Peptide adduction chemistry. J Org Chem 68, 3749–3761. [DOI] [PubMed] [Google Scholar]
- Guo J, Linetsky M, Yu AO, Zhang L, Howell SJ, Folkwein HJ, Wang H, Salomon RG, 2016a. 4-Hydroxy-7-oxo-5-heptenoic Acid Lactone Induces Angiogenesis through Several Different Molecular Pathways. Chem Res Toxicol 29, 2125–2135. [DOI] [PMC free article] [PubMed] [Google Scholar]
- Guo J, Wang H, Hrinczenko B, Salomon RG, 2016b. Efficient Quantitative Analysis of Carboxyalkylpyrrole Ethanolamine Phospholipids: Elevated Levels in Sickle Cell Disease Blood. Chem Res Toxicol 29, 1187–1197. [DOI] [PMC free article] [PubMed] [Google Scholar]
- Ham WT Jr., Mueller HA, Ruffolo JJ Jr., Clarke AM, 1979. Sensitivity of the retina to radiation damage as a function of wavelength. Photochem Photobiol 29, 735–743. [DOI] [PubMed] [Google Scholar]
- Ham WT Jr., Ruffolo JJ Jr., Mueller HA, Clarke AM, Moon ME, 1978. Histologic analysis of photochemical lesions produced in rhesus retina by short-wave-length light. Invest Ophthalmol Vis Sci 17, 1029–1035. [PubMed] [Google Scholar]
- Ham WT Jr., Ruffolo JJ Jr., Mueller HA, Guerry D 3rd, 1980. The nature of retinal radiation damage: dependence on wavelength, power level and exposure time. Vision Res 20, 1105–1111. [DOI] [PubMed] [Google Scholar]
- Harwerth RS, Sperling HG, 1975. Effects of intense visible radiation on the increment-threshold spectral sensitivity of the rhesus monkey eye. Vision Res 15, 1193–1204. [DOI] [PubMed] [Google Scholar]
- Hidalgo FJ, Alaiz M, Zamora R, 2001. Pyrrolization and antioxidant function of proteins following oxidative stress. Chem Res Toxicol 14, 582–588. [DOI] [PubMed] [Google Scholar]
- Hollyfield JG, Bonilha VL, Rayborn ME, Yang X, Shadrach KG, Lu L, Ufret RL, Salomon RG, Perez VL, 2008. Oxidative damage-induced inflammation initiates age-related macular degeneration. Nat Med 14, 194–198. [DOI] [PMC free article] [PubMed] [Google Scholar]
- Holz FG, Bellmann C, Margaritidis M, Schutt F, Otto TP, Volcker HE, 1999a. Patterns of increased in vivo fundus autofluorescence in the junctional zone of geographic atrophy of the retinal pigment epithelium associated with age-related macular degeneration. Graefes Arch Clin Exp Ophthalmol 237, 145–152. [DOI] [PubMed] [Google Scholar]
- Holz FG, Schutt F, Kopitz J, Eldred GE, Kruse FE, Volcker HE, Cantz M, 1999b. Inhibition of lysosomal degradative functions in RPE cells by a retinoid component of lipofuscin. Invest Ophthalmol Vis Sci 40, 737–743. [PubMed] [Google Scholar]
- Honda S, Hjelmeland LM, Handa JT, 2002. Senescence associated beta galactosidase activity in human retinal pigment epithelial cells exposed to mild hyperoxia in vitro. Br J Ophthalmol 86, 159–162. [DOI] [PMC free article] [PubMed] [Google Scholar]
- Hunter JJ, Morgan JI, Merigan WH, Sliney DH, Sparrow JR, Williams DR, 2012. The susceptibility of the retina to photochemical damage from visible light. Prog Retin Eye Res 31, 28–42. [DOI] [PMC free article] [PubMed] [Google Scholar]
- Isahara K, Ohsawa Y, Kanamori S, Shibata M, Waguri S, Sato N, Gotow T, Watanabe T, Momoi T, Urase K, Kominami E, Uchiyama Y, 1999. Regulation of a novel pathway for cell death by lysosomal aspartic and cysteine proteinases. Neuroscience 91, 233–249. [DOI] [PubMed] [Google Scholar]
- Justilien V, Pang JJ, Renganathan K, Zhan X, Crabb JW, Kim SR, Sparrow JR, Hauswirth WW, Lewin AS, 2007. SOD2 knockdown mouse model of early AMD. Invest Ophthalmol Vis Sci 48, 4407–4420. [DOI] [PMC free article] [PubMed] [Google Scholar]
- Kadenbach B, 2003. Intrinsic and extrinsic uncoupling of oxidative phosphorylation. Biochimica et Biophysica Acta (BBA) - Bioenergetics 1604, 77–94. [DOI] [PubMed] [Google Scholar]
- Kato S, Osborne NN, Tamai M, International Symposium on “Retinal, D., Regeneration, Retinal degeneration and regeneration : proceedings of an international symposium, Kanazawa, Japan, July 8–9, 1995 Kugler Publications, Amsterdam; New York. [Google Scholar]
- Katz ML, 2002. Potential role of retinal pigment epithelial lipofuscin accumulation in age-related macular degeneration. Arch Gerontol Geriatr 34, 359–370. [DOI] [PubMed] [Google Scholar]
- Kersten E, Paun CC, Schellevis RL, Hoyng CB, Delcourt C, Lengyel I, Peto T, Ueffing M, Klaver CCW, Dammeier S, den Hollander AI, de Jong EK, 2018. Systemic and ocular fluid compounds as potential biomarkers in age-related macular degeneration. Surv Ophthalmol 63, 9–39. [DOI] [PubMed] [Google Scholar]
- Kirkinezos IG, Bacman SR, Hernandez D, Oca-Cossio J, Arias LJ, Perez-Pinzon MA, Bradley WG, Moraes CT, 2005. Cytochrome c association with the inner mitochondrial membrane is impaired in the CNS of G93A-SOD1 mice. The Journal of neuroscience : the official journal of the Society for Neuroscience 25, 164–172. [DOI] [PMC free article] [PubMed] [Google Scholar]
- Kliffen M, van der Schaft TL, Mooy CM, de Jong PT, 1997. Morphologic changes in age-related maculopathy. Microsc Res Tech 36, 106–122. [DOI] [PubMed] [Google Scholar]
- Kozlowski MR, 2012. RPE cell senescence: a key contributor to age-related macular degeneration. Med Hypotheses 78, 505–510. [DOI] [PubMed] [Google Scholar]
- Krajewski S, Krajewska M, Ellerby LM, Welsh K, Xie Z, Deveraux QL, Salvesen GS, Bredesen E, Rosenthal RE, Fiskum G, Reed JC, 1999. Release of caspase-9 from mitochondria during neuronal apoptosis and cerebral ischemia. Proc Natl Acad Sci U S A 96, 5752–5757. [DOI] [PMC free article] [PubMed] [Google Scholar]
- Law CY, Siu CW, Fan K, Lai WH, Au KW, Lau YM, Wong LY, Ho JCY, Lee YK, Tse HF, Ng KM, 2016. Lysosomal membrane permeabilization is involved in oxidative stress-induced apoptotic cell death in LAMP2-deficient iPSCs-derived cerebral cortical neurons. Biochem Biophys Rep 5, 335–345. [DOI] [PMC free article] [PubMed] [Google Scholar]
- Lee BY, Han JA, Im JS, Morrone A, Johung K, Goodwin EC, Kleijer WJ, DiMaio D, Hwang ES, 2006. Senescence-associated beta-galactosidase is lysosomal beta-galactosidase. Aging Cell 5, 187–195. [DOI] [PubMed] [Google Scholar]
- Lerman S, 1987. Chemical and physical properties of the normal and aging lens: spectroscopic (UV, fluorescence, phosphorescence, and NMR) analyses. Am J Optom Physiol Opt 64, 11–22. [DOI] [PubMed] [Google Scholar]
- Li KR, Yang SQ, Gong YQ, Yang H, Li XM, Zhao YX, Yao J, Jiang Q, Cao C, 2016. 3H-1,2- dithiole-3-thione protects retinal pigment epithelium cells against Ultra-violet radiation via activation of Akt- mTORC1-dependent Nrf2-HO-1 signaling. Scientific reports 6, 25525. [DOI] [PMC free article] [PubMed] [Google Scholar]
- Li X, Liu Z, Luo C, Jia H, Sun L, Hou B, Shen W, Packer L, Cotman CW, Liu J, 2008. Lipoamide protects retinal pigment epithelial cells from oxidative stress and mitochondrial dysfunction. Free Radic Biol Med 44, 1465–1474. [DOI] [PMC free article] [PubMed] [Google Scholar]
- Liang FQ, Godley BF, 2003. Oxidative stress-induced mitochondrial DNA damage in human retinal pigment epithelial cells: a possible mechanism for RPE aging and age-related macular degeneration. Exp Eye Res 76, 397–403. [DOI] [PubMed] [Google Scholar]
- Liu J, Itagaki Y, Ben-Shabat S, Nakanishi K, Sparrow JR, 2000. The biosynthesis of A2E, a fluorophore of aging retina, involves the formation of the precursor, A2-PE, in the photoreceptor outer segment membrane. J Biol Chem 275, 29354–29360. [DOI] [PubMed] [Google Scholar]
- Liu J, Lu W, Reigada D, Nguyen J, Laties AM, Mitchell CH, 2008. Restoration of lysosomal pH in RPE cells from cultured human and ABCA4(−/−) mice: pharmacologic approaches and functional recovery. Invest Ophthalmol Vis Sci 49, 772–780. [DOI] [PMC free article] [PubMed] [Google Scholar]
- Logan A, Pell VR, Shaffer KJ, Evans C, Stanley NJ, Robb EL, Prime TA, Chouchani ET, Cocheme HM, Fearnley IM, Vidoni S, James AM, Porteous CM, Partridge L, Krieg T, Smith RA, Murphy MP, 2016. Assessing the Mitochondrial Membrane Potential in Cells and In Vivo using Targeted Click Chemistry and Mass Spectrometry. Cell metabolism 23, 379–385. [DOI] [PMC free article] [PubMed] [Google Scholar]
- Lovelace MD, Cahill DM, 2007. A rapid cell counting method utilising acridine orange as a novel discriminating marker for both cultured astrocytes and microglia. J Neurosci Methods 165, 223–229. [DOI] [PubMed] [Google Scholar]
- Ly JD, Grubb DR, Lawen A, 2003. The mitochondrial membrane potential (deltapsi(m)) in apoptosis; an update. Apoptosis 8, 115–128. [DOI] [PubMed] [Google Scholar]
- Maeda A, Maeda T, Golczak M, Chou S, Desai A, Hoppel CL, Matsuyama S, Palczewski K, 2009. Involvement of all-trans-retinal in acute light-induced retinopathy of mice. J Biol Chem 284, 15173–15183. [DOI] [PMC free article] [PubMed] [Google Scholar]
- Maeda A, Maeda T, Golczak M, Palczewski K, 2008. Retinopathy in mice induced by disrupted all- trans-retinal clearance. J Biol Chem 283, 26684–26693. [DOI] [PMC free article] [PubMed] [Google Scholar]
- Maeda T, Golczak M, Maeda A, 2012. Retinal photodamage mediated by all-trans-retinal. Photochem Photobiol 88, 1309–1319. [DOI] [PMC free article] [PubMed] [Google Scholar]
- Mainster MA, 1986. The spectra, classification, and rationale of ultraviolet-protective intraocular lenses. Am J Ophthalmol 102, 727–732. [DOI] [PubMed] [Google Scholar]
- Marazita MC, Dugour A, Marquioni-Ramella MD, Figueroa JM, Suburo AM, 2016. Oxidative stress-induced premature senescence dysregulates VEGF and CFH expression in retinal pigment epithelial cells: Implications for Age-related Macular Degeneration. Redox biology 7, 78–87. [DOI] [PMC free article] [PubMed] [Google Scholar]
- Marc RE, Jones BW, Watt CB, Vazquez-Chona F, Vaughan DK, Organisciak DT, 2008. Extreme retinal remodeling triggered by light damage: implications for age related macular degeneration. Mol Vis 14, 782–806. [PMC free article] [PubMed] [Google Scholar]
- Marie M, Bigot K, Angebault C, Barrau C, Gondouin P, Pagan D, Fouquet S, Villette T, Sahel JA, Lenaers G, Picaud S, 2018. Light action spectrum on oxidative stress and mitochondrial damage in A2E-loaded retinal pigment epithelium cells. Cell Death Dis 9, 287. [DOI] [PMC free article] [PubMed] [Google Scholar]
- Matsumoto K, Yamada Y, Takahashi M, Todoroki T, Mizoguchi K, Misaki H, Yuki H, 1990. Fluorometric determination of carnitine in serum with immobilized carnitine dehydrogenase and diaphorase. Clin Chem 36, 2072–2076. [PubMed] [Google Scholar]
- Matsunaga H, Handa JT, Aotaki-Keen A, Sherwood SW, West MD, Hjelmeland LM, 1999. Beta- galactosidase histochemistry and telomere loss in senescent retinal pigment epithelial cells. Invest Ophthalmol Vis Sci 40, 197–202. [PubMed] [Google Scholar]
- Naggar H, Van Ells TK, Ganapathy V, Smith SB, 2005. Regulation of reduced-folate transporter-1 in retinal pigment epithelial cells by folate. Current eye research 30, 35–44. [PMC free article] [PubMed] [Google Scholar]
- Newsome DA, Swartz M, Leone NC, Elston RC, Miller E, 1988. Oral zinc in macular degeneration. Arch Ophthalmol 106, 192–198. [DOI] [PubMed] [Google Scholar]
- Noell WK, 1980. Possible mechanisms of photoreceptor damage by light in mammalian eyes. Vision Res 20, 1163–1171. [DOI] [PubMed] [Google Scholar]
- Noell WK, Walker VS, Kang BS, Berman S, 1966. Retinal damage by light in rats. Invest Ophthalmol 450–473. [PubMed] [Google Scholar]
- Nowak JZ, 2013. Oxidative stress, polyunsaturated fatty acids-derived oxidation products and bisretinoids as potential inducers of CNS diseases: focus on age-related macular degeneration. Pharmacol Rep 65, 288–304. [DOI] [PubMed] [Google Scholar]
- Organisciak DT, Darrow RM, Rapp CM, Smuts JP, Armstrong DW, Lang JC, 2013. Prevention of retinal light damage by zinc oxide combined with rosemary extract. Mol Vis 19, 1433–1445. [PMC free article] [PubMed] [Google Scholar]
- Organisciak DT, Vaughan DK, 2010. Retinal light damage: mechanisms and protection. Prog Retin Eye Res 29, 113–134. [DOI] [PMC free article] [PubMed] [Google Scholar]
- Parish CA, Hashimoto M, Nakanishi K, Dillon J, Sparrow J, 1998. Isolation and one-step preparation of A2E and iso-A2E, fluorophores from human retinal pigment epithelium. Proc Natl Acad Sci U S A 95, 14609–14613. [DOI] [PMC free article] [PubMed] [Google Scholar]
- Perl A, Gergely P Jr., Nagy G, Koncz A, Banki K, 2004. Mitochondrial hyperpolarization: a checkpoint of T-cell life, death and autoimmunity. Trends in immunology 25, 360–367. [DOI] [PMC free article] [PubMed] [Google Scholar]
- Petit PX, Lecoeur H, Zorn E, Dauguet C, Mignotte B, Gougeon ML, 1995. Alterations in mitochondrial structure and function are early events of dexamethasone-induced thymocyte apoptosis. The Journal of cell biology 130, 157–167. [DOI] [PMC free article] [PubMed] [Google Scholar]
- Pietila M, Lehtonen S, Tuovinen E, Lahteenmaki K, Laitinen S, Leskela HV, Natynki A, Pesala J, Nordstrom K, Lehenkari P, 2012. CD200 positive human mesenchymal stem cells suppress TNF-alpha secretion from CD200 receptor positive macrophage-like cells. PLoS One 7, e31671. [DOI] [PMC free article] [PubMed] [Google Scholar]
- Poliakov E, Strunnikova NV, Jiang JK, Martinez B, Parikh T, Lakkaraju A, Thomas C, Brooks BP, Redmond TM, 2014. Multiple A2E treatments lead to melanization of rod outer segment-challenged ARPE-19 cells. Mol Vis 20, 285–300. [PMC free article] [PubMed] [Google Scholar]
- Radu RA, Mata NL, Bagla A, Travis GH, 2004. Light exposure stimulates formation of A2E oxiranes in a mouse model of Stargardt’s macular degeneration. Proc Natl Acad Sci U S A 101, 5928–5933. [DOI] [PMC free article] [PubMed] [Google Scholar]
- Rahman I, Kode A, Biswas SK, 2006. Assay for quantitative determination of glutathione and glutathione disulfide levels using enzymatic recycling method. Nature protocols 1, 3159–3165. [DOI] [PubMed] [Google Scholar]
- Rajapakse D, Curtis T, Chen M, Xu H, 2017. Zinc Protects Oxidative Stress-Induced RPE Death by Reducing Mitochondrial Damage and Preventing Lysosome Rupture. Oxid Med Cell Longev 2017, 6926485. [DOI] [PMC free article] [PubMed] [Google Scholar]
- Rampersad SN, 2012. Multiple applications of Alamar Blue as an indicator of metabolic function and cellular health in cell viability bioassays. Sensors (Basel) 12, 12347–12360. [DOI] [PMC free article] [PubMed] [Google Scholar]
- Reme CE, 2005. The dark side of light: rhodopsin and the silent death of vision the proctor lecture. Invest Ophthalmol Vis Sci 46, 2671–2682. [DOI] [PubMed] [Google Scholar]
- Renganathan K, Gu J, Rayborn ME, Crabb JS, Salomon RG, Collier RJ, Kapin MA, Romano C, Hollyfield JG, Crabb JW, 2013. CEP biomarkers as potential tools for monitoring therapeutics. PLoS One 8, e76325. [DOI] [PMC free article] [PubMed] [Google Scholar]
- Reszka K, Eldred GE, Wang RH, Chignell C, Dillon J, 1995. The photochemistry of human retinal lipofuscin as studied by EPR. Photochem Photobiol 62, 1005–1008. [DOI] [PubMed] [Google Scholar]
- Rodrigues CM, Sola S, Silva R, Brites D, 2000. Bilirubin and amyloid-beta peptide induce cytochrome c release through mitochondrial membrane permeabilization. Mol Med 6, 936–946. [PMC free article] [PubMed] [Google Scholar]
- Rodriguez-Muela N, Koga H, Garcia-Ledo L, de la Villa P, de la Rosa EJ, Cuervo AM, Boya P, 2013. Balance between autophagic pathways preserves retinal homeostasis. Aging Cell 12, 478–488. [DOI] [PMC free article] [PubMed] [Google Scholar]
- Rodriguez de Turco EB, Parkins N, Ershov AV, Bazan NG, 1999. Selective retinal pigment epithelial cell lipid metabolism and remodeling conserves photoreceptor docosahexaenoic acid following phagocytosis. Journal of neuroscience research 57, 479–486. [PubMed] [Google Scholar]
- Rozanowska M, Jarvis-Evans J, Korytowski W, Boulton ME, Burke JM, Sarna T, 1995. Blue light- induced reactivity of retinal age pigment. In vitro generation of oxygen-reactive species. J Biol Chem 270, 18825–18830. [DOI] [PubMed] [Google Scholar]
- Rozanowska M, Pawlak A, Rozanowski B, Skumatz C, Zareba M, Boulton ME, Burke JM, Sarna T, Simon JD, 2004. Age-related changes in the photoreactivity of retinal lipofuscin granules: role of chloroform-insoluble components. Invest Ophthalmol Vis Sci 45, 1052–1060. [DOI] [PubMed] [Google Scholar]
- Rozanowska M, Sarna T, 2005. Light-induced damage to the retina: role of rhodopsin chromophore revisited. Photochem Photobiol 81, 1305–1330. [DOI] [PubMed] [Google Scholar]
- Rozanowska M, Wessels J, Boulton M, Burke JM, Rodgers MA, Truscott TG, Sarna T, 1998. Blue light-induced singlet oxygen generation by retinal lipofuscin in non-polar media. Free Radic Biol Med 24, 1107–1112. [DOI] [PubMed] [Google Scholar]
- Rozanowska MB, 2012. Light-induced damage to the retina: current understanding of the mechanisms and unresolved questions: a symposium-in-print. Photochem Photobiol 88, 1303–1308. [DOI] [PubMed] [Google Scholar]
- Rudolf M, Vogt SD, Curcio CA, Huisingh C, McGwin G Jr., Wagner A, Grisanti S, Read RW, 2013. Histologic basis of variations in retinal pigment epithelium autofluorescence in eyes with geographic atrophy. Ophthalmology 120, 821–828. [DOI] [PMC free article] [PubMed] [Google Scholar]
- Sadhukhan S, Han Y, Jin Z, Tochtrop GP, Zhang GF, 2014. Glutathionylated 4-hydroxy-2-(E)- alkenal enantiomers in rat organs and their contributions toward the disposal of 4-hydroxy-2-(E)-nonenal in rat liver. Free Radic Biol Med 70, 78–85. [DOI] [PMC free article] [PubMed] [Google Scholar]
- Salomon RG, 2017. Carboxyethylpyrroles: From Hypothesis to the Discovery of Biologically Active Natural Products. Chem Res Toxicol 30, 105–113. [DOI] [PMC free article] [PubMed] [Google Scholar]
- Salomon RG, Gu X, 2011. Critical insights into cardiovascular disease from basic research on the oxidation of phospholipids: the gamma-hydroxyalkenal phospholipid hypothesis. Chem Res Toxicol 24, 1791–1802. [DOI] [PMC free article] [PubMed] [Google Scholar]
- SanGiovanni JP, Chew EY, 2005. The role of omega-3 long-chain polyunsaturated fatty acids in health and disease of the retina. Prog Retin Eye Res 24, 87–138. [DOI] [PubMed] [Google Scholar]
- Schutt F, Bergmann M, Holz FG, Dithmar S, Volcker HE, Kopitz J, 2007. Accumulation of A2-E in mitochondrial membranes of cultured RPE cells. Graefes Arch Clin Exp Ophthalmol 245, 391–398. [DOI] [PubMed] [Google Scholar]
- Schutt F, Davies S, Kopitz J, Holz FG, Boulton ME, 2000. Photodamage to human RPE cells by A2- a retinoid component of lipofuscin. Invest Ophthalmol Vis Sci 41, 2303–2308. [PubMed] [Google Scholar]
- Serrano-Puebla A, Boya P, 2016. Lysosomal membrane permeabilization in cell death: new evidence and implications for health and disease. Ann N Y Acad Sci 1371, 30–44. [DOI] [PubMed] [Google Scholar]
- Sohaebuddin SK, Tang L, 2013. A simple method to visualize and assess the integrity of lysosomal membrane in mammalian cells using a fluorescent dye. Methods Mol Biol 991, 25–31. [DOI] [PubMed] [Google Scholar]
- Sparrow JR, Nakanishi K, Parish CA, 2000. The lipofuscin fluorophore A2E mediates blue light- induced damage to retinal pigmented epithelial cells. Invest Ophthalmol Vis Sci 41, 1981–1989. [PubMed] [Google Scholar]
- Sparrow JR, Parish CA, Hashimoto M, Nakanishi K, 1999. A2E, a lipofuscin fluorophore, in human retinal pigmented epithelial cells in culture. Invest Ophthalmol Vis Sci 40, 2988–2995. [PubMed] [Google Scholar]
- Sparrow JR, Vollmer-Snarr HR, Zhou J, Jang YP, Jockusch S, Itagaki Y, Nakanishi K, 2003. A2E-epoxides damage DNA in retinal pigment epithelial cells. Vitamin E and other antioxidants inhibit A2E-epoxide formation. J Biol Chem 278, 18207–18213. [DOI] [PubMed] [Google Scholar]
- Sparrow JR, Wu Y, Kim CY, Zhou J, 2010. Phospholipid meets all-trans-retinal: the making of RPE bisretinoids. Journal of lipid research 51, 247–261. [DOI] [PMC free article] [PubMed] [Google Scholar]
- Sparrow JR, Zhou J, Ben-Shabat S, Vollmer H, Itagaki Y, Nakanishi K, 2002. Involvement of oxidative mechanisms in blue-light-induced damage to A2E-laden RPE. Invest Ophthalmol Vis Sci 43, 1222–1227. [PubMed] [Google Scholar]
- Stoka V, Turk B, Schendel SL, Kim TH, Cirman T, Snipas SJ, Ellerby LM, Bredesen D, Freeze H, Abrahamson M, Bromme D, Krajewski S, Reed JC, Yin XM, Turk V, Salvesen GS, 2001. Lysosomal protease pathways to apoptosis. Cleavage of bid, not pro-caspases, is the most likely route. J Biol Chem 276, 3149–3157. [DOI] [PubMed] [Google Scholar]
- Sun M, Finnemann SC, Febbraio M, Shan L, Annangudi SP, Podrez EA, Hoppe G, Darrow R, Organisciak DT, Salomon RG, Silverstein RL, Hazen SL, 2006. Light-induced oxidation of photoreceptor outer segment phospholipids generates ligands for CD36-mediated phagocytosis by retinal pigment epithelium: a potential mechanism for modulating outer segment phagocytosis under oxidant stress conditions. J Biol Chem 281, 4222–4230. [DOI] [PMC free article] [PubMed] [Google Scholar]
- Susin SA, Zamzami N, Castedo M, Daugas E, Wang HG, Geley S, Fassy F, Reed JC, Kroemer G, 1997. The central executioner of apoptosis: multiple connections between protease activation and mitochondria in Fas/APO-1/CD95- and ceramide-induced apoptosis. The Journal of experimental medicine 186, 25–37. [DOI] [PMC free article] [PubMed] [Google Scholar]
- Suter M, Reme C, Grimm C, Wenzel A, Jaattela M, Esser P, Kociok N, Leist M, Richter C, 2000. Age-related macular degeneration. The lipofusion component N-retinyl-N-retinylidene ethanolamine detaches proapoptotic proteins from mitochondria and induces apoptosis in mammalian retinal pigment epithelial cells. J Biol Chem 275, 39625–39630. [DOI] [PubMed] [Google Scholar]
- Taylor HR, West S, Munoz B, Rosenthal FS, Bressler SB, Bressler NM, 1992. The long-term effects of visible light on the eye. Arch Ophthalmol 110, 99–104. [DOI] [PubMed] [Google Scholar]
- Tomany SC, Cruickshanks KJ, Klein R, Klein BE, Knudtson MD, 2004. Sunlight and the 10-year incidence of age-related maculopathy: the Beaver Dam Eye Study. Arch Ophthalmol 122, 750–757. [DOI] [PubMed] [Google Scholar]
- Uchimoto T, Nohara H, Kamehara R, Iwamura M, Watanabe N, Kobayashi Y, 1999. Mechanism of apoptosis induced by a lysosomotropic agent, L-Leucyl-L-Leucine methyl ester. Apoptosis 4, 357–362. [DOI] [PubMed] [Google Scholar]
- van Norren D, Gorgels TG, 2011. The action spectrum of photochemical damage to the retina: a review of monochromatic threshold data. Photochem Photobiol 87, 747–753. [DOI] [PubMed] [Google Scholar]
- Vives-Bauza C, Anand M, Shiraz AK, Magrane J, Gao J, Vollmer-Snarr HR, Manfredi G, Finnemann SC, 2008. The age lipid A2E and mitochondrial dysfunction synergistically impair phagocytosis by retinal pigment epithelial cells. J Biol Chem 283, 24770–24780. [DOI] [PMC free article] [PubMed] [Google Scholar]
- von Ruckmann A, Fitzke FW, Bird AC, 1997. Fundus autofluorescence in age-related macular disease imaged with a laser scanning ophthalmoscope. Invest Ophthalmol Vis Sci 38, 478–486. [PubMed] [Google Scholar]
- Wang H, Guo J, West XZ, Bid HK, Lu L, Hong L, Jang GF, Zhang L, Crabb JW, Clinical G, Proteomic AMDSG, Linetsky M, Salomon RG, 2014. Detection and biological activities of carboxyethylpyrrole ethanolamine phospholipids (CEP-EPs). Chem Res Toxicol 27, 2015–2022. [DOI] [PMC free article] [PubMed] [Google Scholar]
- Wang H, Linetsky M, Guo J, Choi J, Hong L, Chamberlain AS, Howell SJ, Howes AM, Salomon RG, 2015. 4-Hydroxy-7-oxo-5-heptenoic Acid (HOHA) Lactone is a Biologically Active Precursor for the Generation of 2-(omega-Carboxyethyl)pyrrole (CEP) Derivatives of Proteins and Ethanolamine Phospholipids. Chem Res Toxicol 28, 967–977. [DOI] [PMC free article] [PubMed] [Google Scholar]
- Wang H, Linetsky M, Guo J, Yu AO, Salomon RG, 2016. Metabolism of 4-Hydroxy-7-oxo-5- heptenoic Acid (HOHA) Lactone by Retinal Pigmented Epithelial Cells. Chem Res Toxicol 29, 1198–1210. [DOI] [PMC free article] [PubMed] [Google Scholar]
- Wang Y, Shen D, Wang VM, Yu CR, Wang RX, Tuo J, Chan CC, 2012. Enhanced apoptosis in retinal pigment epithelium under inflammatory stimuli and oxidative stress. Apoptosis 17, 1144–1155. [DOI] [PMC free article] [PubMed] [Google Scholar]
- Wassell J, Davies S, Bardsley W, Boulton M, 1999. The photoreactivity of the retinal age pigment lipofuscin. J Biol Chem 274, 23828–23832. [DOI] [PubMed] [Google Scholar]
- West XZ, Malinin NL, Merkulova AA, Tischenko M, Kerr BA, Borden EC, Podrez EA, Salomon RG, Byzova TV, 2010. Oxidative stress induces angiogenesis by activating TLR2 with novel endogenous ligands. Nature 467, 972–976. [DOI] [PMC free article] [PubMed] [Google Scholar]
- Winkler BS, Boulton ME, Gottsch JD, Sternberg P, 1999. Oxidative damage and age-related macular degeneration. Mol Vis 5, 32. [PMC free article] [PubMed] [Google Scholar]
- Wolf G, 2003. Lipofuscin and macular degeneration. Nutr Rev 61, 342–346. [DOI] [PubMed] [Google Scholar]
- Xu J, Chen S, Ku G, Ahmed SH, Xu J, Chen H, Hsu CY, 2001. Amyloid beta peptide-induced cerebral endothelial cell death involves mitochondrial dysfunction and caspase activation. J Cereb Blood Flow Metab 21, 702–710. [DOI] [PubMed] [Google Scholar]
- Yang D, Elner SG, Clark AJ, Hughes BA, Petty HR, Elner VM, 2011. Activation of P2X receptors induces apoptosis in human retinal pigment epithelium. Invest Ophthalmol Vis Sci 52, 1522–1530. [DOI] [PMC free article] [PubMed] [Google Scholar]
- Zareba M, Raciti MW, Henry MM, Sarna T, Burke JM, 2006. Oxidative stress in ARPE-19 cultures: do melanosomes confer cytoprotection? Free Radic Biol Med 40, 87–100. [DOI] [PubMed] [Google Scholar]
Associated Data
This section collects any data citations, data availability statements, or supplementary materials included in this article.