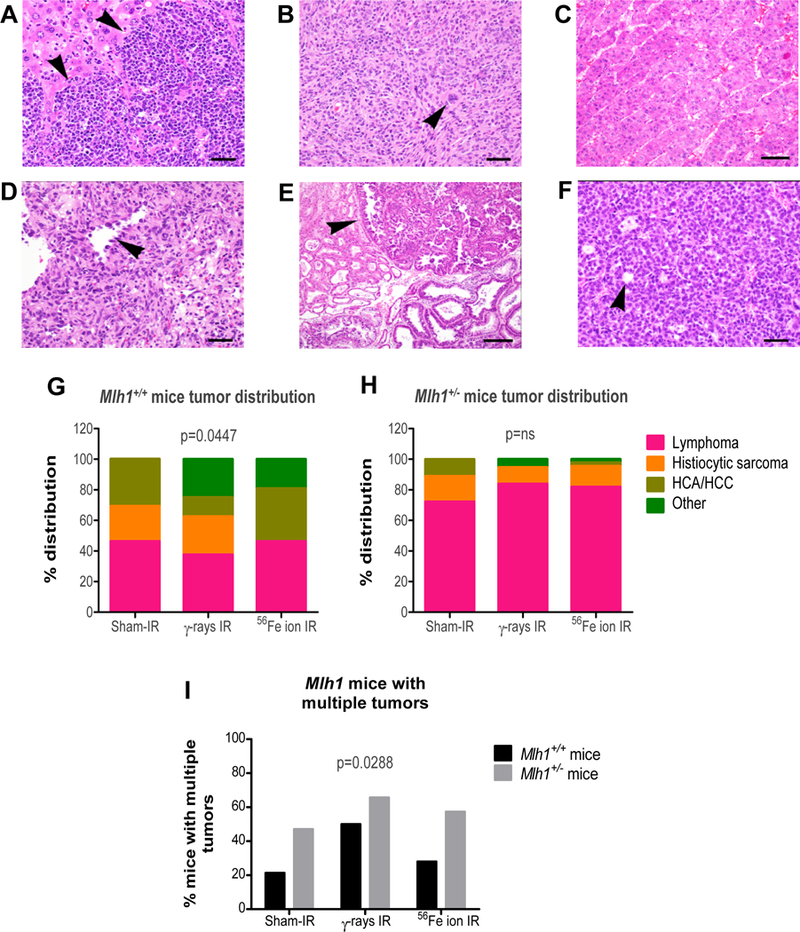
Figure 2: Histopathology of tumors from Mlh1+/+ and Mlh1+/− mice.

(A) Lymphoma in sections of liver, characterized by sheets of neoplastic lymphocytes infiltrating and effacing normal hepatic parenchyma (arrowheads) (40X, bar = 20um). (B) Histiocytic sarcoma composed of round to spindyloid neoplastic cells with occasional multinucleate giant cells (arrowhead) (20X, bar = 50um). (C) Hepatocellular carcinoma composed of lobules, cords, and trabeculae of atypical hepatocytes replacing normal parenchyma (bar = 50um). (D) Hemangiosarcoma composed of sheets and bundles of spindle-shaped cells forming haphazard vascular channels (arrowhead) lined by neoplastic endothelial cells (40X, bar = 20um). (E) Harderian gland adenoma characterized by an expansile proliferation (arrowhead) of tubules and acini of fairly well differentiated glandular epithelial cells (bar = 100um). (F) Ovarian granulosa cell tumor composed of solid lobules and nests of neoplastic cells often forming rudimentary follicular structures (arrowhead) (40X, bar = 20um). (G) Percentage tumor distribution based on histology of tumors collected from Mlh1+/+ mice treated with sham-, γ-, or 56Fe ion irradiation. (H) Percentage tumor distribution based on histology of tumors collected from Mlh1+/− mice treated with sham-, γ-, or 56Fe ion irradiation. (I) Aggressive cancer measured by percentage of mice with multiple tumor types or same tumor type in multiple organs. Histopathology was performed on 13–27 tumors of Mlh1+/+ origin and 18–44 tumors of Mlh1+/− origin. Tumor distribution was analyzed by Chi-square and multiple tumor incidence was analyzed by two-way ANOVA; ns = non-significant.
