Abstract
Both strain elastography and shear wave elastography have been shown to have high sensitivity and specificity for characterizing breast lesions as benign or malignant. Training is important for both strain and shear wave elastography. The unique feature of benign lesions measuring smaller on elastography than B-mode imaging and malignant lesions appearing larger on elastography is an important feature for characterization of breast masses. There are several artifacts which can contain diagnostic information or alert to technique problems. Both strain and shear wave elastography continue to have improvements and new techniques will soon be available for clinical use that may provide additional diagnostic information. This paper reviews the present state of breast elastography and discusses future techniques that are not yet in clinical practice.
Keywords: Breast, Elasticity imaging techniques, Strain, Shear wave, Strain ratio, Breast neoplasms
Introduction
The use of palpation to determine the stiffness of a lesion has been used since the time of the ancient Greeks and Egyptians [1]. Stiff, non-mobile lesions of the breast have a high probability of being malignant. In vitro experiments it has been shown that the difference in stiffness of malignant breast lesions and benign breast lesions is substantial with little overlap [2]. These characteristics of malignant breast masses suggest that elastography should have a high accuracy for characterization of breast lesions.
Both strain elastography (SE) and shear wave elastography (SWE) [3] have been used to evaluate breast pathology with high sensitivity and specificity. For reasons not fully understood malignant breast lesions appear larger on elastography compared to B-mode while benign lesions appear smaller. This has allowed for a semi-quantitative method in SE to characterize breast lesions. SWE can determine the lesion stiffness and determine with high probability of a lesion is benign or malignant. On SWE, some cancers have properties that do not allow for good shear wave propagation and may be interpreted as false negative lesions. This has been overcome by the addition of a quality measure (QM) which can detect the quality of the shear waves and alert the interpreter of an erroneous measurement.
Breast elastography has now been clinically available for over 10 years and has continued to improve. We now understand its advantages and limitations. The techniques have not been widely accepted due to a substantial learning curve for performing and interpreting examinations. Improvements in the technology are being developed to overcome these limitations and may make elastography a primary method of characterization of breast lesions.
Types of Elastography
There are two types of ultrasound elastography strain (SE) and SWE [3].
SE is a qualitative technique. This technique evaluates the changes in tissues when an external force is applied. Softer tissues deform more than stiffer tissues. There are two methods of applying the stress, manual compression and release or using an acoustic radiation force impulse (ARFI) push pulse. Most vendors offer manual compression strain on their system. The systems vary significantly in the degree of stress that is needed for optimal images. Some systems require minimal compression and release while others require a moderate amount of compression and release. There is a learning curve for each system. There is a sweet spot where the algorithm is most accurate. Too little or too much compression will lead to suboptimal elastograms (Fig. 1). Most systems have a visual display of the amount of compression release applied so the operator can find the optimal technique. When using the ARFI technique for SE, which is presently only offered by one vendor, the transducer is held still with minimal pressure on the breast and the ARFI pulse initiated. The learning curve for the ARFI technique is less than that of the compression-release techniques. The systems that require minimal compression and release are easier to learn as most require just the patient breathing or heart beat to generate the compression and release. The operator just needs to hold the transducer with minimal compression on the breast. Those that require more compression and release have a more significant learning curve and have more artifacts particularly in the near field.
Fig. 1. The effect of optimal and suboptimal displacement/release compression in strain elastography.
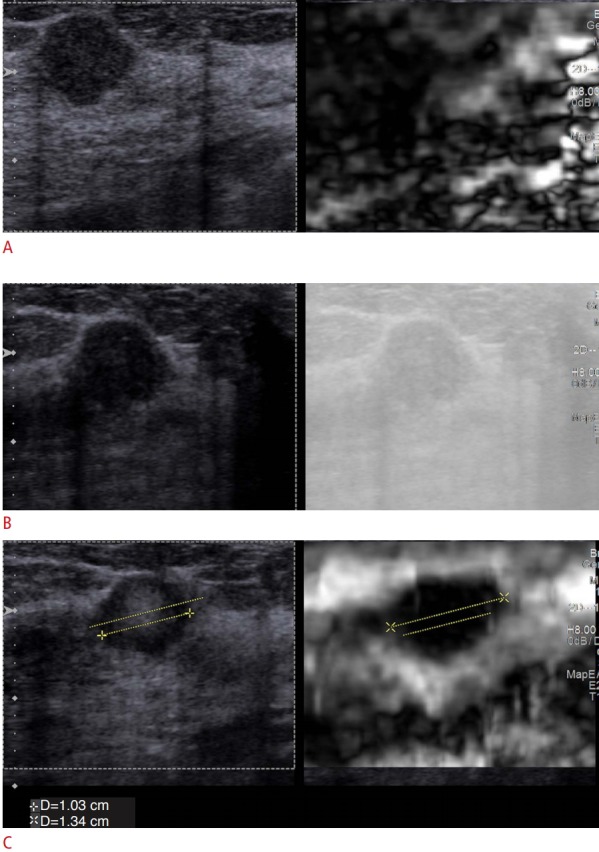
For displacement/release, strain elastography each vendor has a sweet spot where the optimal elastogram is obtained. A. When there is too much displacement only noise is obtained, the lesion is not identified on the elastogram. B. When not enough displacement is obtained, an elastogram is not obtained. C. When the appropriate displacement/release is applied an accurate elastogram is obtained. The lesion measures 1.03 cm on B-mode (left) and 1.34 cm on strain elastography (right) suggestive of a benign lesion. The lesion was an invasive ductal carcinoma.
SWE techniques use the ARFI technology to generate shear waves that propagate perpendicular to the ARFI pulse. Therefore, ARFI technology can be used to generate both SE, measuring the axial displacement, and SWE measuring the speed of the perpendicular shear waves generated. It is important to remember that the shear waves are tracked using B-mode ultrasound so optimal B-mode images are required to obtain accurate stiffness values. The SWE technique is quantitative providing a stiffness value either by the shear wave speed in meters per second (m/sec) or converting to the Young’s modulus in kiloPascals [4]. The learning curve for SWE is less than that of SE although one important factor that affects both SE and SWE is pre-compression which is discussed in detail below [5,6].
Technique
One of the most critical factors in performing breast elastography is pre-compression [7]. When a material is compressed its stiffness increases (Fig. 2). To perform accurate breast elastography, both strain and shear wave, minimal compression of the breast must be applied. Usually some pre-compression is used in B-mode imaging as this straightens Cooper’s ligaments decreasing artifacts. In SE when significant pre-compression is applied the result is noise. While with mild to moderate pre-compression there may be alternating good images and noise. The good images are obtained in the upstroke of the compression cycle. If serial images are not similar when performing SE, the reason is either too much pre-compression or movement of the lesion in the scanning plane. A method for applying minimal pre-compression with consistency has been proposed [7].
Fig. 2. The effect of pre-compression on stiffness values.
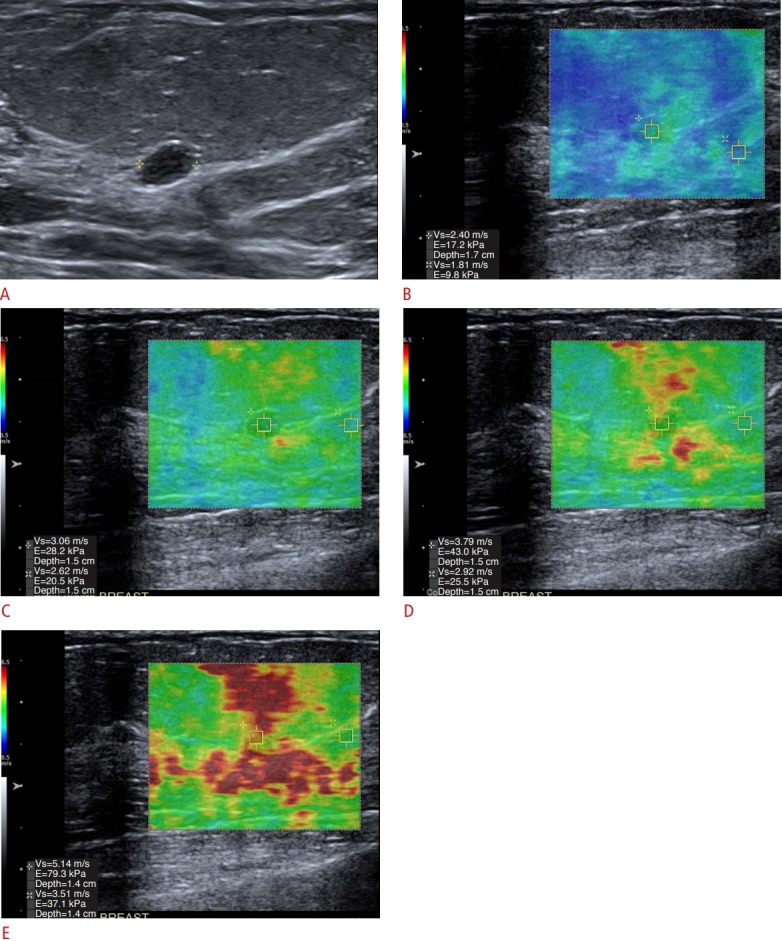
When pre-compression (added pressure on the breast with the transducer) is added, the stiffness value of the lesion will increase. It is important to only apply minimal pressure with the transducer. A-E. In this series of images, the lesion a benign fibroadenoma (A), its stiffness when done properly is 2.4 m/sec (B) as increased compression is added, the lesion stiffness increases to 3.0 m/sec (C), 3.79 m/sec (D), and 5.1 m/sec (E). Note also that the stiffness value of fat also increases with increased compression.
Another important factor to obtain adequate SE images is the same imaging plane of the lesion must remain in the field of view (FOV) throughout the data acquisition. The patient should be positioned so that the transducer is perpendicular to the floor and the patient rotated so that the patient’s breathing moves the lesion within the image plane [8].
In SE, only the stiffnesses of tissue relative to each other are obtained. Therefore, it is important to have several tissues present in the FOV. For breast SE, fat (softest tissue), fibro-glandular tissue, the pectoralis muscle and the lesion should be included. In general, if the lesion is benign it will be of similar stiffness to the fibro-glandular tissues. Malignant lesions will be stiffer than all other tissues. Several color maps can be used. It is the authors opinion that the grey scale map is the easiest to detect subtle changes between tissues and identify noise. It is important recognize the color map used as some display red as stiff and other blue as stiff.
SWE provides a quantitative estimate of the tissue stiffness. For breast SWE the transducer is placed on the breast with minimal pre-compression and held still over the area of concern to obtain the measurement. Both point shear wave elastography and two-dimensional (2D)-SWE have been used to evaluate breast lesions [9]. Breast masses, especially malignancies, tend to be very heterogeneous in stiffness. Therefore, the 2D-SWE technique is preferred as the larger FOV can depict the differences in stiffness and the area of highest stiffness can be identified. Table 1 lists the important technical factors when obtaining SE and SWE breast images.
Table 1.
Technical factors for performing breast elastography
| Strain elastography | Shear wave elastography |
|---|---|
| Avoid pre-compression | Avoid pre-compression |
| Use optimal compression/release for system | Hold transducer still |
| No out of plane motion | No out of plane motion |
| Position patient so respiratory motion is in plane with imaging | Position patient so lesion is at least 5 mm deep and less than 4 cm deep |
| Have a large FOV containing fat, glandular tissue, pectoralis muscle and the lesion | Monitor the stiffness of fat to confirm no pre-compression |
FOV, field of view.
Interpretation of SE
For reasons not fully understood, breast cancers appear larger on the elastogram than on the B-mode image while benign lesions appear smaller on the elastogram than the B-mode image (Fig. 3). This appears to be unique to breast imaging. Since SE is displaying relative stiffness differences, evaluating only the "color" on the elastogram does not provide adequate information for high sensitivity and specificity of characterizing breast masses. However, the size changes that occur are extremely sensitive and specific for characterizing breast masses.
Fig. 3. Change of breast lesion size on elastography.
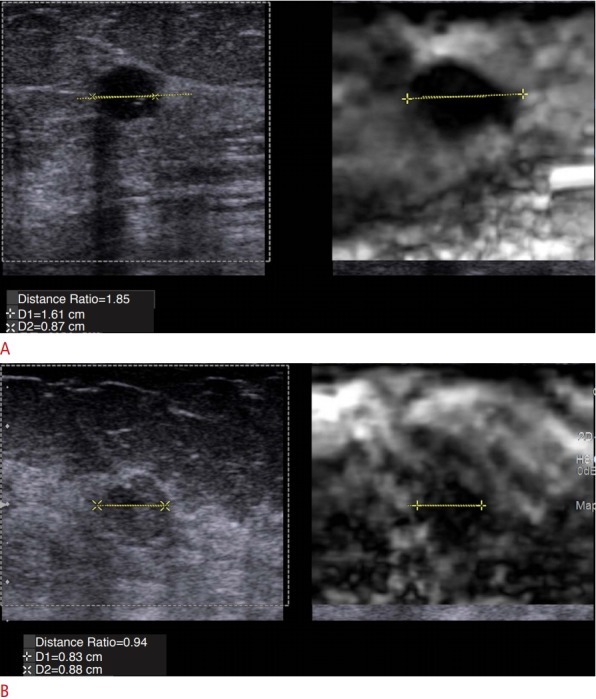
A unique feature of breast cancers is that malignant lesions appear larger and benign lesions appear smaller on elastography compared to B-mode imaging. A. An invasive ductal cancer has an elastogram to B-mode length ratio (E/B ratio) of 1.85. B. A fibrocystic lesion has an E/B ratio of 0.94.
There are three methods that have been proposed to interpret SE images of the breast: (1) elastogram to B-mode length ratio (E/B ratio); (2) 5-point color scale; and (3) comparing the stiffness of the lesion to the stiffness of fat (strain ratio).
E/B Ratio
The length of a lesion on elastography divided by the length of the lesion on B-mode, the E/B ratio can be used as a method to characterize breast lesions (Fig. 3). The E/B ratio has been shown to be related to the aggressiveness of the malignancy with less aggressive lesions such as mucinous cancers or ductal carcinoma in situ with ratios of 1.0 or slightly larger and more malignant lesions as invasive ductal cancer having ratios of up to 3 [10]. A cut-off value of <1 for benign lesions and ≥1.0 for malignant lesions has been used with high sensitivity and specificity for lesion characterization. Sensitivities of 98%-99% have been reported with this technique and specificities of 85%-90% [11-19]. False negative cases have been lymphomas, both primary and metastatic, which are softer lesions and have a ratio of <1.0 [20]. Common false positive cases are fat necrosis [21] and mastitis [22]. These are felt to be secondary to increased stiffness from surrounding edema which is not appreciated on B-mode imaging thus increasing stiffness and increases the apparent size on elastography.
One confounding factor using the E/B ratio is fibroadenomas and fibrocystic change have similar elastic properties to glandular tissue. When measuring the lesion on SE the measurement may also include glandular tissue resulting in a false positive finding. This can be minimized by comparing the stiffness of the lesion to glandular tissue. If the lesion has similar stiffness to glandular tissue it has a high probability of being benign. If the lesion is stiffer than surrounding tissue it has a high probability of being malignant (Fig. 4). Another confounding factor is the presence of two lesions adjacent to each other. These may appear as one lesion on the B-mode image. Close inspection of the elastogram can distinguish the two lesions. In these cases, care must be taken in performing measurements. If different results are obtained in different lesion positions, the possibility of the "lesion" being two adjacent lesions should be considered. Always use the results of the larger E/B ratio. If such a lesion is biopsied always try to biopsy the portion of the lesion that has the larger E/B ratio.
Fig. 4. Difficulty in evaluating benign lesions in fibroglandular tissue.
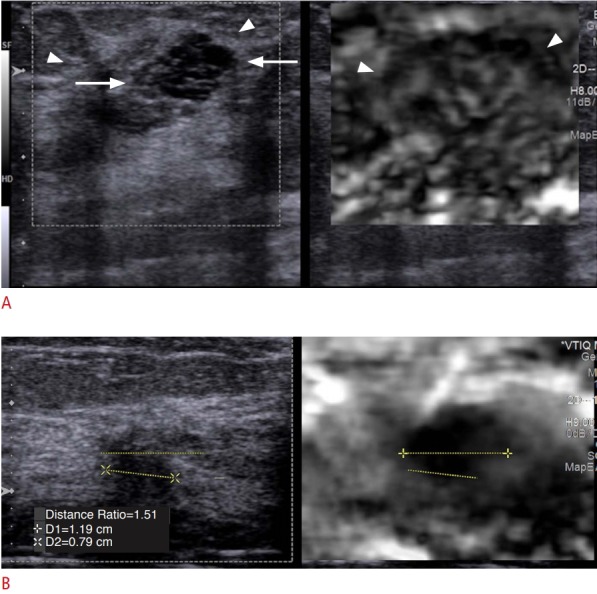
When benign lesions such as a fibroadenoma or fibrocystic change is surrounded by glandular tissue, the stiffness values are similar and the lesion is often difficult to measure. When this occurs comparing the stiffness of the lesion to glandular tissue is helpful. A. Fibrocystic change is clearly seen on the B-mode image (left, arrows) surrounded glandular tissue (arrowheads); however, the lesion is not identified on the elastogram (right). Thus, the stiffness value of the lesion is similar to the glandular tissue and has a very high probability of being benign. B. In this case, the lesion is an invasive ductal cancer. The lesion is clearly seen in the elastogram and is much stiffer (black) than the glandular tissue. Therefore, the lesion has a very high probability of being malignant.
5-Point Color Scale
A 5-point color scale can be used to characterize breast masses [23]. In this method a score of 1 is given when the lesion is completely soft, a score of 2 is given if the lesion has mixed soft and stiff components, a score of 3 if the lesion is stiff and smaller than on B-mode, a score of 4 is given if the lesion is stiff and the same size as B-mode, and a score of 5 is given when the lesion is stiff and larger than on B-mode. A cut-off value between 3 and 4 is used to characterize lesions as benign or malignant. Sensitivities of 87%-93% and specificities of 83%-90% have been obtained with this technique [23-26].
Strain Ratio
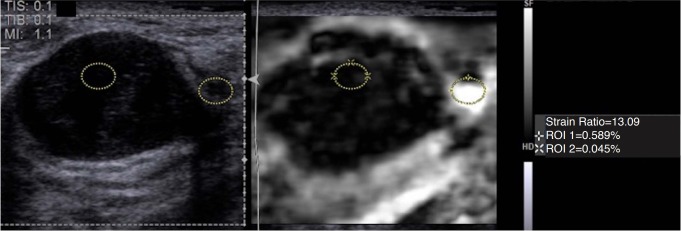
SE is a qualitative technique. The exact stiffness of a tissue is not obtained in SE just its relative stiffness to other tissues in the FOV. However, we can obtain a semi-quantitative measure of stiffness by comparing the stiffness of the lesion to a reference tissue [19]. For breast we use fat as the reference tissue (Fig. 5). Most ultrasound system can calculate this by placing a region of interest (ROI) in the lesion and an ROI in fat. The system will then provide a ratio of the stiffness values. Ultrasound systems use different methods to determine the relative stain of the tissues and ratios obtained on one vendor’s equipment may not be the same as another vendor’s equipment. This measurement also requires that the same amount of stress be applied to both the lesion and the reference tissue. Therefore, the ROIs should be placed at the same depth from the transducer if possible. In some patients, especially in Asian women, there may not be reference fat tissue so normal glandular tissue can be used but the cut-off values to characterize the lesion will be different than when fat is used as the reference. When using fat as the reference tissues cut-off values of 2.3 to 4.8 have been reported to characterize breast lesions as benign or malignant [5,15-19].
Fig. 5. Strain ratio (SR) as a semi quantitative method in strain elastography.
Although strain elastography is a qualitative measure of stiffness, the SR can be used as a semi-quantitative method. In this case of a fibroadenoma, a region of interest (ROI) is placed in the lesion and one in adjacent fat. The system calculates the relative stiffness to fat which in this case is 13.09. Note that the ROI of fat was placed in the softest area, but other areas of fat are stiffer. This may be the reason why a value suggested of a malignant lesion is obtained. Having the same stress applied throughout the image is required for accurate measurements.
Table 2 presents the results of a meta-analysis of the three methods of interpretation of breast SE [27]. The E/B method has the highest sensitivity of 96%. The highest specificity is with the E/B and 5-point color scale with values of 88% and 87%, respectively. The area under the receiver operating characteristics for the three techniques is similar with between the three techniques. The negative likelihood ratio (LRN) of the E/B technique is 0.03. With this LRN of 0.03 a lesion with a 50% pre-test probability (Breast Imaging Reporting and Data System [BI-RADS] category 4B) can be downgraded to a 2% probability (BI-RADS category 3) [28].
Table 2.
Results of a meta-analysis of the three types of interpretation of strain elastography
| Method | Sensitivity (95% CI, %) | Specificity (95% CI, %) | LRP (95% CI) | LRN (95% CI) | SROC (95% CI) |
|---|---|---|---|---|---|
| E/B | 96 (94-98) | 88 (85-89) | 7.1 (4.8-10.6) | 0.03 (0-0.28) | 0.91 (0.87-0.95) |
| 5-Point color | 77 (76-70) | 87 (87-88) | 5.3 (4.4-6.3) | 0.24 (0.19-0.31) | 0.90 (0.88-0.92) |
| Strain ratio | 87 (85-89) | 81 (79-83) | 4.8 (3.6-6.3) | 0.16 (0.11-0.23) | 0.92 (0.88-0.96) |
CI, confidence interval; LRP, likelihood ratio positive; LRN, likelihood ratio negative; SROC, schematic receiver operating characteristic curve; E/B, elastogram to B-mode length ratio.
Interpretation of SWE
Breast cancers are very heterogeneous in stiffness (Fig. 6). When performing SWE the area of highest stiffness in the lesion or surrounding 3 mm should be used to characterize the lesion [5,29]. Some breast cancers do not allow for adequate shear wave generation and may appear black (no shear wave speed calculated) or even with a low shear wave speed (due to noise) [13]. Often in the surrounding tissues high shear wave speeds are obtained. If this does not occur the possibility of a false-negative results can occur (Fig. 7). This has been over-come with the use of a quality measure. Care must be taken with pre-compression as this can also create the same appearance in a benign lesion.
Fig. 6. Stiffness patterns seen in elastography of breast cancers.
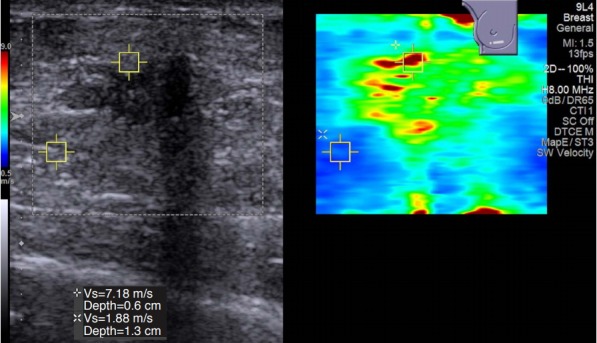
In strain elastography, breast cancers are usually seen with relatively uniform stiffness. This is most likely due to all of the areas of cancer being stiffer than adjacent tissue. However, in shear wave elastography, most cancers have a very heterogenous stiffness pattern. When performing measurements to assess the stiffness of the lesion, the stiffest area in the lesion or surrounding tissue should be used. As in this case the area of highest stiffness was in the rim of the lesion.
Fig. 7. Value of a quality measure in shear wave elastography (SWE) of breast lesions.
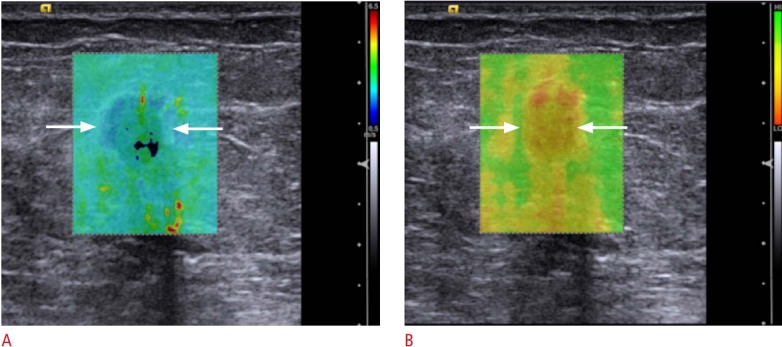
Due to the stiffness of some breast cancers, they may not color code (no shear wave speed calculated) or may be displaced as soft. To avoid false-negative results either comparison to strain elastography (SE) or the use of a Quality Map of the displacement curves used in calculating the shear wave speed are required. A. An invasive ductal cancer (arrows) on a 60-year-old with an abnormal screening mammogram which on several SWE ultrasound systems had a slow shear wave speed suggestive of a benign lesion; however, the SE images were predictive of the correct diagnosis of a malignant lesion. B. The quality map shows the lesion (arrows) has poor quality shear waves (red and yellow) and the SWE results should not be used.
In a large number of malignant lesions, the area identified on B-mode as the hypoechoic mass often does not code on SWE because a shear wave is not identified or may code with a low shear wave speed. Bai et al. [30] found that 63% of breast malignancies have this finding. Preliminary work in the evaluation of this phenomenon suggests that shear waves may not propagate as expected in some malignant lesions. Evaluation of the shear waves in these malignant lesions demonstrates significant noise that may be incorrectly interpreted as a low shear wave velocity by the algorithm. In a recent study [13], the addition of a QM in shear wave imaging of the breast can limit false negative findings (sensitivity without QM 22/46 [48%; 95% confidence interval, 33% to 63%], with QM 42/46 [91%; 95% confidence interval, 79% to 98%; P<0.001]).
There have been several papers that evaluated SWE to characterize breast lesions as malignant. The cut-off values have varied between these papers. The differences most likely occur with differences in systems as well as the amount of pre-compression used. Based on the literature the World Federation of Ultrasound in Medicine and Biology (WFUMB) used a BI-RADS like scale with shear wave speed of <2.6 m/sec (20 kPa) being benign in all studies, a shear wave speed of >2.6 m/sec (20 kPa) and <4.5 m/sec (60 kPa) as probably benign, a shear wave speed of >4.5 m/sec (60 kPa) and <5.2 m/sec (80 kPa) as probably malignant, and >5.2 m/sec (80 kPa) as highly suspicious for malignancy [5]. Each site should evaluate the most appropriate cut-off for their site and use continued monitoring to adjust the cut-off a needed.
Artifacts in SE
Bull’s eye artifact
With some vendors (Siemens Ultrasound and Philips Ultrasound) a Bull’s eye artifact occurs with simple and benign cysts [31]. This artifact has been reported to have perfect sensitivity, specificity and positive predictive value in determining pathologically proven benign cysts. When the cyst has components that are not mobile a defect in the Bull’s eye artifact is seen. With this technique complex cystic masses can be distinguished from complex cysts (Fig. 8).
Fig. 8. Bull’s eye artifact observed in some strain systems for benign simple and complicated cysts.
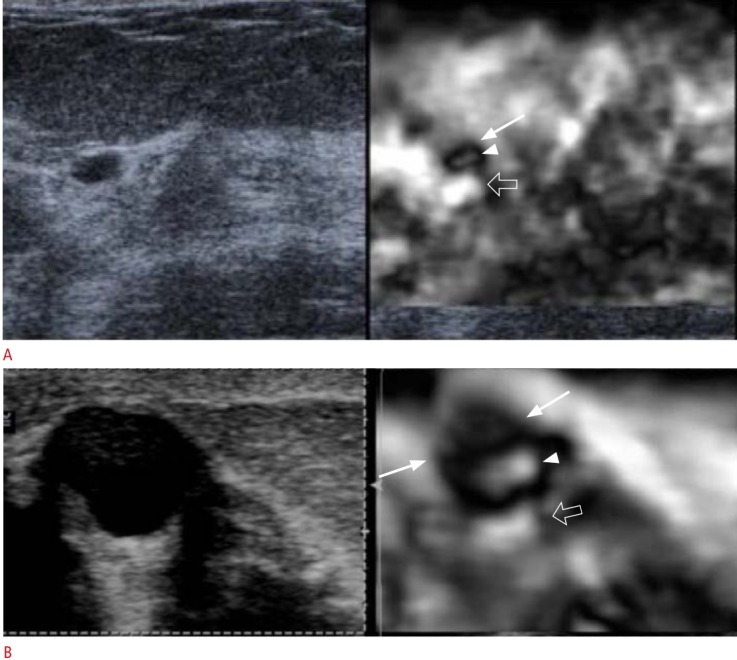
A. This artifact is a black outer rim (arrow), inner white area (arrowhead), and a distal white area (open arrow). B. When there is a component of a complicated cyst that is not mobile, a defect (arrows) is identified in the bull’s eye (arrowhead and open arrow). Therefore, this sign can be used to differentiate complex cysts from complex cystic masses.
Blue/green/red artifact
Some ultrasound systems have a different artifact that occurs in cysts. There is a 3-color-layering pattern of blue, green, red (with blue as stiff) identified in cystic lesions (Fig. 9). A detail study evaluating the sensitivity and specificity of this artifact has not been performed.
Fig. 9. Blue/green/red cyst (BGR) artifact seen in some systems.
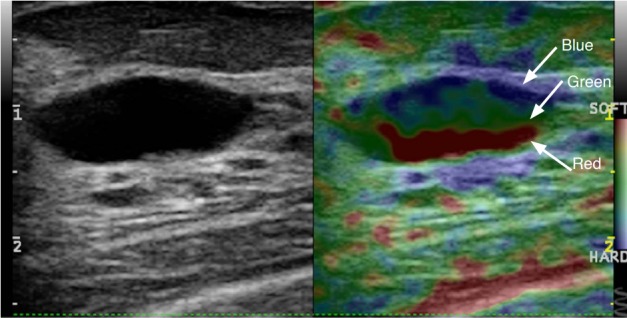
For some vendors instead of the Bull’s eye artifact for cysts, their systems give a BGR layered pattern.
Sliding artifact
A soft ring or group of wavelike soft rinds around a lesion in SE indicates the lesion is moving in and out of the imaging plane while the elastogram is being obtained (Fig. 10). Maintaining the same imaging plane in the lesion during the elastogram acquisition can eliminate this artifact. This artifact can be seen with fibroadenomas or lipomas. This artifact is usually only seen with benign lesions as it requires the lesion to move separately from the surrounding tissues. In malignant lesions the lesion is usually attached to the surrounding tissue [21].
Fig. 10. The sliding artifact.
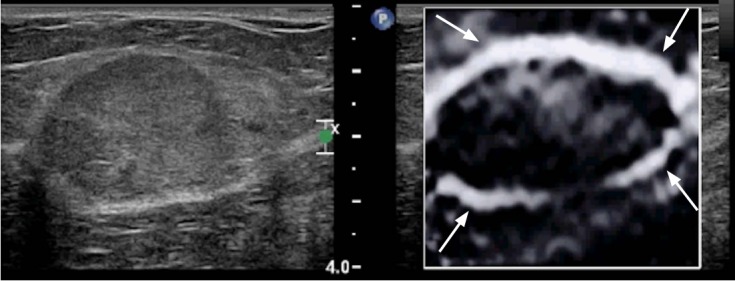
In strain elastography when the lesion is moving in and out of the plane a sliding artifact is obtained. This is characterized by a ring of soft (white in this case) ring around the lesion. Note that is artifact can only occur if the lesion is not attached to adjacent tissue. Therefore, this artifact will only occur in benign lesions.
Bang artifact
In 2D-SWE if pre-compression is applied there will be a stiff area in the near field (Fig. 11). This can be minimized by not applying pre-compression. The use of ample coupling gel is helpful in eliminating this effect [21].
Fig. 11. The Bang artifact.
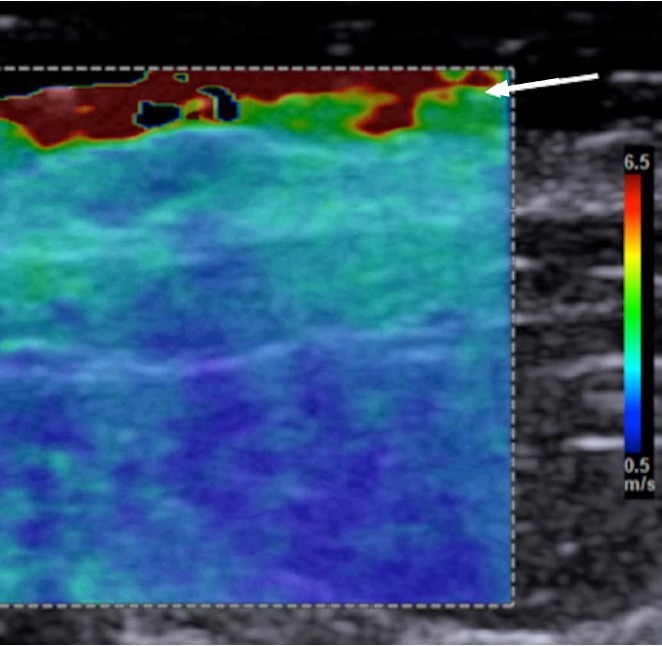
If there is too much compression with the transducer in shear wave elastography, a region of high stiffness will occur in the near field. This is called the "Bang" artifact. This can be corrected by reducing the pressure applied with the transducer.
Worm artifact
If there is very little variability in the elastic properties of the tissues in the FOV a pattern of varying noise is seen (Fig. 12). This can occur when only one tissue is in the FOV or when significant pre-compression is applied. This artifact can be eliminated by the use of minimal pre-compression and including various tissue types in the FOV [21].
Fig. 12. Recognition of noise in strain elastography.
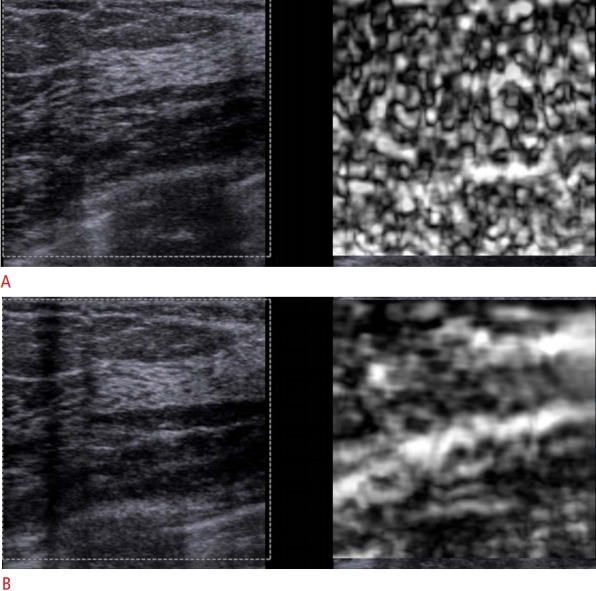
When too much compression is applied by the transducer in strain elastography only noise will be seen. A. This distinct pattern of alternating soft (white in this case) and stiff (black in this case) areas will be seen. B. When the pressure by the transducer is applied appropriately, an accurate elastogram is obtained.
Characterization of Breast Lesions as Benign or Malignant
Performing both SE and SWE can increase diagnostic confidence and accuracy. When there are conflicting results additional evaluation should be considered and error on the side of biopsy. It is important that the appropriate cut-off values be used as they vary in the literature by technique as well as vendor.
Detailed elastography features of various benign and malignant pathologies can be found elsewhere [21]. As noted above there are a few pathologies that can lead to false positive results including fat necrosis, mastitis [22], and a small percentage of fibroadenomas. One false-negative is lymphoma [20,21].
Future Developments
Breast elastography has very high sensitivities and specificities for characterization of breast lesions. However, the learning curve of SE has limited its clinical acceptance. With SWE the learning curve is less steep but the problem of poor or no shear wave propagation in breast cancers is of concern due to possible false negative results. The development of a real-time stress map may solve some of these problems. This real-time technique displays a map which depicts the degree of applied stress. The technique will depict when uneven stress is applied (Fig. 13). It can guide where the appropriate ROIs should be placed for strain ratio.
Fig. 13. The value of a stress map in assessing accurate compression.
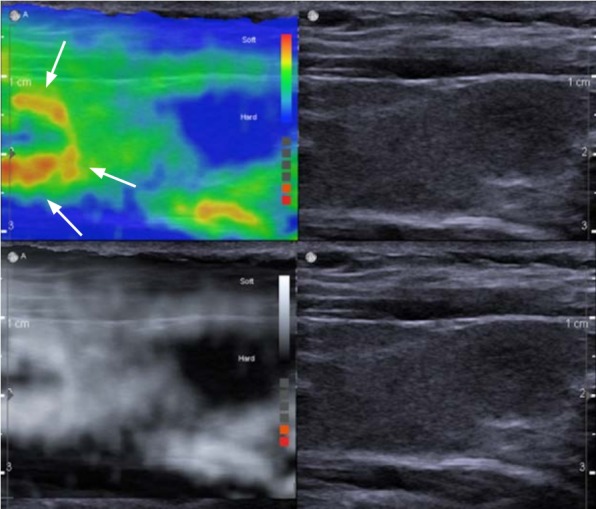
The stress map images are on the top and the conventional strain elastography images are on the bottom. In this example of the stress map (left), the carotid pulsations are causing increased stress as depicted by the red and yellow areas (arrows). Although in the B-mode image (right) there is no indication of variable stress applied, there is significant differences and if a strain ratio was performed using the area of greater stress as the reference it would be substantially inaccurate.
Three-dimensional (3D) SWE has been available for some time and 3D strain may be clinically available in the near future [32,33]. It is unclear if 3D will provide improved results over 2D SWE or 2D SE. 3D does allow for visualization of the lesion in the coronal plane, ability to view the stiffness of the entire lesion, and may allow for whole breast screening. Other new techniques are becoming clinically available including vibratory SWE where a mechanical device is used to create standing shear waves which are detected with B-mode ultrasound [34]. This technique also allows for varying the frequency of the mechanical stress possible allowing for additional diagnostic information.
Opto-acoustic imaging (OA) is another technique being used to characterize breast lesions. In a large study of 1,690 patients with 1,757 masses of which 1,079 (61.4%) were benign and 678 (38.6%) were malignant, OA was able to downgrade 40.8% of benign masses [35]. The LRN was 0.094 indicates a negative examination can reduce a pre-test probability of 17.8% (low BI-RADS 4B) to a post-test probability of 2% (BI-RADS 3).
Conclusion
Both SE and SWE provide additional information on breast lesion characterization. Technique is critical. Strain has the highest sensitivity and SWE has the highest specificity. The combination of SE and SWE may increase confidence and accuracy. There is significantly increased sensitivity of SWE when a QM is added. The development of a real-time stress map which depicts the amount of stress applied on a color-coded map can aid in obtaining accurate elastograms [36]. In this technique, the color map depicts the amount of stress applied throughout the image. It can be determined if uniform stress is applied as well as identifying areas of additional stress from within the body (e.g., carotid artery pulsations). This technique can be very useful for strain ratio as both the ROI of the lesion and the reference tissue can be confirmed to have the same stress.
New techniques of vibratory SWE and OA may provide new information on characterization of breast masses. Newer techniques like the stress map will aid in obtaining more accurate elastograms.
Further studies are needed to determine exactly what we are measuring in breast elastography.
Footnotes
Research grants: Siemens Ultrasound, Philips Ultrasound, Supersonic Imagine, Canon Medical Systems, GE Ultrasound, Bracco Diagnostics. Speaker’s Bureau: Philips Ultrasound, Bracco Diagnostics, Lantheus Medical. Royalties: Thieme Publishers.
References
- 1.Tanter M, Bercoff J, Athanasiou A, Deffieux T, Gennisson JL, Montaldo G, et al. Quantitative assessment of breast lesion viscoelasticity: initial clinical results using supersonic shear imaging. Ultrasound Med Biol. 2008;34:1373–1386. doi: 10.1016/j.ultrasmedbio.2008.02.002. [DOI] [PubMed] [Google Scholar]
- 2.Krouskop TA, Wheeler TM, Kallel F, Garra BS, Hall T. Elastic moduli of breast and prostate tissues under compression. Ultrason Imaging. 1998;20:260–274. doi: 10.1177/016173469802000403. [DOI] [PubMed] [Google Scholar]
- 3.MacSween RN, Burt AD. Histologic spectrum of alcoholic liver disease. Semin Liver Dis. 1986;6:221–232. doi: 10.1055/s-2008-1040605. [DOI] [PubMed] [Google Scholar]
- 4.Frank DN, Robertson CE, Hamm CM, Kpadeh Z, Zhang T, Chen H, et al. Disease phenotype and genotype are associated with shifts in intestinal-associated microbiota in inflammatory bowel diseases. Inflamm Bowel Dis. 2011;17:179–184. doi: 10.1002/ibd.21339. [DOI] [PMC free article] [PubMed] [Google Scholar]
- 5.Barr RG, Nakashima K, Amy D, Cosgrove D, Farrokh A, Schafer F, et al. WFUMB guidelines and recommendations for clinical use of ultrasound elastography: Part 2: breast. Ultrasound Med Biol. 2015;41:1148–1160. doi: 10.1016/j.ultrasmedbio.2015.03.008. [DOI] [PubMed] [Google Scholar]
- 6.Shiina T, Nightingale KR, Palmeri ML, Hall TJ, Bamber JC, Barr RG, et al. WFUMB guidelines and recommendations for clinical use of ultrasound elastography: Part 1: basic principles and terminology. Ultrasound Med Biol. 2015;41:1126–1147. doi: 10.1016/j.ultrasmedbio.2015.03.009. [DOI] [PubMed] [Google Scholar]
- 7.Barr RG, Zhang Z. Effects of precompression on elasticity imaging of the breast: development of a clinically useful semiquantitative method of precompression assessment. J Ultrasound Med. 2012;31:895–902. doi: 10.7863/jum.2012.31.6.895. [DOI] [PubMed] [Google Scholar]
- 8.Barr RG. Sonographic breast elastography: a primer. J Ultrasound Med. 2012;31:773–783. doi: 10.7863/jum.2012.31.5.773. [DOI] [PubMed] [Google Scholar]
- 9.Youk JH, Gweon HM, Son EJ. Shear-wave elastography in breast ultrasonography: the state of the art. Ultrasonography. 2017;36:300–309. doi: 10.14366/usg.17024. [DOI] [PMC free article] [PubMed] [Google Scholar]
- 10.Grajo JR, Barr RG. Strain elastography for prediction of breast cancer tumor grades. J Ultrasound Med. 2014;33:129–134. doi: 10.7863/ultra.33.1.129. [DOI] [PubMed] [Google Scholar]
- 11.Barr RG. Real-time ultrasound elasticity of the breast: initial clinical results. Ultrasound Q. 2010;26:61–66. doi: 10.1097/RUQ.0b013e3181dc7ce4. [DOI] [PubMed] [Google Scholar]
- 12.Barr RG, Destounis S, Lackey LB 2nd, Svensson WE, Balleyguier C, Smith C. Evaluation of breast lesions using sonographic elasticity imaging: a multicenter trial. J Ultrasound Med. 2012;31:281–287. doi: 10.7863/jum.2012.31.2.281. [DOI] [PubMed] [Google Scholar]
- 13.Barr RG, Zhang Z. Shear-wave elastography of the breast: value of a quality measure and comparison with strain elastography. Radiology. 2015;275:45–53. doi: 10.1148/radiol.14132404. [DOI] [PubMed] [Google Scholar]
- 14.Hall TJ, Zhu Y, Spalding CS. In vivo real-time freehand palpation imaging. Ultrasound Med Biol. 2003;29:427–435. doi: 10.1016/s0301-5629(02)00733-0. [DOI] [PubMed] [Google Scholar]
- 15.Alhabshi SM, Rahmat K, Abdul Halim N, Aziz S, Radhika S, Gan GC, et al. Semi-quantitative and qualitative assessment of breast ultrasound elastography in differentiating between malignant and benign lesions. Ultrasound Med Biol. 2013;39:568–578. doi: 10.1016/j.ultrasmedbio.2012.10.016. [DOI] [PubMed] [Google Scholar]
- 16.Farrokh A, Wojcinski S, Degenhardt F. Diagnostic value of strain ratio measurement in the differentiation of malignant and benign breast lesions. Ultraschall Med. 2011;32:400–405. doi: 10.1055/s-0029-1245335. [DOI] [PubMed] [Google Scholar]
- 17.Stachs A, Hartmann S, Stubert J, Dieterich M, Martin A, Kundt G, et al. Differentiating between malignant and benign breast masses: factors limiting sonoelastographic strain ratio. Ultraschall Med. 2013;34:131–136. doi: 10.1055/s-0032-1313168. [DOI] [PubMed] [Google Scholar]
- 18.Thomas A, Degenhardt F, Farrokh A, Wojcinski S, Slowinski T, Fischer T. Significant differentiation of focal breast lesions: calculation of strain ratio in breast sonoelastography. Acad Radiol. 2010;17:558–563. doi: 10.1016/j.acra.2009.12.006. [DOI] [PubMed] [Google Scholar]
- 19.Ueno E, Umemoto T, Bando H, Tohno E, Waki K, Matsumura T. New quantitative method in breast elastography: fat lesion ratio (FLR). Radiological Society of North America 93rd Scientific Assembly and Annual Meeting; 2007 Nov 25-30; Chicago, IL, USA. [Google Scholar]
- 20.Sousaris N, Barr RG. Sonoelastography of breast lymphoma. Ultrasound Q. 2016;32:208–211. doi: 10.1097/RUQ.0000000000000213. [DOI] [PubMed] [Google Scholar]
- 21.Barr RG. Breast elastography. New York: Thieme Publishers; 2014. [Google Scholar]
- 22.Sousaris N, Barr RG. Sonographic elastography of mastitis. J Ultrasound Med. 2016;35:1791–1797. doi: 10.7863/ultra.15.09041. [DOI] [PubMed] [Google Scholar]
- 23.Itoh A, Ueno E, Tohno E, Kamma H, Takahashi H, Shiina T, et al. Breast disease: clinical application of US elastography for diagnosis. Radiology. 2006;239:341–350. doi: 10.1148/radiol.2391041676. [DOI] [PubMed] [Google Scholar]
- 24.Chang JM, Moon WK, Cho N, Kim SJ. Breast mass evaluation: factors influencing the quality of US elastography. Radiology. 2011;259:59–64. doi: 10.1148/radiol.10101414. [DOI] [PubMed] [Google Scholar]
- 25.Raza S, Odulate A, Ong EM, Chikarmane S, Harston CW. Using realtime tissue elastography for breast lesion evaluation: our initial experience. J Ultrasound Med. 2010;29:551–563. doi: 10.7863/jum.2010.29.4.551. [DOI] [PubMed] [Google Scholar]
- 26.Ueno E, Ito A. Diagnosis of breast cancer by elasticity imaging. Eizo Joho Med. 2004;36:2–6. [Google Scholar]
- 27.Barr RG, De Silbestri A, Scotti V, Manzoni F, Rebuffi C, Capittini C, et al. Diagnostic performance and accuracy of the 3 interpreting methods of breast strain elastography: a systematic review and meta-analysis. AFSUMB 2018; 2018 May 23-26; Seoul, Korea. [DOI] [PubMed] [Google Scholar]
- 28.Yang WT, Parikh JR, Stavros AT, Otto P, Maislin G. Exploring the negative likelihood ratio and how it can be used to minimize falsepositives in breast imaging. AJR Am J Roentgenol. 2018;210:301–306. doi: 10.2214/AJR.17.18774. [DOI] [PubMed] [Google Scholar]
- 29.Berg WA, Cosgrove DO, Dore CJ, Schafer FK, Svensson WE, Hooley RJ, et al. Shear-wave elastography improves the specificity of breast US: the BE1 multinational study of 939 masses. Radiology. 2012;262:435–449. doi: 10.1148/radiol.11110640. [DOI] [PubMed] [Google Scholar]
- 30.Bai M, Du L, Gu J, Li F, Jia X. Virtual touch tissue quantification using acoustic radiation force impulse technology: initial clinical experience with solid breast masses. J Ultrasound Med. 2012;31:289–294. doi: 10.7863/jum.2012.31.2.289. [DOI] [PubMed] [Google Scholar]
- 31.Barr RG, Lackey AE. The utility of the "bull's-eye" artifact on breast elasticity imaging in reducing breast lesion biopsy rate. Ultrasound Q. 2011;27:151–155. doi: 10.1097/RUQ.0b013e31822a9c75. [DOI] [PubMed] [Google Scholar]
- 32.Tian J, Liu Q, Wang X, Xing P, Yang Z, Wu C. Application of 3D and 2D quantitative shear wave elastography (SWE) to differentiate between benign and malignant breast masses. Sci Rep. 2017;7:41216. doi: 10.1038/srep41216. [DOI] [PMC free article] [PubMed] [Google Scholar]
- 33.Hendriks GA, Hollander B, Menssen J, Milkowski A, Hansen HH, de Korte CL. Automated 3D ultrasound elastography of the breast: a phantom validation study. Phys Med Biol. 2016;61:2665–2679. doi: 10.1088/0031-9155/61/7/2665. [DOI] [PubMed] [Google Scholar]
- 34.Hudert CA, Tzschatzsch H, Guo J, Rudolph B, Blaker H, Loddenkemper C, et al. US time-harmonic elastography: detection of liver fibrosis in adolescents with extreme obesity with nonalcoholic fatty liver disease. Radiology. 2018;288:99–106. doi: 10.1148/radiol.2018172928. [DOI] [PubMed] [Google Scholar]
- 35.Neuschler EI, Butler R, Young CA, Barke LD, Bertrand ML, Bohm-Velez M, et al. A pivotal study of optoacoustic imaging to diagnose benign and malignant breast masses: a new evaluation tool for radiologists. Radiology. 2018;287:398–412. doi: 10.1148/radiol.2017172228. [DOI] [PubMed] [Google Scholar]
- 36.Nikolov SI. Iterative autocorrelation motion estimation with application to elasticity imaging. 2013 IEEE International Ultrasonics Symposium (IUS); 2013 Jul 21-25; Prague, Czech. [Google Scholar]


