Abstract
Glioma is one of the most common types of malignant primary central nervous system tumor, and prognosis for this disease is poor. As autophagic drugs have been reported to induce glioma cell death, we investigated the potential prognostic role of autophagy‐associated long non‐coding RNA (lncRNA) in glioma patients. In this study, we obtained 879 lncRNAs and 216 autophagy genes from the Chinese Glioma Genome Atlas microarray, and found that 402 lncRNAs are correlated with the autophagy genes. Subsequently, 10 autophagy‐associated lncRNAs with prognostic value (PCBP1‐AS1, TP53TG1, DHRS4‐AS1, ZNF674‐AS1, GABPB1‐AS1, DDX11‐AS1, SBF2‐AS1, MIR4453HG, MAPKAPK5‐AS1 and COX10‐AS1) were identified in glioma patients using multivariate Cox regression analyses. A prognostic signature was then established based on these prognostic lncRNAs, dividing patients into low‐risk and high‐risk groups. The overall survival time was shorter in the high‐risk group than that in the low‐risk group [hazard ratio (HR) = 5.307, 95% CI: 4.195–8.305; P < 0.0001]. Gene set enrichment analysis revealed that the gene sets were significantly enriched in cancer‐related pathways, including interleukin (IL) 6/Janus kinase/signal transducer and activator of transcription (STAT) 3 signaling, tumor necrosis factor α signaling via nuclear factor κB, IL2/STAT5 signaling, the p53 pathway and the KRAS signaling pathway. The Cancer Genome Atlas dataset was used to validate that high‐risk patients have worse survival outcomes than low‐risk patients (HR = 1.544, 95% CI: 1.110–2.231; P = 0.031). In summary, our signature of 10 autophagy‐related lncRNAs has prognostic potential for glioma, and these autophagy‐related lncRNAs may play a key role in glioma biology.
Keywords: autophagy, CCGA, glioma, long non‐coding RNA, prognostic signature, TCGA
Abbreviations
- CGGA
Chinese Glioma Genome Atlas
- GBM
glioblastoma
- GSEA
gene set enrichment analysis
- HCC
hepatocellular carcinoma
- HOTAIR
HOX (homeobox) transcript antisense RNA
- HR
hazard ratio
- IFN
interferon
- IL
interleukin
- lncRNA
long non‐coding RNA
- miRNA
microRNA
- MMP
matrix metalloproteinase
- OS
overall survival
- STAT
signal transducer and activator of transcription
- TCGA
The Cancer Genome Atlas
Glioma is one of the most common types of malignant primary central nervous system tumors with poor prognosis, comprising approximately 44% of central nervous system tumors 1. The prognosis of glioblastoma (GBM) is the worst among gliomas, in which the median overall survival (OS) for patients with GBM is 15–23 months and the 5‐year survival rate is less than 6% 2, 3. Upon diagnosis, the standard treatment of glioma includes maximal surgical resection, chemotherapy, such as temozolomide, and radiation. Treatment options may vary in different stages of the disease and by the age of the patients. Various factors affect the prognosis of GBM including EGFR amplifications, and mutations of IDH1, TP53 and PTEN 4, 5, 6. However, the survival outcome is unfavorable due to the complex genetic mechanism.
Autophagy is the physiological process that directs degradation of proteins and whole organelles in cells. The activation of autophagy is divided into normal and pathological conditions. Under normal circumstances, autophagy represents a response to several stresses by providing the necessary circulating metabolic substrates for survival. In addition, autophagy is active in some pathological processes in order to maintain cellular homeostasis, such as neurodegenerative diseases, pathogenic inflammation, aging and cancer 7. In recent years, many studies have sought to find new potential targeted therapies by investigating autophagy pathways 8, 9, 10. In addition, autophagic drugs induce cell autophagic death (type II cell death) and cause glioma cell death. Whether this is an alternative and emerging concept for the study of novel glioma therapies remains largely unknown 11.
Long non‐coding RNAs (lncRNAs) have a wide range of functional activities 12. They play a significant role in physiological processes, including RNA decay, genetic regulation of gene expression, RNA splicing, microRNA (miRNA) regulation and protein folding 13. lncRNA regulates many proteins that are important for autophagy. Impaired functioning of lncRNAs participates in glioma pathogenesis, such as cellular apoptosis and proliferation 14. HOX (homeobox) transcript antisense RNA (HOTAIR) is a lncRNA that plays an important role in the regulation of cancer transformation, mainly due to extensive miRNA–HOTAIR interactions and its effect on matrix metalloproteinases (MMPs) 15. There may be an involvement of HOTAIR‐interacting miRNAs and MMPs in autophagy regulation 16, 17, 18. Sufficient evidence shows that lncRNAs mediate transcriptional and post‐transcriptional levels of autophagy‐related genes to regulate the autophagy regulatory network 19, 20. This paper proposes to construct a coexpression network of autophagy‐related lncRNAs using bioinformatics methods, providing a theoretical basis for the treatment of gliomas 21.
Therefore, autophagy‐related lncRNAs may have potential value in the prognosis of glioma patients and may serve as potential therapeutic targets. Here, we aimed to establish an autophagy‐related lncRNA signature in glioma and to advance the targeted treatment of glioma.
Materials and methods
Information extraction of glioma patients
The Chinese Glioma Genome Atlas (CGGA, http://www.cgga.org.cn/, freely available) microarray was used as a training set to establish an autophagy‐associated lncRNA signature of glioma patients. CGGA is the largest glioma tissue database with follow‐ups in China. Thousands of samples have been subjected to whole‐exome sequencing, DNA methylation microarray detection and whole‐genome sequencing, miRNA, mRNA and circRNA sequencing. The training dataset includes CGGA mRNA expression (FPKM) in 325 glioma patients together with relevant clinical data. The patients were diagnosed based on the 2007 WHO classification guidelines. We downloaded clinical information from the dataset website. The prognostic signature was further validated based on The Cancer Genome Atlas (TCGA, https://cancergenome.nih.gov/) GBM dataset. TCGA GBM dataset (FPKM level 3) was included in our analysis as a validation dataset with 160 GBM patients.
LncRNA and autophagy gene screening
The profiles of lncRNAs and autophagy genes were obtained from the CGGA ALL mRNAseq dataset. Specifically, the autophagy gene list was obtained from the Human Autophagy Database (HADb, http://autophagy.lu/clustering/index.html). All of the mRNA expression data were normalized by log2 transformation. Pearson correlation was applied to calculate the correlation between the lncRNAs and autophagy‐related genes. A lncRNA with a correlation coefficient |R 2| > 0.3 and P < 0.05 was considered to be an autophagy‐related lncRNA.
Signature development
First, univariate and multivariate Cox regression analyses were performed to evaluate the prognostic value of autophagy‐related lncRNAs. The lncRNAs with a P‐value < 0.01 by univariate analysis were included in the multivariate stepwise regression Cox analysis to establish the risk score. We used the previous report to determine the risk score for each patient using the following formula: Risk score = βgene1 × exprgene1 + βgene2 × exprgene2 + ··· + βgenen × exprgenen. Cox analysis was performed to build a signature for predicting survival. For more detail, we assigned risk scores by a linear combination of the expression levels of lncRNAs weighted by regression coefficients (β). The β value was calculated by log transformation of the hazard ratio (HR) from the multivariate Cox regression analysis. High‐risk and low‐risk groups were established based on the median risk score. The lncRNA expression is defined as exprgenen.
Gene set enrichment analysis
Gene set enrichment analysis (GSEA) was used to interpret gene expression data. This method derives its function by analyzing gene sets, so it can be used to determine whether the gene set shows a statistically significant difference between the two biological states. In this study, we verified whether genes that are differentially expressed between two groups are enriched during autophagy.
Statistical analysis
The expression levels of autophagy‐related lncRNAs were elevated (P ≤ 0.05). Construction of the autophagy–lncRNA coexpression network was completed using cytoscape software 22 (version 3.4.0; The Cytoscape Consortium, San Diego, CA, USA). Pearson correlation analysis and Cox regression analysis were performed using spss statistics software (version 24; IBM Corp., Armonk, NY, USA). Survival status was the basis for univariate cox regression analysis. prism 7 (GraphPad Software Inc., La Jolla, CA, USA) was used to generate Kaplan–Meier curves. GSEA ( http://www.broadinstitute.org/gsea/index.jsp) was used to distinguish between two sets of functional annotations. Statistical significance was set at a threshold of a two‐tailed P < 0.05.
Results
Construction of a coexpression network for autophagy–lncRNAs
We identified a total of 878 lncRNAs in the CGGA dataset, which was extracted from the CGGA database. A total of 215 autophagy‐related genes were extracted from the Human Autophagy Database (HADb, http://autophagy.lu/clustering/index.html). We constructed an autophagy–lncRNA coexpression network to identify autophagy‐related lncRNAs. Finally, 402 lncRNAs were identified (|R 2| > 0.3 and P ≤ 0.05).
Identification of a signature of 10 autophagy‐related lncRNAs in patients with glioma
First, we identified autophagy‐related lncRNAs by constructing autophagy–lncRNA coexpression networks (P ≤ 0.05). In addition, we used univariate Cox regression analysis based on 402 autophagy‐associated lncRNAs to screen prognostic genes. We ranked the prognostic autophagy‐related lncRNAs in ascending order by their P values. We used a P value of 0.05 as the cutoff value, and the lncRNAs that satisfied this were used for signature development. Our training set was a collection of 325 glioma patients from the CGGA dataset. A total of 19 lncRNAs have prognostic value for glioma patients (P < 0.01). Subsequently, 10 autophagy‐related lncRNAs were found to be independent prognostic factors for glioma patients (Table 1 and Fig. 1), of which five lncRNAs were unfavorable factors (TP53TG1, ZNF674‐AS1, COX10‐AS1, DDX11‐AS1 and SBF2‐AS1) and five lncRNAs were confirmed to be favorable prognostic factors for glioma (PCBP1‐AS1, DHRS4‐AS1, GABPB1‐AS1, MAPKAPK5‐AS1 and MIR4453HG) (Table 2 and Fig. 2).
Table 1.
Correlation between the prognostic lncRNAs and autophagy genes in glioma
| LncRNA | Autophagy gene | Correlation | P |
|---|---|---|---|
| PCBP1‐AS1 | CCL2 | −0.360049202 | 2.2072E‐11 |
| PCBP1‐AS1 | ATG2B | 0.304817007 | 2.0467E‐08 |
| PCBP1‐AS1 | KIF5B | 0.305876376 | 1.818E‐08 |
| PCBP1‐AS1 | ATG2A | 0.311692494 | 9.4056E‐09 |
| PCBP1‐AS1 | WDFY3 | 0.31817447 | 4.4365E‐09 |
| PCBP1‐AS1 | MLST8 | 0.322140176 | 2.7765E‐09 |
| PCBP1‐AS1 | PIK3C3 | 0.324642153 | 2.0586E‐09 |
| PCBP1‐AS1 | TSC1 | 0.330291284 | 3.8213E‐09 |
| PCBP1‐AS1 | TSC2 | 0.332514623 | 8.3751E‐10 |
| PCBP1‐AS1 | NCKAP1 | 0.339888292 | 3.3348E‐10 |
| PCBP1‐AS1 | GRID2 | 0.364527555 | 5.5069E‐11 |
| PCBP1‐AS1 | SIRT2 | 0.366890173 | 8.5922E‐12 |
| PCBP1‐AS1 | MTOR | 0.371080649 | 4.7675E‐12 |
| PCBP1‐AS1 | SIRT1 | 0.385311738 | 6.0485E‐13 |
| PCBP1‐AS1 | NBR1 | 0.3900753 | 3.5039E‐13 |
| PCBP1‐AS1 | ERBB2 | 0.398520286 | 8.1268E‐14 |
| PCBP1‐AS1 | BIRC6 | 0.401737956 | 4.9072E‐14 |
| PCBP1‐AS1 | HDAC6 | 0.410137987 | 1.2879E‐14 |
| PCBP1‐AS1 | KIAA0226 | 0.417146773 | 3.9968E‐15 |
| PCBP1‐AS1 | RPTOR | 0.426641207 | 8.8818E‐16 |
| TP53TG1 | GABARAP | 0.44046552 | 0 |
| TP53TG1 | TM9SF1 | 0.440120961 | 0 |
| TP53TG1 | VAMP3 | 0.43087095 | 4.4409E‐16 |
| TP53TG1 | ITGB4 | 0.379361437 | 1.4515E‐12 |
| TP53TG1 | LAMP1 | 0.362507507 | 1.5766E‐11 |
| TP53TG1 | RHEB | 0.338549143 | 3.7103E‐10 |
| TP53TG1 | FADD | 0.322540605 | 2.6472E‐09 |
| TP53TG1 | RAB7A | 0.320497198 | 3.3743E‐09 |
| TP53TG1 | HDAC1 | 0.316709215 | 5.2662E‐09 |
| TP53TG1 | ATG4B | 0.310888419 | 1.0312E‐08 |
| TP53TG1 | DIRAS3 | 0.305503826 | 1.8954E‐08 |
| TP53TG1 | RGS19 | 0.300279741 | 3.5506E‐08 |
| DHRS4‐AS1 | PRKAR1A | 0.304280356 | 2.6545E‐08 |
| DHRS4‐AS1 | BIRC6 | 0.307830991 | 1.7911E‐08 |
| DHRS4‐AS1 | RPTOR | 0.313316207 | 9.6535E‐09 |
| DHRS4‐AS1 | WDFY3 | 0.314945434 | 8.0148E‐09 |
| DHRS4‐AS1 | GOPC | 0.319627801 | 5.2128E‐09 |
| DHRS4‐AS1 | MAPK1 | 0.320002607 | 4.4667E‐09 |
| DHRS4‐AS1 | ST13 | 0.322382713 | 3.3795E‐09 |
| DHRS4‐AS1 | PIK3R4 | 0.323543353 | 2.9471E‐09 |
| DHRS4‐AS1 | NCKAP1 | 0.367547056 | 1.0542E‐11 |
| DHRS4‐AS1 | SIRT1 | 0.40099047 | 7.8826E‐14 |
| DHRS4‐AS1 | NBR1 | 0.430691637 | 6.6613E‐16 |
| ZNF674‐AS1 | ITPR1 | −0.319258764 | 1.3176E‐08 |
| ZNF674‐AS1 | TP53INP2 | −0.313961307 | 7.2452E‐09 |
| ZNF674‐AS1 | EIF2S1 | 0.304321171 | 2.163E‐08 |
| ZNF674‐AS1 | PARP1 | 0.311082339 | 1.0086E‐08 |
| ZNF674‐AS1 | HDAC1 | 0.311370172 | 9.7591E‐09 |
| ZNF674‐AS1 | EEF2K | 0.319838206 | 3.6476E‐09 |
| ZNF674‐AS1 | TM9SF1 | 0.321374147 | 3.0412E‐09 |
| ZNF674‐AS1 | GNAI3 | 0.331509862 | 8.9278E‐10 |
| ZNF674‐AS1 | FKBP1A | 0.339350907 | 3.3524E‐10 |
| ZNF674‐AS1 | ATG4B | 0.34228221 | 2.308E‐10 |
| ZNF674‐AS1 | PELP1 | 0.342564645 | 2.226E‐10 |
| ZNF674‐AS1 | FADD | 0.344531987 | 1.7285E‐10 |
| ZNF674‐AS1 | ENSG00000177993.3 | 0.344786314 | 1.6727E‐10 |
| ZNF674‐AS1 | HGS | 0.349662833 | 8.8614E‐11 |
| ZNF674‐AS1 | WDR45 | 0.350583974 | 7.8496E‐11 |
| ZNF674‐AS1 | CAPN10 | 0.357666059 | 3.0499E‐11 |
| ZNF674‐AS1 | RHEB | 0.357722928 | 3.0266E‐11 |
| ZNF674‐AS1 | MAP1LC3C | 0.358011106 | 2.9109E‐11 |
| ZNF674‐AS1 | BIRC5 | 0.365800568 | 3.2339E‐11 |
| ZNF674‐AS1 | MAP2K7 | 0.37311006 | 3.5731E‐12 |
| ZNF674‐AS1 | STK11 | 0.375183168 | 2.6561E‐12 |
| ZNF674‐AS1 | GNB2L1 | 0.402865027 | 4.1078E‐14 |
| ZNF674‐AS1 | PRKAB1 | 0.411848633 | 9.77E‐15 |
| ZNF674‐AS1 | EIF4EBP1 | 0.441387008 | 0 |
| ZNF674‐AS1 | RAF1 | 0.471527103 | 0 |
| ZNF674‐AS1 | HDAC6 | 0.529212582 | 0 |
| MAPKAPK5‐AS1 | DLC1 | −0.37599408 | 2.7613E‐12 |
| MAPKAPK5‐AS1 | CTSB | −0.321021809 | 3.1711E‐09 |
| MAPKAPK5‐AS1 | RGS19 | −0.304801176 | 2.1559E‐08 |
| MAPKAPK5‐AS1 | PRKCD | −0.303327412 | 7.978E‐08 |
| MAPKAPK5‐AS1 | APOL1 | −0.301552957 | 5.851E‐08 |
| MAPKAPK5‐AS1 | EIF2S1 | 0.306873043 | 1.6255E‐08 |
| MAPKAPK5‐AS1 | STK11 | 0.316360528 | 5.4847E‐09 |
| MAPKAPK5‐AS1 | ATG3 | 0.317029326 | 5.073E‐09 |
| MAPKAPK5‐AS1 | GNB2L1 | 0.325707112 | 1.8109E‐09 |
| MAPKAPK5‐AS1 | PRKAB1 | 0.332894214 | 7.5251E‐10 |
| MAPKAPK5‐AS1 | MAP2K7 | 0.334240467 | 6.3674E‐10 |
| MAPKAPK5‐AS1 | ATG4B | 0.342782716 | 2.1647E‐10 |
| MAPKAPK5‐AS1 | GABARAPL2 | 0.344580777 | 1.7176E‐10 |
| MAPKAPK5‐AS1 | RAF1 | 0.368047755 | 7.3084E‐12 |
| MAPKAPK5‐AS1 | HDAC6 | 0.370823221 | 4.9445E‐12 |
| MAPKAPK5‐AS1 | HGS | 0.373857161 | 3.2117E‐12 |
| MAPKAPK5‐AS1 | BID | 0.396105786 | 1.1813E‐13 |
| MAPKAPK5‐AS1 | RAB24 | 0.404333356 | 3.2641E‐14 |
| MAPKAPK5‐AS1 | GABARAP | 0.420904922 | 2.2204E‐15 |
| MAPKAPK5‐AS1 | PELP1 | 0.451556383 | 0 |
| MAPKAPK5‐AS1 | CDKN1B | 0.456366201 | 0 |
| COX10‐AS1 | MAP1LC3A | −0.375521773 | 2.53E‐12 |
| COX10‐AS1 | TP53INP2 | −0.369627107 | 5.854E‐12 |
| COX10‐AS1 | PINK1 | −0.367447805 | 7.9483E‐12 |
| COX10‐AS1 | GABARAPL1 | −0.345745019 | 1.4775E‐10 |
| COX10‐AS1 | HDAC1 | 0.30053166 | 3.2895E‐08 |
| COX10‐AS1 | FKBP1A | 0.305650956 | 1.8644E‐08 |
| COX10‐AS1 | RB1 | 0.307329731 | 1.544E‐08 |
| COX10‐AS1 | ATF6 | 0.308265668 | 1.3892E‐08 |
| COX10‐AS1 | HGS | 0.312518629 | 8.5551E‐09 |
| COX10‐AS1 | NAF1 | 0.313398471 | 7.7313E‐09 |
| COX10‐AS1 | PIK3C3 | 0.323065939 | 2.4864E‐09 |
| COX10‐AS1 | ITGB1 | 0.330112011 | 1.0601E‐09 |
| COX10‐AS1 | PRKAB1 | 0.333014795 | 7.4136E‐10 |
| COX10‐AS1 | GNB2L1 | 0.344926977 | 1.6425E‐10 |
| COX10‐AS1 | PARP1 | 0.345318807 | 1.5614E‐10 |
| COX10‐AS1 | EIF2S1 | 0.3460972 | 1.4116E‐10 |
| COX10‐AS1 | FADD | 0.361593998 | 1.7871E‐11 |
| COX10‐AS1 | MYC | 0.375188431 | 2.6541E‐12 |
| COX10‐AS1 | EEF2K | 0.377661311 | 1.8581E‐12 |
| COX10‐AS1 | EIF4EBP1 | 0.405855635 | 2.5757E‐14 |
| COX10‐AS1 | EIF2AK3 | 0.419195952 | 2.8866E‐15 |
| COX10‐AS1 | HDAC6 | 0.428787718 | 4.4409E‐16 |
| COX10‐AS1 | GNAI3 | 0.439816001 | 0 |
| COX10‐AS1 | BIRC5 | 0.448936102 | 0 |
| COX10‐AS1 | RAF1 | 0.572860513 | 0 |
| GABPB1‐AS1 | BID | 0.420118584 | 2.4425E‐15 |
| GABPB1‐AS1 | BIRC6 | 0.36038314 | 2.1089E‐11 |
| GABPB1‐AS1 | CASP4 | −0.343935388 | 5.2362E‐10 |
| GABPB1‐AS1 | CCL2 | −0.373849011 | 3.2156E‐12 |
| GABPB1‐AS1 | CCR2 | −0.368177579 | 3.6858E‐11 |
| GABPB1‐AS1 | CDKN1B | 0.364553409 | 1.1889E‐11 |
| GABPB1‐AS1 | CTSB | −0.372819935 | 3.7241E‐12 |
| GABPB1‐AS1 | CTSD | −0.43970168 | 0 |
| GABPB1‐AS1 | DAPK1 | 0.323366578 | 2.3986E‐09 |
| GABPB1‐AS1 | DIRAS3 | −0.300618621 | 3.2582E‐08 |
| GABPB1‐AS1 | DLC1 | −0.313694777 | 8.3115E‐09 |
| GABPB1‐AS1 | DNAJB1 | −0.308644775 | 1.3309E‐08 |
| GABPB1‐AS1 | EEF2 | 0.36428838 | 1.2333E‐11 |
| GABPB1‐AS1 | GNB2L1 | 0.304868539 | 2.0349E‐08 |
| GABPB1‐AS1 | GRID2 | 0.358164661 | 1.2447E‐10 |
| GABPB1‐AS1 | HDAC6 | 0.583737387 | 0 |
| GABPB1‐AS1 | KLHL24 | 0.37211066 | 4.1194E‐12 |
| GABPB1‐AS1 | MAP1LC3A | −0.335686931 | 5.3165E‐10 |
| GABPB1‐AS1 | MAP2K7 | 0.351129758 | 7.3042E‐11 |
| GABPB1‐AS1 | MYC | 0.350474546 | 7.9636E‐11 |
| GABPB1‐AS1 | NAMPT | −0.317006934 | 5.0863E‐09 |
| GABPB1‐AS1 | PARP1 | 0.318853967 | 4.0962E‐09 |
| GABPB1‐AS1 | PEA15 | 0.306793364 | 1.6401E‐08 |
| GABPB1‐AS1 | PELP1 | 0.350174812 | 8.2843E‐11 |
| GABPB1‐AS1 | PPP1R15A | −0.432497553 | 4.4409E‐16 |
| GABPB1‐AS1 | PRKCD | −0.354522637 | 2.4201E‐10 |
| GABPB1‐AS1 | RAF1 | 0.518711717 | 0 |
| GABPB1‐AS1 | SERPINA1 | −0.35246404 | 9.1958E‐11 |
| GABPB1‐AS1 | SIRT1 | 0.377399334 | 1.9298E‐12 |
| GABPB1‐AS1 | SQSTM1 | −0.300514253 | 3.2958E‐08 |
| GABPB1‐AS1 | VAMP3 | −0.349193236 | 9.4249E‐11 |
| GABPB1‐AS1 | WIPI1 | −0.425794454 | 8.8818E‐16 |
| DDX11‐AS1 | PINK1 | −0.380737586 | 1.1873E‐12 |
| DDX11‐AS1 | PRKCD | −0.337496704 | 1.8761E‐09 |
| DDX11‐AS1 | MAP1LC3A | −0.321966423 | 2.8346E‐09 |
| DDX11‐AS1 | TP53INP2 | −0.315547251 | 6.0291E‐09 |
| DDX11‐AS1 | EIF2AK3 | 0.301487968 | 2.9609E‐08 |
| DDX11‐AS1 | EIF2S1 | 0.34484361 | 1.6603E‐10 |
| DDX11‐AS1 | FKBP1A | 0.36028176 | 2.1383E‐11 |
| DDX11‐AS1 | MAP2K7 | 0.361662635 | 1.7704E‐11 |
| DDX11‐AS1 | MYC | 0.36701736 | 8.4412E‐12 |
| DDX11‐AS1 | PRKAB1 | 0.367277985 | 8.1393E‐12 |
| DDX11‐AS1 | HGS | 0.398721365 | 7.8604E‐14 |
| DDX11‐AS1 | PARP1 | 0.399014394 | 7.5051E‐14 |
| DDX11‐AS1 | GNB2L1 | 0.446121011 | 0 |
| DDX11‐AS1 | HDAC6 | 0.4630659 | 0 |
| DDX11‐AS1 | BIRC5 | 0.494242839 | 0 |
| DDX11‐AS1 | EIF4EBP1 | 0.494327951 | 0 |
| DDX11‐AS1 | RAF1 | 0.595959165 | 0 |
| SBF2‐AS1 | SIRT1 | −0.359724478 | 2.6578E‐11 |
| SBF2‐AS1 | BID | −0.359318057 | 2.8079E‐11 |
| SBF2‐AS1 | EEF2 | −0.345315983 | 1.7787E‐10 |
| SBF2‐AS1 | HDAC6 | −0.30180643 | 3.1545E‐08 |
| SBF2‐AS1 | HSPA5 | 0.303106799 | 2.7341E‐08 |
| SBF2‐AS1 | NAMPT | 0.305876474 | 2.0115E‐08 |
| SBF2‐AS1 | DLC1 | 0.313900704 | 9.0314E‐09 |
| SBF2‐AS1 | PPP1R15A | 0.315700878 | 6.5975E‐09 |
| SBF2‐AS1 | FKBP1B | 0.330524677 | 1.1347E‐09 |
| SBF2‐AS1 | WIPI1 | 0.347602864 | 1.3239E‐10 |
| SBF2‐AS1 | DIRAS3 | 0.34895202 | 1.111E‐10 |
| SBF2‐AS1 | CFLAR | 0.353930283 | 5.7749E‐11 |
| SBF2‐AS1 | CCR2 | 0.365426608 | 6.1051E‐11 |
| SBF2‐AS1 | CASP4 | 0.387535164 | 1.7764E‐12 |
| SBF2‐AS1 | CTSD | 0.39811287 | 1.0303E‐13 |
| SBF2‐AS1 | RAB33B | 0.41262521 | 1.0436E‐14 |
| SBF2‐AS1 | MAP1LC3A | 0.466078431 | 0 |
| MIR4453HG | BIRC6 | 0.482298774 | 0 |
| MIR4453HG | CCL2 | −0.32967133 | 1.1188E‐09 |
| MIR4453HG | CCR2 | −0.306263916 | 5.3174E‐08 |
| MIR4453HG | CDKN1B | 0.37854434 | 1.6347E‐12 |
| MIR4453HG | CTSD | −0.36405224 | 1.2743E‐11 |
| MIR4453HG | EEF2 | 0.339277778 | 3.3836E‐10 |
| MIR4453HG | EIF2AK3 | 0.30731381 | 1.5468E‐08 |
| MIR4453HG | EIF2S1 | 0.300378118 | 3.3454E‐08 |
| MIR4453HG | ERBB2 | 0.31509245 | 6.356E‐09 |
| MIR4453HG | GRID2 | 0.33900455 | 1.3033E‐09 |
| MIR4453HG | HDAC6 | 0.530273615 | 0 |
| MIR4453HG | MBTPS2 | 0.372080137 | 4.1376E‐12 |
| MIR4453HG | MLST8 | 0.336179553 | 4.9987E‐10 |
| MIR4453HG | NAF1 | 0.343120261 | 2.0729E‐10 |
| MIR4453HG | NBR1 | 0.332149604 | 9.3012E‐10 |
| MIR4453HG | NCKAP1 | 0.315032585 | 6.7536E‐09 |
| MIR4453HG | PIK3C3 | 0.398066735 | 8.7041E‐14 |
| MIR4453HG | PIK3R4 | 0.383400705 | 8.0247E‐13 |
| MIR4453HG | RAF1 | 0.446543819 | 0 |
| MIR4453HG | SERPINA1 | −0.316157599 | 7.7713E‐09 |
| MIR4453HG | SIRT1 | 0.394985589 | 1.4033E‐13 |
| MIR4453HG | ST13 | 0.343209924 | 2.0492E‐10 |
| MIR4453HG | TSC2 | 0.324952539 | 2.1001E‐09 |
| MIR4453HG | USP10 | 0.330643906 | 1.3364E‐09 |
| MIR4453HG | VAMP3 | −0.34420749 | 1.8024E‐10 |
| MIR4453HG | WDFY3 | 0.321627435 | 2.9511E‐09 |
| MIR4453HG | WIPI1 | −0.324415393 | 2.1154E‐09 |
Figure 1.
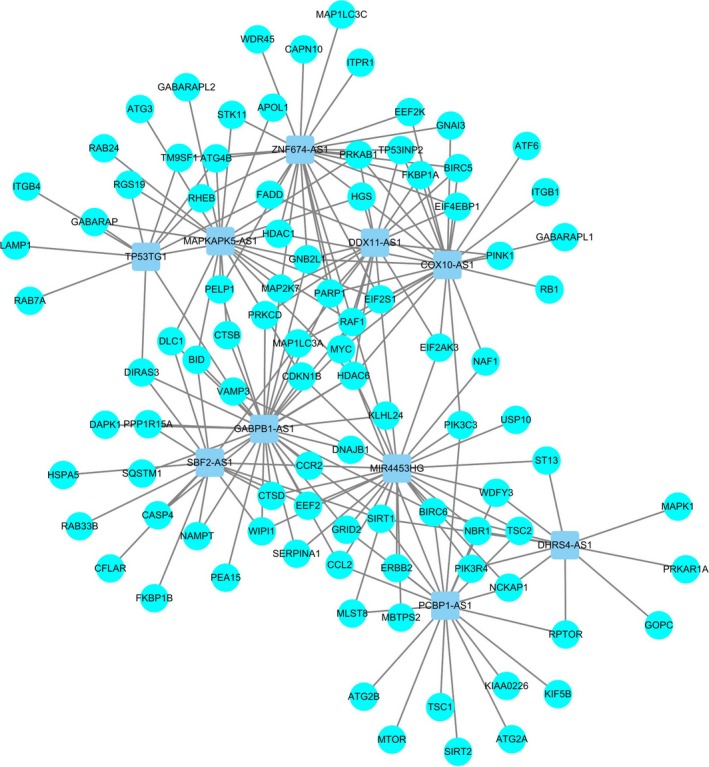
Network of prognostic lncRNAs with co‐expressed autophagy genes in glioma. In the centric position, grey blue nodes indicate lncRNAs and the sky blue indicates autophagy genes. The coexpression network is visualized by cytoscape 3.4 software.
Table 2.
Detailed information for 10 autophagy‐related lncRNAs significantly associated with OS in glioma
| LncRNA | Ensemble ID | β | SE | P | HR | Lower | Upper |
|---|---|---|---|---|---|---|---|
| PCBP1‐AS1 | ENSG00000179818 | −0.363 | 0.184 | 0.049 | 0.696 | 0.485 | 0.998 |
| TP53TG1 | ENSG00000182165 | 0.443 | 0.16 | 0.006 | 1.558 | 1.139 | 2.131 |
| DHRS4‐AS1 | ENSG00000215256 | −0.253 | 0.099 | 0.01 | 0.776 | 0.639 | 0.942 |
| ZNF674‐AS1 | ENSG00000230844 | 0.448 | 0.199 | 0.024 | 1.565 | 1.06 | 2.31 |
| MAPKAPK5‐AS1 | ENSG00000234608 | −0.64 | 0.245 | 0.009 | 0.527 | 0.326 | 0.852 |
| COX10‐AS1 | ENSG00000236088 | 0.829 | 0.194 | < 0.001 | 2.29 | 1.565 | 3.351 |
| GABPB1‐AS1 | ENSG00000244879 | −0.403 | 0.154 | 0.009 | 0.668 | 0.494 | 0.904 |
| DDX11‐AS1 | ENSG00000245614 | 0.296 | 0.128 | 0.021 | 1.344 | 1.046 | 1.726 |
| SBF2‐AS1 | ENSG00000246273 | 0.134 | 0.064 | 0.036 | 1.143 | 1.009 | 1.295 |
| MIR4453HG | ENSG00000268471 | −0.551 | 0.155 | < 0.001 | 0.577 | 0.426 | 0.781 |
Figure 2.

Kaplan–Meier survival curves for the 10 prognostic lncRNAs for glioma in CCGA dataset. The 10 autophagy‐related lncRNAs were found to be independent prognostic factors for glioma patients, of which five lncRNAs were unfavorable factors (TP53TG1, ZNF674‐AS1, COX10‐AS1, DDX11‐AS1 and SBF2‐AS1) and five lncRNAs were confirmed to be favorable prognostic factors for glioma (PCBP1‐AS1, DHRS4‐AS1, GABPB1‐AS1, MAPKAPK5‐AS1 and MIR4453HG).
The prognostic impact of an autophagy‐related lncRNA signature for glioma
Next, we use a risk score method to develop an autophagy‐related lncRNA signature. We divided the glioma patients into two groups (low‐risk group and high‐risk group) by median risk score (Fig. 3). As a result, the risk score could significantly predict the OS of glioma patients, in which the OS period is longer in the low‐risk group than that in the high‐risk group (median OS 1211 vs 346 days; log rank P < 0.05). Additionally, the Cox regression analysis also revealed a significant prognostic effect of the risk score on the glioma patients (HR = 5.307, 95% CI: 4.195–8.305; P < 0.0001, Fig. 4). Further, we also explored whether the risk score signature is an independent predictor for the prognosis of glioma patients by multivariate Cox regression analysis. As a consequence, a HR of 2.736 indicated that the risk score could significantly contribute to the prediction of survival of glioma patients, eliminating the influence of other factors such as sex, age, grade, radiotherapy, chemotherapy and the molecular status (IDHDampR, TP53.1, EGFR, ATRX and EZH2) (Table 3).
Figure 3.
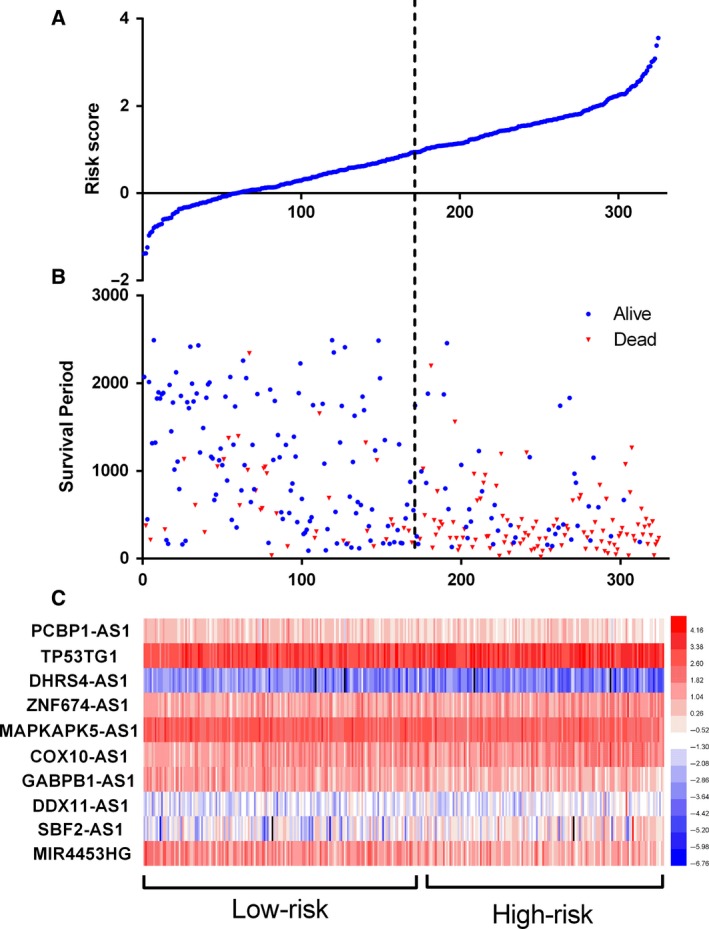
Autophagy‐related lncRNA risk score analysis of glioma patients in CCGA. (A) The low and high score group for the autophagy‐related lncRNA signature in glioma patients. (B) The survival status and duration of glioma cases. (C) Heatmap of the 10 key lncRNAs expression in glioma. The color from blue to red shows an increasing trend from low levels to high levels.
Figure 4.
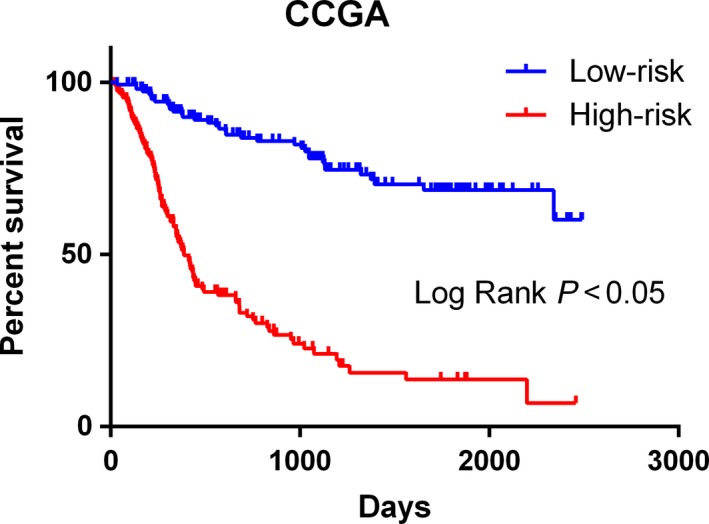
Kaplan–Meier survival curves for the autophagy‐related lncRNA risk score for glioma in CCGA dataset. The Kaplan–Meier survival curves showed that the OS period is longer in the low‐risk group than that in the high‐risk group in the CCGA datasets (median OS 1211 vs 346 days; log rank P < 0.05).
Table 3.
Multivariate Cox regression analysis of characteristics and risk score in glioma
| Variable | β | SE | Wald | P | HR | Lower | Upper |
|---|---|---|---|---|---|---|---|
| Gender | −0.022 | 0.221 | 0.01 | 0.921 | 0.978 | 0.635 | 1.507 |
| Age | 0 | 0.01 | 0 | 0.987 | 1 | 0.98 | 1.021 |
| Grade | 0.831 | 0.16 | 26.965 | < 0.001 | 2.296 | 1.678 | 3.143 |
| Radiotherapy | −0.932 | 0.206 | 20.553 | < 0.001 | 0.394 | 0.263 | 0.589 |
| Chemotherapy | −0.469 | 0.207 | 5.143 | 0.023 | 0.626 | 0.417 | 0.938 |
| IDHDampR | −0.639 | 0.248 | 6.641 | 0.01 | 0.528 | 0.324 | 0.858 |
| TP53.1 | −0.334 | 0.186 | 3.23 | 0.072 | 0.716 | 0.498 | 1.031 |
| EGFR | −0.165 | 0.212 | 0.605 | 0.437 | 0.848 | 0.559 | 1.285 |
| ATRX | −0.817 | 0.41 | 3.98 | 0.046 | 0.442 | 0.198 | 0.986 |
| EZH2 | 0.477 | 0.271 | 3.104 | 0.078 | 1.612 | 0.948 | 2.742 |
| Risk score | 1.006 | 0.243 | 17.156 | < 0.001 | 2.736 | 1.699 | 4.405 |
Clinical value of the lncRNA signature for glioma patients
Subsequently, we also determined the clinical value of the 10‐lncRNA signature regarding the grade, radiotherapy and chemotherapy. As shown in the Table 4, the risk score tends to increase in the higher grades, suggesting that this lncRNA signature might be associated with the progression of glioma. Interestingly, the risk score was lower in patients receiving radiotherapy than that in patients without radiotherapy (t = −2.267, P = 0.025). In contrast to the results of radiotherapy, a higher risk score was found in patients without chemotherapy, while the patients who had received chemotherapy presented a lower risk score. Moreover, we also assessed differences in risk score based on molecular status. As a result, lower risk scores were found in those with the IDH mutation than in those without, indicating a potential association between the lncRNA signature and IDH mutation.
Table 4.
Clinical impact of risk score signature for the CCGA cohort
| Clinicopathological feature | n | Risk score | |||
|---|---|---|---|---|---|
| Mean | SD | t | P | ||
| Grade | |||||
| I–II | 216 | 1.203847424 | 0.8808 | 10.898 | < 0.001 |
| III–IV | 109 | 0.245607385 | 0.6717 | ||
| Radiotherapy | |||||
| Yes | 212 | 0.777059137 | 0.9674 | −2.267 | 0.025 |
| No | 84 | 1.029456602 | 0.8189 | ||
| Chemotherapy | |||||
| Yes | 158 | 1.01284085 | 0.8665 | 2.604 | 0.01 |
| No | 128 | 0.727299406 | 0.9862 | ||
| IDH (DNA and RNA) | |||||
| Mutation | 171 | 0.497626264 | 0.8174 | −8.69 | < 0.001 |
| Wildtype | 154 | 1.30979323 | 0.8671 | ||
| IDH1‐R32 | |||||
| Wildtype | 162 | 0.509472199 | 0.8242 | −7.824 | < 0.001 |
| Mutation | 163 | 1.253176395 | 0.8881 | ||
| TP53.1 | |||||
| Wildtype | 189 | 0.937494898 | 0.9505 | 1.254 | 0.211 |
| Mutation | 136 | 0.805997888 | 0.9062 | ||
| EGFR | |||||
| Wildtype | 110 | 0.770831973 | 0.9802 | −1.546 | 0.123 |
| Mutation | 215 | 0.939584798 | 0.905 | ||
| ATRX | |||||
| Wildtype | 33 | 0.856142312 | 0.9358 | −0.171 | 0.865 |
| Mutation | 292 | 0.885443672 | 0.9343 | ||
| EZH2 | |||||
| Wildtype | 37 | 1.182088779 | 1.1162 | 1.77 | 0.084 |
| Mutation | 288 | 0.843975569 | 0.9019 | ||
Validation in the TCGA dataset
Next, these results were further validated in the additional dataset (TCGA) using the same β value. In total, 160 GBM patients were enrolled for the validation of the lncRNA signature (Fig. 5). We divided these patients into the high‐risk and low‐risk groups on the basis of the median value of the risk score. Consistent with the results derived from the CGGA dataset, the high‐risk patients had a shorter median OS than that of the low‐risk patients (median OS 385 vs 468 days; log rank P = 0.012; Fig. 6). This finding was further validated by Cox regression analysis, in which the high‐risk group tended to have a shorter OS time for GBM patients than that of the low‐risk group (HR = 1.544, 95% CI: 1.110–2.231; P = 0.031). In light of these results, we could confirm that the lncRNA signature provides a robust prediction for the prognosis of glioma patients.
Figure 5.
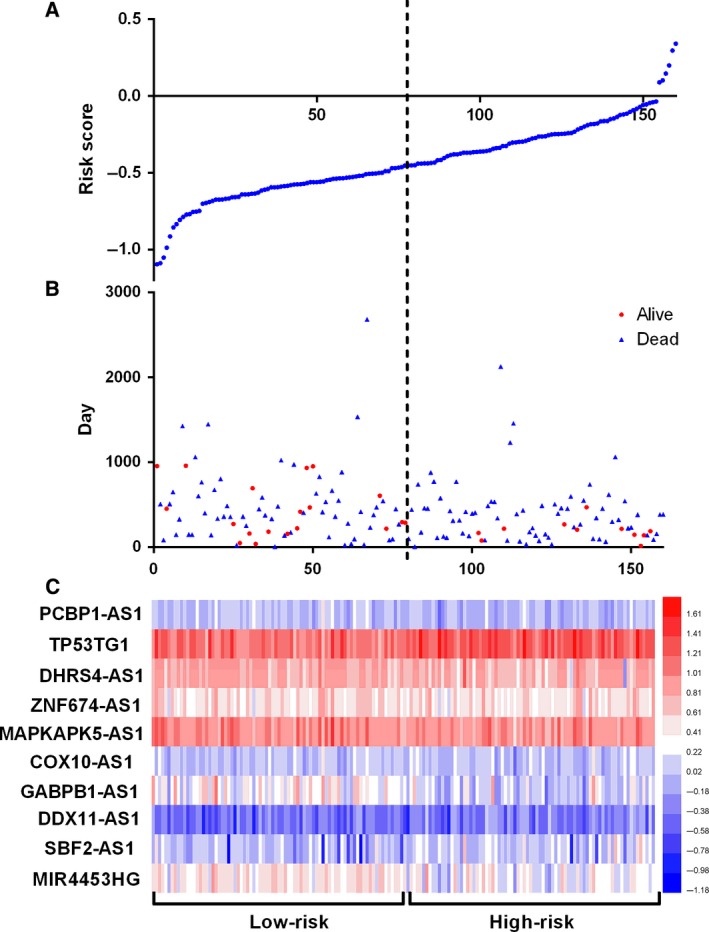
Autophagy‐related lncRNA risk score analysis of glioma patients in TCGA. (A) The low and high score group for the autophagy‐related lncRNA signature in glioma patients. (B) The survival status and duration of glioma cases. (C) Heatmap of the 10 key lncRNAs expressed in glioma. The color from blue to red shows an increasing trend from low levels to high levels.
Figure 6.
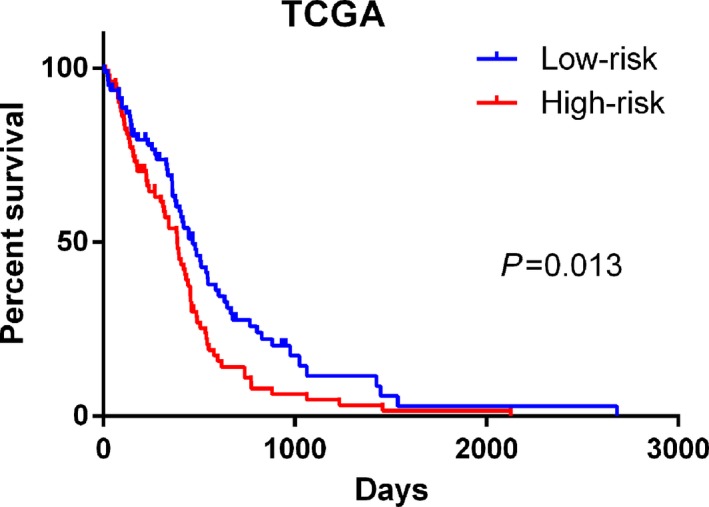
Kaplan–Meier survival curves for the autophagy‐related lncRNA risk score for glioma in TCGA dataset. Consistent with the results derived from the CGGA dataset, the high‐risk patients had a shorter median OS than that of the low‐risk patients in TCGA datasets (median OS 385 vs 468 days; log rank P = 0.012).
Gene set enrichment analysis
Further functional annotation was conducted through GSEA. The results revealed that the differentially expressed genes between the two groups were enriched in the autophagy‐related and tumor‐related pathways. As result, a total of 19 gene sets were significantly enriched at a nominal P‐value < 5% (Table 5). Among the gene sets, several pathways are well‐established in cancers, including interleukin (IL) 6/Janus kinase/signal transducer and activator of transcription (STAT) 3 signaling, tumor necrosis factor α signaling via nuclear factor‐κB, IL2/STAT5 signaling, the p53 pathway and the KRAS signaling pathway (Fig. 7). Moreover, the gene sets were also found to be involved in the vital functions of tumorigenesis and progression of cancer. For instance, epithelial mesenchymal transition, angiogenesis and hypoxia were closely related to the invasion and metastasis of cancer (Fig. 8). Notably, the GSEA revealed that the gene sets were involved in the reactive oxygen species pathway, interferon (IFN)‐γ response, IFN‐α response and inflammatory response, which are strongly associated with autophagy (Fig. 9). Taken together, the defined autophagy‐related genes contribute to vital cancer and autophagy pathways, which might provide strong evidence for a cancer‐targeted treatment for glioma.
Table 5.
Gene set enrichment analysis results based on the signature of 10 autophagy lncRNAs
| Name | Size | ES | NES | NOM P‐value | FDR q‐value | FWER P‐value | Rank at max | Leading edge |
|---|---|---|---|---|---|---|---|---|
| Hallmark_Interferon_gamma_response | 194 | 0.663942 | 2.002969 | 0.003831 | 0.03201 | 0.019 | 3784 | tags = 62%, list = 18%, signal = 74% |
| Hallmark_Coagulation | 134 | 0.546977 | 1.968419 | 0 | 0.024199 | 0.027 | 4273 | tags = 47%, list = 20%, signal = 58% |
| Hallmark_Allograft_rejection | 196 | 0.606039 | 1.934347 | 0.005894 | 0.02353 | 0.037 | 4277 | tags = 59%, list = 20%, signal = 73% |
| Hallmark_Epithelial_mesenchymal_transition | 195 | 0.61046 | 1.914759 | 0.01354 | 0.02293 | 0.051 | 4360 | tags = 62%, list = 20%, signal = 77% |
| Hallmark_Interferon_alpha_response | 95 | 0.695722 | 1.901815 | 0.007937 | 0.020948 | 0.057 | 3003 | tags = 61%, list = 14%, signal = 71% |
| Hallmark_Il6_jak_stat3_signaling | 86 | 0.627249 | 1.854703 | 0.011905 | 0.02949 | 0.083 | 4232 | tags = 60%, list = 20%, signal = 75% |
| Hallmark_Tnfa_signaling_via_nfkb | 197 | 0.609462 | 1.79719 | 0.024 | 0.041906 | 0.129 | 4243 | tags = 58%, list = 20%, signal = 72% |
| Hallmark_Angiogenesis | 35 | 0.582243 | 1.740052 | 0.005988 | 0.059463 | 0.178 | 4728 | tags = 57%, list = 22%, signal = 73% |
| Hallmark_Complement | 192 | 0.472855 | 1.732826 | 0.026263 | 0.056876 | 0.188 | 3996 | tags = 45%, list = 19%, signal = 55% |
| Hallmark_Hypoxia | 197 | 0.484747 | 1.725543 | 0.034068 | 0.053391 | 0.195 | 3666 | tags = 45%, list = 17%, signal = 54% |
| Hallmark_Glycolysis | 194 | 0.445341 | 1.707246 | 0.014 | 0.055343 | 0.223 | 4979 | tags = 49%, list = 23%, signal = 64% |
| Hallmark_Il2_stat5_signaling | 196 | 0.451793 | 1.706509 | 0.017341 | 0.050981 | 0.223 | 5329 | tags = 54%, list = 25%, signal = 71% |
| Hallmark_Reactive_oxigen_species_pathway | 46 | 0.522081 | 1.675037 | 0.017964 | 0.061012 | 0.263 | 2719 | tags = 39%, list = 13%, signal = 45% |
| Hallmark_Inflammatory_response | 194 | 0.527449 | 1.670621 | 0.037549 | 0.057958 | 0.266 | 5277 | tags = 59%, list = 25%, signal = 77% |
| Hallmark_P53_pathway | 195 | 0.411785 | 1.645334 | 0.027559 | 0.063102 | 0.302 | 4075 | tags = 38%, list = 19%, signal = 47% |
| Hallmark_Kras_signaling_up | 198 | 0.419712 | 1.634183 | 0.028 | 0.063116 | 0.318 | 4808 | tags = 51%, list = 22%, signal = 64% |
| Hallmark_Apoptosis | 159 | 0.432405 | 1.616621 | 0.023529 | 0.066577 | 0.339 | 5324 | tags = 53%, list = 25%, signal = 71% |
| Hallmark_Apical_surface | 44 | 0.402856 | 1.481723 | 0.034483 | 0.132731 | 0.539 | 1498 | tags = 23%, list = 7%, signal = 24% |
| Hallmark_Mtorc1_signaling | 193 | 0.417297 | 1.473019 | 0.094378 | 0.130749 | 0.55 | 4257 | tags = 44%, list = 20%, signal = 54% |
| Hallmark_Apical_junction | 195 | 0.35423 | 1.457525 | 0.066148 | 0.133971 | 0.567 | 3822 | tags = 33%, list = 18%, signal = 40% |
ES, enrichment score; FDR, false discovery rate; FWER, familywise‐error rate; NES, normalized enrichment score; NOM P Value, nominal P Value.
Figure 7.
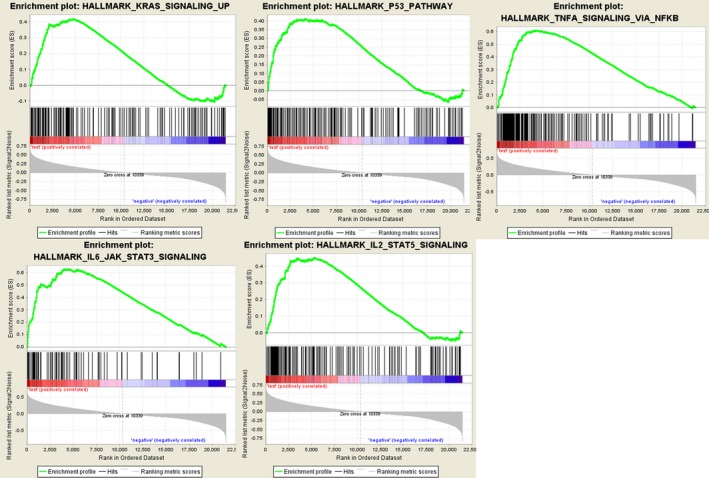
Gene set enrichment analysis indicated significant enrichment of hallmark cancer‐related pathways in the high‐risk group based on CCGA dataset. JAK, Janus kinase; NFKB, nuclear factor‐κB; TNFA, tumour necrosis factor α.
Figure 8.
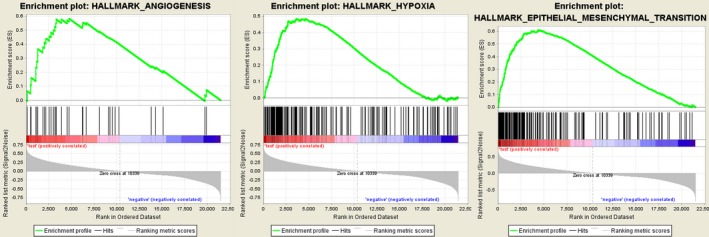
Gene set enrichment analysis indicated significant enrichment of the progression‐ and metastasis‐related pathway in the high‐risk group based on CCGA dataset.
Figure 9.
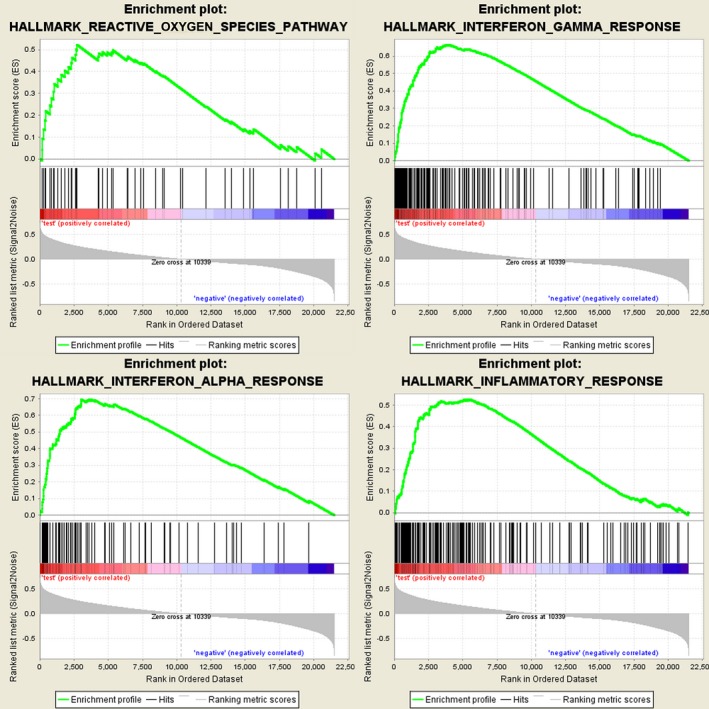
Gene set enrichment analysis indicated significant autophagy‐related enrichment based on CCGA dataset.
Discussion
Glioma is the most aggressive and common type of primary brain tumor in humans. With the development of clinical management of glioma, some prognostic factors are well characterized, including tumor size, tumor grade and stage. High‐throughput biological technologies are being widely used to predict cancer recurrence and tumor metastasis by detecting the alteration of miRNAs or genes 23, 24. The major class of lncRNAs, as a complement to genes or miRNAs, provides a promising opportunity to predict the risk of recurrence of glioma 25. However, so far, there has been no systematic process to identify lncRNA signature sets for predicting the survival of glioma patients. Therefore, it is necessary to establish a lncRNA signature to predict the prognosis of glioma patients.
In this study, two datasets (CGGA and TCGA) were collected to explore the prognosis of autophagy‐related lncRNAs for glioma patients. In the first step, we identified 402 lncRNAs through the lncRNA–autophagy gene co‐expression network. Furthermore, we identified 10 autophagy‐associated lncRNA signatures that could divide glioma patients into high‐ and low‐risk groups based on the median risk score. Additionally, it was found that the OS is longer in the low‐risk group than that in the high‐risk group. Through univariate and multivariate Cox regression analyses, we can conclude that the signature is an independent factor that is significantly related to OS.
Although little is known about the role of autophagy in cancer therapy to date, recent studies suggest that autophagy therapy will become a new approach to glioma treatment 26, 27. In recent studies, IFN‐γ was found to influence autophagy and cell growth in human hepatocellular carcinoma (HCC) cells. IFN‐γ is a cytokine with anti‐viral and immune regulation. The cytokine induces autophagosome formation and transformation of microtubule‐associated protein 1 light chain 3 proteins and can inhibit cell growth and non‐apoptotic cell death in Huh7 cells. In addition, autophagy in Huh7 cells is also activated by the overexpression of interferon‐regulatory factor‐1. Eventually, induced autophagy will inhibit IFN‐γ and cell death in HCC 28. Since autophagy can respond to a variety of stresses to promote the survival of cancer cells, it has protumorigenic functions. Glucose metabolism promotes adhesion‐independent conversion driven by oncogene insult‐mutationally active Ras. In human cancer cell lines carrying KRAS mutations and cells ectopically expressing oncogenic H‐Ras, autophagy is induced after the extracellular matrix is isolated. If autophagy is inhibited by RNA interference‐mediated depletion of multiple autophagic regulators or genetic deletion, Ras‐mediated conversion and glycolytic capacity proliferation independent of adhesion will be impaired. In addition, when the availability of glucose is decreased, the conversion and proliferation of autophagy‐deficient cells expressing oncogenic Ras are unaffected, which is just the opposite of that in autophagy‐competent cells. In conclusion, autophagy can promote the unique mechanism of Ras‐driven tumor growth in specific metabolic environments 29.
Among the 10 autophagy‐related lncRNAs, PCBP1‐AS1, DHRS4‐AS1, MAPKAPK5‐AS1 and GABPB1‐AS1 were risk‐associated genes, while TP53TG1, ZNF674‐AS1, DDX11‐AS1, SBF2‐AS1, MIR4453HG and COX10‐AS1 were protective genes. Specifically, we also found that the high‐risk group was enriched in the glycolysis pathway. Consistent with our studies, a recent study revealed that TP53TG1 might affect the expression of glucose metabolism‐related genes under glucose deprivation, leading to cell proliferation and migration of glioma cells 30. Additionally, MAPKAPK5‐AS1 regulates gene expression by acting with miRNAs and is significantly associated with the OS of liver cancer 31. Furthermore, the expression of COX10‐AS1 in oral cavity and oropharyngeal squamous cell carcinoma is more than twice that of normal cells 32.
All of the lncRNAs we identified directly or indirectly regulate autophagy, many by regulating miRNAs; thus, we must perform lncRNA–mRNA co‐expression analyses to assess the function of lncRNAs 33, 34, 35. Therefore, we can conclude that due to the various functions of lncRNAs, the 10 autophagy‐related lncRNAs we identified will be potential therapeutic targets 12, 36.
In conclusion, by constructing an autophagy–lncRNA coexpression network, we identified a signature of 10 autophagy‐related lncRNAs, which has prognostic value for glioma patients. In addition, our study classified low‐risk and high‐risk groups based on the median risk score, and each showed different autophagy states.
Conflict of interest
The authors declare no conflict of interest.
Author contributions
LM designed the study, and revised the manuscript. FL, the main author of study, conceived and designed the analysis and wrote the manuscript. WC and MC took part in analyzing the data and writing the manuscript. JY and HC analyzed the data and conducted the results. HY and TL contributed to writing and revising the manuscript. All authors read and approved the final manuscript.
Acknowledgements
This work was supported by Guangxi Medical Health Appropriate Technology Development and Application Project (S2017099).
Fangkun Luan and Wenjie Chen contributed equally to this article
References
- 1. Reni M, Mazza E, Zanon S, Gatta G and Vecht CJ (2017) Central nervous system gliomas. Crit Rev Oncol Hematol 113, 213–234. [DOI] [PubMed] [Google Scholar]
- 2. Louis DN, Ohgaki H, Wiestler OD, Cavenee WK, Burger PC, Jouvet A, Scheithauer BW and Kleihues P (2007) The 2007 WHO classification of tumours of the central nervous system. Acta Neuropathol 114, 97–109. [DOI] [PMC free article] [PubMed] [Google Scholar]
- 3. Shergalis A, Bankhead A, Luesakul U, Muangsin N and Neamati N (2018) Current challenges and opportunities in treating glioblastoma. Pharmacol Rev 70, 412–445. [DOI] [PMC free article] [PubMed] [Google Scholar]
- 4. Ohgaki H, Dessen P, Jourde B, Horstmann S, Nishikawa T, Di Patre P‐L, Burkhard C, Schüler D, Probst‐Hensch NM and Maiorka PC (2004) Genetic pathways to glioblastoma: a population‐based study. Can Res 64, 6892–6899. [DOI] [PubMed] [Google Scholar]
- 5. Maher EA, Brennan C, Wen PY, Durso L, Ligon KL, Richardson A, Khatry D, Feng B, Sinha R and Louis DN (2006) Marked genomic differences characterize primary and secondary glioblastoma subtypes and identify two distinct molecular and clinical secondary glioblastoma entities. Can Res 66, 11502–11513. [DOI] [PubMed] [Google Scholar]
- 6. Parsons DW, Jones S, Zhang X, Lin JC‐H, Leary RJ, Angenendt P, Mankoo P, Carter H, Siu I‐M and Gallia GL (2008) An integrated genomic analysis of human glioblastoma multiforme. Science 321, 1807–1812. [DOI] [PMC free article] [PubMed] [Google Scholar]
- 7. Levine B and Kroemer G (2008) Autophagy in the pathogenesis of disease. Cell 132, 27–42. [DOI] [PMC free article] [PubMed] [Google Scholar]
- 8. Janku F, McConkey DJ, Hong DS and Kurzrock R (2011) Autophagy as a target for anticancer therapy. Nat Rev Clin Oncol 8, 528. [DOI] [PubMed] [Google Scholar]
- 9. Amaravadi RK, Lippincott‐Schwartz J, Yin X‐M, Weiss WA, Takebe N, Timmer W, DiPaola RS, Lotze MT and White E (2011) Principles and current strategies for targeting autophagy for cancer treatment. Clin Cancer Res 17, 654–666. [DOI] [PMC free article] [PubMed] [Google Scholar]
- 10. Sui X, Chen R, Wang Z, Huang Z, Kong N, Zhang M, Han W, Lou F, Yang J and Zhang Q (2013) Autophagy and chemotherapy resistance: a promising therapeutic target for cancer treatment. Cell Death Dis 4, e838. [DOI] [PMC free article] [PubMed] [Google Scholar]
- 11. Lefranc F, Facchini V and Kiss R (2007) Proautophagic drugs: a novel means to combat apoptosis‐resistant cancers, with a special emphasis on glioblastomas. Oncologist 12, 1395–1403. [DOI] [PubMed] [Google Scholar]
- 12. Mercer TR, Dinger ME and Mattick JS (2009) Long non‐coding RNAs: insights into functions. Nat Rev Genet 10, 155. [DOI] [PubMed] [Google Scholar]
- 13. Chen YG, Satpathy AT and Chang HY (2017) Gene regulation in the immune system by long noncoding RNAs. Nat Immunol 18, 962. [DOI] [PMC free article] [PubMed] [Google Scholar]
- 14. Bian EB, Li J, Xie YS, Zong G, Li J and Zhao B (2015) LncRNAs: new players in gliomas, with special emphasis on the interaction of lncRNAs With EZH2. J Cell Physiol 230, 496–503. [DOI] [PubMed] [Google Scholar]
- 15. Yao Y, Li J and Wang L (2014) Large intervening non‐coding RNA HOTAIR is an indicator of poor prognosis and a therapeutic target in human cancers. Int J Mol Sci 15, 18985–18999. [DOI] [PMC free article] [PubMed] [Google Scholar]
- 16. Chondrogianni N, Petropoulos I, Grimm S, Georgila K, Catalgol B, Friguet B, Grune T and Gonos ES (2014) Protein damage, repair and proteolysis. Mol Aspects Med 35, 1–71. [DOI] [PubMed] [Google Scholar]
- 17. O'Dwyer DN, Ashley SL and Moore BB (2016) Influences of innate immunity, autophagy, and fibroblast activation in the pathogenesis of lung fibrosis. Am J Physiol Lung Cell Mol Physiol 311, L590–L601. [DOI] [PMC free article] [PubMed] [Google Scholar]
- 18. Bhan A and Mandal SS (2015) LncRNA HOTAIR: a master regulator of chromatin dynamics and cancer. Biochim Biophys Acta 1856, 151–164. [DOI] [PMC free article] [PubMed] [Google Scholar]
- 19. Yang L, Zhang X, Li H and Liu J (2016) The long noncoding RNA HOTAIR activates autophagy by upregulating ATG3 and ATG7 in hepatocellular carcinoma. Mol BioSyst 12, 2605–2612. [DOI] [PubMed] [Google Scholar]
- 20. Ge D, Han L, Huang S, Peng N, Wang P, Jiang Z, Zhao J, Su L, Zhang S and Zhang Y (2014) Identification of a novel MTOR activator and discovery of a competing endogenous RNA regulating autophagy in vascular endothelial cells. Autophagy 10, 957–971. [DOI] [PMC free article] [PubMed] [Google Scholar]
- 21. Sun T (2017) Long noncoding RNAs act as regulators of autophagy in cancer. Pharmacol Res 129, 151–155. [DOI] [PubMed] [Google Scholar]
- 22. Shannon P, Markiel A, Ozier O, Baliga NS, Wang JT, Ramage D, Amin N, Schwikowski B and Ideker T (2003) Cytoscape: a software environment for integrated models of biomolecular interaction networks. Genome Res 13, 2498–2504. [DOI] [PMC free article] [PubMed] [Google Scholar]
- 23. van't Veer LJ, Rutgers EJ and Piccart M (2016) 70‐Gene signature in early‐stage breast cancer. N Engl J Med 375, 2200. [DOI] [PubMed] [Google Scholar]
- 24. Lerebours F, Cizeron‐Clairac G, Susini A, Vacher S, Mouret‐Fourme E, Belichard C, Brain E, Alberini JL, Spyratos F and Lidereau R (2013) miRNA expression profiling of inflammatory breast cancer identifies a 5‐miRNA signature predictive of breast tumor aggressiveness. Int J Cancer 133, 1614–1623. [DOI] [PubMed] [Google Scholar]
- 25. Niknafs YS, Han S, Ma T, Speers C, Zhang C, Wilder‐Romans K, Iyer MK, Pitchiaya S, Malik R and Hosono Y (2016) The lncRNA landscape of breast cancer reveals a role for DSCAM‐AS1 in breast cancer progression. Nat Commun 7, 12791. [DOI] [PMC free article] [PubMed] [Google Scholar]
- 26. Takeuchi H, Kondo Y, Fujiwara K, Kanzawa T, Aoki H, Mills GB and Kondo S (2005) Synergistic augmentation of rapamycin‐induced autophagy in malignant glioma cells by phosphatidylinositol 3‐kinase/protein kinase B inhibitors. Can Res 65, 3336–3346. [DOI] [PubMed] [Google Scholar]
- 27. Pavlides S, Vera I, Gandara R, Sneddon S, Pestell RG, Mercier I, Martinez‐Outschoorn UE, Whitaker‐Menezes D, Howell A and Sotgia F (2012) Warburg meets autophagy: cancer‐associated fibroblasts accelerate tumor growth and metastasis via oxidative stress, mitophagy, and aerobic glycolysis. Antioxid Redox Signal 16, 1264–1284. [DOI] [PMC free article] [PubMed] [Google Scholar]
- 28. Li P, Du Q, Cao Z, Guo Z, Evankovich J, Yan W, Chang Y, Shao L, Stolz DB and Tsung A (2012) Interferon‐gamma induces autophagy with growth inhibition and cell death in human hepatocellular carcinoma (HCC) cells through interferon‐regulatory factor‐1 (IRF‐1). Cancer Lett 314, 213–222. [DOI] [PMC free article] [PubMed] [Google Scholar]
- 29. Lock R, Roy S, Kenific CM, Su JS, Salas E, Ronen SM and Debnath J (2011) Autophagy facilitates glycolysis during Ras‐mediated oncogenic transformation. Mol Biol Cell 22, 165–178. [DOI] [PMC free article] [PubMed] [Google Scholar]
- 30. Chen X, Gao Y, Li D, Cao Y and Hao B (2017) LncRNA‐TP53TG1 participated in the stress response under glucose deprivation in glioma. J Cell Biochem 118, 4897–4904. [DOI] [PubMed] [Google Scholar]
- 31. Zhang J, Fan D, Jian Z, Chen GG and Lai PB (2015) Cancer specific long noncoding RNAs show differential expression patterns and competing endogenous RNA potential in hepatocellular carcinoma. PLoS One 10, e0141042. [DOI] [PMC free article] [PubMed] [Google Scholar]
- 32. Feng L, Houck JR, Lohavanichbutr P and Chen C (2017) Transcriptome analysis reveals differentially expressed lncRNAs between oral squamous cell carcinoma and healthy oral mucosa. Oncotarget 8, 31521. [DOI] [PMC free article] [PubMed] [Google Scholar]
- 33. Guo Q, Cheng Y, Liang T, He Y, Ren C, Sun L and Zhang G (2015) Comprehensive analysis of lncRNA‐mRNA co‐expression patterns identifies immune‐associated lncRNA biomarkers in ovarian cancer malignant progression. Sci Rep 5, 17683. [DOI] [PMC free article] [PubMed] [Google Scholar]
- 34. Liu Z, Li X, Sun N, Xu Y, Meng Y, Yang C, Wang Y and Zhang K (2014) Microarray profiling and co‐expression network analysis of circulating lncRNAs and mRNAs associated with major depressive disorder. PLoS One 9, e93388. [DOI] [PMC free article] [PubMed] [Google Scholar]
- 35. Li H, Wang W, Zhang L, Lan Q, Wang J, Cao Y and Zhao J (2017) Identification of a long noncoding RNA‐associated competing endogenous RNA network in intracranial aneurysm. World Neurosurg 97, 684–692.e4. [DOI] [PubMed] [Google Scholar]
- 36. Fang Y and Fullwood MJ (2016) Roles, functions, and mechanisms of long non‐coding RNAs in cancer. Genomics Proteomics Bioinformatics 14, 42–54. [DOI] [PMC free article] [PubMed] [Google Scholar]


