Abstract
The molecular mechanism of the occurrence and development of papillary thyroid carcinoma (PTC) has been widely explored, but has not been completely elucidated. The present study aimed to identify and analyze genes associated with PTC by bioinformatics methods. Two independent datasets were downloaded from Gene Expression Omnibus (GEO) database. The differentially expressed genes (DEGs) between PTC tissues and matched non-cancerous tissues were identified using GEO2R tool. The common DEGs in the two datasets were screened out by VennDiagram package, and analyzed by the following tools: KOBAS, Database for Annotation, Visualization, and Integrated Discovery (DAVID), Search tool for the retrieval of interacting genes/proteins (STRING), UALCAN and Gene expression profiling interactive analysis (GEPIA). A total of 513 common DEGs, including 259 common up-regulated and 254 common down-regulated genes in PTC, were screened out. These common up-regulated and down-regulated DEGs were most significantly enriched in cytokine–cytokine receptor interaction and metabolic pathways, respectively. Protein–protein interactions (PPI) network analysis showed that the up-regulated genes: FN1, SDC4, NMU, LPAR5 and the down-regulated genes: BCL2 and CXCL12 were key genes. Survival analysis indicated that the high expression of FN1 and NMU genes significantly decreased disease-free survival of patients with thyroid carcinoma. In conclusion, the genes and pathways identified in the current study will not only contribute to elucidating the pathogenesis of PTC, but also provide prognostic markers and therapeutic targets for PTC.
Keywords: Key gene, Papillary thyroid carcinom, Signaling pathway, Survival analysis
Introduction
Papillary thyroid carcinoma (PTC) is the most common subtype of thyroid malignancy, and accounts for approximately 75% of all thyroid cancers [1]. Although PTC has been reported as a curable malignancy with more than 90% 10-year survival, the incidence of PTC had been increasing and a subset of patients died of the disease due to local recurrence or distant metastasis [2–4]. Therefore, the molecules involved in the occurrence and development of PTC needs to be explored, which will contribute to the finding of prognostic markers and therapeutic targets of PTC.
Previous studies have made an important contribution to revealing the pathogenesis of PTC [5–7]. For instance, Dong et al. [5] found that estrogen could induce the metastatic potential of PTC cells through estrogen receptor α and β. Yin et al. [6] found that miR-195 was down-regulated in PTC. Overexpression of miR-195 could significantly inhibit the growth and metastasis of PTC cells by targeting CCND1 and FGF2. Shen et al. [7] found that lncRNA PROX1-AS1 could promote the proliferation, invasion and migration of PTC cells and might act as a potential target for PTC therapy. However, the above findings were obtained based on molecular biological methods, such as Western blot, immunohistochemistry and dual-luciferase reporter assay system. These methods were often used to explore the specific function of a certain molecule in disease, and could not observe the overall change of molecules in cells. With the development of high-throughput molecular detection technology, an increasing number of gene expression profiling data can be generated by microarray or RNA-seq. By bioinformatic analysis of these data, researchers found many novel genes associated with disease initiation and progression [8–10]. In the current study, we utilized various bioinformatics methods to mine high-throughput gene expression data of PTC and normal thyroid tissues, and identified several key genes associated with PTC, such as FN1, SDC4, NMU, LPAR5, BCL2 and CXCL12, which might act as prognostic markers and therapeutic targets for PTC.
Materials and methods
Microarray data
High-throughput gene expression data of PTC and normal thyroid tissues from two independent datasets (GSE3467 and GSE29265) were obtained from Gene Expression Omnibus (GEO, https://www.ncbi.nlm.nih.gov/geo/). Thereinto gene expression profiling data of nine paired PTC and normal thyroid tissues were from GSE3467, which were generated by the GPL570 platform (Affymetrix Human Genome U133 Plus 2.0 Array) and contributed by He et al. [11]. Other data including 20 paired PTC and noncancerous tissues were from GSE29265, which were generated by the GPL570 platform (Affymetrix Human Genome U133 Plus 2.0 Array) and contributed by Tomas et al. (https:www.ncbi.nlm.nih.gov/geo/query/acc.cgi?acc=GSE29265).
Identification of differentially expressed genes
GEO2R tool (https://www.ncbi.nlm.nih.gov/geo/geo2r/) was used to identify differentially expressed genes (DEGs) in PTC tissues compared with matched non-cancerous tissues. The t-test and Benjamini–Hochberg method were used to calculate the P-value and FDR, respectively. The DEGs were screened out according to adjusted P-value <0.05 and |logFC| ≥1. The common DEGs in the two datasets were screened out by VennDiagram package [12].
Kyoto encyclopedia of genes and genomes pathway enrichment analysis
KOBAS 3.0 (http://kobas.cbi.pku.edu.cn/) is an online tool for gene/protein functional annotation and gene set functional enrichment [13]. For enrichment analysis, KOBAS 3.0 can accept either gene list or gene expression data as input, and generates enriched gene sets, corresponding name, P-value or a probability of enrichment and enrichment score based on results of multiple methods. To identify key pathways implicating PTC, we conducted Kyoto Encyclopedia of Genes and Genomes (KEGG) pathway enrichment of common DEGs by using KOBAS 3.0. A corrected P-value <0.05 was considered significant.
Protein–protein interactions network and module analysis
The Search Tool for the Retrieval of Interacting Genes/Proteins (STRING) database (http://string-db.org/) consolidates known and predicted protein–protein association data for a large number of organisms, which contributes to uncovering the direct (physical) and indirect (functional) relationships of DEGs [14]. In the present study, Protein–protein interactions (PPI) network of common DEGs were constructed by the latest STRING v10.5 database based on a minimum required interaction score 0.7. PPI network with the most number of nodes were visualized by Cytoscape v3.3.0 software. Key nodes (genes) in the PPI network were screened out according to node degree >10. Furthermore, a Cytoscape App, Molecular Complex Detection (MCODE v1.4.1) with K-Core >4 was used to detect densely connected regions (modules) in the PPI network that might represent molecular complexes [15]. Database for Annotation, Visualization, and Integrated Discovery (DAVID) v.6.8 (https://david.ncifcrf.gov/tools.jsp) can annotate input genes, classify gene functions, identify gene conversions and carry out gene ontology (GO) term analysis. Thus, the DAVID was used to annotate genes in each densely connected region and perform GO term enrichment, which helped reveal the biological function of each densely connected region [16,17]. FDR value <0.05 was considered significant.
Validation of the expression level of key genes in PPI network
UALCAN (http://ualcan.path.uab.edu/) is a user-friendly, interactive web resource for analyzing transcriptome data of cancers from The Cancer Genome Atlas (TCGA) [18]. In the current study, the online tool was used to validate the expression level of key genes in PPI network.
Association of key genes expression with survival of patients with thyroid carcinoma
Gene Expression Profiling Interactive Analysis tool (GEPIA, http://gepia.cancer-pku.cn/) could deliver fast and customizable functionalities based on TCGA and GTEx data [19], including differential expression analysis, profiling plotting, correlation analysis, patient survival analysis, similar gene detection and dimensionality reduction analysis. In the current study, GEPIA was utilized to explore the association of key gene expression with disease-free survival (DFS) of patients with thyroid carcinoma. Patients were grouped into high expression group and low expression group according to the median value of gene expression. P(HR)-value <0.05 was considered statistically significant.
Analysis of the main functional regions of proteins encoded by key genes
UniProt provided a comprehensive and high-quality resource of protein sequences and their annotations, such as functional region, subcellular location, structure and so on, and can be freely accessed via the website at http://www.uniprot.org/ [20]. In the current study, UniProt was utilized to summarize the main functional regions of proteins encoded by key genes.
Results
Identification of DEGs
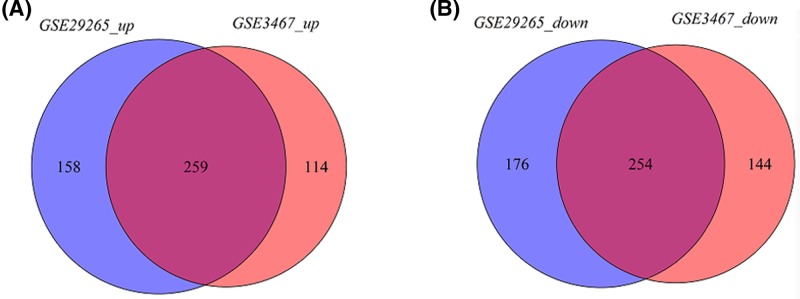
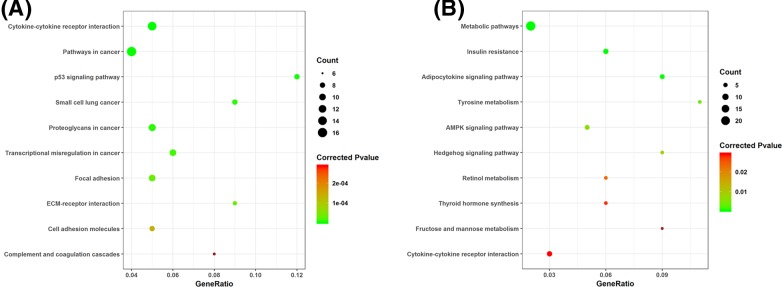
For GSE3467 dataset, a total of 771 DEGs, including 373 up-regulated and 398 down-regulated genes in PTC, were identified. For GSE29265 dataset, a total of 847 DEGs, including 417 up-regulated genes and 430 down-regulated genes in PTC, were screened out. Intersection analysis of the two datasets showed 513 common DEGs, including 259 common up-regulated and 254 common down-regulated genes in PTC (Figure 1 and Supplement). KEGG pathway enrichment analysis indicated that these common up-regulated genes were significantly enriched in 43 pathways. The top ten pathways included ‘Cytokine–cytokine receptor interaction’, ‘Pathways in cancer’, ‘p53 signaling pathway’, ‘Small cell lung cancer’, ‘Proteoglycans in cancer’, ‘Transcriptional misregulation in cancer’, ‘Focal adhesion’, ‘ECM–receptor interaction’, ‘Cell adhesion molecules’ and ‘Complement and coagulation cascades’ (Figure 2A). These common down-regulated genes were significantly enriched in 27 pathways. The top ten pathways included ‘Metabolic pathways’, ‘Insulin resistance’, ‘Adipocytokine signaling pathway’, ‘Tyrosine metabolism’, ‘AMPK signaling pathway’, ‘Hedgehog signaling pathway’, ‘Retinol metabolism’, ‘Thyroid hormone synthesis’, ‘Fructose and mannose metabolism’ and ‘Cytokine–cytokine receptor interaction’ (Figure 2B).
Figure 1. The common differentially expressed genes in the two datasets.
(A) Common up-regulated genes; (B) common down-regulated genes.
Figure 2. The top ten KEGG pathways enriched by common differentially expressed genes.
(A) common up-regulated genes; (B) common down-regulated genes.
PPI network of common DEGs
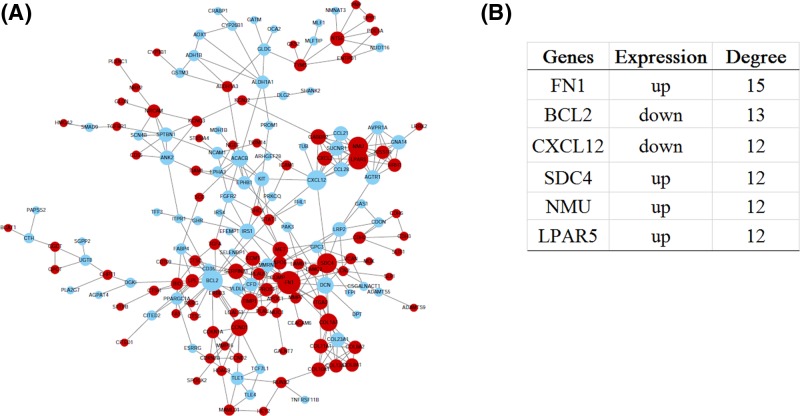
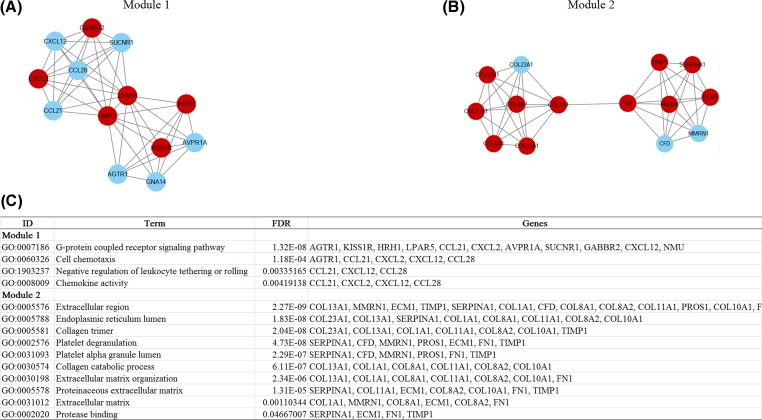
The PPI network of common DEGs, including 170 nodes (genes) and 328 edges (interactions), were constructed (Figure 3A). The degree centrality analysis showed that FN1, BCL2, CXCL12, SDC4, NMU and LPAR5 genes were key genes. Therein the expression levels of FN1, SDC4, NMU and LPAR5 genes were up-regulated in PTC. The expression levels of BCL2 and CXCL12 genes were down-regulated in PTC (Figure 3B). In addition, two significant modules were identified in PPI network (Figure 4A,B). Due to the limited number of genes in each module, we furtherly analyzed each module as a whole. Genes in Module 1 were significantly enriched in ‘G-protein coupled receptor signaling pathway’, ‘Cell chemotaxis’, ‘Negative regulation of leukocyte tethering or rolling’, ‘Chemokine activity’. Genes in Module 2 were significantly enriched in ‘Extracellular region’, ‘Endoplasmic reticulum lumen’, ‘Collagen trimer’, ‘Platelet degranulation’, ‘Platelet alpha granule lumen’, ‘Collagen catabolic process’, ‘Extracellular matrix organization’, ‘Proteinaceous extracellular matrix’, ‘Extracellular matrix’ and ‘Protease binding’ (Figure 4C).
Figure 3. Construction and analysis of PPI network of common differentially expressed genes.
PPI network plot (A): red and light blue nodes indicate up- and down- regulated genes, respectively; the node size indicates the node degree. Key nodes in PPI network (B): a node degree is defined as the number of other nodes connected to the node.
Figure 4. Identification and analysis of significant modules in PPI network.
Two significant modules in PPI network (A): module 1 network; (B): module 2 network; (C): gene ontology enrichment results of different modules. The cut-off value of ‘significant’ modules is K-Core >4).
Validation of the expression level of key genes in PPI network
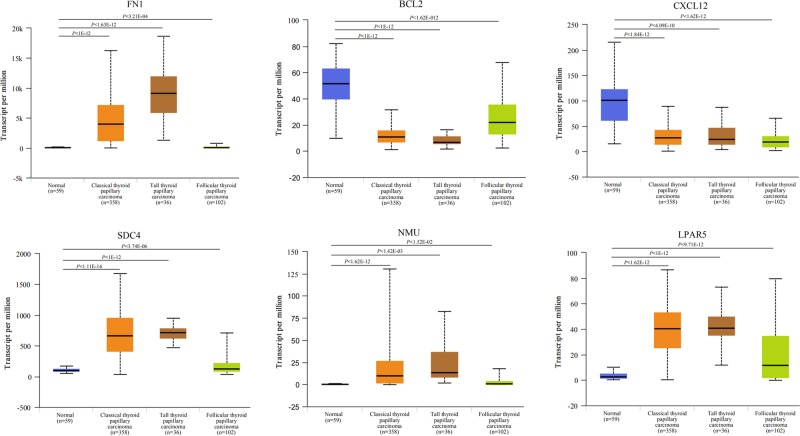
TCGA data analysis showed that FN1, SDC4, NMU and LPAR5 genes were significantly up-regulated in PTC, and BCL2 and CXCL12 genes were significantly down-regulated in PTC, which were consistent with the results of microarray analysis (Figure 5).
Figure 5. The expression level of key genes in papillary thyroid carcinoma from TCGA.
Association of key genes expression with survival of patients with thyroid carcinoma
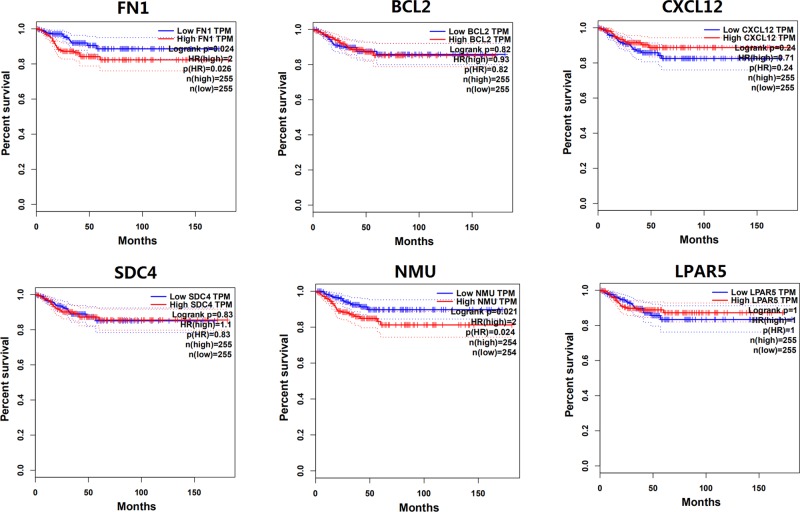
Survival analysis based on TCGA data showed that the expression levels of SDC4, BCL2, CXCL12 and LPAR5 genes were not associated with DFS of patients with thyroid carcinoma; however, the high expression of FN1 and NMU genes significantly decreased DFS of patients with thyroid carcinoma (Figure 6).
Figure 6. The association of the expression level of key genes with DFS of patients with thyroid carcinoma.
The association of the expression level of key genes with DFS of patients with thyroid carcinoma based on TCGA [P(HR) value <0.05 was considered to be associated with DFS].
Analysis of the main functional regions of proteins encoded by key genes
Information of the main functional regions of proteins encoded by FN1 and CXCL12 genes was obtained from UniProt and summarized in Table 1. The protein encoded by FN1 gene contained eight main functional regions, including 52–272 aa (fibrin- and heparin-binding 1), 308–608 aa (collagen-binding), 464–477 aa (critical for collagen binding), 1267–1540 aa (cell-attachment), 1721–1991 aa (heparin-binding 2), 1813–1991 aa (binds to FBLN1), 1992–2102 aa [connecting strand 3 (CS-3) (V region)] and 2206–2337 aa (fibrin-binding 2). The protein encoded by CXCL12 gene had five main functional regions, including 29–33 aa (receptor and heparin binding), 39–41 aa (receptor binding), 41–51 aa (heparin binding), 48–50 aa (receptor binding) and 60–70 aa (receptor binding).
Table 1. Summary of the main functional regions of proteins encoded by key genes.
| Gene name | Protein name | Uniport entry | Organism | Length | Main functional regions | |
|---|---|---|---|---|---|---|
| Regions | Description | |||||
| FN1 | Fibronectin | P02751 | Homo sapiens | 2386 | 52–272 | Fibrin- and heparin-binding 1 |
| 308–608 | Collagen-binding | |||||
| 464–477 | Critical for collagen binding | |||||
| 1267–1540 | Cell-attachment | |||||
| 1721–1991 | Heparin-binding 2 | |||||
| 1813–1991 | Binds to FBLN1 | |||||
| 1992–2102 | Connecting strand 3 (CS-3) (V region) | |||||
| 2206–2337 | Fibrin-binding 2 | |||||
| SDC4 | Syndecan-4 | P31431 | Homo sapiens | 198 | - | - |
| NMU | Neuromedin-U | P48645 | Homo sapiens | 174 | - | - |
| LPAR5 | Lysophosphatidic acid receptor 5 | Q9H1C0 | Homo sapiens | 372 | - | - |
| BCL2 | Apoptosis regulator Bcl-2 | P10415 | Homo sapiens | 239 | - | - |
| CXCL12 | Stromal cell-derived factor 1 | P48061 | Homo sapiens | 93 | 29–33 | Receptor and heparin binding |
| 39–41 | Receptor binding | |||||
| 41–51 | Heparin binding | |||||
| 48–50 | Receptor binding | |||||
| 60–70 | Receptor binding | |||||
Discussion
In the present study, we analyzed gene expression profiling data of 29 paired PTC tissues and corresponding non-cancerous tissues from two independent datasets, and found 513 common DEGs, including 259 common up-regulated and 254 common down-regulated genes in PTC. Pathway enrichment analysis indicated that these common up-regulated and down-regulated DEGs were most significantly enriched in cytokine–cytokine receptor interaction and metabolic pathways, respectively. PPI network analysis showed that FN1, SDC4, NMU, LPAR5, BCL2 and CXCL12 genes had high degree centrality, suggesting that these genes might play an important role in the occurrence or development of PTC. In order to validate the expression level of these key genes, we further analyzed related data in TCGA. Results indicated that FN1, SDC4, NMU and LPAR5 genes were significantly up-regulated in PTC, and BCL2 and CXCL12 genes were significantly down-regulated in PTC, which were consistent with the results of microarray analysis. In addition, survival analysis showed that the high expression of FN1 and NMU genes significantly decreased DFS of patients with thyroid carcinoma.
By reviewing the previous studies, we found that these crucial genes were involved in the initiation and progress of various cancers [21–28]. For instance, Sponziello et al. [21] found that FN1 expression was significantly overexpressed in PTC tissues compared with normal tissues. Silencing of FN1 significantly reduced proliferation, adhesion, migration and invasion of PTC cells. Chen et al. [22] observed that SDC4 gene silencing not only favored human PTC cell apoptosis, but also inhibited epithelial mesenchymal transition via Wnt/β-catenin pathway. Zhu et al. [23] confirmed that CXCL12 could stimulate the invasion and migration of K1 cells overexpressing CXCR4, but did not affect K1 cells overexpressing CXCR7, which suggested that CXCL12 function in cancer depended on the assistance of other molecules. In addition, results of Zhang’s study suggested that CXCL12 down-regulation in PTC might be caused by promoter hypermethylation [24]. Although the specific biological functions of BCL2 and LPAR5 genes in PTC had not been explored directly by molecular biology methods, data mining based on bioinformatics tools had also confirmed that BCL2 gene was down-regulated in PTC [25], and LPAR5 gene was up-regulated in thyroid cancer [26]. To the best of our knowledge, NMU gene had not been identified as key genes in PTC so far. However, the promotion effect of NMU gene on other cancers had been reported [27,28]. For instance, Lin et al. [27] found that NMU signaling promoted endometrial cancer cell progression by modulating adhesion signaling. Martinez et al. [28] found that overexpression of NMU resulted in up-regulation of epithelial–mesenchymal transition markers and expanded the cancer stem cell phenotype in HER2-positive breast cancer. Furthermore, the current result showed that the high expression of NMU gene significantly decreased DFS of patients with thyroid carcinoma. Thus, the specific functions of NMU in PTC were worth to be further explored.
In conclusion, our study identified several key genes (FN1, SDC4, NMU, LPAR5, BCL2 and CXCL12) and signaling pathways (cytokine–cytokine receptor interaction and metabolic pathways) associated with PTC, which might act as prognostic markers and therapeutic targets for PTC. However, further experimental studies are still required to confirm the functions of identified genes, such as BCL2, LPAR5 and NMU.
Supporting information
Supplemental Table S1.
Abbreviations
- BCL2
BCL2 apoptosis regulator
- CCND1
Cyclin D1
- CXCL12
C-X-C motif chemokine ligand 12
- DAVID
Database for annotation, visualization, and integrated discovery
- DEG
differentially expressed gene
- DFS
disease-free survival
- ECM
Extracellular matrix
- FDR
False discovery rate
- FGF2
Fibroblast growth factor 2
- FN1
Fibronectin 1
- GEO
Gene expression omnibus
- GEPIA
Gene expression profiling interactive analysis
- GO
gene ontology
- GTEx
Genotype-Tissue Expression
- HR
Hazard ratio
- KEGG
Kyoto encyclopedia of genes and genomes
- LPAR5
Lysophosphatidic acid receptor 5
- NMU
Neuromedin U
- PPI
Protein–protein interaction
- PTC
papillary thyroid carcinoma
- SDC4
Syndecan 4
- STRING
Search tool for the retrieval of interacting genes/proteins
- TCGA
The Cancer Genome Atlas
Author contribution
S.Z. designed the present study and wrote the manuscript. Q.W., Q.H., H.H. and P.L. performed the statistical analysis.
Funding
This work was supported by the Project of Shanghai Science and Technology Commission Foundation [grant number 16411950407].
Competing interests
The authors declare that there are no competing interests associated with the manuscript.
References
- 1.Cooper D.S., Doherty G.M., Haugen B.R., Kloos R.T., Lee S.L. and American Thyroid Association (ATA) Guidelines Taskforce on Thyroid Nodules and Differentiated Thyroid Cancer (2009) Revised American Thyroid Association management guidelines for patients with thyroid nodules and differentiated thyroid cancer. Thyroid 19, 1167–1214 10.1089/thy.2009.0110 [DOI] [PubMed] [Google Scholar]
- 2.Pelizzo M.R., Boschin I.M., Toniato A., Piotto A., Pagetta C., Gross M.D.. et al. (2007) Papillary thyroid carcinoma: 35-year outcome and prognostic factors in 1858 patients. Clin. Nucl. Med. 32, 440–444 10.1097/RLU.0b013e31805375ca [DOI] [PubMed] [Google Scholar]
- 3.Davies L. and Welch H.G. (2006) Increasing incidence of thyroid cancer in the United States, 1973-2002. JAMA 295, 2164–2167 10.1001/jama.295.18.2164 [DOI] [PubMed] [Google Scholar]
- 4.Leenhardt L., Grosclaude P., Chérié-Challine L. and Thyroid Cancer Committee (2004) Increased incidence of thyroid carcinoma in france: a true epidemic or thyroid nodule management effects? Report from the French Thyroid Cancer Committee Thyroid 14, 1056–1060 10.1089/thy.2004.14.1056 [DOI] [PubMed] [Google Scholar]
- 5.Dong W., Zhang H., Li J., Guan H., He L., Wang Z.. et al. (2013) Estrogen induces metastatic potential of papillary thyroid cancer cells through estrogen receptor α and β. Int. J. Endocrinol. 2013, 941568 10.1155/2013/941568 [DOI] [PMC free article] [PubMed] [Google Scholar]
- 6.Yin Y., Hong S., Yu S., Huang Y., Chen S., Liu Y.. et al. (2017) MiR-195 inhibits tumor growth and metastasis in papillary thyroid carcinoma cell lines by targeting CCND1 and FGF2. Int. J. Endocrinol. 2017, 6180425 10.1155/2017/6180425 [DOI] [PMC free article] [PubMed] [Google Scholar]
- 7.Shen Y., Xia E., Bhandari A., Wang X. and Guo G. (2018) LncRNA PROX1-AS1 promotes proliferation, invasion, and migration in papillary thyroid carcinoma. Biosci. Rep. 38, pii: BSR20180862 10.1042/BSR20180862 [DOI] [PMC free article] [PubMed] [Google Scholar]
- 8.Zhao P., Hu W., Wang H., Yu S., Li C., Bai J.. et al. (2015) Identification of differentially expressed genes in pituitary adenomas by integrating analysis of microarray data. Int. J. Endocrinol. 2015, 164087 10.1155/2015/164087 [DOI] [PMC free article] [PubMed] [Google Scholar]
- 9.Gao X., Wang X. and Zhang S. (2018) Bioinformatics identification of crucial genes and pathways associated with hepatocellular carcinoma. Biosci. Rep. 38, pii: BSR20181441 10.1042/BSR20181441 [DOI] [PMC free article] [PubMed] [Google Scholar]
- 10.Sun C., Cheng X., Wang C., Wang X., Xia B. and Zhang Y. (2018) Gene expression profiles analysis identifies a novel two-gene signature to predict overall survival in diffuse large B cell lymphoma. Biosci. Rep. 39, pii: BSR20181293 10.1042/BSR2018129 [DOI] [PMC free article] [PubMed] [Google Scholar]
- 11.He H., Jazdzewski K., Li W., Liyanarachchi S, Nagy R, Volinia S.. et al. (2005) The role of microRNA genes in papillary thyroid carcinoma. Proc. Natl. Acad. Sci. U.S.A. 102, 19075–19080 10.1073/pnas.0509603102 [DOI] [PMC free article] [PubMed] [Google Scholar]
- 12.Chen H. and Boutros P.C. (2011) Venn diagram: a package for the generation of highly-customizable Venn and Euler diagrams in R. BMC Bioinformatics 12, 35 10.1186/1471-2105-12-35 [DOI] [PMC free article] [PubMed] [Google Scholar]
- 13.Wu J., Mao X., Cai T., Luo J. and Wei L. (2006) KOBAS server: a web-based platform for automated annotation and pathway identification. Nucleic Acids Res. 34, W720–W724 10.1093/nar/gkl167 [DOI] [PMC free article] [PubMed] [Google Scholar]
- 14.Szklarczyk D., Morris J.H., Cook H., Kuhn M., Wyder S., Simonovic M.. et al. (2017) The STRING database in 2017: quality-controlled protein-protein association networks, made broadly accessible. Nucleic Acids Res. 45, D362–D368 10.1093/nar/gkw937 [DOI] [PMC free article] [PubMed] [Google Scholar]
- 15.Bader G.D. and Hogue C.W. (2003) An automated method for finding molecular complexes in large protein interaction networks. BMC Bioinformatics 4, 2 10.1186/1471-2105-4-2 [DOI] [PMC free article] [PubMed] [Google Scholar]
- 16.Huang D.W., Sherman B.T. and Lempicki R.A. (2009) Systematic and integrative analysis of large gene lists using DAVID Bioinformatics Resources. Nat. Protoc. 4, 44–57 10.1038/nprot.2008.211 [DOI] [PubMed] [Google Scholar]
- 17.Huang D.W., Sherman B.T. and Lempicki R.A. (2009) Bioinformatics enrichment tools: paths toward the comprehensive functional analysis of large gene lists. Nucleic Acids Res. 37, 1–13 10.1093/nar/gkn923 [DOI] [PMC free article] [PubMed] [Google Scholar]
- 18.Chandrashekar D.S., Bashel B., Balasubramanya S.A.H., Creighton C.J., Rodriguez I.P., Chakravarthi B.V.S.K.. et al. (2017) UALCAN: a portal for facilitating tumor subgroup gene expression and survival analyses. Neoplasia 19, 649–658 10.1016/j.neo.2017.05.002 [DOI] [PMC free article] [PubMed] [Google Scholar]
- 19.Tang Z., Li C., Kang B., Gao G., Li C. and Zhang Z. (2017) GEPIA: a web server for cancer and normal gene expression profiling and interactive analyses. Nucleic Acids Res. 45, W98–W102 10.1093/nar/gkx247 [DOI] [PMC free article] [PubMed] [Google Scholar]
- 20.The UniProt Consortium (2017) UniProt: the universal protein knowledgebase. Nucleic Acids Res. 45, D158–D169 10.1093/nar/gkw1099 [DOI] [PMC free article] [PubMed] [Google Scholar]
- 21.Sponziello M., Rosignolo F., Celano M., Maggisano V., Pecce V., De Rose R.F.. et al. (2016) Fibronectin-1 expression is increased in aggressive thyroid cancer and favors the migration and invasion of cancer cells. Mol. Cell. Endocrinol. 431, 123–132 10.1016/j.mce.2016.05.007 [DOI] [PubMed] [Google Scholar]
- 22.Chen L.L., Gao G.X., Shen F.X., Chen X., Gong X.H. and Wu W.J. (2018) SDC4 Gene silencing favors human papillary thyroid carcinoma cell apoptosis and inhibits epithelial mesenchymal transition via Wnt/β-catenin pathway. Mol. Cells 41, 853–867 [DOI] [PMC free article] [PubMed] [Google Scholar]
- 23.Zhu X., Bai Q., Lu Y., Lu Y., Zhu L., Zhou X.. et al. (2016) Expression and function of CXCL12/CXCR4/CXCR7 in thyroid cancer. Int. J. Oncol. 48, 2321–2329 10.3892/ijo.2016.3485 [DOI] [PMC free article] [PubMed] [Google Scholar]
- 24.Zhang S., Wang Y., Chen M., Sun L., Han J. and Elena V.K. (2017) CXCL12 methylation-mediated epigenetic regulation of gene expression in papillary thyroid carcinoma. Sci. Rep. 7, 44033 10.1038/srep44033 [DOI] [PMC free article] [PubMed] [Google Scholar]
- 25.Liang W. and Sun F. (2018) Identification of key genes of papillary thyroid cancer using integrated bioinformatics analysis. J. Endocrinol. Invest. 41, 1237–1245 10.1007/s40618-018-0859-3 [DOI] [PubMed] [Google Scholar]
- 26.Tang J., Kong D., Cui Q., Wang K., Zhang D., Yuan Q.. et al. (2018) Bioinformatic analysis and identification of potential prognostic microRNAs and mRNAs in thyroid cancer. Peer J. 6, e4674 10.7717/peerj.4674 [DOI] [PMC free article] [PubMed] [Google Scholar]
- 27.Lin T.Y., Wu F.J., Chang C.L., Li Z. and Luo C.W. (2016) NMU signaling promotes endometrial cancer cell progression by modulating adhesion signaling. Oncotarget 7, 10228–10242 [DOI] [PMC free article] [PubMed] [Google Scholar]
- 28.Martinez V.G., Crown J., Porter R.K. and O’Driscoll L. (2017) Neuromedin U alters bioenergetics and expands the cancer stem cell phenotype in HER2-positive breast cancer. Int. J. Cancer 140, 2771–2784 10.1002/ijc.30705 [DOI] [PubMed] [Google Scholar]


