

Abstract
Objective
Amyloid positivity is a biomarker of AD pathology, yet the associations between amyloid positivity and brain volumetric changes, especially in the hippocampus, are inconsistent. We hypothesize that sex differences in associations may contribute to inconsistent findings among cognitively normal older adults.
Methods
Using linear mixed effects models, we examined the association of amyloid positivity with prospective volumetric changes (mean = 3.3 visits) of parahippocampal gyrus (phg), hippocampus, entorhinal cortex (erc), precuneus, and fusiform gyrus among 171 Baltimore Longitudinal Study of Aging participants aged ≥55 years. Amyloid positivity was defined by a mean 11C-Pittsburgh Compound B (PiB) distribution volume ratio (DVR) cut-off of 1.062. All analyses included age, race, sex, education, APOE e4 carrier status, and two-way interactions of these covariates with time. Two-way interaction between sex and PiB+/− status and three-way interaction of sex and PiB+/− status with time were added to assess whether sex modified associations.
Results
PiB+ status was associated with greater volumetric declines in the phg (β = −0.036, SE = 0.011, p = 0.001) and erc (β = −0.019, SE = 0.009, p = 0.045). Sex modified the association of PiB+ status and rates of volumetric declines in fusiform (β = −0.117, SE = 0.049, p = 0.019). PiB+ males had steeper rates of volumetric declines in phg (β = −0.051, SE = 0.013, p < 0.001) and erc (β = −0.029, SE = 0.012, p = 0.014) than PiB- males, while there was no difference in rates of volumetric change between PiB+ and PiB- females.
Conclusions
Amyloidosis is a marker of entorhinal and parahippocampal volume loss. Amyloid positivity is a predictor of volume loss in brain regions affected by early AD pathology in men, but not women.
Keywords: Amyloid, Neurodegeneration, Pittsburgh compound B, PET, Sex differences
Highlights
-
•
Amyloid positivity is related to volume loss in regions of early AD pathology.
-
•
Sex modified the association of amyloid positivity and brain volumetric changes.
-
•
Amyloid-positive males were vulnerable to volume loss in regions of early AD.
-
•
Females with and without amyloid positivity had similar volume changes.
1. Introduction
Hallmark pathologies of Alzheimer's disease (AD) include amyloid-β (Aβ) plaques and neurofibrillary tangles (Alzheimer's Association, 2017). Human in vivo detection of fibrillar amyloid-β in neuritic plaques is possible using amyloid-β-specific positron emission tomography (PET) tracers (Klunk et al., 2004; Fleisher et al., 2011; Vandenberghe et al., 2010; Barthel et al., 2011). Amyloid burden on PET scans is associated with neurodegenerative biomarkers,(Hyman, 2011; Fox et al., 1999; Jack et al., 2000) and it can be an early biomarker to detect regional Aβ deposition. While Aβ deposition is considered a hallmark of AD, it must be considered alongside other biomarkers (Jack Jr. et al., 2013a).
Another biomarker of AD pathology is longitudinal structural magnetic resonance imaging (MRI)-based measures used as a proxy for brain atrophy and neurodegeneration (Jack et al., 2013a; Jack Jr et al., 2009). In a prior investigation in the Baltimore Longitudinal Study of Aging, individuals with mild cognitive impairment (MCI), a prodromal stage of AD that precedes dementia, had greater volumetric changes over time in whole brain, ventricles, temporal gray matter, orbitofrontal cortex, and hippocampus, as compared to those who remained cognitively normal (Driscoll et al., 2009). Similar findings of greater rates of longitudinal change in association with MCI have been reported in other longitudinal cohorts (Jack et al., 2000; Jack Jr et al., 2009; Jack et al., 2008; de Leon et al., 2004; Carlson et al., 2008; Crivello et al., 2014). Greater brain atrophy in MCI, compared with cognitively normal individuals, suggests greater vulnerability to neurodegeneration early in the prodromal phase of AD.
The hypothetical temporal ordering of biomarkers suggests that changes in amyloid PET occur prior to changes in brain structure, which are then followed by clinical symptoms of cognitive impairment (Jack et al., 2013a). The ability to assess amyloid positivity in vivo in cognitively normal individuals provides the opportunity to investigate structural brain changes and presumptive neurodegeneration during the preclinical phase of AD prior to symptom onset. Previous studies have assessed the association of amyloid positivity and brain regional volumetric change, especially in the hippocampus, among cognitively normal individuals. Results to date have been mixed with some findings suggesting steeper declines in hippocampal volumes among those with amyloidosis (Chételat et al., 2012; Villemagne et al., 2013; Jack et al., 2014; Petersen et al., 2016) and other studies finding no such associations (Tosun et al., 2011; Jack et al., 2013b; Mattsson et al., 2014; Gordon et al., 2016). Some studies reporting associations between amyloid positivity and hippocampal volumetric change included visits after the onset of cognitive impairment or dementia, which could contribute to inconsistent findings.
Additionally, sex differences in the association of amyloid positivity with volumetric change among older adults who remain cognitively normal are unclear. Sex differences have been observed for volumetric change with males having greater age-related brain volumetric changes (Driscoll et al., 2009; Pacheco et al., 2015; Thambisetty et al., 2010) and steeper rates of decline in mental status than females, (McCarrey et al., 2016) suggesting the possibility that associations with amyloid positivity might be greater in males. Conversely, women with AD pathology show more rapid hippocampal atrophy (Koran et al., 2017) and cognitive decline (Buckley et al., 2018) in studies of age-related memory changes, including the Alzheimer's Disease Neuroimaging Initiative (ADNI). In ADNI, female APOE e4 carriers have more AD pathology and higher risk of developing MCI, as compared to male APOE e4 carriers (Altmann et al., 2014).
Recently, there has been a push to replicate findings of sex differences from ADNI in other studies of aging (Nebel et al., 2018). In the current study, we examine the association of amyloid positivity with subsequent change in regional brain volumes that are known to be associated with AD pathology early in the disease process. We hypothesize that amyloid positivity is associated with regional volumetric declines, especially in entorhinal cortex, parahippocampal gyrus, and hippocampus. Additionally, we evaluate sex differences in the association of amyloid positivity with volumetric changes, due to sex differences being reported in brain regional volume changes (Driscoll et al., 2009) and cognitive change (McCarrey et al., 2016).
2. Methods
2.1. Characteristics of the study sample
There were 177 participants from the neuroimaging substudy of the Baltimore Longitudinal Study of Aging (BLSA) with at least one positron emission tomography (PET) scan using the radiotracer [11C]Pittsburgh Compound B (PiB) and structural MRIs occurring at the same visit as PiB-PET assessment and thereafter. Enrollment procedures are described elsewhere (Resnick et al., 2003; Bilgel et al., 2016). Briefly, exclusion criteria were the presence or history of central nervous system disease (dementia, stroke, bipolar illness, epilepsy), severe cardiac disease (myocardial infarction, coronary artery disease requiring angioplasty or coronary artery bypass surgery), severe pulmonary disease, and metastatic cancer at enrollment into the PET neuroimaging substudy. PiB-PET scanning began in 2005. We excluded six participants who had cognitive impairment at baseline. Our analytic sample consisted of 171 participants with 472 total MRI scans, and the mean follow-up time was 3.3 (Standard Deviation, [SD] = 3.2) years.
The procedures for determination of cognitive status have been detailed previously (Resnick et al., 2003). Briefly, cognitive impairment was determined by consensus diagnostic case conferences using DSM-III-R criteria for diagnosis of dementia and the National Institute on Neurological, Communication Disorders and Stroke-Alzheimer's Disease and Related Disorders Association criteria for diagnosis of AD (McKhann et al., 1984). Mild Cognitive Impairment was determined by Petersen criteria (Petersen, 2004). The local Institutional Review Board approved the research protocol for this study, and written informed consent was obtained at each visit.
2.2. Structural magnetic resonance image acquisition
Scanning was performed on a General Electric Signa 1.5-T scanner (Milwaukee, WI) or a 3-T Philips Achieva. The GE 1.5-T scans used a high-resolution volumetric spoiled gradient recalled acquisition in a steady state (SPGR) series (axial acquisition, repetition time = 35 msec, echo time = 5 msec, flip angle = 45°, field of view = 24 cm, matrix = 256 × 256, number of excitations = 1, voxel dimensions = 0.94 × 0.94 × 1.5 mm slice thickness). T1-weighted magnetization-prepared rapid gradient echo (MPRAGE) scans were acquired on a 3-T Philips Achieva (repetition time [TR] = 6.8 ms, echo time [TE] = 3.2 ms, flip angle = 8°, image matrix = 256 × 256, 170 slices, pixel size = 1 × 1 mm, slice thickness = 1.2 mm). There were 54 (30.5%) participants with scans from GE 1.5 T (n = 76) and 123 (69.5%) participants with scans from 3-T Philips Achieva (n = 435).
2.3. Harmonization of MUSE anatomical labels across 1.5-T SPGR and 3-T MPRAGE
A new automated labeling method specifically designed to achieve a consistent parcellation of brain anatomy in longitudinal MRI studies with scanner and imaging protocol differences was used to harmonize MR data in the BLSA from 1994 to 2017. This method combines the MUSE anatomical labeling approach (Doshi et al., 2016) with harmonized acquisition-specific atlases (Erus et al., 2018). The approach is described in more detail in Erus, Doshi, An, Verganelakis, Resnick, Davatzikos (Erus et al., 2018). Briefly, using 35 labeled 3-T MPRAGE brain MRIs from the OASIS data set (available for download at https://masi.vuse.vanderbilt.edu/workshop2012) as atlases, we first performed the MUSE labeling method on 3-T MPRAGE images for 32 BLSA participants with 1.5-T SPGR at an earlier time point. Among these participants, the average time interval between 1.5-T SPGR and 3-T MPRAGE images was 4.2 (SD = 0.4) years. Then, for each participant, we deformably registered their 1.5-T SPGR image to their 3-T MPRAGE image using a robust registration strategy that combines an ensemble of registrations obtained using two different algorithms and multiple smoothness parameters. From this approach, we obtained 32 pairs of 1.5-T SPGR and 3-T MPRAGE images in the same space with common anatomical labels. These sets were used as atlases in the MUSE approach to obtain labels on the entire collection of 1.5-T SPGR and 3-T MPRAGE images in the BLSA. This workflow for anatomical labeling has been extensively validated on the BLSA MRI data set (Erus et al., 2018).
2.4. Regions of interest
First, we examined global regions, i.e., total brain, gray matter (GM), white matter (WM) and ventricles, as well as lobar regions, i.e., GM and WM for frontal, temporal, parietal, and occipital lobes. Then, we examined volumes in regions previously reported to show early neurodegeneration in AD (Driscoll et al., 2009; Galton et al., 2001; Du et al., 2004; Convit et al., 2000). These regions of interest (ROIs) were hippocampus, entorhinal cortex, parahippocampal gyrus, amygdala, fusiform, and inferior, middle, and superior temporal gyri. We used the residualized, harmonized volumes of these ROIs, which is the difference between measured harmonized ROI volume and expected harmonized ROI volume given the intracranial volume (ICV) and scanner type. The expected harmonized ROI volume at a given ICV is based on a cross-sectional linear regression model. A single ICV per person was used across all longitudinal visits for stability, and ICV was estimated at age 70, using linear mixed effects models for consistency in defining ICV across the participants. Residualized volumes included a correction factor determined via linear mixed effects modeling to account for any remaining discrepancies in volumes across the two type of MRI scans (Bilgel et al., 2018). The methods for adjustment and harmonization of the volumes were reported in detail in Bilgel, An, Helphrey, Elkins, Gomez, Wong, Davatzikos, Ferrucci, Resnick (Bilgel et al., 2018).
2.5. Amyloid PET image acquisition and processing
PET scans were obtained over 70 min (33 frames) on a GE Advance scanner immediately following an intravenous bolus injection of approximately 555 MBq (15 mCi) of 11C-Pittsburgh compound B. Dynamic images were reconstructed using filtered back projection with a ramp filter, yielding a spatial resolution of approximately 4.5 mm full width at half maximum at the center of the field of view (image matrix = 128 × 128, 35 slices, pixel size = 2 × 2 mm, slice thickness = 4.25 mm). Each frame was aligned to the mean of the first two minutes to correct for motion. The average of the first 20 min of PET scans was rigidly registered onto the corresponding MRI, and the anatomical label image was transformed from MRI to PET space. Distribution volume ratio (DVR) images were computed in PET native space using a simplified reference tissue model (Zhou et al., 2007) with cerebellar gray matter as the reference region. Mean cortical β-amyloid burden was calculated as the average of the DVR values in cingulate, frontal, parietal (including precuneus), lateral temporal, and lateral occipital cortical regions, excluding the sensorimotor strip.
Individuals were categorized as PiB−/+ based on a mean cortical DVR threshold of 1.062, which was derived from a Gaussian mixture model (Supplementary Fig. 1). In the fitted Gaussian mixture model, the threshold is 1.045 standard deviations from the mean of the estimated PiB+ distribution, and 2.500 standard deviations from the mean of the estimated PiB- distribution. This means that the threshold is at the 14.8th percentile of the estimated PiB+ distribution, and at the 99.4th percentile of the estimated PiB- distribution.
2.6. Statistical analyses
Sample characteristics were assessed continuously and categorically by PiB+/− status through two-sample t-tests and chi-squared tests respectively. Linear mixed effects models were used to examine the association of PiB+/− status with volumetric changes in global and regional brain volumes. In addition to PiB+/− status, these models included mean-centered age at first MRI and PET, race (white vs. non-white), sex, APOE e4 carrier status (presence of ≥1 e4 allele vs. 0), years since first MRI and PET (time), and the following two-way interactions: sex*time, APOE e4 carrier status*time, age*time, and PiB+/− status*time. To allow for baseline and slope differences between individuals, we included random intercept and slope for time. We further examined three-way interactions among sex, PiB+/− status, and time in separate models to determine if there were sex differences in the association of PiB+/− status and MRI volume changes. We added a two-way interaction term between sex and PiB+/− status and a three-way interaction term among sex, PiB+/− status and time. We conducted post-hoc tests decomposing the three-way interaction to examine the pattern of sex differences in the association of PiB+/− status with brain volumetric change. All analyses were performed in SAS (Cary, NC). Type I error level was set to 0.05 for analyses, although with Bonferroni correction for multiple comparisons for 18 ROIs, results would be considered significant at p < 0.003. Three-way interactions were considered to be significant at p < 0.10.
2.7. Sensitivity analyses
We conducted two sets of sensitivity analyses. The first excluded APOE e4 carrier status as a covariate to determine whether APOE e4 carrier status adjustment was driving the associations found in the main analyses. The second restricted the observations to 3-T scans to determine if inferences remained the same.
3. Results
3.1. Sample characteristics
Table 1 shows the demographic characteristics of the sample. There were 55 participants who were PiB+ and 122 participants who were PiB- at study initiation. There were no differences in race, sex, and follow-up time between PiB+ and PiB- individuals. PiB+ participants were more likely to carry the APOE e4 allele and to be older than PiB- individuals (Table 1). Additionally, there were no differences in baseline volumes of entorhinal cortex, amygdala, parahippocampal gyrus, fusiform, and precuneus between PiB+ and PiB- individuals. However, on average, baseline hippocampal volume was significantly smaller in PiB+ individuals than in PiB- individuals (Table 1).
Table 1.
Sample Characteristics from the Baltimore Longitudinal Study of Aging (N = 171).
| Baseline characteristics | Mean (SD) or n (%) | PiB- (N = 121) | PiB+ (N = 50) | p-value for the difference |
|---|---|---|---|---|
| White, n (%) | 130 (76.0) | 91 (75.2) | 39 (78.0) | 0.700 |
| Female, n (%) | 86 (50.3) | 65 (53.7) | 21 (42.0) | 0.163 |
| APOE e4 carrier status, n (%) | 53 (31.1) | 29 (24.1) | 24 (48.0) | 0.002 |
| Age at first PiB, mean (SD) | 75.6 (8.2) | 74.4 (8.0) | 78.4 (7.9) | 0.003 |
| Years of education, mean (SD) | 17.2 (2.4) | 17.4 (2.5) | 16.7 (2.3) | 0.065 |
| Baseline 3-T scanner, n (%) | 119 (69.6) | 61 (70.9) | 58 (68.2) | 0.702 |
| Time from study enrollment, mean (SD) | 3.3 (3.2) | 3.3 (3.3) | 3.4 (2.9) | 0.905 |
| Baseline volumes from selected regions, in cm3, mean (SD) | ||||
| Hippocampus | 7.2 (0.7) | 7.3 (0.8) | 7.1 (0.7) | 0.126 |
| Entorhinal Cortex | 4.3 (0.6) | 4.3 (0.6) | 4.2 (0.6) | 0.503 |
| Amygdala | 2.2 (0.3) | 2.2 (0.3) | 2.1 (0.3) | 0.230 |
| Parahippocampal Gyrus | 6.8 (0.9) | 6.9 (0.9) | 6.7 (0.8) | 0.284 |
| Fusiform | 15.0 (2.1) | 15.1 (2.1) | 14.8 (1.9) | 0.368 |
| Precuneus | 20.4 (3.0) | 20.6 (3.0) | 19.7 (2.7) | 0.061 |
| Number of MRI scans, mean (SD) | 2.9 (2.0) | 2.8 (1.9) | 3.2 (2.1) | 0.242 |
| Number of MRI scans, n (%) | ||||
| 1 | 51 (29.8) | 39 (32.2) | 12 (24.0) | |
| 2 | 40 (23.4) | 29 (24.0) | 11 (22.0) | |
| 3 | 27 (15.8) | 19 (15.7) | 8 (16.0) | |
| 4 | 19 (11.1) | 12 (9.9) | 7 (14.0) | |
| 5+ | 34 (19.9) | 22 (18.2) | 12 (24.0) | |
SD – standard deviation, PiB – Pittsburgh Compound B, APOE – apolipoprotein, MRI – magnetic resonance imaging.
3.2. Association of PiB+/− status with change in brain volumes
Table 2 shows the associations of PiB+/− status with baseline brain volumes and change in brain volumes over time. After multiple comparisons correction, PiB status was not associated with baseline brain volumes, but it was associated with greater annual rates of volumetric decline in the parahippocampal gyrus (β = −0.036, SE = 0.011, p = 0.001). It was also associated with greater annual rates of volumetric decline in the entorhinal cortex (β = −0.019, SE = 0.009, p = 0.045), but it did not survive multiple comparisons correction. Fig. 1 shows the t-values from the results of the linear mixed effects models overlaid on brain MRI to highlight volumetric declines in the temporal lobe structures.
Table 2.
Association of PiB status with volumetric change over time in the Baltimore Longitudinal Study of Aging (N = 171).
| Brain regions of interest | Association of PiB status with baseline volume |
Association of PiB status with annual rate of volumetric change |
||||
|---|---|---|---|---|---|---|
| β | SE | p-value | β | SE | p-value | |
| Total Brain | −0.833 | 7.700 | 0.914 | −0.936 | 0.818 | 0.257 |
| Ventricles | −0.843 | 2.895 | 0.771 | −0.183 | 0.176 | 0.300 |
| GM | 0.691 | 4.665 | 0.882 | −0.837 | 0.663 | 0.211 |
| Frontal | −0.235 | 1.860 | 0.900 | −0.060 | 0.223 | 0.788 |
| Temporal | 0.617 | 1.130 | 0.586 | −0.128 | 0.138 | 0.355 |
| Parietal | 0.129 | 1.074 | 0.904 | −0.071 | 0.118 | 0.549 |
| Occipital | −0.011 | 0.980 | 0.991 | −0.154 | 0.122 | 0.207 |
| WM | 0.017 | 4.068 | 0.997 | −0.247 | 0.359 | 0.493 |
| Frontal | −1.040 | 1.884 | 0.582 | 0.000 | 0.147 | 0.998 |
| Temporal | 0.961 | 1.040 | 0.357 | −0.122 | 0.095 | 0.204 |
| Parietal | 0.177 | 0.948 | 0.852 | −0.037 | 0.089 | 0.679 |
| Occipital | 0.062 | 0.617 | 0.920 | −0.053 | 0.050 | 0.290 |
| Hippocampus | 0.101 | 0.107 | 0.343 | −0.003 | 0.010 | 0.797 |
| Entorhinal Cortex | 0.044 | 0.089 | 0.621 | −0.019 | 0.009 | 0.045 |
| Amygdala | 0.008 | 0.034 | 0.822 | −0.007 | 0.003 | 0.055 |
| Parahippocampal Gyrus | 0.045 | 0.106 | 0.673 | −0.036 | 0.011 | 0.001 |
| Fusiform | 0.028 | 0.251 | 0.911 | −0.025 | 0.028 | 0.380 |
| Precuneus | −0.293 | 0.405 | 0.470 | −0.053 | 0.033 | 0.116 |
GM – gray matter, WM – white matter, SE – standard error, PiB – Pittsburgh Compound B.
Note: Bolded values indicate significance at p < 0.05. Results were from linear mixed effects models, which included PiB+/− status, mean-centered age at first MRI and PET, race (white vs. non-white), sex (males vs. females), years of education, APOE e4 carrier status (presence of ≥1 e4 allele vs. 0), years since first MRI and PET (time), and the following two-way interactions: sex*time, APOE e4*time, age*time, and PiB+/− status*time. Values for brain regional volumes were adjusted for baseline intracranial volume estimated at age 70. Also, the residualized volumes were harmonized across types of images (1.5-T SPGR and 3 T MPRAGE).
Fig. 1.

Association of PiB status with volumetric declines in the overall sample in the Baltimore Longitudinal Study of Aging (N = 171).
PiB – Pittsburgh Compound B. The scale is in t-values from results of linear mixed effects models examining the association of PiB+/− status with volumetric change in structures of the temporal lobes. The darker colors indicate greater longitudinal volumetric declines that were greater than the threshold of −1.96 (the equivalent of p < 0.05). T-values were from linear mixed effects models, which included PiB+/− status, mean-centered age at first MRI and PET, years of education, race (white vs. non-white), sex (males vs. females), APOE e4 carrier status (presence of ≥1 e4 allele vs. 0), years since first MRI and PET (time), sex*time, APOE e4*time, age*time, and PiB+/− status*time. Values for brain regional volumes were adjusted for baseline intracranial volume estimated at age 70. Also, the residualized volumes were harmonized across types of images (1.5-T SPGR and 3 T MPRAGE).
Supplementary Table 1 contains all results for associations of baseline age, sex, and APOE e4 carrier status with baseline ROI volumes and annual rates of volumetric change in ROIs for the current sample. These associations were consistent with findings in a larger sample of 688 BLSA participants (Armstrong et al., 2019). Greater age was associated with lower baseline ROI volumes and volumetric declines in hippocampus and amygdala as well as higher baseline ventricular size and greater ventricular enlargement (Supplementary Table 1). Males had higher ventricular size and lower frontal GM at baseline than females, and males had greater ventricular enlargement and steeper declines in temporal GM than females. APOE e4 carriers had steeper hippocampal volumetric declines than APOE e4 non-carriers (Supplementary Table 1).
3.3. Sex differences in association of PiB+/− status with change in brain volumes
Table 3 shows sex differences in the associations of PiB+/− status with changes in brain volumes, while Supplementary Fig. 2 highlights the association of PiB+/− status with volume change in brain regions affected by early AD pathology, i.e., hippocampus, entorhinal cortex, parahippocampal gyrus, and fusiform by five-year age bands for both males and females separately. At p < 0.10, there were three three-way interactions among sex, PiB+/− status, and time: occipital GM (β = −0.409, SE = 0.218, p = 0.062), the fusiform (β = −0.117, SE = 0.049, p = 0.019), and parahippocampal gyrus (β = −0.037, SE = 0.019, p = 0.053) (Table 3). Fig. 2 illustrates significant sex x PiB status x time interactions for parahippocampal gyrus, fusiform gyrus, and occipital GM, and estimates for the slopes depicted in Fig. 2 are available in Supplementary Table 2. Significant declines in parahippocampal gyrus and fusiform gyri were observed for all four groups (Supplementary Table 2). While PiB+/− males and PiB- females had significant volumetric declines in the occipital GM, the association did not reach significance for PiB+ females. PiB+ males have the steepest volumetric declines in these regions (Supplementary Table 2).
Table 3.
Differential association of PiB status with volumetric change over time by sex in the Baltimore Longitudinal Study of Aging (N = 171).
| Brain regions of interest | Association of PiB status with volumetric change for males |
Association of PiB status with volumetric change for females |
Differential association of PiB status with volumetric change by sex |
||||||
|---|---|---|---|---|---|---|---|---|---|
| β | SE | p-value | Β | SE | p-value | β | SE | p-value | |
| Total Brain | −1.779 | 0.997 | 0.080 | 0.254 | 1.166 | 0.828 | −2.033 | 1.430 | 0.160 |
| Ventricles | −0.351 | 0.228 | 0.127 | 0.016 | 0.250 | 0.949 | −0.367 | 0.321 | 0.255 |
| GM | −1.418 | 0.819 | 0.089 | −0.054 | 0.957 | 0.955 | −1.364 | 1.175 | 0.250 |
| Frontal | −0.116 | 0.279 | 0.680 | 0.018 | 0.321 | 0.954 | −0.134 | 0.397 | 0.737 |
| Temporal | −0.275 | 0.171 | 0.113 | 0.054 | 0.197 | 0.786 | −0.328 | 0.243 | 0.181 |
| Parietal | −0.186 | 0.146 | 0.206 | 0.090 | 0.170 | 0.599 | −0.276 | 0.209 | 0.191 |
| Occipital | −0.315 | 0.149 | 0.035 | 0.094 | 0.179 | 0.601 | −0.409 | 0.218 | 0.062* |
| WM | −0.479 | 0.442 | 0.282 | 0.082 | 0.514 | 0.874 | −0.561 | 0.632 | 0.377 |
| Frontal | −0.105 | 0.179 | 0.561 | 0.151 | 0.209 | 0.473 | −0.256 | 0.257 | 0.323 |
| Temporal | −0.185 | 0.117 | 0.118 | −0.033 | 0.136 | 0.808 | −0.152 | 0.167 | 0.366 |
| Parietal | −0.083 | 0.111 | 0.456 | 0.028 | 0.128 | 0.827 | −0.111 | 0.158 | 0.483 |
| Occipital | −0.099 | 0.062 | 0.110 | 0.016 | 0.075 | 0.833 | −0.115 | 0.091 | 0.206 |
| Hippocampus | −0.010 | 0.013 | 0.443 | 0.007 | 0.014 | 0.652 | −0.016 | 0.018 | 0.367 |
| Entorhinal Cortex | −0.029 | 0.012 | 0.014 | −0.004 | 0.014 | 0.765 | −0.024 | 0.017 | 0.149 |
| Amygdala | −0.006 | 0.004 | 0.153 | −0.007 | 0.005 | 0.147 | 0.001 | 0.006 | 0.883 |
| Parahippocampal Gyrus | −0.051 | 0.013 | <0.001 | −0.013 | 0.016 | 0.411 | −0.037 | 0.019 | 0.053* |
| Fusiform | −0.077 | 0.034 | 0.029 | 0.040 | 0.039 | 0.311 | −0.117 | 0.049 | 0.019* |
| Precuneus | −0.074 | 0.041 | 0.080 | −0.022 | 0.048 | 0.651 | −0.052 | 0.059 | 0.383 |
GM – gray matter, WM – white matter, SE – standard error, PiB – Pittsburgh Compound B.
Note: Bolded values indicate significance at p < 0.05. * indicates that the three-way interaction among sex, PiB+/− status, and time was significant at p < 0.10. Results were from linear mixed effects models, which included PiB+/− status, mean-centered age at first MRI and PET, race (white vs. non-white), sex (males vs. females), years of education, APOE e4 carrier status (presence of ≥1 e4 allele vs. 0), years since first MRI and PET (time), sex*time, APOE e4*time, age*time, PiB+/− status*time, sex*PiB+/− status, and sex*PiB+/− status*time. Values for brain regional volumes were adjusted for baseline intracranial volume estimated at age 70. Also, the residualized volumes were harmonized across types of images (1.5-T SPGR and 3 T MPRAGE).
Fig. 2.
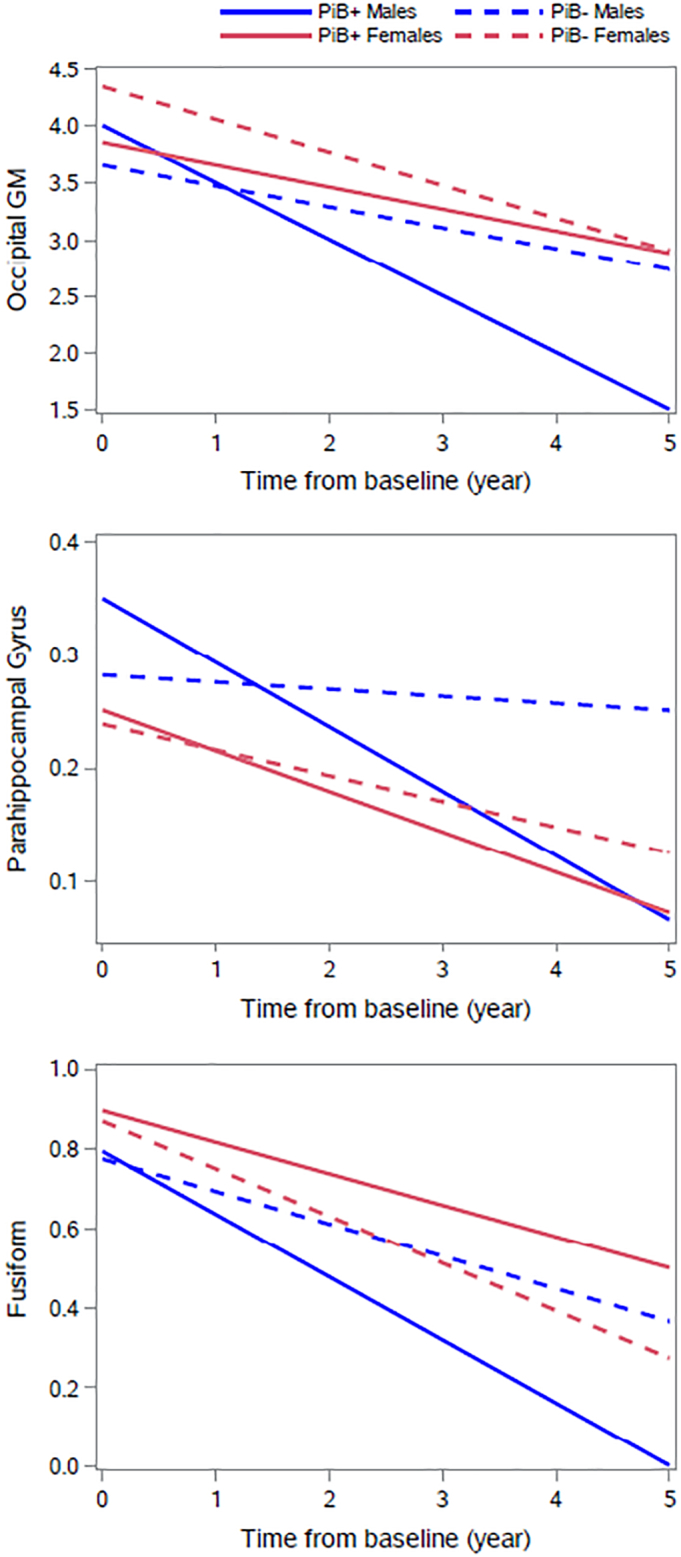
Associations of PiB status and sex with volumetric change of selected brain regions of interest in Baltimore Longitudinal Study of Aging.
Note: The values presented on the y-axis were adjusted for baseline intracranial volume estimated at age 70. Also, the residualized volumes were harmonized across types of images (1.5-T SPGR and 3 T MPRAGE). All estimates were produced using linear mixed models that were adjusted by mean-centered age at first MRI, years of education, race (white vs. non-white), sex (male vs. female), APOE e4 carrier status (presence of ≥1 e4 allele vs. 0), years since first MRI and PET (time), sex*time, APOE e4*time, age*time, PiB+/− status*time, sex*PiB+/− status, and sex*PiB+/− status*time. PiB – Pittsburgh Compound B.
We then examined post-hoc comparisons in the volumetric change in these regions between the following pairs: PiB+/− females, PiB+/− males, PiB- males vs. PiB- females, PiB+ males vs. PiB+ females, PiB+ women vs. PiB- men, and PiB+ men vs. PiB- women. We found that PiB+ males had significantly steeper volumetric declines in occipital GM (β = −0.1351, SE = 0.149, p = 0.0349), parahippocampal gyrus (β = −0.0505, SE = 0.0132, p = 0.0001), and fusiform gyrus (β = −0.0765, SE = 0.0342, p = 0.0292) than PiB- men. Additionally, we found that PiB+ males had significantly steeper volumetric declines in only the parahippocampal gyrus (β = −0.0341, SE = 0.0129, p = 0.0088), as compared to PiB- females. None of the other post-hoc comparisons were significant.
3.4. Sensitivity analysis
Supplementary Tables 3 and 4 show the results for both sets of analyses when APOE e4 carrier status was not included as a covariate in the models. When we excluded APOE e4 carrier status as a covariate in analyses examining the associations of PiB+/− status with volume change, we found stronger associations of PiB+/− status with volumetric declines in entorhinal cortex (β = −0.019, SE = 0.009, p = 0.027), amygdala (β = −0.008, SE = 0.003, p = 0.012), and parahippocampal gyrus (β = −0.036, SE = 0.010, p < 0.001) (Supplementary Table 3). Similarly, when we excluded APOE e4 carrier status as a covariate in the analyses evaluating sex differences in the association of PiB+/− status and volume change, our inferences remained unchanged (Supplementary Table 4).
Supplementary Tables 5 and 6 show the results for both sets of analyses when we restricted the analyses to volumes from 3-T scans. When we restricted the analysis to 3-T scans only, our sample size decreased from 177 to 165, and the number of available scans decreased from 477 to 427. The average follow-up time for those with only 3-T scans was 2.6 (SD = 2.5) years. We found similar directions for associations between PiB+/− status and volume loss in regions found in the main analysis. The magnitude was similar for parahippocampal gyrus and entorhinal cortex (Supplementary Table 5). When we examined sex differences in the associations between PiB+/− status and volume loss, we found significant three-way interactions of sex and PiB+/− status with time in the same regions as the main analysis – fusiform and parahippocampal gyrus (Supplementary Table 6). Additionally, our main findings for males and females were similar when restricting the observations to 3-T scans.
4. Discussion
Amyloid positivity is associated with greater prospective volumetric declines in entorhinal cortex and parahippocampal gyrus in the overall sample. In contrast, we found no significant differences in baseline regional volumes in relation to amyloid positivity. There were sex differences in the association of amyloid positivity with volumetric declines in fusiform and parahippocampal gyrus, with PiB+ males showing the steepest rates of volume loss. PiB+ males also had steeper volumetric declines in entorhinal cortex, inferior temporal gyrus, superior temporal gyrus, ventricles and gray matter, as compared to PiB- males. There were no differences in rates of volume change between PiB+ and PiB- females.
As hypothesized by the dynamic biomarker model of AD (Jack Jr. et al., 2013c), we found that cognitively normal individuals with amyloid positivity had similar baseline volumes but steeper rates of volumetric declines than amyloid negative individuals. These findings are consistent with the hypothesis that amyloid deposition precedes AD-related volumetric declines observed in people with subsequent cognitive impairment. We found that PiB+ associated areas were areas that show atrophy early in the AD neurodegenerative process, i.e., entorhinal cortex and parahippocampal gyrus (de Leon et al., 2004). We did not find any associations of amyloid positivity with prospective decline in hippocampal volume. Findings from previous studies suggest that the entorhinal cortex deteriorates before the hippocampus (Mizutani and Kasahara, 1997; Killiany et al., 2002; Pennanen et al., 2004; de Leon et al., 2001) or there is a greater functional effect in volume loss from entorhinal cortex compared to volume loss in hippocampus (Varon et al., 2011). Early volume loss in the entorhinal cortex may cause subsequent atrophy in the hippocampus, as evidenced by work in normal adult rodents. Lazarov et al. (2002) found that amyloid precursor protein (APP), a precursor to Aβ, in the entorhinal cortex was transported rapidly to the hippocampus, where it cleaved to form APP fragments, which became amyloidogenic, suggesting that entorhinal cortex contributed to AD pathology in the hippocampus via APP transport.
In addition to investigation in the overall sample, we evaluated whether there were sex differences in the associations between amyloid positivity and regional volumetric changes. In the current study, we found a three-way interaction between PiB+/− status, sex and time for selected brain regions. PiB+ males had steeper volumetric declines in fusiform and parahippocampal gyrus than other groups. In post-hoc analyses, we found that PiB+ males had, on average, steeper volumetric declines in occipital GM, parahippocampal gyrus, and fusiform gyrus than PiB- males, but we did not see differences in change in brain volumes in PiB+ and PiB- females. Although women are at higher risk of developing AD than men in part due to greater longevity, findings from previous studies suggest that there is greater age-related decline in specific cognitive domains in older men compared to women (McCarrey et al., 2016; Munro et al., 2012). In a previous BLSA study, steeper rates of decline on measures of mental status, perceptuomotor speed and integration, and visuospatial ability were found for males compared to females (McCarrey et al., 2016). We also found that males had greater rates of normal age-related brain volume decline over time than females (Driscoll et al., 2009). However, it remains possible that women show faster rates of change than men when symptomatic disease is evident (Koran et al., 2017).
Our results differ from those reported in several other investigations which recruit participants specifically into studies of “memory” or “Alzheimer's disease”. As the BLSA is a study of physical and psychological aging, rather than a memory-specific study, it is perhaps less vulnerable to biases associated with recruitment of individuals who have memory-related concerns. Further, the inclusion/exclusion criteria in participant selection into the overall BLSA (for specific criteria, please visit: https://clinicaltrials.gov/ct2/show/NCT00233272) differ from those of other studies. In comparison to some other studies, there is a lack of enrichment for APOE e4 carriers and participants are free of cardiovascular disease, severe gastrointestinal disease, kidney or liver, cognitive impairment, diabetes, and neurological diseases at enrollment into the BLSA.
There are several strengths of this study. First, we had a large sample of cognitively normal, older participants with up to 10 serial MRI assessments. Second, we were able to detect three-way interactions among sex, PiB+/− status, and time in brain regions that show evidence of early AD pathology. Additionally, there were several limitations. The BLSA is comprised of a high functioning group of community dwelling older adults with above average education, and therefore, our findings may not be generalizable to other populations. Also, we cannot make any conclusions about causality, i.e., amyloid driving volume loss, and there could be unmeasured covariates that may explain these relationships. Lastly, the results involving the volumetric decline of the parahippocampal gyrus would be the only ones that would survive multiple comparisons correction. We reported all associations at p < 0.05.
5. Conclusions
In summary, our findings indicate that amyloid positivity could be indicative of early volumetric declines in entorhinal cortex and parahippocampal gyrus. Thus, the detection of amyloid positivity may identify individuals in the earliest stages of neurodegeneration and AD pathology who might benefit from novel therapeutics. Sex differences in these associations suggest that older females could be more resilient towards volumetric decline than males, especially in the presence of emerging amyloid deposition. There could be a sex-related vulnerability with males with amyloid positivity having the greatest volumetric declines. It will be important to consider possible sex differences in timing of the onset of neurodegeneration.
Funding
This research was supported in part by the Intramural Research Program of the National Institutes of Health (NIH), National Institute on Aging and by NIH funding sources N01-AG-3-2124, R01-AG14971, and RF1-AG054409, and all funding for the study came from the Intramural Research Program of the National Institutes of Health, National Institute on Aging.
Conflicts of interest
The authors report no conflicts of interest
Acknowledgments
We would like to thank the participants and staff of the Baltimore Longitudinal Study of Aging, the neuroimaging staff of the Laboratory of Behavioral Neuroscience, and the staff of the Johns Hopkins PET Facility and National Institute on Aging MRI facility.
Footnotes
Supplementary data to this article can be found online at https://doi.org/10.1016/j.nicl.2019.101769.
Appendix A. Supplementary data
Supplementary material
References
- Altmann A., Tian L., Henderson V.W., Greicius M.D. Alzheimer's Disease Neuroimaging Initiative Investigators. Sex modifies the APOE-related risk of developing Alzheimer disease. Ann. Neurol. 2014;75(4):563–573. doi: 10.1002/ana.24135. [DOI] [PMC free article] [PubMed] [Google Scholar]
- Alzheimer's Association 2017 Alzheimer's disease facts and figures. Alzheimers Dement. 2017;13(4):325–373. [Google Scholar]
- Armstrong N.M., An Y., Beason-Held L. Predictors of neurodegeneration differ between cognitively normal and subsequently impaired older adults. Neurobiol. Aging. 2019;75:178–186. doi: 10.1016/j.neurobiolaging.2018.10.024. [DOI] [PMC free article] [PubMed] [Google Scholar]
- Barthel H., Gertz H.-J., Dresel S. Cerebral amyloid-β PET with florbetaben (18F) in patients with Alzheimer's disease and healthy controls: a multicentre phase 2 diagnostic study. Lancet Neurol. 2011;10(5):424–435. doi: 10.1016/S1474-4422(11)70077-1. [DOI] [PubMed] [Google Scholar]
- Bilgel M., An Y., Zhou Y. Individual estimates of age at detectable amyloid onset for risk factor assessment. Alzheimers Dement. 2016;12(4):373–379. doi: 10.1016/j.jalz.2015.08.166. [DOI] [PMC free article] [PubMed] [Google Scholar]
- Bilgel M., An Y., Helphrey J. Effects of amyloid pathology and neurodegeneration on cognitive change in cognitively normal adults. Brain. 2018;141(8):2475–2485. doi: 10.1093/brain/awy150. [DOI] [PMC free article] [PubMed] [Google Scholar]
- Buckley R.F., Mormino E.C., Amariglio R.E. Sex, amyloid, and APOE ε4 and risk of cognitive decline in preclinical Alzheimer's disease: findings from three well-characterized cohorts. Alzheimers Dement. 2018;14(9):1193–1203. doi: 10.1016/j.jalz.2018.04.010. [DOI] [PMC free article] [PubMed] [Google Scholar]
- Carlson N., Moore M., Dame A. Trajectories of brain loss in aging and the development of cognitive impairment. Neurology. 2008;70(11):828–833. doi: 10.1212/01.wnl.0000280577.43413.d9. [DOI] [PubMed] [Google Scholar]
- Chételat G., Villemagne V.L., Villain N. Accelerated cortical atrophy in cognitively normal elderly with high β-amyloid deposition. Neurology. 2012;78(7):477–484. doi: 10.1212/WNL.0b013e318246d67a. [DOI] [PubMed] [Google Scholar]
- Convit A., de Asis J., de Leon M.J., Tarshish C.Y., De Santi S., Rusinek H. Atrophy of the medial occipitotemporal, inferior, and middle temporal gyri in non-demented elderly predict decline to Alzheimer's disease. Neurobiol. Aging. 2000;21(1):19–26. doi: 10.1016/s0197-4580(99)00107-4. [DOI] [PubMed] [Google Scholar]
- Crivello F., Tzourio-Mazoyer N., Tzourio C., Mazoyer B. Longitudinal assessment of global and regional rate of grey matter atrophy in 1,172 healthy older adults: modulation by sex and age. PLoS One. 2014;9(12) doi: 10.1371/journal.pone.0114478. [DOI] [PMC free article] [PubMed] [Google Scholar]
- de Leon M.J., Convit A., Wolf O.T. Prediction of cognitive decline in normal elderly subjects with 2-[(18)F]fluoro-2-deoxy-d-glucose/positron-emission tomography (FDG/PET) Proc. Natl. Acad. Sci. U. S. A. 2001;98(19):10966–10971. doi: 10.1073/pnas.191044198. [DOI] [PMC free article] [PubMed] [Google Scholar]
- de Leon M., DeSanti S., Zinkowski R. MRI and CSF studies in the early diagnosis of Alzheimer's disease. J. Intern. Med. 2004;256(3):205–223. doi: 10.1111/j.1365-2796.2004.01381.x. [DOI] [PubMed] [Google Scholar]
- Doshi J., Erus G., Ou Y. MUSE: MUlti-atlas region segmentation utilizing ensembles of registration algorithms and parameters, and locally optimal atlas selection. NeuroImage. 2016;127:186–195. doi: 10.1016/j.neuroimage.2015.11.073. [DOI] [PMC free article] [PubMed] [Google Scholar]
- Driscoll I., Davatzikos C., An Y. Longitudinal pattern of regional brain volume change differentiates normal aging from MCI. Neurology. 2009;72(22):1906–1913. doi: 10.1212/WNL.0b013e3181a82634. [DOI] [PMC free article] [PubMed] [Google Scholar]
- Du A.T., Schuff N., Kramer J.H. Higher atrophy rate of entorhinal cortex than hippocampus in AD. Neurology. 2004;62(3):422–427. doi: 10.1212/01.wnl.0000106462.72282.90. [DOI] [PMC free article] [PubMed] [Google Scholar]
- Erus G., Doshi J., An Y., Verganelakis D., Resnick S.M., Davatzikos C. Longitudinally and inter-site consistent multi-atlas based parcellation of brain anatomy using harmonized atlases. NeuroImage. 2018;166:71–78. doi: 10.1016/j.neuroimage.2017.10.026. [DOI] [PMC free article] [PubMed] [Google Scholar]
- Fleisher A.S., Chen K., Liu X. Using positron emission tomography and florbetapir f 18 to image cortical amyloid in patients with mild cognitive impairment or dementia due to Alzheimer disease. Arch. Neurol. 2011;68(11):1404–1411. doi: 10.1001/archneurol.2011.150. [DOI] [PubMed] [Google Scholar]
- Fox N.C., Scahill R.I., Crum W.R., Rossor M.N. Correlation between rates of brain atrophy and cognitive decline in AD. Neurology. 1999;52(8):1687–1689. doi: 10.1212/wnl.52.8.1687. [DOI] [PubMed] [Google Scholar]
- Galton C.J., Patterson K., Graham K. Differing patterns of temporal atrophy in Alzheimer's disease and semantic dementia. Neurology. 2001;57(2):216–225. doi: 10.1212/wnl.57.2.216. [DOI] [PubMed] [Google Scholar]
- Gordon B.A., Blazey T., Su Y. Longitudinal β-amyloid deposition and hippocampal volume in preclinical Alzheimer disease and suspected non–Alzheimer disease pathophysiology. JAMA Neurol. 2016;73(10):1192–1200. doi: 10.1001/jamaneurol.2016.2642. [DOI] [PMC free article] [PubMed] [Google Scholar]
- Hyman B.T. Amyloid-dependent and amyloid-independent stages of Alzheimer disease. Arch. Neurol. 2011;68(8):1062–1064. doi: 10.1001/archneurol.2011.70. [DOI] [PubMed] [Google Scholar]
- Jack C.R., Jr., Lowe V.J., Weigand S.D. Serial PIB and MRI in normal, mild cognitive impairment and Alzheimer's disease: implications for sequence of pathological events in Alzheimer's disease. Brain. 2009;132(5):1355–1365. doi: 10.1093/brain/awp062. [DOI] [PMC free article] [PubMed] [Google Scholar]
- Jack C.R., Jr., Petersen R.C., Xu Y. Rates of hippocampal atrophy correlate with change in clinical status in aging and AD. Neurology. 2000;55(4):484–489. doi: 10.1212/wnl.55.4.484. [DOI] [PMC free article] [PubMed] [Google Scholar]
- Jack C.R., Jr., Weigand S.D., Shiung M.M. Atrophy rates accelerate in amnestic mild cognitive impairment. Neurology. 2008;70(19 Part 2):1740–1752. doi: 10.1212/01.wnl.0000281688.77598.35. [DOI] [PMC free article] [PubMed] [Google Scholar]
- Jack C.R., Jr., Knopman D.S., Jagust W.J. Tracking pathophysiological processes in Alzheimer's disease: an updated hypothetical model of dynamic biomarkers. Lancet Neurol. 2013;12(2):207–216. doi: 10.1016/S1474-4422(12)70291-0. [DOI] [PMC free article] [PubMed] [Google Scholar]
- Jack C.R., Jr., Wiste H.J., Lesnick T.G. Brain β-amyloid load approaches a plateau. Neurology. 2013;80(10):890–896. doi: 10.1212/WNL.0b013e3182840bbe. [DOI] [PMC free article] [PubMed] [Google Scholar]
- Jack C.R., Jr., Knopman D.S., Jagust W.J., Petersen R.C., Weiner M.W., Aisen P.S., Shaw L.M., Vemuri P., Wiste H.J., Weigand S.D., Lesnick T.G. Update on hypothetical model of Alzheimer’s disease biomarkers. Lancet Neurol. 2013;12(2):207. doi: 10.1016/S1474-4422(12)70291-0. [DOI] [PMC free article] [PubMed] [Google Scholar]
- Jack C.R., Jr., Wiste H.J., Knopman D.S. Rates of β-amyloid accumulation are independent of hippocampal neurodegeneration. Neurology. 2014;82(18):1605–1612. doi: 10.1212/WNL.0000000000000386. [DOI] [PMC free article] [PubMed] [Google Scholar]
- Killiany R.J., Hyman B.T., Gomez-Isla T. MRI measures of entorhinal cortex vs hippocampus in preclinical AD. Neurology. 2002;58(8):1188–1196. doi: 10.1212/wnl.58.8.1188. [DOI] [PubMed] [Google Scholar]
- Klunk W.E., Engler H., Nordberg A. Imaging brain amyloid in Alzheimer's disease with Pittsburgh compound-B. Ann. Neurol. 2004;55(3):306–319. doi: 10.1002/ana.20009. [DOI] [PubMed] [Google Scholar]
- Koran M.E.I., Wagener M., Hohman T.J. For the Alzheimer's neuroimaging initiative. Sex differences in the association between AD biomarkers and cognitive decline. Brain Imaging Behav. 2017;11(1):205–213. doi: 10.1007/s11682-016-9523-8. [DOI] [PMC free article] [PubMed] [Google Scholar]
- Lazarov O., Lee M., Peterson D.A., Sisodia S.S. Evidence that synaptically released β-amyloid accumulates as extracellular deposits in the hippocampus of transgenic mice. J. Neurosci. 2002;22(22):9785–9793. doi: 10.1523/JNEUROSCI.22-22-09785.2002. [DOI] [PMC free article] [PubMed] [Google Scholar]
- Mattsson N., Insel P.S., Donohue M. Independent information from cerebrospinal fluid amyloid-β and florbetapir imaging in Alzheimer's disease. Brain. 2014;138(3):772–783. doi: 10.1093/brain/awu367. [DOI] [PMC free article] [PubMed] [Google Scholar]
- McCarrey A.C., An Y., Kitner-Triolo M.H., Ferrucci L., Resnick S.M. Sex differences in cognitive trajectories in clinically normal older adults. Psychol. Aging. 2016;31(2):166–175. doi: 10.1037/pag0000070. [DOI] [PMC free article] [PubMed] [Google Scholar]
- McKhann G., Drachman D., Folstein M., Katzman R., Price D., Stadlan E. Clinical diagnosis of Alzheimer's disease: report of the NINCDS-ADRDA Work Group* under the auspices of Department of Health and Human Services Task Force on Alzheimer's disease. Neurology. 1984;34(7):939–944. doi: 10.1212/wnl.34.7.939. [DOI] [PubMed] [Google Scholar]
- Mizutani T., Kasahara M. Hippocampal atrophy secondary to entorhinal cortical degeneration in Alzheimer-type dementia. Neurosci. Lett. 1997;222(2):119–122. doi: 10.1016/s0304-3940(97)13365-1. [DOI] [PubMed] [Google Scholar]
- Munro C.A., Winicki J.M., Schretlen D.J. Sex differences in cognition in healthy elderly individuals. Neuropsychol. Dev. Cognition Section B Aging Neuropsychol. Cognition. 2012;19(6):759–768. doi: 10.1080/13825585.2012.690366. [DOI] [PMC free article] [PubMed] [Google Scholar]
- Nebel R.A., Aggarwal N.T., Barnes L.L. Understanding the impact of sex and gender in Alzheimer's disease: a call to action. Alzheimers Dement. 2018;14(9):1171–1183. doi: 10.1016/j.jalz.2018.04.008. [DOI] [PMC free article] [PubMed] [Google Scholar]
- Pacheco J., Goh J.O., Kraut M.A., Ferrucci L., Resnick S.M. Greater cortical thinning in normal older adults predicts later cognitive impairment. Neurobiol. Aging. 2015;36(2):903–908. doi: 10.1016/j.neurobiolaging.2014.08.031. [DOI] [PMC free article] [PubMed] [Google Scholar]
- Pennanen C., Kivipelto M., Tuomainen S. Hippocampus and entorhinal cortex in mild cognitive impairment and early AD. Neurobiol. Aging. 2004;25(3):303–310. doi: 10.1016/S0197-4580(03)00084-8. [DOI] [PubMed] [Google Scholar]
- Petersen R. Mild cognitive impairment as a diagnostic entity. J. Intern. Med. 2004;256(3):183–194. doi: 10.1111/j.1365-2796.2004.01388.x. [DOI] [PubMed] [Google Scholar]
- Petersen R.C., Wiste H.J., Weigand S.D. Association of elevated amyloid levels with cognition and biomarkers in cognitively normal people from the community. JAMA Neurol. 2016;73(1):85–92. doi: 10.1001/jamaneurol.2015.3098. [DOI] [PMC free article] [PubMed] [Google Scholar]
- Resnick S., Pham D., Kraut M., Zonderman A., Davatzikos C. Longitudinal magnetic resonance imaging studies of older adults: a shrinking brain. J. Neurosci. 2003;23(8):3295–3301. doi: 10.1523/JNEUROSCI.23-08-03295.2003. [DOI] [PMC free article] [PubMed] [Google Scholar]
- Thambisetty M., Wan J., Carass A., An Y., Prince J.L., Resnick S.M. Longitudinal changes in cortical thickness associated with normal aging. NeuroImage. 2010;52(4):1215–1223. doi: 10.1016/j.neuroimage.2010.04.258. [DOI] [PMC free article] [PubMed] [Google Scholar]
- Tosun D., Schuff N., Mathis C.A., Jagust W., Weiner M.W. Alzheimer's disease NeuroImaging initiative. Spatial patterns of brain amyloid-β burden and atrophy rate associations in mild cognitive impairment. Brain. 2011;134(4):1077–1088. doi: 10.1093/brain/awr044. [DOI] [PMC free article] [PubMed] [Google Scholar]
- Vandenberghe R., Laere K.V., Ivanoiu A. 18F-flutemetamol amyloid imaging in Alzheimer disease and mild cognitive impairment: a phase 2 trial. Ann. Neurol. 2010;68(3):319–329. doi: 10.1002/ana.22068. [DOI] [PubMed] [Google Scholar]
- Varon D., Loewenstein D.A., Potter E. Minimal atrophy of the entorhinal cortex and hippocampus: progression of cognitive impairment. Dement. Geriatr. Cogn. Disord. 2011;31(4):276–283. doi: 10.1159/000324711. [DOI] [PMC free article] [PubMed] [Google Scholar]
- Villemagne V.L., Burnham S., Bourgeat P. Amyloid β deposition, neurodegeneration, and cognitive decline in sporadic Alzheimer's disease: a prospective cohort study. Lancet Neurol. 2013;12(4):357–367. doi: 10.1016/S1474-4422(13)70044-9. [DOI] [PubMed] [Google Scholar]
- Zhou Y., Resnick S.M., Ye W. Using a reference tissue model with spatial constraint to quantify [(11)C]Pittsburgh compound B PET for early diagnosis of Alzheimer's disease. NeuroImage. 2007;36(2):298–312. doi: 10.1016/j.neuroimage.2007.03.004. [DOI] [PMC free article] [PubMed] [Google Scholar]
Associated Data
This section collects any data citations, data availability statements, or supplementary materials included in this article.
Supplementary Materials
Supplementary material