Abstract
In the mining industry, slips and falls are the second leading cause of non-fatal injuries. Footwear is the primary defence against a slip; consequently, the condition of the footwear outsole is critical to maintaining slip resistance. Currently, there is no published method that can be used to determine when the outsole no longer affords adequate slip protection. Moreover, quantifying the condition of the outsole through the measurement of outsole features can be tedious. This article introduces a new method for the quantification of boot outsole wear. Using a handheld 3D scanner, boot scans can be taken quickly and the developed models used to measure outsole features. This method also accounts for the bending of the boot due to normal wear, which may otherwise introduce erroneous measures. When compared to measurements with a traditional handheld calliper, this new method offers more flexibility in terms of data collection, accounts for other types of boot transformations, and is more efficient to use over multiple measurement periods with no statistically significant differences in measurement.
Keywords: boot tread, wear pattern, 3D scanner, metrology, mining, slips, tread wear
Introduction
Mining is a hazardous occupation that requires workers to wear personal protective equipment to reduce the risk for injury due to the work environment. The Mine Safety and Health Administration requires that workers wear suitable safety footwear to protect their feet from the dangers of the environment [30 CFR 56.15003 (1985)]. While this safety footwear may protect the toes and feet from falling objects, it may also put a miner at risk if it is improperly designed for the working surfaces or if the outsole is worn and does not provide adequate slip protection. Work boots that are well suited for a work environment still require monitoring to ensure they are in good working condition and provide adequate traction to prevent slips.
It has been established that adequate tread depth on the outsoles of footwear is necessary to prevent slips by allowing the evacuation of fluid from beneath the foot (Beschorner & Singh, 2012). As the boot outsoles wear, this tread depth diminishes, which affects fluid evacuation and could reduce slip performance. The ability of a boot to prevent slips may not be as easy to determine by the user as would other, more visible signs of wear and damage. Miners may consider their boots to be worn out for a variety of reasons, including visible cracks, worn out treads, leaks, or discomfort. While all of these reasons are important for worker comfort, slip protection is a key element for overall worker safety.
Most companies replace footwear at a predetermined time interval or based on appearance and comfort (Chiou, Bhattacharya, & Succop, 1996) with little knowledge on the actual changes in tread depth (wear) of the footwear and its influence on the likelihood of a slip, trip, or fall (STF) event. Previously, some studies have examined artificially worn shoes to better understand the influence of wear (Kim, 2012), while others have utilized shoes worn naturally for slip testing (Chiou et al., 1996). Although there have been attempts to quantify wear in industrial settings based on wear pattern, tread pattern, and hardness (Chiou et al., 1996), there is a lack of knowledge in the mining industry on how quickly the outsoles of work boots wear, what levels of wear occur, the locations of wear, and how wear patterns are influenced by routine work activities. In order to gather this information, it is important to have a method that allows the wear to be tracked over time.
Currently, no standard method exists for measuring the wear of boot outsoles. Sheets and colleagues (Sheets, Gross, Langenburg, Bush, & Bush, 2013) collected two-dimensional scans and superimposed a sub-grid over the scans to quantify the rate of texture loss on athletic shoes. The researchers then examined and reported the percentage of grid cells that indicated loss of texture. While this method allowed for the loss of texture to be interpreted, it did not calculate the exact loss of material or changes in tread depth. In contrast, Chiou et al. (1996) examined the wear patterns of shoes using physical callipers to measure the tread thickness on the medial and lateral sides of the shoes from heel to toe. Wear patterns were determined from creating a three-dimensional graph and interpolating between measurements (Chiou et al., 1996). This method allowed for material loss to be calculated, but there was a large degree of interpolation and the researchers did not collect any measurements in the middle of the shoe. Similar to Chiou et al. and Grönqvist (1995) measured the profile depth of the treads and number of months the boots were worn to define the wear condition. Additionally, some studies have used laser scanning confocal microscopes to measure surface roughness changes (Kim, 2004, 2015). While all of the previously mentioned studies utilized valid approaches to measure some form of wear, most measured wear and its relationship to slip resistivity. Consequently, the studies did not focus on the actual quantification of changes in tread depth from the entire boot outsole as a means to develop metrics for boot replacement.
Quantifying boot wear over time can be challenging due to changes in the boot shape that occur as a result of normal wear. Bending and twisting of boots over time can make repeated measurement of the tread difficult because both the outsole and the associated reference (deep sole) may be altered between measurements. The purpose of this study was to develop a standardized, repeatable, and accurate method to quantify changes in tread depth of work boots over time. The following method accounts for changes in boot outsole shape by using a 3 D laser scanner with virtual measurement tools to isolate areas of interest and select appropriate, consistent reference points. This work is part of a larger longitudinal study that evaluates boot wear in the mining industry to provide guidance on boot replacement.
Materials and methods
This study utilized two different boots for method development. Boot 1 was a steel-toed work boot (Timberland Pro Series, 72398, USA) that was artificially worn and deformed. Boot 2 was a steel-toed work boot with metatarsal guards (Matterhorn, CV12000, USA) that was worn by a mine worker for 6 months during regular work duties. Both boots were scanned initially before any wear was introduced. The objective was to track wear over time, so both boots were scanned and measured at multiple points in time. After the initial scan was collected, Boot 1 was artificially worn using a grinder to remove material on the outsole and was stored with the toe of the boot in a bent position under weights (~30 kg) for three weeks to simulate toe flexion at the ball of the foot and changes in geometry that could be created from normal use (first wear period). A second scan was collected and measurements were taken and then the process was repeated (second wear period). Boot 2 was scanned before it was given to the mine worker and then scans and measurements were taken 3 months (first wear period) and 6 months (second wear period) after the initial scan. For the purpose of this paper, the outsole is defined as the exposed part of the boot that sits below the foot. The surface tread is the outermost part of the outsole that contacts the ground. The deep sole or deep tread is the part of the outsole closest to the foot, which does not typically contact the ground (Figure 1).
Figure 1.
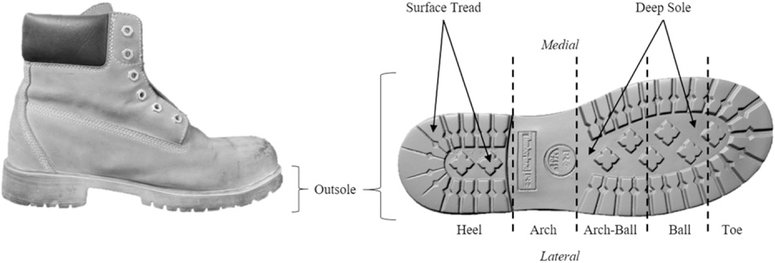
Five regions of the boot that were separated prior to realignment. The outsole is the bottom part of the boot. The surface tread is the outermost part of the outsole. The deepest part of the outsole (“deep sole”) was used in the alignment process.
The boots were prepared and cleaned before being scanned with the 3D laser scanner. Then meshes, created from the scans, were primed and metrology software was used to measure the differences between the meshes. This process was repeated for each wear period and the average loss in tread was calculated to quantify boot wear. To test the accuracy of this method, the measurements from the scans were compared to manual calliper measurements using a paired samples t-test with an alpha level of 0.05. Detailed methods are described below.
Preparation
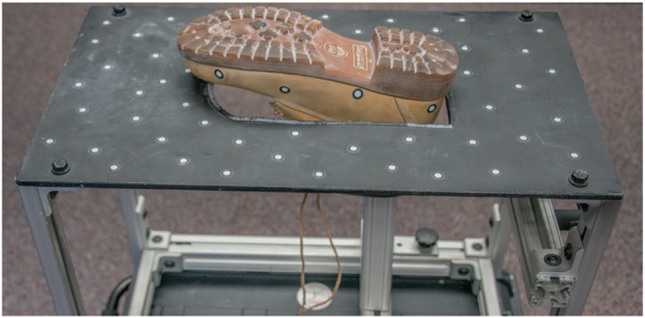
The boots were prepared for scanning by first cleaning and drying the outsoles completely to avoid influencing measurements. The outsoles were then sprayed with developer spray (Magnaflux Spotcheck SKD-S2, USA) and the excess powder was brushed away. The developer spray aids in scanning without significantly adding materials to the outsole. Boots were placed in a custom-built rig (Figure 2) with the outsole of the boot visible and the shaft secured. Black contour positioning targets were randomly placed on the flat surface of the rig and along the upper part of the boot with no targets located on the actual outsole, the area of interest. These retro-reflective targets assist in positioning and allow the 3D scanner to provide accurate measurements (Allard & Lavoie, 2014).
Figure 2.
Custom-built rig to securely hold boot during scanning.
Scanning
After the boots were prepared, scanning took place following the manufacturer’s instructions. The HandySCAN 3D 700 laser scanner was used (Creaform, Levis, QC, Canada) with the accompanying software, VXelements, VXscan (Creaform, Levis, QC, Canada) to collect the scans. The scanner was calibrated using the provided calibration plate. Scanner shutter speed configuration was completed with each boot by using the Auto Adjust feature and manually adjusting if necessary. Darker treads required higher shutter speeds. After setup and calibration, the boot was scanned until all outsole features were present in the scan, which takes ~20 min per boot. Next, the scan was trimmed so that only the tread of the boot was present. The positioning model, which is a map of all the positioning targets, was auto-optimized by the software and the scanning session and the associated mesh file were saved at a resolution of 0.2 mm.
Mesh preparation
After scanning was completed, the meshes of the initial boot and the worn boot were imported into VXelements, VXmodel (Creaform, Levis, QC, Canada). Each mesh was cleaned using built-in functions to remove data anomalies such as very small holes, spikes, and isolated patches that were not part of the outsole. Scanning results in a point cloud that when joined by triangles creates a surface, or mesh, that aids in viewing the surface contours. These point clouds can sometimes have small irregularities, which can lead to variances like intersecting triangles, or spikes, in the mesh. Cleaning the mesh allows the software to generate a smooth surface from the point cloud collected by the 3D scanner. The two meshes were prealigned by choosing corresponding point pairs on the deepest part of the tread (deep sole) of the heel of each mesh (Figure 1) where wear was not anticipated. These temporary point pairs show the program common points between the meshes to facilitate the alignment. The meshes were then aligned using the “best-fit” option in the software. After the first wear period, the meshes were still slightly misaligned, especially in the toe (Figure 5). This misalignment, primarily due to bending or twisting, made comparison of the 3D scans a challenge. To account for this bending, the meshes were separated into five regions based on a plane that was placed on the stacked part of the heel. The regions were heel, arch, arch-ball, ball, and toe (Figure 1). Each region was exported separately as a new mesh.
The initial and worn meshes for each region of the boots were transferred into PolyWorks, IMInspect software (InnovMetric Software, Québec, QC, Canada). The initial mesh of the boot, prior to the first wear period, was converted to a reference object and the worn mesh was loaded as a data object. The meshes were then realigned using the “best fit” after the selection of the pre-alignment point pairs as described earlier. To counteract the bending and twisting, the pre-alignment point pairs were again placed on the deep sole of the outsole, as described earlier.
Metrology
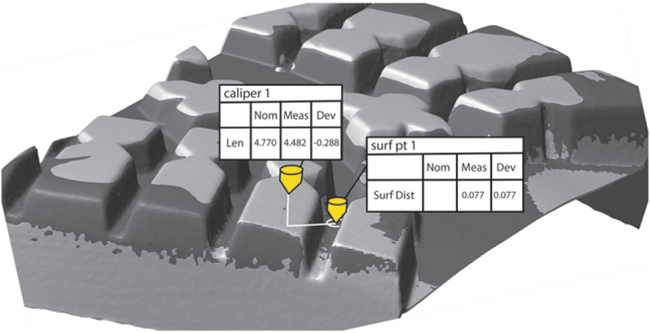
To further account for the bending and other transformations within each region, additional care was taken to ensure accurate measurements by using comparison points on the deep sole. These comparison points were used to calculate an average deviation between two meshes (initial and worn) within a disc of specified radius (InnovMetric Software, Quebec, QC, Canada). To calculate the tread wear, virtual calliper points with offset axes were used on the surface tread. The first endpoint of the calliper was placed on the surface tread and the second endpoint was placed within the diameter of a nearby comparison point on the deep sole (Figures 3 and 4). Virtual callipers were linked to the worn mesh (data object) and comparison points were linked to the initial mesh (reference object). Placement of each calliper point was determined when viewing the initial mesh.
Figure 3.
An example of a comparison point (surf pt 1) on the deep sole and virtual calliper point (calliper 1) on surface tread of the mesh of one boot. The comparison points were linked to the reference object, or the initial mesh (light gray). Callipers were linked to the data objects, or the worn mesh, which is shown in dark gray. The comparison point is shown as a white circle on the deep sole and the calliper is shown with two endpoints connected by white lines. Units: mm.
Figure 4.
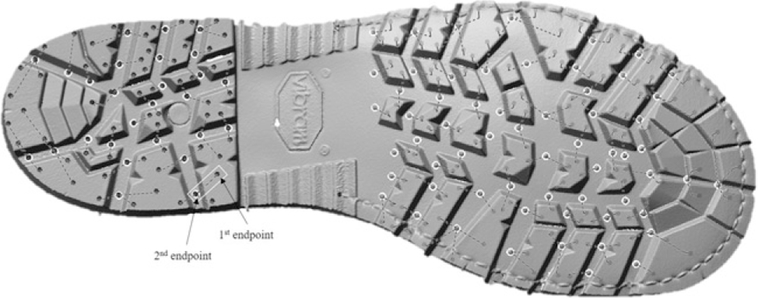
Virtual calliper and comparison point locations for Boot 2. The virtual calliper end points are shown in black with dotted lines between the two endpoints and the comparison points are in white. An example calliper is outlined by a white box. The first end point of the calliper is on the surface tread and the second is on the deep sole. The second end point of the calliper was placed within the diameter of a nearby comparison point.
Tables were exported with the measured and nominal values that were used to calculate wear. The “measured” value that was returned represented the shortest distance between the two virtual calliper end points on the worn mesh. The “nominal” value that was returned represented the shortest distance between the two calliper end points on the initial mesh. The reported “deviation” was the difference between the measured and nominal values. Once tables for these values were exported, the comparison point values were subtracted from the corresponding calliper deviation values. This subtraction accounted for the difference between the deep soles of the two meshes, which theoretically, should not show any signs of wear. By using this final calculation, the bending, twisting, and other flexible transformations were accounted for so that the final deviation values represented only the change in tread wear. For the example in Figure 3, the deviation between the two meshes for “calliper 1” was reported as −0.288 mm, but the actual wear would be −0.365mm after accounting for the misalignment captured from the comparison point (surf pt 1). An example of calliper and associated comparison point placement for Boot 2 is shown in Figure 4. The arch region of the boot was not utilized in final wear measurements because there were no prominent surface tread features.
To measure wear on the same boot for subsequent wear periods, the worn mesh from the following period was imported into the same VXmodel session as the first worn mesh and the method was repeated. The first worn mesh was deleted from the IMInspect project and then the software automatically updated the measured components and new deviation values were calculated. A total of 171 virtual calliper points and 75 comparison points were collected from Boot 1, and 178 virtual calliper points and 88 comparison points were collected from Boot 2 (Figure 4). To compare this new method to previously used methods, tread wear measurements were also collected with manual callipers (Fowler Digital Calliper, 0.02-mm accuracy) at the end of the second wear period for each boot. Where space allowed, measurements were taken in some of the same locations on the outsole as with the virtual callipers. Because of the size and shape of the callipers, it was not possible to collect all of the same measurements. Only points measured using both methods—98 and 140 for Boot 1 and Boot 2, respectively—were considered for the comparison.
Results
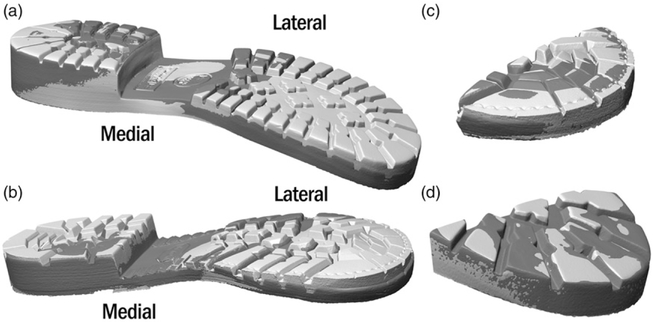
For Boot 1, the toe of the boot was bent towards the upper part of the boot while it was stored and this was evident in the scans. Similar effects were seen for Boot 2 (Figure 5). These images were rendered after the scans of the entire outsole were aligned in VXModel. After the outsoles were cut into sections and realigned, much of this misalignment was corrected (Figures 5c and d). Table 1 shows the results of the tread wear measurements on both boots using the developed method introduced in this paper and using digital callipers. Statistical analysis using a paired samples t-test revealed no statistically significant differences in the tread wear measured using digital callipers and that calculated from the scan (p > .05).
Figure 5.
Misalignments due to bending in Boot 1 (a) and Boot 2 (b) after the first wear period. The initial outsole mesh is shown in light grey and the first wear period mesh is dark grey. After the outsole was cut into sections and realigned, much of the misalignments were corrected, which is most evident in the toe of Boot 1 (c) and Boot 2 (d).
Table 1.
Average depth measurements from the heel, archball, ball, and toe regions of both Boot 1 and Boot 2 (α = 0.05).
| Boot 1 |
Boot 2 |
|||
|---|---|---|---|---|
|
n=
98 |
n=
140 |
|||
| Virtual callipers |
Manual callipers |
Virtual callipers |
Manual callipers |
|
| Mean | 3.908 | 3.912 | 4.486 | 4.463 |
| Standard deviation | 1.065 | 1.060 | 1.234 | 1.205 |
| Sample variance | 1.135 | 1.124 | 1.523 | 1.453 |
| Pearson correlation | 0.982 | 0.988 | ||
| p (T < = t) two-tail | 0.851 | 0.260 | ||
Discussion
This article introduced a method for tread wear measurement from 3D scans of the outsole of boots using metrology software. Compared to taking calliper measurements by hand, this method yielded highly similar results. This new method, using a 3D scanner and metrology software, allows for measurements to be taken at multiple wear intervals, while digitally preserving the tread features for future reference. After the initial setup, subsequent wear period measurements can be quickly assessed, as the program keeps track of the exact location of the measurements. This also eliminates human error associated with matching the location of the wear points to measure at each wear interval.
Traditional callipers, as used by Chiou et al. (1996) and Grönqvist (1995), are limited in that they can only measure along one axis, whereas metrology software allows for more flexibility with calliper placement. The first and second endpoints can be positioned separately, allowing for more data points with the new method. Essentially, this allows for the placement of measurement points where a traditional calliper would not fit. Another problem with traditional callipers is that the base of the device is two-sided, which means that the base rests on two treads and the depth is measured in the middle of the two. However, if one tread is more worn than the adjacent one, traditional callipers may not account for this difference. If the calliper base is balanced on just one tread, it must be aligned parallel to the deep sole of the boot, which can only be approximated. In addition, if there is a gouge or piece of sole missing from the middle of a tread, it is impossible to measure with traditional callipers. Both of these problems can be avoided using the approach described in this article. Furthermore, using 3D scans and saving the meshes allows the initial and subsequent samples from the various wear periods to be preserved even if the boot is not available. This is ideal for the longitudinal tracking of boots. In addition, they can be used for future analysis as needed. As scanning is not time consuming, researchers can scan the boot and return it to the user and perform measurements later, unlike with traditional callipers where measurements must be collected immediately, resulting in lengthy measurement periods.
When compared to the method of mapping wear distribution (Affatato, Valigi, & Logozzo, 2017), the metrology method for tread wear measurement allows for bends and other changes to be separated from the changes in tread depth. If the meshes were perfectly aligned, it would be possible to use the 3D deviation color map in VXelements, as Affatato et al. (2017) did with knee prostheses. However, because the boots are flexible and there are transformations other than changes in tread depth, this approach was not feasible.
There are a few key factors to consider when using this metrology method. Before scanning, it is important to make sure boots are cleaned thoroughly. Debris on the boots can interfere with the scan or placement of points. It is also important to keep the initial mesh orientation fixed within the software so that measurements are reported correctly.
Limitations and future directions
Using 3D scans of boots to measure tread wear is not without its limitations. One drawback can occur when boots are drastically misshapen between wear periods. In these cases, the locations of certain callipers may no longer be applicable. This requires that the boots be closely examined during the measurements at each wear period. In addition, this method was developed using safety shoes with steel toes and has not been tested on other types of footwear. For instance, for boots without a pronounced surface tread, this method does not work as well. We have assumed that the deep tread is invariant; however, for boots with shallow surface treads, it is possible that the deep sole can lose material, leaving nothing from which to measure. One other possible limitation is cost. The HandySCAN 3D 700 laser scanner costs over $50,000 (USD) and was selected for its portability and high resolution (0.05 mm) that could be useful for future projects. However, with recent advances in 3D scanning technology, handheld scanners with a resolution of 0.5mm are available for under $6,000 (USD) (e.g. Peel 3d Scanner, Afinia EinScan-Pro+ 3D Scanner).
Another limitation is that the use of comparison points from separate scans introduces error. The comparison points account for the differences in the deep sole of two scans. We assume that this change is due to the bending of the boot; however, it is possible that some of this change is due to misalignment of the scans within the program. That is, in some locations, the deviation may be overestimated and in others it may be underestimated. This error is unavoidable due to software limitations. However, the software makes it possible to quickly take measurements in the same locations over several wear periods, which would be more prone to error if done by hand. This method could be adjusted and applied to longitudinal tracking studies for other industries such as construction, athletics, or restaurants to see how tread wear can affect other professionals. This method could also be used to quantify wear and provide guidance on when boots should be replaced.
Conclusion
The method for tread wear measurement introduced in this article utilizes 3D scanning and metrology software to quantify changes in tread depth over time. When compared to using a handheld calliper, there was no statistically significant difference between the two methods (p>.05). The metrology method allows the user to collect 3D renderings of boot outsoles so that measurements can be performed at a later time. Using virtual callipers allows for more flexibility in the placement of the points than would be accessible with manual callipers. Similarly, using virtual callipers means that the placement of these points is preserved through multiple wear periods, eliminating the approximation introduced with manual callipers. While there are a few limitations with this method, such as the requirement of a pronounced surface tread and a small amount of error, it ultimately allows for flexibility and efficiency when taking measurements. This metrology method can be used to provide objective guidance to the mining industry on when boots should be replaced due to wear. In the future, this metrology method can be adapted to measure tread wear for other types of footwear across multiple industries.
Acknowledgements
Funding for this project was provided by the National Institute for Occupational Safety and Health. The authors would like to thank Mary Ellen Nelson for her work in creating the custom-built rig and Tim Orr, Joe Schall, and Dr. Patrick Dempsey for their constructive comments.
Footnotes
Disclosure statement
No potential conflict of interest was reported by the authors. The findings and conclusions in this report are those of the authors and do not necessarily represent the official position of the National Institute for Occupational Safety and Health, Centers for Disease Control and Prevention. Mention of any company or product does not constitute endorsement by the National Institute for Occupational Safety and Health (NIOSH), Centers for Disease Control and Prevention (CDC).
References
- Affatato S, Valigi M, & Logozzo S (2017). Wear distribution detection of knee joint prostheses by means of 3D optical scanners. Materials, 10, 364. doi: 10.3390/ma10040364 [DOI] [PMC free article] [PubMed] [Google Scholar]
- Allard PH, & Lavoie JA (2014). Differentiation of 3D scanners and their positioning method when applied to pipeline integrity. Paper presented at the NDT 2014 – 53rd Annual Conference of the British Institute of Non-Destructive Testing, The Palace Hotel, Manchester, United Kingdom. [Google Scholar]
- Beschorner K,E, & Singh G (2012). A novel method for evaluating the effectiveness of shoe-tread designs relevant to slip and fall accidents. Paper presented at the Proceedings of the Human Factors and Ergonomics Society, Westin Boston Waterfront, Boston, Massachusetts, USA. [Google Scholar]
- Code of Federal Regulations, 30 C.F.R. 56.15003, “Protective Footwear,” U.S. Department of Labor, Mine Safety and Health Administration, U.S. Government Printing Office, Office of the Federal Register, Washington, D.C. [Google Scholar]
- Chiou SY, Bhattacharya A, & Succop PA (1996). Effect of workers’ shoe wear on objective and subjective assessment of slipperiness. American Industrial Hygiene Association Journal, 57, 825–831. doi: 10.1080/15428119691014503 [DOI] [PubMed] [Google Scholar]
- Grönqvist R (1995). Mechanisms of friction and assessment of slip resistance of new and used footwear soles on contaminated floors. Ergonomics, 38, 224–241. doi: 10.1080/00140139508925100 [DOI] [PubMed] [Google Scholar]
- Kim I-J (2004). Development of a new analyzing model for quantifying pedestrian slip resistance characteristics: part II—Experiments and validations. International Journal of Industrial Ergonomics, 33, 403–414.doi: 10.1016/j.ergon.2003.10.011 [DOI] [Google Scholar]
- Kim I-J (2015). Wear observation of shoe surfaces: Application for slip and fall safety assessments. Tribology Transactions, 58, 407–417. doi: 10.1080/10402004.2014.980593 [DOI] [Google Scholar]
- Kim JS (2012). A comparison of slip resistance between the grinded outsoles and new ones of fire fighter's shoes. Procedia Engineering, 45, 868–874. doi: 10.1016/j.proeng.2012.08.251 [DOI] [Google Scholar]
- Sheets HD, Gross S, Langenburg G, Bush PJ, & Bush MA (2013). Shape measurement tools in footwear analysis: A statistical investigation of accidental characteristics over time. Forensic Science International, 232, 84–91. doi: 10.1016/j.forsciint.2013.07.010 [DOI] [PubMed] [Google Scholar]


