

Abstract
Objective
As has been shown recently, obesity is associated with brain volume deficits. We here used an interventional study design to investigate whether the brain shrinks after caloric restriction in obesity. To elucidate mechanisms of neuroprotection we assessed brain-pull competence, i.e. the brain’s ability to properly demand energy from the body.
Methods
In 52 normal-weight and 42 obese women (before and after ≈10% weight loss) organ masses of brain, liver and kidneys (magnetic resonance imaging), fat (air displacement plethysmography) and muscle mass (dual-energy X-ray absorptiometry) were assessed. Body metabolism was measured by indirect calorimetry. To investigate how energy is allocated between brain and body, we used reference data obtained in the field of comparative biology. We calculated the distance between each woman and a reference mammal of comparable size in a brain-body plot and named the distance ‘encephalic measure’. To elucidate how the brain protects its mass, we measured fasting insulin, since ‘cerebral insulin suppression’ has been shown to function as a brain-pull mechanism.
Results
Brain mass was equal in normal-weight and obese women (1,441.8 ± 14.6 vs. 1,479.2 ± 12.8 g; n.s.) and was unaffected by weight loss (1,483.8 ± 12.7 g; n.s.). In contrast, masses of muscle, fat, liver and kidneys decreased by 3–18% after weight loss (all p < 0.05). The encephalic measure was lower in obese than normal-weight women (5.8 ± 0.1 vs. 7.4 ± 0.1; p < 0.001). Weight loss increased the encephalic measure to 6.3 ± 0.1 (p < 0.001). Insulin concentrations were inversely related to the encephalic measure (r = –0.382; p < 0.001).
Conclusion
Brain mass is normal in obese women and is protected during caloric restriction. Our data suggest that neuroprotection during caloric restriction is mediated by a competent brain-pull exerting cerebral insulin suppression.
Keywords: Allometry, Brain mass, Brain-pull, Caloric restriction, Obesity
Introduction
Recently, the world has been alerted that obesity is associated with detectable brain volume deficits [1, 2].
Examples of recent newspaper headlines:
- ‘Brain damage: Being fat is bad for your brain’ by Olivia Judson, April 20, 2010, The New York Times, USA.
- ‘Link between obesity and dementia according to new research’ May 20, 2010, The Daily Telegraph, UK.
- ‘Viel Speck, wenig Hirn [More fat, less brain]’ by Jörg Blech. October 5, 2009, Spiegel online, Germany.
- ‘Obesity can inflict big toll on brain’ by David Templeton, August 27, 2009, Pittsburgh Post-Gazette, USA.
- ‘Obesity shrinks the brain’ August 29, 2009, The daily Telegraph, Australia.
- ‘More obesity blues: Research shows brains of obese people have less tissue’ by Mark Wheeler, August 25, 2009, UCLA Newsroom, USA.
- ‘Being overweight linked to severe brain degeneration’ August 27, 2009, Medical News Today, UK.
- ‘Overweight and obesity linked to lower brain volume’ by Caroline Cassels, August 28, 2009, Medscape Medical News.
Considering these results, the question aroused whether the brain of obese subjects has lost its basic property, i.e. the brain’s priority in energy metabolism. Very early autopsy data demonstrated that the human brain is preserved during inanition, while all other organs of the body such as heart, liver, kidneys and pancreas lose about 40% of their mass [3]. Using modern state-of-the-art techniques, this observation has been confirmed both in humans and animals in adult and fetal life [4–8]. It is unknown however whether the brain of obese people resists caloric restriction. If so, what are the mechanisms which enable the brain to maintain its mass during body downsizing? To answer these questions, we studied normal-weight and obese women undergoing caloric restriction. We measured their brain mass and peripheral organ masses by magnetic resonance imaging (MRI), body metabolism by indirect calorimetry as well as blood concentrations of glucose and insulin.
Two recent papers on the ‘logistics of brain energy’ showed that a competent ‘brain-pull’, i.e. the brain’s ability to properly demand energy from the body, is indispensable for maintaining systemic energy homeostasis [9, 10]. In a recent approach we used supply-chain principles and laws of logistics to further characterize the central and peripheral energy metabolism [9]. The supply chain of the brain – with the central nervous system as the final consumer – describes the energy fluxes from the remote environment to the near environment, through the body, towards the brain. The supply chain is branched, i.e. it is possible to store energy in side buffers such as muscle or fat tissue. It is a general principle in economic supply chains that the flux is determined by the supplier (push component) and by the receiver (pull component). In other words, the fluxes are regulated by offer and demand.
It has been demonstrated that in the cerebral supply chain brain-pull is necessary for protecting brain mass during food deprivation [9]. Similarly, it has been shown that under conditions of food abundance, an incompetent brain-pull will lead to build-ups in the cerebral supply chain culminating in obesity and type 2 diabetes. It could be proven that a general property is inherent in the brain’s supply chain: the fat compartment increases with decreasing brain-pull competence and vice versa [9]. An incompetence of brain-pull can be compensated by an increased body-pull, i.e. by increased ingestive behavior. But what happens when obese subjects are set on a calorie-restricted diet and cannot cover the brain’s enormous energy needs by increasing energy intake? Do their brains shrink?
To study changes in brain size in relation to simultaneous changes in body size, it turned out to be useful referring to the methodological knowledge and the data obtained in the field of comparative biology [11]. Here, we first make use of so called brain-body allometric plots and second of a comparative rule valid for the class of mammals, which states that brain metabolism and body metabolism are strictly proportional [12–14]. As body metabolism increases, brain metabolism increases in a so-called ‘isometric’ manner, i.e. it follows a ‘linear’ function. ‘Isometric’ functions number amongst a larger class of ‘allometric’ functions that are often used in comparative biology, and all follow the power function Y = kXa. Such allometric functions are also used for example to describe the relationship between body metabolism and body mass among different species, where the allometric exponents ‘a’ have been reported to be around 0.7 [15–17]. Remarkably, the relationship between brain energy metabolism (Y) and body energy metabolism (X) is particularly simple, since the exponent ‘a’ has been found to be very close to 1.0 [12–14]. According to that rule, an increase in brain mass keeps pace with a proportional increase in body metabolism.
Humans occupy a unique position in this brain-body isometry. For example, Mink et al. [14] analyzed the ratios of central nervous system metabolism to body metabolism in 42 vertebrate species. Most of vertebrates allocate 3–8% of their total body metabolism to the central nervous system [14]. In contrast, humans use about 20% of their body’s energy reserves for the brain [18]. Accordingly, we measured brain mass (which essentially is proportional to brain metabolism) as well as body metabolism in our study population and aimed at integrating normal-weight and obese subjects in the known isometric plot valid for the class of mammals. In this plot, we calculated the distance between each human subject and a reference mammal of comparable size and named the distance ‘encephalic measure’. Already in 1985, Armstrong [19] suggested that relatively large brains such as human brains must harbor mechanisms for directing more energy reserves to the brain compared to other mammals. These proposed mechanisms precisely fulfil the function of brain-pull [9, 10].
To elucidate mechanisms of brain mass protection, which could be understood as neuroprotection, we used the ‘encephalic measure’ to compare body-to-brain energy allocation in 52 healthy and 42 obese subjects, who underwent a calorie-restricted diet. We aimed at investigating whether in obese subjects the brain-pull functions as a protector of brain size.
Material and Methods
Study Design and Population
67 obese women of Caucasian origin were recruited by notice board postings and advertisements in the local newspaper to participate in a weight loss program. The program included a low-calorie diet (800–1,000 kcal/day) for a mean duration of 12.7 ± 2.2 weeks as described elsewhere in greater detail [20]. Of these 67 women, 16 dropped out because of unsuccessful weight loss (<5 kg), 6 for personal reasons and 3 because of artifacts in magnetic resonance images. Thus, the data of 42 obese women were analyzed. As a control, 52 healthy normal-weight women were recruited. Participants met the following inclusion criteria: no history of previous diseases, no chronic or acute illness, no current medication of any kind, no smoking and no alcohol or drug abuse. All women were studied at the follicular phase of the menstrual cycle. The local Ethical Committee of Christian-Albrechts-University in Kiel (Germany) approved the study. Written informed consent was obtained from each woman before participation according to the Declaration of Helsinki.
Body Composition
Body height was measured to the nearest 0.5 cm against a stadiometer (SECA, Modell 220, Hamburg, Germany). Body mass was measured to the nearest gram using the digital scale coupled to the BodPod™ –system (Body Composition System, Life Measurement Instruments, Concord, CA, USA). BMI was calculated as weight (kg) / height (m2). Subjects were classified as normal weight (BMI >20 and <25 kg/m2) and obese (BMI ≥ 30 kg/m2). Air displacement plethysmography was performed to measure fat mass using the BOD-POD device as in detail described elsewhere [21]. Fat-free mass (FFM) was calculated as the difference between body and fat mass. Dual energy X-ray absorptiometry was performed to measure bone mineral content and lean soft tissue from the arms and legs with a Hologic Discovery A densitometer and the whole-body software 12.6.1:3 (Hologic Inc, Bedford, MA, USA). Bone mass was calculated by multiplying bone mineral content by 1.85 based on reference man data [22]. Skeletal muscle mass was calculated from the sum of lean soft tissue from arms and legs by using the equation from Kim et al. [23].
Magnetic Resonance Imaging
Volumes of internal organs were assessed by MRI using a Magnetom Avanto 1.5-T scanner (Siemens Medical Systems, Erlangen, Germany) as in detail described elsewhere [20]. In brief, subjects were examined in a supine position with their arms extended above their heads. Transversal images were obtained from wrist to ankle. Only images from the head, abdominal and thoracic regions were included in the present analysis by using a contiguous axial T1 weighted gradient-echo sequence (repetition time (TR) 157 ms; time to echo (TE) 4 ms; flip angle 70 °; voxel size 3.9 × 2 × 8 mm3). The protocol for the brain comprised contiguous 4 mm slices with 1 mm inter-slice gaps (TR 313 ms, TE 14 ms). For analysis of liver and kidneys images were obtained with 8 mm slice thicknesses and 2 mm inter-slice gaps. The images were manually segmented (software: Slice-O-Matic, Tomovision 4.3 Software, Montreal, ON, Canada). Organ volumes were determined from the sum of all areas (cm2) multiplied by slice thickness. Absolute organ masses were calculated as organ volumes multiplied by density as in detail described elsewhere [20]. Each organ was analyzed by the same observer (intra-observer CVs based on comparison of repeated segmentations were 1.8% for brain, 0.1% for liver and 1.0% for kidneys).
Laboratory Methods
Plasma insulin was measured by radioimmunoassay showing no crossreactivity with C-peptide and only 14% with proinsulin (Adaltis, Rome, Italy). Plasma glucose was assayed using a hexokinase enzymatic method.
Assessment of Body Metabolism
O2 consumption and CO2 production were assessed by indirect calorimetry using a ventilated hood system for at least 30 min (Vmax model 29n, SensorMedics®; Viasys Healthcare, Bilthoven, Netherlands) as in detail described elsewhere [20; 24]. Briefly, flow calibration was performed with a 3-L syringe, and gas analyzers were calibrated before and every 5 min during the run using standard gases (gas 1 20% O2 and 0.75% CO2; gas 2 26% O2). Data were collected every 20 s and acquired oxygen volume and carbon dioxide volume were converted to REE (resting energy expenditure) by using the abbreviated equation of Weir [25]. Body metabolism (M) was defined as the O2 consumption in ml/min.
Calculation of the Encephalic Measure
Armstrong [12] collected brain masses of 93 adult mammalian species from the literature and analyzed brain masses in terms of body metabolism. Moreover, a separate analysis of the order of primates was conducted. Armstrong [12] found that the relation between brain mass (B in gram) and M (in ml O2 / 100 min) was best described by the following linear regression equations among the logarithmically transformed data [12]:
Converting units revealed the following equations for the relation between B (in gram) and M (in ml O2/min):
Taking equation 3 as a basis, predicted brain mass (Bpred.) was calculated as a function of observed body metabolism (Mobs.):
Subsequently, the distance in B-M isometric plot was calculated as follows and named ‘encephalic measure’ (E):
Based on the equation for the order of primates (equation 4), linear regression lines for our study population were calculated. Assuming the same slope, ordinate intercepts were computed taking into account mean brain mass and body metabolism of our study population.
Statistical Analysis
Data analysis was performed using SPSS statistical software (SPSS 12.0, Inc., Chicago, IL, USA). Descriptive statistics were given as mean ± SEM or median (interquartile range; IQR) in the case of non-normal distribution. Variables that did not meet the criteria of normal distribution (as assessed by Kolmogorov-Smirnov test) were body mass, BMI, fat mass, muscle mass and plasma insulin concentrations. REE was adjusted for FFM in a linear regression analysis. Between-group comparisons of normal-weight and obese subjects were analyzed by independent t-test for normally distributed and Mann Whitney U-test for non-normally distributed parameters. Within-group differences in obese women before and after weight loss were determined using a dependent t-test for normally distributed and Wilcoxon non-parametric test for non-normally distributed variables. To assess the relationship between encephalic measure and insulin concentrations, Spearman’s rank correlation coefficient was calculated. Power calculation was performed using G*Power 3 statistical software (Germany). A p value (two-sided) of 0.05 was considered significant.
Results
Body mass was higher in obese than normal-weight women. During dietary intervention, obese women lost about 10% of body mass (table 1). A loss of about 10% in body mass led to a decrease in muscle mass of about 3%, fat mass of 18%, liver mass of 4%, kidney mass of 6% and body metabolism of 8%. By contrast, brain mass was unaffected by weight loss (+0.3%). Moreover, brain mass did not differ between normal-weight and obese women. Our study provides a power of >80% in order to detect a difference of 50 g in brain mass between normal-weight and obese women, which can be regarded to be of clinical relevance. After the dietary intervention, brain mass was slightly higher in obese than in normal-weight subjects, making it unlikely that we failed to detect any relevant losses in brain mass. In contrast, weights of other organs and tissues were markedly higher in obese than normal-weight women (muscle mass, fat mass, liver mass, kidney mass and bone mass).
The logarithmic plot of brain mass versus body metabolism is shown in figure 1. As known from the literature [12], brain mass and body metabolism are related in an isometric way with a slope of 1.03 in mammals and 1.02 in primates. The isometric associations between brain mass and body metabolism are differently located in the plot; from right to left, the graphs are placed as follows: the graph for the class of mammals, the graph for the order of primates, the graph for obese women before weight loss, the graph for obese women after weight loss, and finally the graph for normal-weight women. The encephalic measure was about 23% lower in obese than in normal-weight women. However, dieting increased the encephalic measure by about 10% in obese women (table 1).
Pre-interventional plasma insulin was about 72% higher in obese than in normal-weight women. Post-interventional insulin concentrations were only about 24% higher in obese than in normal-weight women (table 1). Corresponding glucose concentrations did not differ between normal-weight and obese women before weight loss. However, after weight loss, obese women displayed a minor decrease in glucose concentrations (table 1). In the total study population, plasma insulin concentrations were found inversely correlated with the encephalic measures (fig. 2a). Caloric restriction in obese women resulted in reduced plasma insulin concentrations (p < 0.001) and increased encephalic measures (p < 0.001) (fig. 2b).
Discussion
What This Study Adds to the Current Discussion of Brain Mass and Obesity
We could show that young obese women display a normal brain mass, which is even preserved during caloric restriction. Our results confirm previous studies investigating the brain’s priority in energy metabolism [3–8]. Here, we could extend the scope of validity of that concept by showing that the brain’s priority in energy metabolism is also valid in obesity.
The discussion about the topic ‘brain mass and obesity’ has been ignited by recent news that obesity is allegedly linked to brain volume deficits [1, 2]. These findings arouse the question whether obesity causes brain loss. But there is doubt about such a causal link, because Raji et al. [1] only showed correlations between BMI and multiple brain regions in a study population of elderly people, suggesting that age and the long duration of a metabolic disease could have led to lower brain volumes. There are various other studies in the elderly which reported associations between brain volume deficits and obesity [26–28]. Interestingly, one study investigating younger subjects showed greater white but not gray matter volumes in several basal brain regions in obese when compared to lean subjects. Dieting did not affect gray matter in obese people, whereas white matter expansion was partly reversed by dieting [29]. While most of the studies concerning this topic provide correlative data only, we here applied an interventional study design. We showed in young obese women that peripheral organs and tissues (masses of fat, muscle, liver and kidneys) were heavier in obese than in normal-weight women and that there was a loss of organ weight during caloric restriction, whereas brain mass is normal and is even maintained during weight loss in obesity. Thus, our findings do not support the conclusions that have been drawn by several newspapers raising the alarm that obesity causes brain loss.
Cerebral Insulin Suppression as a Brain-Pull Mechanism
What are the mechanisms which enable the brain to maintain its mass but to downsize the body? To address the question of brain-pull mechanisms, we tested whether plasma insulin is related to the encephalic measure. Insulin fulfils two criteria to mediate the effect of brain-pull: i) insulin concentrations have been shown to be controlled by a brain-pull mechanism, referred to as ‘cerebral insulin suppression’ [10], and ii) insulin is known to allocate energy rather to the body than to brain. That means, insulin fulfils the function of a storage hormone by mediating a push component of the energy flux from blood to the energy stores: the higher the energy content in the blood (glucose), the more insulin is secreted in order to enhance glucose uptake into peripheral tissues. When there is an energy accumulation in peripheral tissues, leptin concentrations rise. Leptin stimulates neurons in the ventromedial hypothalamus [30] and in so doing limits further energy uptake in the side buffers.
The results on how the brain-pull mechanism ‘cerebral insulin suppression’ safeguards the brain’s high energy need can be summarized as follows [10]:
Upon cerebral energy need, the brain activates its stress systems. In parallel to sympatho-nervous system (SNS) stimulation, the hypothalamus-pituitary-adrenal (HPA) axis is activated with the release of CRH (corticotropin-releasing hormone) from the paraventricular nucleus, ACTH (adrenocorticotropic hormone) from the pituitary and cortisol from the adrenals. Insulin secretion from the beta cells is suppressed by SNS activation [31, 32] and cortisol release [10, 33]. Thus, the insulin-dependent glucose uptake via glucose transporter GLUT4 into body periphery becomes limited. As a consequence, glucose is now available via insulin-independent GLUT1-transport across the blood-brain barrier [34, 35]. Thus, a competent brain-pull is exerted by limiting the glucose transport into body periphery via cerebral insulin suppression and by enhancing the glucose transport into the brain.
We found that normal-weight women, obese women before and obese women after dieting displayed normal blood glucose concentrations, but that their plasma insulin concentrations were normal, high and intermediate, respectively. Our finding of an inverse relation between insulin and the encephalic measure supports the view that a competent brain-pull, which exerts cerebral insulin suppression, allows healthy subjects to display normal brains and gracile bodies (as evidenced by a high encephalic measure). In obese subjects, incompetent brain-pull (as evidenced by high insulin) is associated with normal brain mass but an expanded body mass. Moreover, our data support the notion that calorie-restricted obese subjects must burden their brain-pull mechanisms, i.e. the SNS/HPA system (as evidenced by reduction of their plasma insulin), in order to reduce body size and safeguard brain size.
Adverse Effects of Neuroprotection
What are the side effects of protecting brain mass during caloric restriction? Instead of increasing energy intake, obese subjects have to burden their brain-pull to allocate sufficient energy from body periphery towards the brain. Such a loading of the brain-pull is accompanied by the desired weight loss. The adverse aspects of burdening the brain-pull, i.e. the SNS/HPA system, when people go on a diet are not fully explored and require future research. There is, however, evidence that in people with chronic stress loading of the HPA axis is accompanied by an increase of depression symptoms [36]. Likewise, caloric restriction diets have recently been reported to cause an increase of depression symptoms [37]. There are other studies addressing the issue of depression and mood under caloric restriction. However, the study designs applied do not allow to appropriately control for biases that produce apparent beneficial effects because of psychological, motivational co-interventions [38–41]. Taken together, these findings emphasize the relevance of caution when prescribing a weight reduction program to obese individuals.
What This Study Adds to the Knowledge about Human Brain Evolution
For downsizing the body while preserving the brain it has been shown that in the cerebral supply chain the brain-pull is indispensable [9]. Body downsizing at maintained brain size is indicated by a left-shift in the brain-body allometric plot, i.e. by an increased encephalic measure. In comparative biology, insulin has never been measured across different species ranging from mouse to elephant, particularly because species differ in the structure of their insulin molecules. Here we show that in humans the inter-individual variances of insulin concentrations and the encephalic measure are sufficiently large to reveal a link between them. In our study population, a large encephalic measure was found related to decreased insulin. This observation is in line with a view proposed recently [9], which states that a brain-pull mechanism, which is capable to suppress insulin and in so doing downsizes the body, is an essential evolutionary driving force for the encephalization of the human brain.
Conclusion
In conclusion, we could show that brain mass is normal in young obese women, which may help to prevent an overhasty stigmatization of people with obesity. Our data provide evidence that the brain-pull, exerted as ‘cerebral insulin suppression’, functions to preserve brain mass when obese people diet.
Author’s Contributions
Corresponding author (AP), concept and writing of the manuscript (AP, BK, MJM), study design (ABW, MJM), MRI protocol (MH), data collection (ABW, KG, WL, BK), image segmentation (WL, BK), data analysis (AP, BK, DL, CH), discussion of data (all authors).
Disclosure Statement
The authors declared no conflict of interest.
Fig. 1.
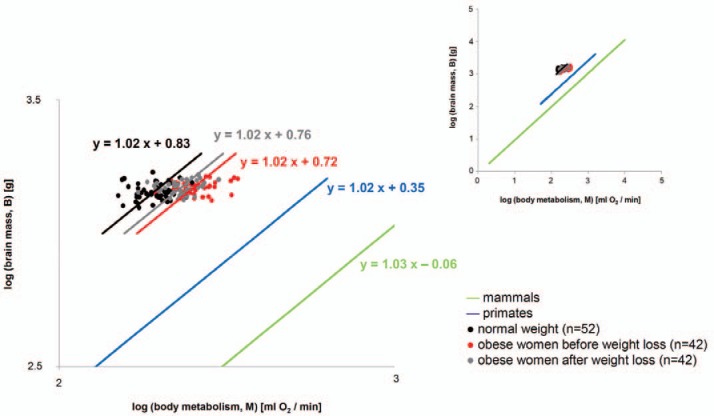
Logarithmic plot of brain mass (B) and body metabolism (M) in normal-weight women and obese women before (t0) and after weight loss (t1). The blue line represents the order of primates as a reference; the green line represents the class of mammals as a reference (according to Armstrong [12]). The inserted figure shows the broader context of mouse to elephant isometry. The length of each graph indicates the scope covered by experimental data [12].
Fig. 2.

a Scattergram showing the relationship between plasma insulin and the encephalic measure. b Effect of caloric restriction on plasma insulin and the encephalic measure. ***p < 0.001 significantly different after weight loss intervention, by dependent t-test.
Table 1.
Characteristics of normal-weight women and obese women before (t0) and after caloric restriction intervention (t1)
| Normal-weight women (n = 52) | Obese women t0 (n = 42) | Obese women t1 (n = 42) | |
|---|---|---|---|
| Age, years | 37.8 ± 2.1 | 33.1 ± 1.0 | |
| Body mass, kg | 65.1 (60.0–68.7) | 102.4(90.3–115.9)*** | 91.0 (80.2–105.2)###, +++ |
| Body height, cm | 168.1 ± 0.9 | 168.4 ± 1.2 | |
| BMI, kg/m2 | 23.3 (21.7–24.2) | 35.0 (32.7–38.8)*** | 31.2 (29.9–34.4)###,+++ |
| Brain mass, g | 1,441.8 ± 14.6 | 1,479.2 ± 12.8 | 1,483.8 ± 12.7+ |
| Muscle mass, kg | 20.4 (18.8–22.5) | 29.0 (24.3–32.5)*** | 27.8 (24.6–31.4)##,+++ |
| Fat mass, kg | 19.7 (17.4–23.5) | 49.3 (39.6–58.8)*** | 41.0 (32.0–50.1)###, +++ |
| FFM, kg | 44.7 ± 0.7 | 53.1 ± 1.1*** | 52.1 ± 1.0##, +++ |
| Liver mass, g | 1,389.2 ± 28.6 | 1,778.0 ± 52.7*** | 1,694.2 ± 46.6##, +++ |
| Kidney mass, g | 238.4 ± 6.2 | 378.3 ± 9.8*** | 349.7 ± 12.4#, +++ |
| Bone mass, kg | 4.2 ± 0.1 | 4.5 ± 0.1* | 4.5 ± 1.0##, ++ |
| Body metabolism, ml O2/ min | 194.0 ± 3.0 | 252.9 ± 5.7*** | 231.5 ± 4.0###, +++ |
| REEadjFFM, MJ/day | 5.7 ± 0.1 | 7.4 ± 0.1*** | 6.8 ± 0.1###, +++ |
| Insulin, pmol/l | 77.9 (56.3–101.7) | 124.7(85.5–198.7)*** | 93.5 (79.8–136.5)###,+ b |
| Glucose, mg/dl | 91.8 ± 1.1 | 90.8 ± 2.1 | 87.2 ± 1.8##, + |
| Encephalic measure | 7.4 ± 0.1 | 5.8 ± 0.1*** | 6.3 ± 0.1###, +++ |
p < 0.05,
p < 0.001: difference between normal weight women and obese women at t0 by independent t-test or Mann Whitney U-test;
p < 0.05,
p < 0.01;
p < 0.001: difference between normal weight women and obese women at t1 by independent t-test or Mann Whitney U-test;
p < 0.05,
p < 0.01,
p < 0.001: difference between obese women t0 vs. t1 by dependent t-test or Wilcoxon rank test
Data are means ± SEM or median (IQR).
The effect of intervention on plasma insulin remained (p < 0.001) after adjusting for changes in blood glucose concentrations.
Acknowledgements
This work was supported by grants from the German Research Foundation (DFG Mü 714/8–3 and KFO-126 ‘Selfish brain’). The German Research Foundation had no role in study design, in the collection, analysis, and interpretation of data, in the preparation of the manuscript and in the decision to submit the paper for publication.
References
- 1.Raji CA, Ho AJ, Parikshak NN, Becker JT, Lopez OL, Kuller LH, Hua X, Leow AD, Toga AW, Thompson PM. Brain structure and obesity. Hum Brain Mapp. 2010;31:353–364. doi: 10.1002/hbm.20870. [DOI] [PMC free article] [PubMed] [Google Scholar]
- 2.Debette S, Beiser A, Hoffman U, DeCarli C, O'Donnell CJ, Massaro JM, Au R, Himali JJ, Wolf PA, Fox CS, Seshadri S. Visceral fat is associated with lower brain volume in healthy middle-aged adults. Ann Neurol. 2010;68:136–144. doi: 10.1002/ana.22062. [DOI] [PMC free article] [PubMed] [Google Scholar]
- 3.3 M. Über die Atrophie der menschlichen Organe bei Inanition. [On the atrophy of human organs in inanition]. Z Angew Anat Konstitutionsl. 1921;7:87–134. [Google Scholar]
- 4.Goodman MN, Lowell B, Belur E, Ruderman NB, Sites of protein conservation and loss during starvation. influence of adiposity. Am J Physiol. 1984;246:E383–E390. doi: 10.1152/ajpendo.1984.246.5.E383. [DOI] [PubMed] [Google Scholar]
- 5.Muhlau M, Gaser C, Ilg R, Conrad B, Leibl C, Cebulla MH, Backmund H, Gerlinghoff M, Lommer P, Schnebel A, Wohlschlager AM, Zimmer C, Nunnemann S. Gray matter decrease of the anterior cingulate cortex in anorexia nervosa. Am J Psychiatry. 2007;164:1850–1857. doi: 10.1176/appi.ajp.2007.06111861. [DOI] [PubMed] [Google Scholar]
- 6.Gong QY, Roberts N, Garden AS, Whitehouse GH. Fetal and fetal brain volume estimation in the third trimester of human pregnancy using gradient echo MR imaging. Magn Reson Imaging. 1998;16:235–240. doi: 10.1016/s0730-725x(97)00281-6. [DOI] [PubMed] [Google Scholar]
- 7.Kind KL, Roberts CT, Sohlstrom AI, Katsman A, Clifton PM, Robinson JS, Owens JA. Chronic maternal feed restriction impairs growth but increases adiposity of the fetal guinea pig. Am J Physiol Regul Integr Comp Physiol. 2005;288:R119–R126. doi: 10.1152/ajpregu.00360.2004. [DOI] [PubMed] [Google Scholar]
- 8.Miller SL, Green LR, Peebles DM, Hanson MA, Blanco CE. Effects of chronic hypoxia and protein malnutrition on growth in the developing chick. Am J Obstet Gynecol. 2002;186:261–267. doi: 10.1067/mob.2002.119629. [DOI] [PubMed] [Google Scholar]
- 9.9 A, Langemann D. Build-ups in the supply chain of the brain: on the neuroenergetic cause of obesity and type 2 diabetes mellitus. Front Neuroenergetics. 2009;1 doi: 10.3389/neuro.14.002.2009. doi:10.3389/neuro.14.002.2009. [DOI] [PMC free article] [PubMed] [Google Scholar]
- 10.10 B, Hubold C, van Dyken R, Schlichting K, Lehnert H, Entringer S, Peters A. How the Selfish Brain Organizes its 'Supply and Demand'. Front Neuroenergetics. 2010;2 doi: 10.3389/fnene.2010.00007. doi:.10.3389/fnene.2010.00007. [DOI] [PMC free article] [PubMed] [Google Scholar]
- 11.11 A, Hitze B, Langemann D, Bosy-Westphal A, Müller MJ. Brain size, body size, and longevity. Int J Obes. 2010;34:1349–1352. doi: 10.1038/ijo.2010.65. [DOI] [PubMed] [Google Scholar]
- 12.Armstrong E. Relative brain size and metabolism in mammals. Science. 1983;220:1302–1304. doi: 10.1126/science.6407108. [DOI] [PubMed] [Google Scholar]
- 13.Armstrong E. Brains, bodies and metabolism. Brain Behav Evol. 1990;36:166–176. doi: 10.1159/000115305. [DOI] [PubMed] [Google Scholar]
- 14.Mink JW, Blumenschine RJ, Adams DB, Ratio of central nervous system to body metabolism in vertebrates. its constancy and functional basis. Am J Physiol. 1981;241:R203–R212. doi: 10.1152/ajpregu.1981.241.3.R203. [DOI] [PubMed] [Google Scholar]
- 15.Martin RD. Relative brain size and basal metabolic rate in terrestrial vertebrates. Nature. 1981;293:57–60. doi: 10.1038/293057a0. [DOI] [PubMed] [Google Scholar]
- 16.Glazier DS. Beyond the '3/4-power law': variation in the intra- and interspecific scaling of metabolic rate in animals. Biol Rev Camb Philos Soc. 2005;80:611–662. doi: 10.1017/S1464793105006834. [DOI] [PubMed] [Google Scholar]
- 17.Kolokotrones T, Van S, Deeds EJ, Fontana W. Curvature in metabolic scaling. Nature. 2010;464:753–756. doi: 10.1038/nature08920. [DOI] [PubMed] [Google Scholar]
- 18.18 SS, The general metabolism of the brain in vivo . Metabolism of the Nervous System. In: Richter, editor. London: Pergamon Press; 1957. pp. pp 221–237. [Google Scholar]
- 19.19 E. Allometric considerations of the adult mammalian brain, with special emphasis on primates. In: Jungers WL, Size and Scaling in Primate Biology, editor. New York: Plenum Press; 1985. pp. pp 115–146. [Google Scholar]
- 20.Bosy-Westphal A, Kossel E, Goele K, Later W, Hitze B, Settler U, Heller M, Gluer CC, Heymsfield SB, Müller MJ. Contribution of individual organ mass loss to weight loss-associated decline in resting energy expenditure. Am J Clin Nutr. 2009;90:993–1001. doi: 10.3945/ajcn.2008.27402. [DOI] [PubMed] [Google Scholar]
- 21.Bosy-Westphal A, Danielzik S, Becker C, Geisler C, Onur S, Korth O, Bührens F, Müller MJ. Need for optimal body composition data analysis using air-displacement plethysmography in children and adolescents. J Nutr. 2005;135:2257–2262. doi: 10.1093/jn/135.9.2257. [DOI] [PubMed] [Google Scholar]
- 22.22 WS, Cook MJ, Nasset ES, Karhausen LR, Howells GP, Tipton IH. Oxford, Pergamon Press; 1975. Report of the Task Group on Reference Man. [Google Scholar]
- 23.Kim J, Wang Z, Heymsfield SB, Baumgartner RN, Gallagher D. Total-body skeletal muscle mass: estimation by a new dual-energy X-ray absorptiometry method. Am J Clin Nutr. 2002;76:378–383. doi: 10.1093/ajcn/76.2.378. [DOI] [PubMed] [Google Scholar]
- 24.Bader N, Bosy-Westphal A, Dilba B, Müller MJ. Intra- and interindividual variability of resting energy expenditure in healthy male subjects - biological and methodological variability of resting energy expenditure. Br J Nutr. 2005;94:843–849. doi: 10.1079/bjn20051551. [DOI] [PubMed] [Google Scholar]
- 25.Weir JB. New methods for calculating metabolic rate with special reference to protein metabolism. J Physiol. 1949;109:1–9. doi: 10.1113/jphysiol.1949.sp004363. [DOI] [PMC free article] [PubMed] [Google Scholar]
- 26.Soreca I, Rosano C, Jennings JR, Sheu LK, Kuller LH, Matthews KA, Aizenstein HJ, Gianaros PJ. Gain in adiposity across 15 years is associated with reduced gray matter volume in healthy women. Psychosom Med. 2009;71:485–490. doi: 10.1097/PSY.0b013e3181a5429d. [DOI] [PMC free article] [PubMed] [Google Scholar]
- 27.Gustafson D, Lissner L, Bengtsson C, Bjorkelund C, Skoog I. A 24-year follow-up of body mass index and cerebral atrophy. Neurology. 2004;63:1876–1881. doi: 10.1212/01.wnl.0000141850.47773.5f. [DOI] [PubMed] [Google Scholar]
- 28.Jagust W, Harvey D, Mungas D, Haan M. Central obesity and the aging brain. Arch Neurol. 2005;62:1545–1548. doi: 10.1001/archneur.62.10.1545. [DOI] [PubMed] [Google Scholar]
- 29.Haltia LT, Viljanen A, Parkkola R, Kemppainen N, Rinne JO, Nuutila P, Kaasinen V. Brain white matter expansion in human obesity and the recovering effect of dieting. J Clin Endocrinol Metab. 2007;92:3278–3284. doi: 10.1210/jc.2006-2495. [DOI] [PubMed] [Google Scholar]
- 30.Dhillon H, Zigman JM, Ye C, Lee CE, McGovern RA, Tang V, Kenny CD, Christiansen LM, White RD, Edelstein EA. Leptin directly activates SF1 neurons in the VMH, and this action by leptin is required for normal body-weight homeostasis. Neuron. 2006;49:191–203. doi: 10.1016/j.neuron.2005.12.021. [DOI] [PubMed] [Google Scholar]
- 31.Ahren B. Autonomic regulation of islet hormone secretion - implications for health and disease. Diabetologia. 2000;43:393–410. doi: 10.1007/s001250051322. [DOI] [PubMed] [Google Scholar]
- 32.Woods SC, Porte D Jr. Neural control of the endocrine pancreas. Physiol Rev. 1974;54:596–619. doi: 10.1152/physrev.1974.54.3.596. [DOI] [PubMed] [Google Scholar]
- 33.Billaudel B, Sutter BCJ. Immediate in-vivo effect of corticosterone on glucose-induced insulin secretion in the rat. J Endocr. 1982;95:315–320. doi: 10.1677/joe.0.0950315. [DOI] [PubMed] [Google Scholar]
- 34.Seaquist ER, Damberg GS, Tkac I, Gruetter R. The effect of insulin on in vivo cerebral glucose concentrations and rates of glucose transport/metabolism in humans. Diabetes. 2001;50:2203–2209. doi: 10.2337/diabetes.50.10.2203. [DOI] [PubMed] [Google Scholar]
- 35.Hasselbalch SG, Knudsen GM, Videbaek C, Pinborg LH, Schmidt JF, Holm S, Paulson OB. No effect of insulin on glucose blood-brain barrier transport and cerebral metabolism in humans. Diabetes. 1999;48:1915–1921. doi: 10.2337/diabetes.48.10.1915. [DOI] [PubMed] [Google Scholar]
- 36.36 A, Langemann D. Stress and eating behavior; f1000. Biol Rep. 2010;2:13. doi: 10.3410/B2-13. [DOI] [PMC free article] [PubMed] [Google Scholar]
- 37.Chaput JP, Arguin H, Gagnon C, Tremblay A. Increase in depression symptoms with weight loss: association with glucose homeostasis and thyroid function. Appl Physiol Nutr Metab. 2008;33:86–92. doi: 10.1139/H07-137. [DOI] [PubMed] [Google Scholar]
- 38.Brinkworth GD, Buckley JD, Noakes M, Clifton PM, Wilson CJ. Long-term effects of a very low-carbohydrate diet and a low-fat diet on mood and cognitive function. Arch Intern Med. 2009;169:1873–1880. doi: 10.1001/archinternmed.2009.329. [DOI] [PubMed] [Google Scholar]
- 39.McClernon FJ, Yancy WS, Jr., Eberstein JA, Atkins RC, Westman EC. The effects of a low-carbohydrate ketogenic diet and a low-fat diet on mood, hunger, and other self-reported symptoms. Obesity (Silver Spring) 2007;15:182–187. doi: 10.1038/oby.2007.516. [DOI] [PubMed] [Google Scholar]
- 40.Halyburton AK, Brinkworth GD, Wilson CJ, Noakes M, Buckley JD, Keogh JB, Clifton PM. Low- and high-carbohydrate weight-loss diets have similar effects on mood but not cognitive performance. Am J Clin Nutr. 2007;86:580–587. doi: 10.1093/ajcn/86.3.580. [DOI] [PubMed] [Google Scholar]
- 41.Bryan J, Tiggemann M. The effect of weight-loss dieting on cognitive performance and psychological well-being in overweight women. Appetite. 2001;36:147–156. doi: 10.1006/appe.2000.0389. [DOI] [PubMed] [Google Scholar]