

Summary
The design of selective small-molecules is often stymied by similar ligand binding pockets. Here, we report BSJ-03–123, a phthalimide-based degrader that exploits protein-interface determinants to achieve proteome-wide selectivity for the degradation of cyclin-dependent kinase 6 (CDK6). Pharmacologic CDK6 degradation targets a selective dependency of acute myeloid leukemia cells, and transcriptomics and phosphoproteomics profiling of acute degradation of CDK6 enabled dynamic mapping of its immediate role in coordinating signaling and transcription.
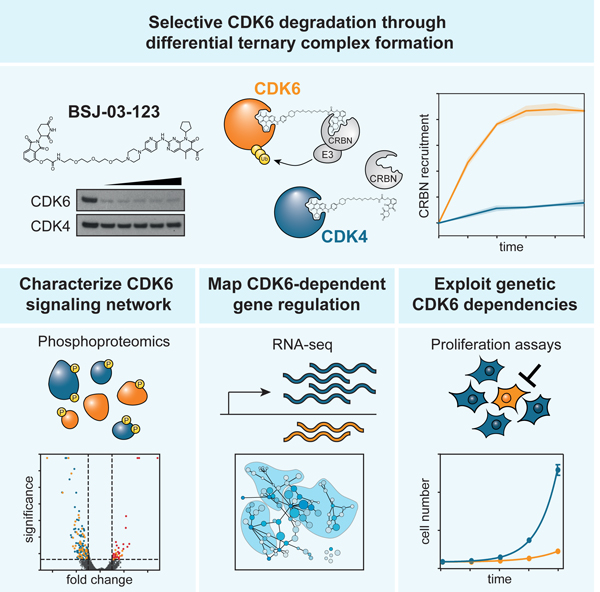
Graphical Abstract
eTOC blurb
Brand et al. describe BSJ-03–123, a degrader with proteome-wide selectivity for CDK6. Specificity emerges from differential ternary complex formation with the E3 ligase CRL4CRBN. BSJ-03–123 exploits a dependency of AML cells on CDK6, and rapid degradation allowed assaying the role of CDK6 in coordinating signaling and gene control in AML.
Introduction
Cyclin-dependent kinases (CDKs) orchestrate fundamental cellular processes such as cell cycle and transcription. CDKs are serine/threonine kinases and their activity is dependent on association with cyclins, enabling temporal control over enzymatic function. CDK4 and CDK6 control G1-S transition by associating with D-type cyclins to phosphorylate the tumor suppressor retinoblastoma (Rb). This relieves Rb-mediated repression of E2F transcription factors (TF) to trigger gene expression required for S-phase entry. While CDK4 and 6 were long perceived as redundant, recent studies have identified homolog-specific functions. In particular, CDK6 emerged as a regulatory hub connecting cell cycle with metabolism (Wang et al., 2017) and transcription (Tigan et al., 2016). In several contexts, the transcriptional role of CDK6 is independent of its kinase function, but relies on a molecular scaffolding (Kollmann et al., 2013; Tigan et al., 2016).
ATP-competitive CDK4/6 inhibitors have shown significant clinical activity, leading to approval of three drugs for breast cancer (O’Leary et al., 2016). However, none of these inhibitors can discriminate between CDK4 and CDK6, as they share 94% amino acid sequence identity in their ATP binding pockets. In addition, current inhibitors can’t disrupt scaffolding functions (Kollmann et al., 2013). To address this, we turned to a ligand-induced targeted protein degradation strategy based on heterobifunctional molecules that induce molecular proximity between a protein of interest (POI) and the CRL4CRBN E3 ligase complex (Lu et al., 2015; Winter et al., 2015; Zengerle et al., 2015). Interestingly, studies of degraders derived from multi-targeted warheads revealed that only a subset of targets were efficiently degraded, indicating the possibility of engineering selectivity into poly-pharmacologic scaffolds (Bondeson et al., 2017; Gadd et al., 2017; Huang et al., 2017; Olson et al., 2017; Winter et al., 2015). Along those lines, it was demonstrated that selective degradation can be achieved by exploiting amino acid differences in the POI-E3 interface and thus differential ternary complex formation (Gadd et al., 2017; Nowak et al., 2018).
Here, we explored the feasibility of homolog-selective degradation of CDK6 versus CDK4 using ligands that bind the ATP sites of both enzymes. We describe the discovery and characterization of BSJ-03–123, a selective degrader of CDK6 that uniquely enables rapid pharmacological interrogation of CDK6-dependent functions. Coupling acute CDK6 degradation with phosphoproteomic and transcriptomic profiling allowed us to establish a systems-level understanding of the sensitivity of AML cell lines to selective CDK6 ablation and to chart a network of CDK6-dependent signaling events.
Results
Development of a homolog-selective CDK6 degrader
Towards the development of CDK4/6 degraders, we chose palbociclib (palbo) as a starting point given its high selectivity and potency (Fry et al., 2004). Available crystal structures of palbo with CDK6 (PDB: 5L2I) highlighted the solvent-exposed piperazine moiety as an ideal site for linker conjugation (Chen et al., 2016). We installed a 3-polyethylene glycol (PEG) linker conjugated to pomalidomide, resulting in the compound YKL-06–102 (YKL, Figure 1A). Biochemical characterization indicated that phthalimide conjugation results in a comparable, albeit weakly reduced binding affinity to both CDK4 and CDK6 (Figure S1A, Table S1). Moreover, YKL bound to recombinant CRBN-DDB1 with comparable affinity as lenalidomide (Table S1). Unexpectedly, cellular treatment with YKL led to a selective destabilization of CDK6 (Figure S1B, C–D). To further survey degrader selectivity, we employed global proteomics following cellular treatment. While recapitulating the selective degradation of CDK6, we detected significant destabilization of IKZF1 and IKZF3 (p=6.19e−6) (Figure 1B), suggesting warhead-independent CRBN substrate modulation (An et al., 2017; Gandhi et al., 2014; Kronke et al., 2014; Lu et al., 2014). To remove IKZF1/3 activity of YKL, we designed BSJ-03–123 (BSJ) by employing a phenoxyacetamide linker without altering the initial linker length (Figure 1C). Measurements of in vitro binding to recombinant kinase domains (KINOMEScan) confirmed that phthalimide conjugation preserves the narrow selectivity profile (Figure S1G, Table S2). BSJ induced CRBN-dependent, potent, fast and homologue-selective degradation of CDK6 (Figure 1D–F, Figure S1E). In proteome-wide selectivity studies, CDK6 was the only destabilzied protein (Figure 1G, Figure S1F).
Figure 1. Development of a homolog-selective degrader of CDK6.

(A) Structure of YKL-06–102. (B) Quantification of 5945 proteins following treatment with YKL-06–102 (500 nM, 5 h). FDR-adjusted p-values. Kinases inhibited by palbociclib in vitro are color-coded by magnitude of inhibition. (C) Structure of BSJ-03–123 (BSJ). (D) Immunoblot for CDK4, CDK6 and histone 3 after 4h BSJ treatment. (E) As in (D), but time-resolved at 200 nM BSJ. (F) Immunoblot for CDK6 and histone 3. 200 nM BSJ, 4h, in CRBN-deficient and wt MV4–11. (G) Quantification of 5995 proteins following BSJ treatment (100 nM, 2 h). FDR-adjusted p-values. Kinase labeling as in B. (H) Structure of BSJ-bump. (I) As (D), but for BSJ-bump. See also Figure S1 and Table S1–S2.
Based on BSJ, we furthermore synthesized a N-methylated glutarimide analog (BSJ-bump) incapable of CRBN binding in vitro (Figure 1H, Table S1). Accordingly, BSJ-bump was unable to degrade CDK4 or CDK6, thus serving as excellent negative control with matched physiochemical properties (Figure 1I).
BSJ-03–123 triggers homolog-selective degradation via differential ternary complex formation
Next, we sought to understand the mechanism of CDK6 selectivity. In vitro kinase assays confirmed comparable affinity to both kinases (Figure S1A, Table S1). Similar cellular thermal stabilization of CDK4/6 further suggested that selectivity does not emerge from differential cellular target engagement (Figure 2A). We thus hypothesized that selectivity might stem from differential ternary complex formation. To monitor tripartite assembly in real time in intact cells, we designed a luciferase complementation assay based on NanoBiT® technology (Figure 2B). We expressed C-terminal CDK4/6 LgBit fusions along with an N-terminal SmBit-CRBN fusion in 293TCRBN−/− cells. BSJ induced rapid, dose-dependent ternary complex formation with CDK6 and CRBN, but not with CDK4 and CRBN (Figure 2C). Treatment with BSJ-bump failed to induce CDK6:CRBN interactions (Figure 2C). Ternary complex formation was prevented by blocking binding sites on CDK6 or CRBN via pretreatment with palbo or lenalidomide (Figure 2D). We thus concluded that BSJ exploits structural differences between CDK4 and CDK6 to achieve homolog-selective degradation of CDK6 via differential ternary complex formation.
Figure 2. BSJ-03–123 selectivity is explained by differential ternary complex formation.

(A) Immunoblot for CDK4 and CDK6 after thermal shift assay in MV4–11 CRBN−/− cells after cellular treatment with DMSO, palbociclib, or BSJ (both at 20 µM). (B) Schematic representation of the luciferase complementation assay. (C) Measurement of CDK4:CRBN and CDK6:CRBN binding via NanoBiT® assay. Averages of 5 replicates are plotted, shaded areas represent 95% CIs. (D) Measurement of CDK6:CRBN complex formation after 1 h pre-treatment with 20 µM palbociclib or lenalidomide. Statistics as in (C).
BSJ-03–123 can exploit homolog-selective dependency on CDK6
To identify a cellular system that is disproportionally dependent on CDK6 over CDK4, we turned to genome-scale CRISPR/Cas9 screens in 342 cancer cell lines (Meyers et al., 2017). We identified a pronounced enrichment of acute myeloid leukemia (AML) cell lines among the most CDK6-addicted models (Figure 3A). None of these cell lines showed a comparable dependency on CDK4 (Figure S2A) Intersection with gene expression data did not unveil a correlation between essentiality and mRNA transcript levels (Figure 3A, S2A) (Klijn et al., 2015). Accodingly, CRISPR/Cas9-mediated genetic depletion of CDK4 in the AML cell line MV4–11 revealed largely preserved growth kinetics and cell cycle distribution, supporting a dispensable role of CDK4 in the proliferation of AML cell lines (Figure S2B–D).
Figure 3. BSJ-03–123 exploits homolog-selective dependencies.

(A) Bottom: Waterfall plot of 391 cell lines ranked by CDK6 dependency as determined in genome-wide CRISPR/Cas9 screens. CERES essentiality score is normalized for copy number variation and scaled by setting the median of pan-essential genes to −1. Top: mRNA levels of CDK4, CDK6 and D-type cyclins. (B) Colony formation assays (12 days, refreshing the treatment every 2 d). (C) Growth curves of AML cell lines treated with 200 nM BSJ, BSJ-bump or DMSO. Cells were counted and treatment refreshed every 2 days. (D) Cell cycle after treatment with 200 nM BSJ or BSJ-bump for 24 h. (E) Percentage of apoptotic cells after 24 h treatment with 200 nM palbociclib, BSJ, BSJ-bump or DMSO (Caspase-Glo® 3/7 assay). BET protein degrader dBET6 served as positive control. (F) Growth curves of CDK4-deficient MV4–11 treated with 200 nM BSJ, palbociclib or DMSO. See also Figure S2.
Given their lack of homolog-selectivity, CDK4/6 inhibitors are incapable of exploiting such fine-tuned genetic dependencies. Concomitant inhibition of both homologs is thus expected to limit the achievable therapeutic window. Therefore, we wanted to test if BSJ could target the genetic dependency of AML cells on CDK6, while sparing CDK4-dependent cancer cells lines. As expected, dual CDK4/6 inhibition severely impaired proliferation of CDK4-dependent cell lines, whereas selective degradation of CDK6 did not trigger a comparable effect (Figure 3B, Figure S2E). In contrast, BSJ caused a pronounced anti-proliferative effect in CDK6-dependent AML cell lines by inducing a G1 cell cycle arrest without a measurable increase in apoptosis (Figure 3C–E). Of note, this effect exceeded the anti-proliferative consequences of cellular treatment with BSJ-bump (Figure 3C, S2F). The observed benefit of CDK6 degradation over CDK6 inhibition could be due to the disruption of additional, kinase activity-independent molecular mechanisms (Kollmann et al., 2013), or due to pharmacologic advantages of degraders, such as catalytic target turnover. To address this, we compared BSJ to the clinically approved palbo in CDK4 deficient MV4–11 cells to enable a CDK6-centric readout. In this experimental setup, selective degradation of CDK6 was not superior to enzymatic inhibition (Figure 3F). While interpretation of this comparison is non-trivial given the physicochemical differences between the molecules, it suggests that the dependency of AML cells on CDK6 is mostly dependent on its kinase function.
Impairment of selective regulatory networks after CDK6 degradation
We next investigated drug impact on the known CDK4/6 Rb-phosphorylation site S780. Both BSJ and palbo treatment reduced levels of p-S780 (Figure 4A). Notably, BSJ-bump treatment failed to affect phosphorylation of Rb, indicating that at the assayed concentration, enzymatic CDK4/6 inhibition is insignificant (Figure 4A). Measurable impact of BSJ-bump was only observed upon dose escalation (Figure S2G). In line with this, the effect of BSJ treatment on Rb phosphorylation is rescued upon CRBN knock-out (Figure S2H).
Figure 4. An integrated view of the effects of acute CDK6 degradation on cellular signaling and transcription.

(A) Immunoblot for p-RB S780, RB, CDK4, CDK6 and histone 3 after treatment with 200 nM BSJ, palbociclib or BSJ-bump. (B) Global phosphoproteomics. Heat map depicting fold changes in peptide phosphorylation after BSJ or palbociclib treatment (200 nM, 2 h) compared to DMSO for 305 differentially phosphorylated peptides. Hits (log2 FC > 0.5 or < −0.5, adj. p-value < 0.05) and peptides phosphorylated at canonical SP/TP CDK phosphorylation motifs are annotated. (C) Heat map of DMSO-normalized fold changes in gene expression after BSJ, YKL, or palbociclib treatment (200 nM, 6h) for 993 significantly deregulated genes (log2 FC > 1.5 or < −1.5, adj. p-value < 0.05). (D) Functional network of BSJ treatment. Nodes represent GO-terms enriched among genes that are differentially expressed upon treatment, scaled by magnitude and color coded by significance of enrichment. Edges represent parent-child relationships of GO-terms. Molecular network of BSJ treatment. Hits identified via global phosphoproteomics were mapped on a protein-protein interaction network and expanded to include first order neighbors limited to ENCODE transcriptional regulators. Node shape distinguishes transcriptional regulators (TR, diamonds) from phosphoproteomics hits (round). Node color represents the number of quantified phosphopeptides. Diamonds are scaled proportional to percentage of dysregulated TR target genes upon treatment. Proteins phosphorylated at CDK consensus motif (SP/TP) are annotated by edge color. Edges represent physical interaction between proteins. See also Figure S3–4.
Given the plethora of functions assigned to CDK6, we globally extended our analysis to assay how acute and selective CDK6 disruption affects cellular signaling and gene activity in AML. Given the limited activity of BSJ-bump, we compared selective degradation of CDK6 via BSJ to catalytic CDK4/6 inhibition by palbo. We coupled acute drug treatment (2h, 200 nM each) to quantitative (Ser/Thr) phosphoproteomics to focus on direct drug effects. We quantified a total of 22804 phosphopeptides in at least one technical replicate. In general, drug impact was modest with 197 deregulated phosphopeptides after treatment with BSJ (44 up, 153 down), and 191 deregulated (57 up, 134 down) phosphopeptides following palbo treatment (Figure 4B, S3A). Changed sites were enriched for CDK-motifs based on kinase-substrate enrichment analysis (Figure 4B, S3B), validating that short treatments biased for upstream events (Casado et al., 2013). Proteins with altered phosphosites were enriched for known regulators of cell cycle progression (Figure S3C). Moreover, our data indicate a significant (p = 4.49×10⁻⁵) overlap with a previously reported CDK4/6 substrates based on in vitro assays (Anders et al., 2011), but also uncovered undescribed substrates such as the splicing factor SRRM2 and the RSF chromatin-remodeling compenent RSF1 (Figure S3D,E).
In parallel, we compared the transcriptional response elicited by palbo and BSJ. This allowed us to determine if CDK6 orchestrates transcription independent of its kinase domain. As expected, transcriptional impact of YKL significantly differed from BSJ/palbo owing to off-target effects on IKZF1 and IKZF3. In contrast, enzymatic CDK4/6 inhibition and CDK6 degradation yielded a very similar and highly correlated (R2= 0.9375) transcriptional response, arguing that the transcriptional role of CDK6 in AML is mostly limited to its kinase function (Figures S4A–D). To further explore the functional implications of immediate CDK6 degradation, we performed GO-term analysis of transcriptional changes elicited by CDK6 degradation and CDK4/6 inhibition (Figure 4D, S4E). Again, transcriptional consequences were similar, indicating that both converge on known pathways such as cell cycle regulation, but also influence processes such as DNA replication, the DNA damage response, or chromatin organization.
To derive a systems-level understanding of the function of CDK6, we condensed data from transcriptional and phosphoproteomic profiling into a network centered around proteins with altered phosphopeptides after immediate CDK6 degradation (Figure 4E). Proteins were differentiated based on presence of a consensus CDK phosphorylation motif (SP/TP) in the detected phosphopeptides. Next, we expanded this network by adding ENCODE transcriptional regulators with established protein-protein interactions to members from the experimentally derived network. Network expansion was limited to factors with available genome-wide binding data. Dynamic transcriptional changes after CDK6 depletion were calculated and altered target genes were assigned to the network-resident transcription factors, which were visually scaled based on the percentage of dynamically regulated target genes (Figure 4E). This integrated network allowed identification of known, consensus downstream signaling axes like Rb-E2F1, but also nodes such as BCL11A and NCOR2, previously not linked to CDK6. Network topologies are largely overlapping between BSJ- or palbo treatment (Figure S3F), again supporting the notion that in AML, CDK6 coordinates signaling and gene control predominantly via its kinase function.
Discussion
The development of highly selective small-molecules is a longstanding challenge in ligand discovery given the structural similarities of substrate- or cofactor binding sites. This is a particular concern with ATP-competitive kinase inhibitors where a lack of selectivity can limit the achievable therapeutic window. This hinders pharmacologic exploitation of genetically defined dependencies for therapeutic indications. Here, we present BSJ-03–123 (BSJ), a homolog-selective CDK6 degrader. BSJ features proteome-wide selectivity for CDK6 via differential ternary complex formation. Selectivity of BSJ enables exploitation of genetic dependencies beyond a resolution achievable with dual CDK4/6 inhibitors. In particular, we show that BSJ is capable of exploiting a homolog-selective dependency of AML cells on CDK6, thus outlining the potential for selective CDK6 degraders for further translational investigation, conceivably at reduced overall toxicity. Degradation of CDK6 is fast and potent, allowing us to map global consequences of acute CDK6 disruption on downstream signaling networks and transcriptional programs. While we cannot rule out that, at saturating concentrations, BSJ also catalytically inhibits CDK4, no inhibition was measured at the assayed concentration. Comparative profiling of CDK6 degradation and CDK4/6 inhibition suggest that in AML, CDK6 integrates signaling and gene activity predominantly via its kinase activity. Our analysis uncovered several signaling nodes and transcriptional hubs previously not linked to CDK6, such as BCL11A and NCOR2, and future research will be necessary to explore the functional relevance of these pathways in AML and beyond. CDK6 features a prominent role in other malignancies as well as hematopoietic and leukemic stem cells. Selective degradation of CDK6 will facilitate differentiating relevant molecular mechanisms and further untangle kinase-dependent and -independent functions. Future medicinal chemistry efforts will be necessary to expand on the presented concept and to develop a toolbox of selective degraders to investigate the role of protein kinases at unprecedented precision and kinetic resolution.
STAR methods
Contact for Reagent and Resource Sharing
Further information and requests for resources and reagents should be directed to and will be fulfilled by the lead contact, Georg Winter (gwinter@cemm.at).
Experimental Model and Subject Details
MV4–11 (RRID:CVCL_0064), THP-1 (RRID:CVCL_0006), MOLM13 (RRID:CVCL_2119), P31/FUJ (RRID:CVCL_1632), MOLT4 (RRID:CVCL_0013), NCI-H358 (RRID:CVCL_1559) and HT29
(RRID:CVCL_0320) cells were cultured in RPMI-1640 growth medium (Gibco) supplemented with 10% fetal bovine serum (Gibco) and 1% Penicillin/Streptomycin solution (ThermoFisher Scientific). HEK293T (RRID:CVCL_0063) and Hs578T (RRID:CVCL_0332) cells were cultured in DMEM (Gibco) supplemented with 10% fetal bovine serum (Gibco) and 1% Penicillin/Streptomycin solution (ThermoFisher Scientific). All cell lines were cultured at 37 °C with 5% CO 2 and tested for mycoplasma contamination and cell identity.
Sex of human cell lines: MV4–11 (Male, 10 years old), THP-1 (Male, 1 year old), MOLM13 (Male, 20 years old), P31/FUJ (Male, 7 years old), MOLT4 (Male, 19 years old), NCI-H358 (Male, age unknown), HT29 (Female, 44 years old), HEK293T (Female, fetus), Hs578T (Female, 74 years old).
Method Details
Knockout generation
sgRNAs (CDK4: 5’-AGCCACTGGCTCATATCGAG-3’, CRBN: 5’-TAAACAGACATGGCCGGCGA-3’) were cloned into Lenti_sgRNA_EFS_GFP (addgene #65656). Cells were transduced with lentiviral particles, selected by sorting for GFP positive cells and successful knockout verified by immunoblot and Sanger sequencing.
Proliferation assays
For growth over time experiments of suspension cell lines, 300.000 cells per well were seeded in 24-well plates in triplicates. Cells were counted and treatments renewed every 2 days. For growth over time experiments of adherent cell lines, 100.000 cells per well were seeded in 12-well plates in triplicates. Cells were trypsinized and counted and treatments renewed every 3 days. For colony formation assays, 1000 cells per well were seeded in 6-well plates in duplicates. Every 2 days, culture medium was exchanged and treatments were renewed. After 12 days, cells were fixed in 1% PFA in PBS for 15 min at room temperature, washed 3 times with PBS and stained in Crystal Violet solution (0.1% in 10% EtOH) for 15 min at room temperature. The cells were again washed 3 times with PBS and left to dry overnight.
Cell cycle and apoptosis
For cell cycle measurement, 106 cells per well were seeded in 24-well plates in triplicates. After 24 h of drug treatment, cells were harvested by centrifugation at 500g for 5 min and washed in 1 ml cold PBS. Cells were spun down again, resuspended in 200 µl PBS and fixed by addition of 800 µl 70% EtOH and incubation for 20 min at −20°C. Cells were washed w ith 1 ml PBS and stained with 500 µl propidium iodide solution (50 µg/ml propidium iodide (Sigma Aldrich), 200 µg/ml RNase A (ThermoFisher Scientific), in PBS). Cellular DNA content was measured by flow cytometry using FACSCalibur (BD Biosciences) and analyzed using the FlowJo v10 software.
Analysis of apoptotic cells was performed using Caspase-Glo 3/7 (Promega) according to manufacturer’s instructions. 20 000 cells per well were seeded in triplicate in a white 96-well plate in a total volume of 50 µl. After 24 h incubation with the treatment, 45 µl Caspase-Glo substrate were added per well. The plate was incubated at room temperature in the dark for 1 h and luminescence measured on a Victor X3 (Perkin Elmer) microplate reader. Luminescent signal was normalized to vehicle-treated cells.
In vitro CRBN Binding Assay
Compounds in Atto565-Lenalidomide displacement assay were dispensed in a 384-well microplate (Corning, 4514) using D300e Digital Dispenser (HP) and normalized to 1% DMSO into 10 nM Atto565-Lenalidomide, 100 nM DDB1∆B-CRBN, 50 mM Tris pH 7.5, 200 mM NaCl, 0.1% Pluronic F-68 solution (Sigma). The change in fluorescence polarization was monitored using a PHERAstar FS microplate reader (BMG Labtech) for 30 cycles of 187s each. Data from three independent measurements (n = 3) was plotted and IC50 values estimated using variable slope equation in GraphPad Prism 7.
Immunoblotting
2×10⁶ cells were lysed in RIPA buffer (150 nM NaCl, 0.1% Triton X-100, 0.5% sodium deoxycholate, 0.1% SDS, 50 mM Tris-HCl (pH 8.0), protease inhibitors (Thermo Scientific), benzonase (Novagen)). Cell lysates containing 40 µg of protein were loaded on Bolt™ 4–12% Bis-Tris Plus Gels (Thermo Scientific) and ran for SDS-PAGE before transfer onto 0.45 µM nitrocellulose membrane (GE Healthcare). Following antibodies were used for detection:
| Name | Origin | Cat. No. |
|---|---|---|
| CDK4 | Cell Signaling | #12790 |
| CDK6 | Santa Cruz | sc-7961 |
| Histone 3 | Abcam | ab1791 |
| β-actin | Sigma-Aldrich | A5441 |
| p-Rb S780 | Cell Signaling | #8180 |
| Rb | Cell Signaling | #9309 |
| Peroxidase-conjugated AffiniPure Goat Anti-Mouse IgG | Jackson Immuno Research | 115–035-003 |
| Peroxidase-conjugated AffiniPure Goat Anti-Rabbit IgG | Jackson Immuno Research | 111–035-003 |
Cellular Thermal Shift Assay
4×10⁶ MV4–11 CRBN−/− cells were treated for 3 h with 20 µM palbociclib, BSJ-03–123 or vehicle. 1×10⁶ cells were spun down at 500 x g for 5 min, and the supernatant removed. Pellets were incubated at 46, 49, 52 or 55 °C for 3 min followed by 3 min incubat ion at room temperature. 30 µl of lysis buffer (20 mM Tris-HCl pH 8.0, 120 mM NaCl, 0.5% NP-40, protease inhibitors) were added and cells lysed by 3 rounds of snap freezing and thawing. Denatured proteins were removed by 20 min centrifugation at 14.000 x g at 4 °C and supernatants analyzed by Western Blotting.
NanoBiT® assay
The NanoBiT® assay (Promega) was performed following manufacturer’s instructions. Full-length CDK4 and CDK6 were cloned into pBit1.1-C [TK/LgBiT] vector, full-length CRBN was cloned into pBit2.1-N [TK/SmBiT]. 400.000 CRBN-deficient HEK293T cells were seeded in a 6-well plate and transfected the day after with 750 µg each of CDK4/6-LgBit and CRBN-SmBit using Lipofectamine (Thermo Fisher Scientific) according to manufacturer’s instructions. After 24 h, cells were detached and 50.000 cells per well seeded in a 96-well plate and allowed to attach overnight. Before the assay, the medium was exchanged with 100 µl of ambient temperature fresh medium supplemented with 25 mM HEPES and the plate incubated for 10 min at room temperature to equilibrate. 25 µl Nano-Glo® Live Cell Reagent was added per well, incubated for 5 min and baseline luminescence measured on a Victor X3 (Perkin Elmer) with 2 s integration time. 10 µl of 13.5X drug stock were added per well and emission of luminescent signal monitored by continuous measurement every 2 min. Signals were normalized to baseline and vehicle treated cells.
Expression proteomics BSJ-03–123
Sample preparation:
15×106 MOLT4 cells were treated with 100 nM BSJ-03–123 for 2 h, in triplicate. Cells were washed three times with PBS, the supernatant aspirated and pellets snap-frozen in liquid N2. Each washed cell pellet was lysed separately in 40 µL of freshly prepared lysis buffer containing 50 mM HEPES (pH 8.0), 2% SDS, 0.1 M DTT, 1 mM PMSF, and protease inhibitor cocktail (Sigma-Aldrich). Samples rested at RT for 20 minutes before heating to 99 °C for 5 min. After cooling down to RT, DNA was sheared by sonication using a Covaris S2 high performance ultrasonicator. Cell debris were removed by centrifugation at 20.000 × g for 15 min at 20 °C. Supernatant was transferre d to fresh eppendorf tubes and protein concentration determined using the BCA protein assay kit (Pierce Biotechnology, Rockford, IL). FASP was performed using a 30 kDa molecular weight cutoff filter (VIVACON 500) . Fifty microliters of each cleared protein extract were mixed with 200 µL of freshly prepared 8 M urea in 100 mM Tris-HCl (pH 8.5) (UA-solution) in the filter unit and centrifuged at 14.000 × g for 15 min at 20 °C to remove SDS. Any residual SDS was washed out by a second washing step with 200 µL of UA. The proteins were alkylated with 100 µL of 50 mM iodoacetamide in the dark for 30 min at RT. Afterward, three washing steps with 100 µL of UA solution were performed, followed by three washing steps with 100µL of 50 mM TEAB buffer (Sigma-Aldrich). Proteins were digested with trypsin overnight at 37 °C. Peptides were recovered using 40 µL of 50 mM TEAB buffer followed by 50 µL of 0.5 M NaCl (Sigma-Aldrich). Peptides were desalted using C18 solid phase extraction spin columns (The Nest Group, Southborough, MA). After desalting, peptides were labeled with TMT 10plex™ reagents according to the manufacturer (Pierce, Rockford, IL). After quenching of the labeling reaction, labeled peptides were pooled, organic solvent removed in a vacuum concentrator at 45°C and reconstituted in 5% acetonitrile contai ning 20mM ammonia formate buffer, pH 10 for offline fractionation using high pH reversed phase liquid chromatography (2D-RP/RP-HPLC).
2D-RP/RP Liquid Chromatography Mass Spectrometry:
Two-dimensional liquid chromatography was performed by reverse-phase chromatography at high and low pH. In the first dimension, peptides were separated on a Gemini-NX C18 (150 × 2 mm, 3 µm, 110 Å, Phenomenex, Torrance, USA) in 20 mM ammonia formate buffer, pH 10, and eluted over 45 min by a 5–70% acetonitrile gradient at 100 µL/min using an Agilent 1200 HPLC system (Agilent Biotechnologies, Palo Alto, CA, USA). Ninty-six time-based fractions were collected and consolidated into 40 fractions. After solvent removal in a vacuum concentrator, samples were reconstituted in 5% formic acid for LC-MS/MS analysis. Mass spectrometry was performed on an Orbitrap Fusion Lumos mass spectrometer (ThermoFisher Scientific, San Jose, CA) coupled to an Agilent 1200 HPLC nanoflow system (Agilent Biotechnologies, Palo Alto, CA) via nanoflex source interface. Tryptic peptides were loaded onto a trap column (Zorbax 300SB-C18 5 µm, 5 × 0.3 mm, Agilent Biotechnologies) at a flow rate of 45 µL/min using 0.1% TFA as loading buffer. After loading, the trap column was switched in-line with a 25 cm, 75 µm inner diameter analytical column (packed in-house with ReproSil-Pur 120 C18-AQ, 3 µm, Dr. Maisch, Ammerbuch-Entringen, Germany). Mobile-phase A consisted of 0.4% formic acid in water and mobile-phase B of 0.4% formic acid in a mix of 90% acetonitrile and 10% water. The flow rate was set to 230 nL/min and a 90 min gradient used (6 to 30% solvent B within 81 min, 30 to 65% solvent B within 8 min and, 65 to 100% solvent B within 1 min, 100% solvent B for 6 min before equilibrating at 6% solvent B for 18 min). Analysis was performed in a data-dependent acquisition mode using the multi-notch MS3-based TMT method (termed SPS-MS3 on the Lumos instrument). MS1 spectra were acquired within a mass range of 350 – 1550 m/z in the orbitrap at a resolution of 120,000 (at 200Th). Automatic gain control (AGC) was set to a target of 2 × 10⁵ and a maximum injection time of 50 ms. Precursor ions for MS2/MS3 analysis were selected using a Top10 dependent scan approach. MS2 spectra were acquired in the linear quadrupole ion trap (IT) using a quadrupole isolation window of 0.8Da; collision induced dissociation (CID) for fragmentation; a normalized collision energy (NCE) of 35%; an AGC target of 4 × 10³; and a maximum injection time of 150 ms. For TMT quantitation, each MS2 scan followed a SPS-MS3 scan of the same precursor ion using the multiple frequency notches approach 3. The quadrupole isolation window for MS3 scans was set to 2 Da and the top 5 most intense MS2 fragment ions were isolated by SPS for fragmentation by higher energy collision-induced dissociation (HCD) using a NCE of 65%. Resulting fragment ions were analyzed in the Orbitrap at a resolution of 50,000 (at 200 Th). AGC settings were 5 × 10⁴ and a maximum injection time of 150 ms. Dynamic exclusion for selected ions was 60 s. A single lock mass at m/z 445.120024 was employed. Xcalibur version 4.0.0 and Tune 2.1 were used to operate the instrument.
Expression proteomics YKL-06–102
MOLT4 cells were treated with DMSO or 500 nM of compound YKL-06–102 in biological triplicates for 5 hours and cells harvested by centrifugation. Lysis buffer (8 M Urea, 50 mM NaCl, 50 mM 4-(2hydroxyethyl)-1-piperazineethanesulfonic acid (EPPS) pH 8.5, Protease and Phosphatase inhibitors from Roche) was added to the cell pellets and homogenized by 20 passes through a 21 gauge (1.25 in. long) needle to achieve a cell lysate with a protein concentration between 1 – 4 mg mL-1. A micro-BCA assay (Pierce) was used to determine the final protein concentration in the cell lysate. 200 µg of protein for each sample were reduced and alkylated.
Proteins were precipitated using methanol/chloroform. In brief, four volumes of methanol were added to the cell lysate, followed by one volume of chloroform, and finally three volumes of water. The mixture was vortexed and centrifuged to separate the chloroform phase from the aqueous phase. The precipitated protein was washed with three volumes of methanol, centrifuged and the resulting washed precipitated protein was allowed to air dry. Precipitated protein was resuspended in 4 M Urea, 50 mM HEPES pH 7.4, followed by dilution to 1 M urea with the addition of 200 mM EPPS, pH 8. Proteins were first digested with LysC (1:50; enzyme:protein) for 12 hours at room temperature. The LysC digestion was diluted to 0.5 M Urea with 200 mM EPPS pH 8 followed by digestion with trypsin (1:50; enzyme:protein) for 6 hours at 37 °C. Tandem mass tag (TMT) reagents (Thermo Fishe r Scientific) were dissolved in anhydrous acetonitrile (ACN) according to manufacturer’s instructions. Anhydrous ACN was added to each peptide sample to a final concentration of 30% v/v, and labeling was induced with the addition of TMT reagent to each sample at a ratio of 1:4 peptide:TMT label. The 10-plex labeling reactions were performed for 1.5 hours at room temperature and the reaction quenched by the addition of hydroxylamine to a final concentration of 0.3% for 15 minutes at room temperature. The sample channels were combined at a 1:1:1:1:1:1:1:1:1:1 ratio, desalted using C18 solid phase extraction cartridges (Waters) and analyzed by LC-MS for channel ratio comparison. Samples were then combined using the adjusted volumes determined in the channel ratio analysis and dried down in a speed vacuum. The combined sample was then resuspended in 1% formic acid, and acidified (pH 2−3) before being subjected to desalting with C18 SPE (Sep-Pak, Waters). Samples were then offline fractionated into 96 fractions by high pH reverse-phase HPLC (Agilent LC1260) through an aeris peptide xb-c18 column (phenomenex) with mobile phase A containing 5% acetonitrile and 10 mM NH4HCO3 in LC-MS grade H2O, and mobile phase B containing 90% acetonitrile and 10 mM NH4HCO3 in LC-MS grade H2O (both pH 8.0). The 96 resulting fractions were then pooled in a non-continuous manner into 24 fractions and these fractions were used for subsequent mass spectrometry analysis.
Data were collected using an Orbitrap Fusion Lumos mass spectrometer (Thermo Fisher Scientific, San Jose, CA, USA) coupled with a Proxeon EASY-nLC 1200 LC pump (Thermo Fisher Scientific). Peptides were separated on a 75 µM inner diameter microcapillary column packed with ~40 cm of Accucore C18 resin (1.6 µM, 100 Å, Thermo Fisher Scientific). Peptides were separated using a 150 min gradient of 6– 27% acetonitrile in 1.0% formic acid with a flow rate of 400 nL/min.
Each analysis used an MS3-based TMT method. The data were acquired using a mass range of m/z 340 – 1350, resolution 120,000, AGC target 1 × 10⁶, maximum injection time 100 ms, dynamic exclusion of 120 seconds for the peptide measurements in the Orbitrap. Data dependent MS2 spectra were acquired in the ion trap with a normalized collision energy (NCE) set at 35%, AGC target set to 1.8 × 10⁴ and a maximum injection time of 120 ms. MS3 scans were acquired in the Orbitrap with a HCD collision energy set to 55%, AGC target set to 1.5 × 10⁵, maximum injection time of 150 ms, resolution at 50,000 and with a maximum synchronous precursor selection (SPS) precursors set to 10.
Phosphoproteomics
15×106 MV4–11 cells were treated with 200 nM BSJ-03–123 or Palbociclib for 2 h, in triplicate. Cells were washed three times with PBS, the supernatant aspirated and pellets snap-frozen in liquid N2.
Each washed cell pellet was lysed separately in 40 µL of freshly prepared lysis buffer containing 50 mM HEPES (pH 8.0), 2% SDS, 0.1 M DTT, 1 mM PMSF, phosSTOP and protease inhibitor cocktail (Sigma-Aldrich). Samples rested at RT for 20 minutes before heating to 99 °C for 5 min. After cooling down to RT, DNA was sheared by sonication using a Covaris S2 high performance ultrasonicator. Cell debris was removed by centrifugation at 20.000 × g for 15 min at 20 °C. Supernatant was transferred to fresh eppendorf tubes and protein concentration determined using the BCA protein assay kit (Pierce Biotechnology, Rockford, IL). FASP was performed using a 30 kDa molecular weight cutoff filter (VIVACON 500). In brief, 100 µg total protein per sample were reduced by adding DTT at a final concentration of 83.3 mM followed by incubation at 99°C for 5 min. After cooling to room temperature, samples were mixed with 200 µL of freshly prepared 8 M urea in 100 mM Tris-HCl (pH 8.5) (UA-solution) in the filter unit and centrifuged at 14.000 × g for 15 min at 20 °C to remove SDS. Any residual SDS was washed out by a second washing step with 200 µL of UA. The proteins were alkylated with 100 µL of 50 mM iodoacetamide in the dark for 30 min at RT. Afterward, three washing steps with 100 µL of UA solution were performed, followed by three washing steps with 100µL of 50 mM TEAB buffer (Sigma-Aldrich). Proteins were digested with trypsin at a ratio of 1:35 overnight at 37 °C. Peptides were rec overed using 40 µL of 50 mM TEAB buffer followed by 50 µL of 0.5 M NaCl (Sigma-Aldrich). Peptides were desalted using C18 solid phase extraction spin columns (The Nest Group, Southborough, MA). After desalting, peptides were labeled with TMT 10plex™ reagents (label 128N was omitted) according to the manufacturer (Pierce, Rockford, IL). After quenching of the labeling reaction, labeled peptides were pooled, organic solvent removed in vacuum concentrator and labelled peptides loaded onto a SPE column. Peptides were eluted with 300µL 80% acetonitrile containing 0.1% trifluoroacetic to achieve a final peptide concentration of ~1µg/µl. Eluate was then used for phosphopeptide enrichment via immobilized metal affinity chromatography (IMAC) . Briefly, two times 100 µL of Ni-NTA superflow slurry (QIAGEN Inc., Valencia, USA) were washed with LCMS-grade water and Ni2+ stripped off the beads by incubation with 100 mM of EDTA, pH 8 solution for 1 hr at room temperature. Stripped NTA resin was recharged with Fe3+-ions by incubation with a fresh solution of Fe(III)Cl3 and 2 × 110 µL of charged resin slurry used for the enrichment of a total of ~900 µg TMT-labelled peptide. The unbound fraction was transferred to a fresh glass vial and used for offline fractionation for the analysis of the whole chromatome proteome. After washing the slurry with 0.1% TFA, phosphopeptides were eluted with a freshly prepared ammonia solution containing 3mM EDTA, pH 8 and all used for offline fractionation for the analysis of the phophoproteome.
Offline Fractionation via RP-HPLC at high pH
Peptides were re-buffered in 20 mM ammonium formiate buffer shortly before separation by reversed phase liquid chromatography at pH 10. Phosphopeptides was separated into 20 fractions on a Dionex column (500 µm × 50 mm PepSwift RP, monolithic, Dionex Corporation, Sunnyvale, CA, USA) using an Agilent 1200 series nanopump delivering solvent at 4 µL/min. Peptides were separated by applying a gradient of 90% aceonitrile containing 20 mM ammonium formiate, pH 10. After solvent removal in a vacuum concentrator, samples were reconstituted in 0.1% trifluroacetic acid (TFA) for LC-MS/MS analysis. Prepared samples were kept at −80°C until the analysis.
2D-RP/RP Liquid Chromatography Mass Spectrometry
Mass spectrometry was performed on an Orbitrap Fusion Lumos mass spectrometer (ThermoFisher Scientific, San Jose, CA) coupled to an Dionex Ultimate 3000RSLC nano system (ThermoFisher Scientific, San Jose, CA) via nanoflex source interface. Tryptic peptides were loaded onto a trap column (Pepmap 100 5µm, 5 × 0.3 mm, ThermoFisher Scientific, San Jose, CA) at a flow rate of 10 µL/min using 2% ACN and 0.1% TFA as loading buffer. After loading, the trap column was switched in-line with a 30 cm, 75 µm inner diameter analytical column (packed in-house with ReproSil-Pur 120 C18-AQ, 3 µm, Dr. Maisch, Ammerbuch-Entringen, Germany). Mobile-phase A consisted of 0.4% formic acid in water and mobile-phase B of 0.4% formic acid in a mix of 90% acetonitrile and 10% water. The flow rate was set to 230 nL/min and a 90 min gradient used (6 to 30% solvent B within 81 min, 30 to 65% solvent B within 8 min and, 65 to 100% solvent B within 1 min, 100% solvent B for 6 min before equilibrating at 6% solvent B for 18 min). Analysis was performed in a data-dependent acquisition mode. Full MS scans were acquired with a mass range of 375 – 1650 m/z in the orbitrap at a resolution of 120,000 (at 200Th). Automatic gain control (AGC) was set to a target of 2 × 10⁵ and a maximum injection time of 50 ms. Precursor ions for MS2 analysis were selected using a TopN dependant scan approach with a cycle time of 3 seconds. MS2 spectra were acquired in the orbitrap (FT) using a quadrupole isolation window of 1 Da and higher energy collision induced dissociation (HCD) at a normalized collision energy (NCE) of 38%. AGC target was set to 5 × 10⁴ with a maximum injection time of 150 ms and MS2 scans acquired at a resolution of 15,000 (at 200 Th). Dynamic exclusion for selected ions was 60 s. A single lock mass at m/z 445.120024 was employed . Xcalibur version 4.0.0 and Tune 2.1 were used to operate the instrument.
RNA sequencing
3×10⁶ MV4–11 cells per well were seeded in triplicate in a 12-well plate and treated with 200 nM BSJ-03–123, YKL-06–102, Palbociclib or vehicle for 6 h. Cells were lysed using QIAshredder columns (QIAGEN) and RNA isolated using RNeasy kit (QIAGEN) according to manufacturer’s instructions.
The amount of total RNA was quantified using the Qubit Fluorometric Quantitation system (Life Technologies) and the RNA integrity number (RIN) was determined using the Experion Auto-mated Electrophoresis System (Bio-Rad). RNA-seq libraries were prepared with the TruSeq Stranded mRNA LT sample preparation kit (Illumina) using both, Sciclone and Zephyr liquid handling robotics (PerkinElmer). Library concentrations were quantified with the Qubit Fluorometric Quantitation system (Life Technologies) and the size distribution was assessed using the Experion Automated Electrophoresis System (Bio-Rad). For sequencing, samples were diluted and pooled into NGS libraries in equimolar amounts. Expression profiling libraries were sequenced on Illumina HiSeq 3000/4000 instruments in 50-base-pair-single-end mode and base calls provided by the Illumina Real-Time Analysis (RTA) soft-ware were subsequently converted into BAM format (Illumina2bam) before de-multiplexing (BamIndexDecoder) into individual, sample-specific BAM files via Illumina2bam tools (1.17.3).
Chemical Synthesis of BSJ-03–123,BSJ-03–190/BSJ-bump, YKL-06–102
Synthesis of 6a and 6b
2-((2-(2,6-dioxopiperidin-3-yl)-1,3-dioxoisoindolin-4-yl)oxy)acetic acid (6a).
6a was prepared according to the literature (Remillard et al., 2017). 3-Hydroxyphthalic anhydride (1) (1.64 g, 10 mmol) and 3-aminopiperidine-2,6-dione hydrochloride (2a) (1.65 g, 10 mmol) were dissolved in pyridine (40 mL, 0.25 M) and heated to 110°C. After 14h, the mixture was cooled to room temperature and concentrated under reduced pressure. The residue was purification by column chromatography on silica gel (0–10% MeOH/DCM) to give 2-(2,6-dioxopiperidin-3-yl)-4-hydroxyisoindoline-1,3-dione (3a) as a grey solid (2.41 g, 88%). LC-MS: m/z 275 [M+1]. To a solution of 3a (2.19 g, 8 mmol) in 8 mL of DMF was added K2CO3 (1.66 g, 12 mmol) and t-butyl bromoacetate (4) (1.18 mL, 8 mmol) respectively. The mixture was stirred at room temperature for 2h, then diluted with EtOAc and washed once with water then twice with brine. The organic layer was dried over anhydrous sodium sulfate, filtered and concentrated under reduced pressure. The residue was purification by column chromatography on silica gel (5–100%EtOAc/hexanes) to give tert-butyl 2-((2-(2,6-dioxopiperidin-3-yl)-1,3-dioxoisoindolin-4-yl)oxy)acetate (5a) as a cream colored solid (2.70 g, 87%). LC-MS: m/z 389 [M+1]. 5a (2.06g, 5.3 mmol) was then dissolved in TFA (53 mL, 0.1M) at room temperature. After 4 hours, the solution was diluted with DCM and concentrated under reduced pressure to give 6a as a cream colored solid (1.5 g, 85%) was deemed sufficiently pure and carried onto the next step without further purification. LC-MS: m/z 333 [M+1]. 1H NMR (500 MHz, DMSO-d6) δ 11.09 (s, 1H), 7.79 (dd, J = 8.4, 7.4 Hz, 1H), 7.48 (d, J =7.4 Hz, 1H), 7.39 (d, J = 8.6 Hz, 1H), 5.10 (dd, J = 12.8, 5.4 Hz, 1H), 4.99 (s, 2H), 2.93–2.89 (m, 1H), 2.63–2.51 (m, 2H), 2.11–2.03 (m, 1H).
2-((2-(1-methyl-2,6-dioxopiperidin-3-yl)-1,3-dioxoisoindolin-4-yl)oxy)acetic acid (6b).
6b was synthesized with similar procedures as 6a from 3-Hydroxyphthalic anhydride (1) (328 mg, 2 mmol), 3-amino-1-methylpiperidine-2,6-dione (2b) (357 mg, 2 mmol) and t-butyl bromoacetate (4) (0.295 mL, 2 mmol). 6b was obtained as an off-white solid (451 mg, 65% yield in 3 steps). LC-MS: m/z 347 [M+1]. 1H NMR (500 MHz, DMSO-d6) δ 13.24 (s, 1H), 7.80 (dd, J = 8.5, 7.3 Hz, 1H), 7.48 (d, J = 7.3 Hz, 1H), 7.40 (d, J = 8.5 Hz, 1H), 5.17 (dd, J = 13.0, 5.4 Hz, 1H), 4.99 (s, 2H), 3.02 (s, 3H), 2.99–2.91 (m, 1H), 2.80–2.73 (m, 1H), 2.59–2.52 (m, 1H), 2.09–2.02 (m, 1H). 13C NMR (125 MHz, DMSO) δ 172.24, 170.14, 169.95, 167.17, 165.62, 155.61, 137.26, 133.70, 120.36, 116.76, 116.24, 65.46, 49.82, 31.56, 27.07, 21.65.
Synthesis of BSJ-03–123 and BSJ-03–190/BSJ-bump
tert-butyl (2-(2-(2-(2-(4-(6-((6-acetyl-8-cyclopentyl-5-methyl-7-oxo-7,8-dihydropyrido[2,3-d]pyrimidin-2-yl)amino)pyridin-3-yl)piperazin-1-yl)ethoxy)ethoxy)ethoxy)ethyl)carbamate (9)
To a suspension of Palbociclib (7) (100 mg, 0.22 mmol) in DMSO (5 mL) was added tert-butyl (2-(2-(2-(2-bromoethoxy)ethoxy)ethoxy)ethyl)carbamate (8) (156 mg, 0.44 mmol) and DIPEA (0.115 mL, 0.66 mmol). The mixture was heated to 80°C and kept stirring fo r 48h. The mixture was then cooled down to room temperature, extracted, dried, filtered and concentrated. The residue was purified by reverse phase HPLC (5–95% MeOH in H2O) to give 9 (TFA salt) as a yellow solid (103mg, 65%). LC-MS: m/z 723 [M+1]. 1H NMR (500 MHz, DMSO-d6) δ 10.34 (s, 1H), 8.97 (s, 1H), 8.12 (d, J = 3.0 Hz, 1H), 7.90 (d, J = 9.1 Hz, 1H), 7.64–7.58 (m, 1H), 6.81–6.74 (m, 1H), 5.89–5.78 (m, 1H), 3.93–3.75 (m, 4H), 3.67–3.60 (m, 4H), 3.59–3.55 (m, 2H), 3.55–3.46 (m, 4H), 3.44–3.35 (m, 4H), 3.27 (br, 2H), 3.15–3.01 (m, 4H), 2.42 (s, 3H), 2.32 (s, 3H), 2.28–2.19 (m, 2H), 1.95–1.84 (m, 2H), 1.83–1.71 (m, 2H), 1.64–1.52 (m, 2H), 1.36 (s, 9H). 13C NMR (126 MHz, DMSO) δ 202.38, 160.69, 158.32, 158.08, 157.98, 155.59, 154.77, 145.07, 141.96, 141.83, 134.97, 129.58, 126.24, 115.21, 106.93, 77.61, 69.67, 69.60, 69.52, 69.47, 69.17, 64.24, 54.85, 52.96, 50.95, 45.48, 31.29, 28.21, 27.57, 25.14, 13.65.
N-(2-(2-(2-(2-(4-(6-((6-acetyl-8-cyclopentyl-5-methyl-7-oxo-7,8-dihydropyrido[2,3-d]pyrimidin-2-yl)amino)pyridin-3-yl)piperazin-1-yl)ethoxy)ethoxy)ethoxy)ethyl)-2-((2-(2,6-dioxopiperidin-3-yl)-1,3-dioxoisoindolin-4-yl)oxy)acetamide (10a)
To a solution of the 9 (30.5 mg, 0.0422 mmol) in DCM (2 mL) was added TFA (1 mL) and the resulting solution was stirred at room temperature for 1h. The mixture was concentrated and the residue was then dissolved in DMF (1 mL) followed by adding 6a (14mg, 0.0422 mmol), HATU (33 mg, 0.0844 mmol) and DIPEA (37 µL, 0.211 mmol). The resulting mixture was stirred for 1h at room temperature, then evaporated the solvent and purified by reverse phase HPLC (5–95% MeOH in H2O) to give 10a (TFA salt) as a yellow solid (34.4 mg, 87%). LC-MS: m/z 937 [M+1]. 1H NMR (500 MHz, DMSO-d6) δ 11.2 (s, 1H, NH), 9.03 (s, 1H, AR-H), 8.09 (dt, J = 10.6, 3.1 Hz, 2H, AR-H), 7.87 (t, J = 8.5 Hz, 1H, AR-H), 7.79 (dd, J = 8.5, 7.3 Hz, 1H, AR-H), 7.47 (d, J = 7.2 Hz, 1H, AR-H), 7.40 (d, J = 8.5 Hz, 1H, AR-H), 5.89–5.80 (m, 1H, N-CH), 5.11 (dd, J = 12.8, 5.5 Hz, 1H, N-CH), 4.80 (s, 2H, CO-CH2-O), 3.95–3.82 (m, 4H, 2xO-CH2), 3.75–3.55 (m, 8H, 4xO-CH2), 3.54–3.52 (m, 2H, N-CH2), 3.51–3.45 (m, 2H, N-CH2), 3.42–3.19 (m, 8H, 4xN-CH2), 3.02–2.98 (br, 1H, H’N-C-CH2), 2.65–2.52 (m, 2H, CO-CH2), 2.44 (s, 3H, CO-CH3), 2.35 (s, 3H, AR-CH3), 2.28–2.12 (m, 2H, C-CH2), 2.05 (ddt, J = 15.2, 7.8, 2.8 Hz, 1H, H’N-C-CH2), 1.98–1.85 (m, 2H, C-CH2), 1.82–1.74 (m, 2H, C-CH2), 1.64–1.53 (m, 2H, C-CH2).13C NMR (126 MHz, DMSO) δ 202.43, 172.82, 169.90, 166.97, 166.72, 165.51, 160.70, 158.33, 158.23, 157.98, 154.92, 154.82, 144.95, 141.95, 141.83, 136.98, 133.03, 129.77, 126.77, 120.40, 116.78, 116.14, 115.35, 107.13, 69.71, 69.65, 69.63, 69.52, 68.83, 67.57, 64.19, 54.90, 53.00, 50.96, 48.85, 45.48, 38.40, 31.32, 30.98, 27.61, 25.19, 22.02, 13.70.
N-(2-(2-(2-(2-(4-(6-((6-acetyl-8-cyclopentyl-5-methyl-7-oxo-7,8-dihydropyrido[2,3-d]pyrimidin-2-yl)amino)pyridin-3-yl)piperazin-1-yl)ethoxy)ethoxy)ethoxy)ethyl)-2-((2-(1-methyl-2,6-dioxopiperidin-3-yl)-1,3-dioxoisoindolin-4-yl)oxy)acetamide (10b)
10b was synthesized with similar procedures as 10a from 9 (30.5 mg, 0.0422 mmol) and 6b (14.6mg, 0.0422 mmol). 10b was obtained as a yellow solid (33.7 mg, 84%). LC-MS: m/z 951 [M+1]. 1H NMR (500 MHz, DMSO-d6) δ 9.75 (br, 1H, NH), 8.97 (s, 1H, AR-H), 8.10 (d, J = 3.1 Hz, 1H, AR-H), 8.03–7.93 (m, 1H, AR-H), 7.87 (d, J = 9.1 Hz, 1H, AR-H), 7.85–7.76 (m, 1H, AR-H), 7.64 (dd, J = 9.2, 3.2 Hz, 1H, AR-H), 7.50 (d, J = 7.3 Hz, 1H, AR-H), 7.40 (d, J = 8.5 Hz, 1H, HAR), 5.87–5.76 (m, 1H, N-CH), 5.21–5.10 (m, 1H, N-CH), 4.79 (s, 2H, CO-CH2-O), 3.91–3.82 (m, 2H, O-CH2), 3.81–3.77 (m, 2H, O-CH2), 3.65–3.59 (m, 2H, O-CH2), 3.58–3.55 (m, 2H, O-CH2), 3.54 (br, 4H, 2xO-CH2), 3.47 (t, J = 5.8 Hz, 2H, N-CH2), 3.43–3.36 (m, 2H, N-CH2), 3.35–3.30 (m, 2H, N-CH2), 3.30–3.18 (m, 2H, N-CH2), 3.13–3.04 (m, 2H, N-CH2), 3.02 (s, 3H, N-CH3), 2.99–2.91 (m, 2H, N-CH2), 2.80–2.74 (m, 2H, CO-CH2), 2.74–2.70 (m, 1H, H’N-C-CH2), 2.43 (s, 3H, CO-CH3), 2.32 (s, 3H, Ar-CH3), 2.29–2.16 (m, 2H, C-CH2), 2.06 (dtd, J = 13.0, 5.5, 2.4 Hz, 1H, H’N-C-CH2), 1.95–1.84 (m, 2H, C-CH2), 1.83–1.72 (m, 2H, C-CH2), 1.65–1.51 (m, 2H, C-CH2).13C NMR (126 MHz, DMSO) δ 202.37, 171.75, 169.62, 166.93, 166.67, 165.47, 160.67, 158.32, 158.20, 158.03, 157.95, 154.95, 154.79, 144.90, 141.92, 141.79, 136.98, 133.00, 129.75, 126.78, 120.40, 116.73, 116.12, 115.34, 107.12, 69.68, 69.61, 69.49, 68.81, 67.55, 64.17, 54.86, 52.97, 50.92, 49.38, 45.45, 38.37, 31.30, 31.09, 27.59, 26.61, 25.16, 21.21, 13.68.
Synthesis of YKL-06–102
tert-butyl 2-(4-(6-((6-acetyl-8-cyclopentyl-5-methyl-7-oxo-7,8-dihydropyrido[2,3-d]pyrimidin-2-yl)amino)pyridin-3-yl)piperazin-1-yl)acetate (11)
To a suspension of Palbociclib (7) (100 mg, 0.22 mmol) in DMSO (5 mL) were added t-butyl bromoacetate (4) (65 µL, 0.44 mmol) and DIPEA (0.115 mL, 0.66 mmol). The mixture was heated to 80°C and kept stirring for 24h. The mixture was then cooled down to room temperature, extracted, dried, filtered and concentrated. The residue was purified by reverse phase HPLC (5–95% MeOH in H2O) to give 11 (TFA salt) as a yellow solid (90 mg, 73%). LC-MS: m/z 562 [M+1]. 1H NMR (500 MHz, DMSO-d6) δ 10.09 (s, 1H), 8.95 (s, 1H), 8.05 (d, J = 3.0 Hz, 1H), 7.85 (d, J = 9.0 Hz, 1H), 7.49–7.43 (m, 1H), 5.88–5.75 (m, 1H), 3.20–3.13 (m, 6H), 2.67 (t, J = 4.9 Hz, 4H), 2.42 (s, 3H), 2.31 (s, 3H), 2.27–2.18 (m, 2H), 1.89 (br, 2H), 1.82–1.73 (m, 2H), 1.65–1.52 (m, 2H), 1.43 (s, 9H). 13C NMR (126 MHz, DMSO) δ 202.91, 169.67, 161.22, 159.04, 158.74, 155.22, 144.77, 143.88, 142.55, 135.89, 125.21, 115.60, 107.02, 100.00, 80.72, 59.66, 53.36, 52.12, 48.78, 31.78, 28.29, 28.02, 25.58, 14.10.
2-(4-(6-((6-acetyl-8-cyclopentyl-5-methyl-7-oxo-7,8-dihydropyrido[2,3-d]pyrimidin-2-yl)amino)pyridin-3-yl)piperazin-1-yl)-N-(2-(2-(2-(2-((2-(2,6-dioxopiperidin-3-yl)-1,3-dioxoisoindolin-4-yl)amino)ethoxy)ethoxy)ethoxy)ethyl)acetamide (14)
To a solution of the 11 (23.7 mg, 0.0422 mmol) in DCM (2 mL) was added TFA (1 mL) and the resulting solution was stirred for 1h at room temperature. The mixture was concentrated to give 12 which was used directly for the next step without further purification. 13 (23.1 mg, 0.0422 mmol), which was synthesized as previously described(Olson et al., 2017), was also dissolved in DCM (2 mL), TFA (1 mL) was added and the mixture was kept stirring for 1h at room temperature. Then the solvent was evaporated and the residue was re-dissolved in DMF (2mL). To the DMF solution were added 12, HATU (33 mg, 0.0844 mmol) and DIPEA (37 µL, 0.211 mmol). The resulting mixture was stirred for 1h at room temperature, then evaporated the solvent and purified by reverse phase HPLC (5–95% MeOH in H2O) to give 14 (TFA salt) as a yellow solid (34.4 mg, 77%). LC-MS: m/z 936 [M+1]. 1H NMR (500 MHz, DMSO-d6) δ 9.05 (s, 1H, AR-H), 8.90 (t, J = 5.6 Hz, 1H, NH), 8.19 (dd, J = 9.6, 2.8 Hz, 1H, AR-H), 8.12 (d, J = 2.9 Hz, 1H, AR-H), 7.93 (d, J = 9.4 Hz, 1H, AR-H), 7.57 (dd, J = 8.6, 7.1 Hz, 1H, AR-H), 7.13 (d, J = 8.6 Hz, 1H, AR-H), 7.02 (d, J = 7.0 Hz, 1H, AR-H), 5.90–5.75 (m, 1H, N-CH), 5.05 (dd, J = 12.8, 5.4 Hz, 1H, N-CH), 4.05 (s, 2H, CO-CH2-N), 3.73–3.59 (m, 4H, 2xO-CH2), 3.59–3.54 (m, 4H, 2xO-CH2), 3.53–3.50 (m, 4H, 2xO-CH2), 3.49–3.43 (m, 6H, 3xN-CH2), 3.43–3.25 (m, 6H, 3xN-CH2), 2.94–2.84 (m, 1H, H’N-C-CH2), 2.63–2.51 (m, 2H, CO-CH2), 2.44 (s, 3H, CO-CH3), 2.35 (s, 3H, AR-CH3), 2.28–2.15 (m, 2H, C-CH2), 2.08–2.00 (m, 1H, H’N-C-CH2), 1.99–1.91 (m, 2H, C-CH2), 1.86–1.75 (m, 2H, C-CH2), 1.65–1.53 (m, 2H, C-CH2). 13C NMR (126 MHz, DMSO) δ 202.22, 172.82, 170.07, 168.94, 167.27, 163.93, 160.54, 157.29, 157.19, 154.95, 146.39, 143.30, 141.74, 141.59, 136.25, 132.07, 130.81, 117.46, 116.43, 110.71, 109.23, 108.31, 72.16, 70.52, 69.81, 69.77, 69.60, 68.89, 68.71, 60.18, 55.90, 53.12, 50.89, 48.57, 44.97, 43.62, 41.71, 31.27, 30.99, 27.68, 25.27, 22.16, 13.79.
Quantification and statistical analysis
Statistical parameters are reported in the figure legends of the paper.
Expression Proteomics BSJ-03–123
Acquired raw data files were processed using the Proteome Discoverer 2.2.0. platform, utilizing the Sequest HT database search engine and Percolator validation software node (V3.04) to remove false positives with a false discovery rate (FDR) of 1% on peptide and protein level under strict conditions. Searches were performed with full tryptic digestion against the human SwissProt database v2017.06 with up to two miscleavage sites. Oxidation (+15.9949 Da) of methionine was set as variable modification, whilst carbamidomethylation (+57.0214 Da) of cysteine residues and TMT 6-plex labelling of peptide N-termini and lysine residues were set as fixed modifications. Data was searched with mass tolerances of ±10 ppm and 0.6 Da on the precursor and fragment ions (CID), respectively. Results were filtered to include peptide spectrum matches (PSMs) with Sequest HT cross-correlation factor (Xcorr) scores of ≥1 and high peptide confidence. PSMs with precursor isolation interference values of ≥ 50% and average TMT-reporter ion signal-to-noise values (S/N) ≤ 10 were excluded from quantitation. Isotopic impurity correction and TMT channel-normalization based on total peptide amount were applied. For statistical analysis and p-value calculation, the integrated ANOVA hypothesis test was used. TMT ratios with p-values below 0.01 were considered as significant.
Expression proteomics YKL-06–102
Proteome Discoverer 2.1 (Thermo Fisher Scientific) was used for .RAW file processing and controlling peptide and protein level false discovery rates, assembling proteins from peptides, and protein quantification from peptides. MS/MS spectra were searched against a Uniprot human database (September 2016) with both the forward and reverse sequences. Database search criteria are as follows: tryptic with two missed cleavages, a precursor mass tolerance of 20 ppm, fragment ion mass tolerance of 0.6 Da, static alkylation of cysteine (57.02146 Da), static TMT labelling of lysine residues and N-termini of peptides (229.16293 Da), and variable oxidation of methionine (15.99491 Da). TMT reporter ion intensities were measured using a 0.003 Da window around the theoretical m/z for each reporter ion in the MS3 scan. Peptide spectral matches with poor quality MS3 spectra were excluded from quantitation (summed signal-to-noise across 10 channels < 200 and precursor isolation specificity < 0.5), and resulting data was filtered to only include proteins that had a minimum of 3 unique peptides identified. Reporter ion intensities were normalised and scaled using in-house scripts in the R framework. Statistical analysis was carried out using the limma package within the R framework
Phosphoproteomics
Acquired raw data files were processed using the Proteome Discoverer 2.2.0. platform, utilising the Sequest HT database search engine and Percolator validation software node (V3.04) to remove false positives with a false discovery rate (FDR) of 1% on peptide and protein level under strict conditions. Searches were performed with full tryptic digestion against the human SwissProt database v2017.12 with up to two miscleavage sites. Oxidation (+15.9949 Da) of methionine and phosphorylation (+79.9663 Da) of serine, threonine and tyrosine was set as variable modification, whilst carbamidomethylation (+57.0214 Da) of cysteine residues and TMT 10-plex labelling of peptide N-termini and lysine residues were set as fixed modifications. Data was searched with mass tolerances of ±10 ppm and 0.025 Da on the precursor and fragment ions (HCD), respectively. Results were filtered to include peptide spectrum matches (PSMs) with Sequest HT cross-correlation factor (Xcorr) scores of ≥1 and high peptide confidence. The ptmRS algorithm was additionally used to validate phospopeptides with a set score cutoff of 90. PSMs with precursor isolation interference values of ≥ 50% and average TMT-reporter ion signal-to-noise values (S/N) ≤ 10 were excluded from quantitation. Isotopic impurity correction and TMT channel-normalization based on total peptide amount were applied. For statistical analysis and p-value calculation, the integrated ANOVA hypothesis test was used. TMT ratios with p-values below 0.01 were considered as significant.
Hits identified via global phosphoproteomics (log2 fold change > 0.5 or < −0.5, FDR adj. p-value < 0.05) were mapped on a protein-protein interaction network using the networkx python package. The protein-protein interaction network was queried from the Human Integrated Protein-Protein Interaction rEference (HIPPIE)(Alanis-Lobato et al., 2017). Interactions without PubMed IDs were removed. The resulting subgraph was expanded to include first order neighbors limited to transcriptional regulators for which ENCODE genome localization data was available and visualized using Cytoscape. Kinase substrate prediction was performed with KSEA App (https://casecpb.shinyapps.io/ksea).
RNA sequencing
NGS reads were trimmed based on quality and adapter sequence content with Trimmomatic in single-end (ILLUMINACLIP:TruSeq3-SE.fa:2:30:10:1:true, SLIDINGWINDOW:4:15, MINLEN:20) mode. The resulting reads were aligned with the “Spliced Transcripts Alignment to a Reference” (STAR) aligner to the hg38 reference genome assembly provided by the UCSC Genome Browser resembling the Genome Reference Consortium GRCh38 assembly . Ensembl transcript annotation from version e87 (December 2016) served as reference transcriptome. Reads were counted using htseq-count. Differential expression analysis was performed on quantile-normalized read counts using the voom-limma R package. Following thresholds were applied for hit calling: fold change > 1.5 or < −1.5, FDR adj. p-value < 0.05. GO-term enrichment analysis was performed using GOrilla. For the network visualization of enriched GO-terms, parent-child relationships of terms were extracted from the go-basic.obo ontology and the network assembled using the python networkx package.
Supplementary Material
KEY RESOURCES TABLE.
| REAGENT or RESOURCE | SOURCE | IDENTIFIER |
|---|---|---|
| Antibodies | ||
| CDK4 | Cell Signaling | Cat#12790, RRID:AB_2631166 |
| CDK6 | Santa Cruz | Cat#sc-7961, RRID:AB_627242 |
| Histone 3 | Abcam | Cat#ab1791, RRID:AB_302613 |
| β-actin | Sigma-Aldrich | Cat#A5441, RRID:AB_476744 |
| p-Rb S780 | Cell Signaling | Cat#8180, RRID:AB_10950972 |
| Rb | Cell Signaling | Cat#9309, RRID:AB_823629 |
| Peroxidase-conjugated AffiniPure Goat Anti-Mouse IgG | Jackson Immuno Research | Cat#115–035-003, RRID:AB_10015289 |
| Peroxidase-conjugated AffiniPure Goat Anti-Rabbit IgG | Jackson Immuno Research | Cat#111–035-003, RRID:AB_2313567 |
| Chemicals, Peptides, and Recombinant Proteins | ||
| BSJ-03–123 | This study | N/A |
| BSJ-bump | This study | N/A |
| YKL-06–102 | This study | N/A |
| Palbociclib | Selleckchem | Cat#S1116 |
| Critical Commercial Assays | ||
| Caspase-Glo 3/7 | Promega | Cat#G8090 |
| NanoBiT | Promega | Cat#N2011 |
| Deposited Data | ||
| Project Achilles: CRISPR-Cas9 Avana | Meyers et al., 2017 | https://portals.broadinstitute.org/achilles/datasets/18/download |
| Gene expression data of 675 cell lines | Klijn et al., 2015 | https://www.nature.com/articles/nbt.3080#supplementary-information |
| ENCODE transcription factor targets | ENCODE Consortium | http://amp.pharm.mssm.edu/Harmonizome/dataset/ENCODE+Transcription+Factor+Targets |
| Human protein-protein interaction network | Alanis-Lobato et al., 2016 | http://cbdm-01.zdv.uni-mainz.de/~mschaefer/hippie/ |
| Human reference genome NCBI build 38, GRCh38 | http://hgdownload.cse.ucsc.edu/goldenPath/hg38/bigZips/ | |
| RNA sequencing upon CDK6 degradation | This study | GEO: GSE116187 |
| CDK4/6 targets | Anders et al., 2011 | https://doi.org/10.1016/j.ccr.2011.10.001 |
| Experimental Models: Cell Lines | ||
| MV4–11 | ATCC | RRID:CVCL_0064 |
| THP-1 | ATCC | RRID:CVCL_0006 |
| MOLM13 | DMSZ | RRID:CVCL_2119 |
| P31/FUJ | CCLE/Broad Institute | RRID:CVCL_1632 |
| MOLT4 | ATCC | RRID:CVCL_0013 |
| NCI-H358 | ATCC | RRID:CVCL_1559 |
| HT29 | ATCC | RRID:CVCL_0320 |
| HEK293T | ATCC | RRID:CVCL_0063 |
| Hs578T | ATCC | RRID:CVCL_0332 |
| Oligonucleotides | ||
| sgCDK4 sense (5’- CACCGAGCCACTGGCTCATATCGAG-3’) | Sigma-Aldrich | N/A |
| sgCDK4 antisense (5’- AAACCTCGATATGAGCCAGTGGCTC-3’) | Sigma-Aldrich | N/A |
| sgCRBN sense (5’- CACCGTAAACAGACATGGCCGGCGA-3’) | Sigma-Aldrich | N/A |
| sgCRBN antisense (5’- AAACTCGCCGGCCATGTCTGTTTAC-3’) | Sigma-Aldrich | N/A |
| Recombinant DNA | ||
| Lenti_sgRNA_EFS_GFP | Addgene | https://www.addgene.org/65656 |
| pBit1.1-C [TK/LgBiT] | Promega | Cat#N2014 |
| pBit2.1-N [TK/SmBiT] | Promega | Cat#N2014 |
| Software and Algorithms | ||
| Cytoscape | Institute for Systems Biology | http://cytoscape.org;RRID:SCR_003032 |
| GraphPad Prism | https://www.graphpad.com/scientific-software/prism/ | |
| Proteome Discoverer | Thermo Fisher Scientific | https://www.thermofisher.com/order/catalog/product/OPTON-30795 |
| KSEA App | https://casecpb.shinyapps.io/ksea | |
| STAR Aligner | https://github.com/alexdobin/STAR | |
| limma | https://bioconductor.org/packages/release/bioc/html/limma.html | |
| GOrilla | http://cbl-gorilla.cs.technion.ac.il/ | |
| networkx | https://networkx.github.io/ | |
Significance.
Traditionally, drug discovery efforts focus on the development of small-molecule inhibitors that block accessible hydrophobic pockets such as substrate-or cofactor binding sites. However, due to the often high sequence conservation of these pockets, the design of selective inhibitors remains a continuous challenge. Here, we report a degrader that exploits structural differences outside of the ligand binding pocket to induce differential E3 ligase recruitment and ensuing degradation of CDK6, but not CDK4. We employed this exquisitely selective probe to dissect CDK6-dependent signaling and gene expression in AML, and showed that it allows unprecedented exploitation of genetically defined dependencies. This work showcases a framework for engineering selectivity into small-molecule probes and paves the way for the development of tools to functionally understand proteins at high kinetic resolution.
Highlights.
Development of a CDK6-selective small molecule degrader
Mechanistically understood selectivity via differential ternary complex formation
Profiling of consequences of CDK6 degradation on signaling and gene regulation
Precise exploitation of genetic dependencies through homolog-selective degradation
Acknowledgements
We thank all members of the Gray and Winter labs. CeMM and the Winter lab are supported by the Austrian Academy of Sciences. This work was supported by an FWF grant to G.E.W. (Project Number FWF30271), and a Damon Runyon Cancer Research Fellowship DRG-2270–16 (E.S.W.). The Gray lab is supported by NIH grant CA154303–06, the Fischer lab by NIH NCI R01 CA214608–02. E.S.F. is a Damon Runyon-Rachleff Innovator supported in part by the Damon Runyon Cancer Research Foundation (DRR-50–18).
Footnotes
Publisher's Disclaimer: This is a PDF file of an unedited manuscript that has been accepted for publication. As a service to our customers we are providing this early version of the manuscript. The manuscript will undergo copyediting, typesetting, and review of the resulting proof before it is published in its final citable form. Please note that during the production process errors may be discovered which could affect the content, and all legal disclaimers that apply to the journal pertain.
Declaration of interests
E.S.F. is a member of the scientific advisory board of C4 Therapeutics and is a consultant to Novartis Pharmaceuticals. E.S.F. receives research funding from Novartis Pharmaceuticals and Astellas Pharma not related to this work. N.S.G. is equity holder and scientific advisor for Syros, Gatekeeper, Soltego, C4, Petra and Aduro companies. N.S.G., B.J., T.Z., N.K., B.N., and E.S.F. are inventors on a patent covering CDK6 degraders owned by Dana Farber.
Data and software availability
The RNA sequencing data has been deposited in the Gene Expression Omnibus (GEO) under the ID code GSE116187.
References
- Alanis-Lobato G, Andrade-Navarro MA, and Schaefer MH (2017). HIPPIE v2.0: enhancing meaningfulness and reliability of protein-protein interaction networks. Nucleic acids research 45, D408–d414. [DOI] [PMC free article] [PubMed] [Google Scholar]
- An J, Ponthier CM, Sack R, Seebacher J, Stadler MB, Donovan KA, and Fischer ES (2017). pSILAC mass spectrometry reveals ZFP91 as IMiD-dependent substrate of the CRL4(CRBN) ubiquitin ligase. Nature communications 8, 15398. [DOI] [PMC free article] [PubMed] [Google Scholar]
- Anders L, Ke N, Hydbring P, Choi YJ, Widlund HR, Chick JM, Zhai H, Vidal M, Gygi SP, Braun P, et al. (2011). A systematic screen for CDK4/6 substrates links FOXM1 phosphorylation to senescence suppression in cancer cells. Cancer Cell 20, 620–634. [DOI] [PMC free article] [PubMed] [Google Scholar]
- Bondeson DP, Smith BE, Burslem GM, Buhimschi AD, Hines J, Jaime-Figueroa S, Wang J, Hamman BD, Ishchenko A, and Crews CM (2017). Lessons in PROTAC Design from Selective Degradation with a Promiscuous Warhead. Cell chemical biology [DOI] [PMC free article] [PubMed]
- Casado P, Rodriguez-Prados JC, Cosulich SC, Guichard S, Vanhaesebroeck B, Joel S, and Cutillas PR. (2013). Kinase-substrate enrichment analysis provides insights into the heterogeneity of signaling pathway activation in leukemia cells. Science signaling 6, rs6. [DOI] [PubMed] [Google Scholar]
- Chen P, Lee NV, Hu W, Xu M, Ferre RA, Lam H, Bergqvist S, Solowiej J, Diehl W, He YA, et al. (2016). Spectrum and Degree of CDK Drug Interactions Predicts Clinical Performance. Molecular cancer therapeutics 15, 2273–2281. [DOI] [PubMed] [Google Scholar]
- Fry DW, Harvey PJ, Keller PR, Elliott WL, Meade M, Trachet E, Albassam M, Zheng X, Leopold WR, Pryer NK, et al. (2004). Specific inhibition of cyclin-dependent kinase 4/6 by PD 0332991 and associated antitumor activity in human tumor xenografts. Molecular cancer therapeutics 3, 1427–1438. [PubMed] [Google Scholar]
- Gadd MS, Testa A, Lucas X, Chan KH, Chen W, Lamont DJ, Zengerle M, and Ciulli A (2017). Structural basis of PROTAC cooperative recognition for selective protein degradation. Nat Chem Biol 13, 514–521. [DOI] [PMC free article] [PubMed] [Google Scholar]
- Gandhi AK, Kang J, Havens CG, Conklin T, Ning Y, Wu L, Ito T, Ando H, Waldman MF, Thakurta A, et al. (2014). Immunomodulatory agents lenalidomide and pomalidomide co-stimulate T cells by inducing degradation of T cell repressors Ikaros and Aiolos via modulation of the E3 ubiquitin ligase complex CRL4(CRBN.). British journal of haematology 164, 811–821. [DOI] [PMC free article] [PubMed] [Google Scholar]
- Huang HT, Dobrovolsky D, Paulk J, Yang G, Weisberg EL, Doctor ZM, Buckley DL, Cho JH, Ko E, Jang J, et al. (2017). A Chemoproteomic Approach to Query the Degradable Kinome Using a Multi-kinase Degrader. Cell chemical biology [DOI] [PMC free article] [PubMed]
- Klijn C, Durinck S, Stawiski EW, Haverty PM, Jiang Z, Liu H, Degenhardt J, Mayba O, Gnad F, Liu J, et al. (2015). A comprehensive transcriptional portrait of human cancer cell lines. Nat Biotechnol 33, 306–312. [DOI] [PubMed] [Google Scholar]
- Kollmann K, Heller G, Schneckenleithner C, Warsch W, Scheicher R, Ott RG, Schafer M, Fajmann S, Schlederer M, Schiefer AI, et al. (2013). A kinase-independent function of CDK6 links the cell cycle to tumor angiogenesis. Cancer Cell 24, 167–181. [DOI] [PMC free article] [PubMed] [Google Scholar]
- Kronke J, Udeshi ND, Narla A, Grauman P, Hurst SN, McConkey M, Svinkina T, Heckl D, Comer E, Li X, et al. (2014). Lenalidomide causes selective degradation of IKZF1 and IKZF3 in multiple myeloma cells. Science 343, 301–305. [DOI] [PMC free article] [PubMed] [Google Scholar]
- Lu G, Middleton RE, Sun H, Naniong M, Ott CJ, Mitsiades CS, Wong KK, Bradner JE, and Kaelin WG Jr. (2014). The myeloma drug lenalidomide promotes the cereblon-dependent destruction of Ikaros proteins. Science 343, 305–309. [DOI] [PMC free article] [PubMed] [Google Scholar]
- Lu J, Qian Y, Altieri M, Dong H, Wang J, Raina K, Hines J, Winkler JD, Crew AP, Coleman K, et al. (2015). Hijacking the E3 Ubiquitin Ligase Cereblon to Efficiently Target BRD4. Chemistry & biology 22, 755–763. [DOI] [PMC free article] [PubMed] [Google Scholar]
- Meyers RM, Bryan JG, McFarland JM, Weir BA, Sizemore AE, Xu H, Dharia NV, Montgomery PG, Cowley GS, Pantel S, et al. (2017). Computational correction of copy number effect improves specificity of CRISPR-Cas9 essentiality screens in cancer cells. Nat Genet 49, 1779–1784. [DOI] [PMC free article] [PubMed] [Google Scholar]
- Nowak RP, DeAngelo SL, Buckley D, He Z, Donovan KA, An J, Safaee N, Jedrychowski MP, Ponthier CM, Ishoey M, et al. (2018). Plasticity in binding confers selectivity in ligand-induced protein degradation. Nat Chem Biol [DOI] [PMC free article] [PubMed]
- O’Leary B, Finn RS, and Turner NC (2016). Treating cancer with selective CDK4/6 inhibitors. Nature reviews Clinical oncology 13, 417–430. [DOI] [PubMed] [Google Scholar]
- Olson CM, Jiang B, Erb MA, Liang Y, Doctor ZM, Zhang Z, Zhang T, Kwiatkowski N, Boukhali M, Green JL, et al. (2017). Pharmacological perturbation of CDK9 using selective CDK9 inhibition or degradation. Nat Chem Biol [DOI] [PMC free article] [PubMed]
- Remillard D, Buckley DL, Paulk J, Brien GL, Sonnett M, Seo HS, Dastjerdi S, Wuhr M, Dhe-Paganon S, Armstrong SA, et al. (2017). Degradation of the BAF Complex Factor BRD9 by Heterobifunctional Ligands. Angewandte Chemie (International ed in English) 56, 5738–5743. [DOI] [PMC free article] [PubMed] [Google Scholar]
- Tigan AS, Bellutti F, Kollmann K, Tebb G, and Sexl V (2016). CDK6-a review of the past and a glimpse into the future: from cell-cycle control to transcriptional regulation. Oncogene 35, 3083–3091. [DOI] [PubMed] [Google Scholar]
- Wang H, Nicolay BN, Chick JM, Gao X, Geng Y, Ren H, Gao H, Yang G, Williams JA, Suski JM, et al. (2017). The metabolic function of cyclin D3-CDK6 kinase in cancer cell survival. Nature 546, 426–430. [DOI] [PMC free article] [PubMed] [Google Scholar]
- Winter GE, Buckley DL, Paulk J, Roberts JM, Souza A, Dhe-Paganon S, and Bradner JE (2015). DRUG DEVELOPMENT. Phthalimide conjugation as a strategy for in vivo target protein degradation. Science 348, 1376–1381. [DOI] [PMC free article] [PubMed] [Google Scholar]
- Zengerle M, Chan KH, and Ciulli A (2015). Selective Small Molecule Induced Degradation of the BET Bromodomain Protein BRD4. ACS chemical biology 10, 1770–1777. [DOI] [PMC free article] [PubMed] [Google Scholar]
Associated Data
This section collects any data citations, data availability statements, or supplementary materials included in this article.