

Abstract
Objective:
The purpose of this study was to categorize patients into different grades of nonalcoholic fatty liver disease (NAFLD) by ultrasonography and to compare the findings with their serum lipid profile.
Materials and Methods:
Descriptive, cross-sectional study design was used. One hundred and nine patients without a history of alcohol consumption of age more than 16 years attending general health checkup were selected at Tribhuvan University Teaching Hospital, Maharajganj, Kathmandu, as per the exclusion and inclusion criteria. Ultrasound scanning of the patients was done and their liver size, as well as grading of fatty liver, was done. Data were collected in predesigned pro forma and were analyzed using Statistical Package for the Social Sciences (SPSS) 16.0, IBM (SPSS Inc., Chicago, IL).
Results:
In this study, the mean age of fatty liver in males was found to be 44.3 years and in females was found to be 51.9 years. 22.9% of patients with NAFLD had increased liver size. Significant association with increasing grades of fatty liver was found with increasing levels of cholesterol (P = 0.028), low-density lipoprotein (LDL) (P = 0.017), liver size (P = 0.001), and body mass index (BMI) (P = 0.045) in patients diagnosed with NAFLD. No significant association with increasing grades of fatty liver was found with increasing levels of triglyceride (P = 0.32) and high-density lipoprotein (P = 0.25).
Conclusion:
Ultrasound is a safe and first-line modality for the evaluation of fatty liver and its grading. Increasing grades of fatty liver had significant association with increasing levels of cholesterol LDL, increasing liver size, and BMI of patients.
Keywords: Fatty liver, lipid profile, nonalcoholic fatty liver, ultrasonography
INTRODUCTION
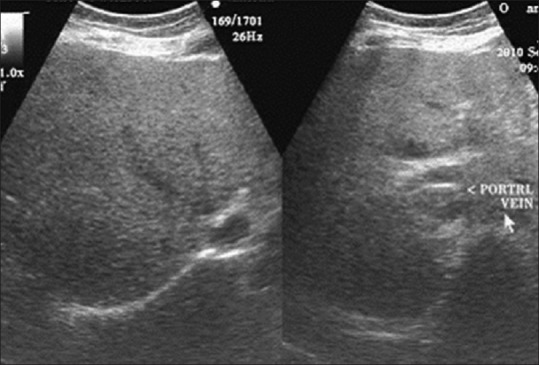
Fatty liver is a common problem worldwide. Its prevalence has been estimated to be 20%–30% in general population in Western countries.[1] It was thought to be a benign condition but is now increasingly recognized as a major cause of liver-related morbidity and mortality. Studies introduced that nonalcoholic fatty liver disease (NAFLD) may progress to cirrhosis, liver failure, and hepatocellular carcinoma.[2,3] Fatty liver can be easily diagnosed by imaging. Although Liver biopsy is thought of as the gold standard for assessment of NAFLD, it has been limited by its invasiveness and unsuitability for screening purposes. Fortunately, it can be diagnosed by ultrasound, computed tomography (CT), and magnetic resonance imaging (MRI). In ultrasonography (USG), the echogenicity of normal liver equals or minimally exceeds that of the renal cortex or spleen, with intrahepatic vessels sharply demarcated and posterior aspects of liver well depicted [Figure 1]. Fatty liver in USG can be diagnosed if the liver echogenicity exceeds that of the renal cortex and spleen and there is attenuation of ultrasound wave, loss of definition of the diaphragm, and poor delineation of the intrahepatic architecture.[4,5,6,7,8] Fatty liver can be diagnosed as well as graded according to severity of fat deposition into three grades. They are:
Figure 1.
Longitudinal ultrasound scan comparing echotexture of the liver with echotexture of the renal cortex
Grade 1 – Minimal diffuse increase in the fine echoes. Liver appears bright compared to the cortex of the kidney. Normal visualization of the diaphragm and intrahepatic vessel borders [Figure 2]
Figure 2.
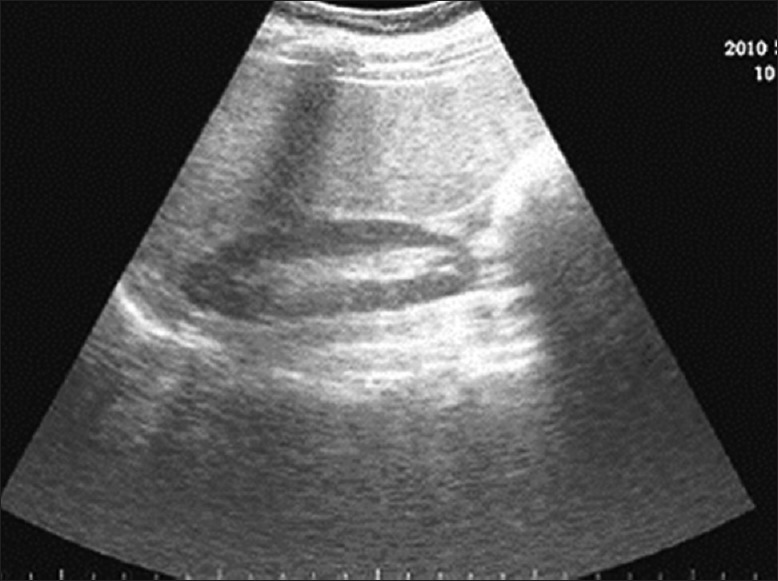
ultrasound scan showing increased echotexture of the liver in comparison to echotexture of the renal cortex: grade I fatty liver
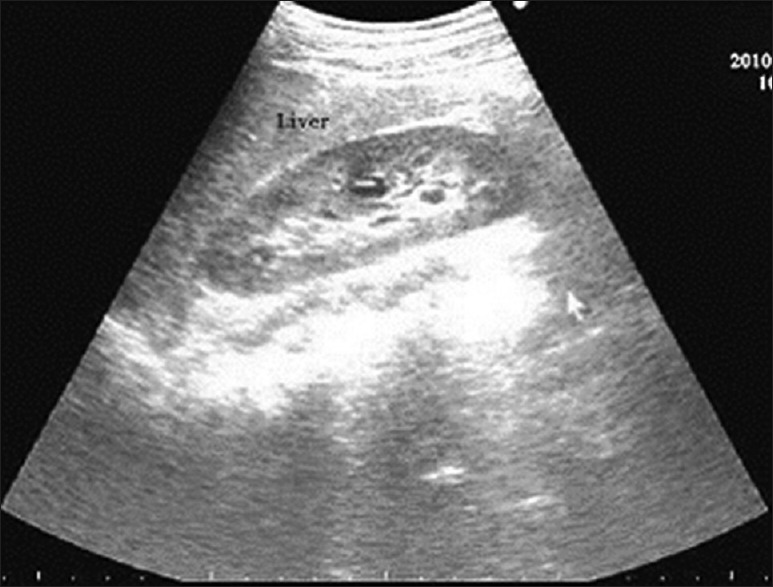
Grade 2 – Moderate diffuse increase in the fine echoes. Slightly impaired visualization of the intrahepatic vessels and diaphragm [Figure 3]
Figure 3.
Ultrasound scan showing increased echotexture of the liver with impaired visualization of intrahepatic vessels: Grade II fatty liver
Grade 3 – Marked increase in fine echoes [Figure 4]. Poor or no visualization of intrahepatic vessels and diaphragm and poor penetration of the posterior segment of the right lobe of the liver.[9]
Figure 4.
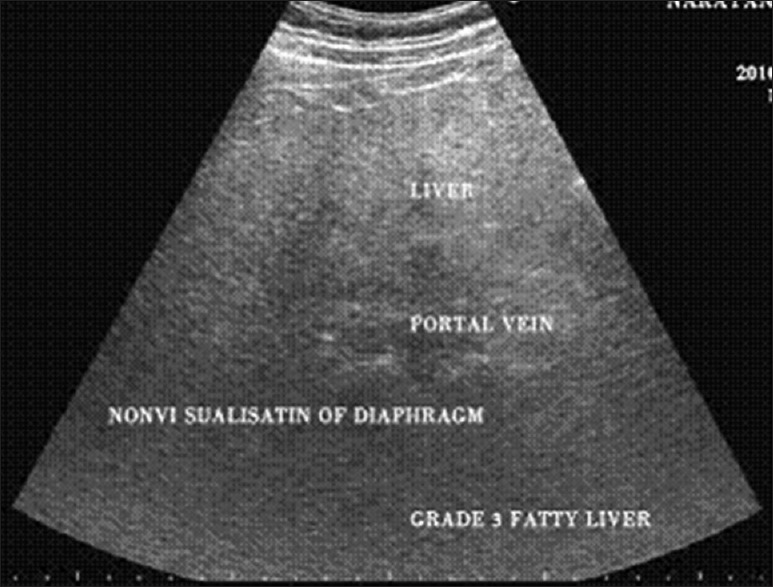
Ultrasound scan showing nonvisualization of portal vein margins and nonvisualization of the diaphragm due to deep attenuation of ultrasound: Grade III fatty liver
This grading gives an indirect estimation of the quantification of fat deposition in the liver. It should also be remembered that NAFLD is a spectrum with the most severe forms consists of liver fibrosis and cirrhosis. Hence, higher the grade of fatty liver, more the chances of progressing to fibrosis and then cirrhosis.[10,11,12,13,14,15,16,17] Interobserver variability is a major drawback of USG, however, it has been shown to have an acceptable sensitivity and specificity for detecting moderate-to-severe hepatic steatosis. As US is easy to perform and less costly than other imaging methods, US is probably currently the most widely used imaging method for detecting hepatic steatosis in asymptomatic patients with elevated liver enzymes and suspected NAFLD.[17,18,19,20,21] Grade 3 fatty lliver. Juurinen et al. had carried out a study on “nonalcoholic fatty liver disease – the hepatic component of metabolic syndrome” and found that fatty liver disease was closely related to metabolic disturbances.[21] Marchesani et al. showed that 80% of patients with NAFLD were obese. One study showed that 79% of people with NAFLD were overweight or obese. Goland et al. showed that patients with NAFLD had a significant higher body mass index (BMI), higher blood glucose levels, and triglyceride (TGL) values than normal population. Juneja also showed almost similar results with elevated blood glucose values, lipid levels, and blood pressure values. Strong association of NAFLD with metabolic syndrome has been found. Dixon et al. also quoted NAFLD to be the hepatic component of metabolic syndrome.[22,23,24,25] These studies, however, did not show the relation of grading of fatty liver with metabolic disturbances. Hence, this study is unique on its own. It has attempted to show the relationship of different grades of fatty liver with size of liver, BMI, and lipid profile in apparently healthy people who came to the department for general health checkup.
MATERIALS AND METHODS
The study was a hospital-based prospective study carried out at Tribhuvan University Teaching Hospital, a tertiary care center in Kathmandu, Nepal. The study population was individuals referred for USG from general health checkup from September 1, 2015 to August 31, 2016.
We selected adult patients diagnosed with fatty liver from patients who were referred to the Ultrasound Section, Department of Radiodiagnosis and Imaging at Tribhuvan University Teaching Hospital for health checkup. After excluding patients with a history of alcohol consumption, we enrolled 109 patients in this study. This study protocol was approved by the local institutional review board and informed consents were obtained from the enrolled patients.
Patient's information was recorded in the predesigned form, including age, sex, relevant medical history, height, and weight. BMI was calculated for each subject. Biochemical analysis including high-density lipoprotein (HDL), low-density lipoprotein (LDL), TGL, and cholesterol levels was also examined.
Patients were scanned transabdominally using C 5-1 (1-5 MHz) curvilinear probe of Philips iU22 ultrasound machine in supine position. The craniocaudal liver length at midclavicular line was measured. Measurements were made from the dome of the diaphragm during deep inspiration and all measurements were recorded to the nearest millimeter. According to the standard criteria,[9] the fatty liver was scored on a three-grade scale, with 1 indicating minimal diffuse increase in fine echoes, liver appearing bright compared to the cortex of the kidney, and normal visualization of diaphragm and intrahepatic vessel borders; 2 indicating moderately diffuse increase in the fine echoes with slightly impaired visualization of the intrahepatic vessels and diaphragm; and 3 indicating marked increase in the fine echoes with poor or no visualization of intrahepatic vessels or the diaphragm and poor penetration of the posterior segment of the right lobe of the liver.
RESULTS
A total of 109 patients (63 males, 46 females) with mean age of 47.5 were assessed in this study. The sample consisted of patients of age more than 18 who were diagnosed with fatty liver by ultrasound and had no history of alcohol consumption. The age distribution of demographics of sample is shown in Figure 5. The mean age of the males was 44.4 years and in females was 51.6 years. The majority of patients belonged to age group of 50–59 (32.1%), followed by 40–49 (28.8%) and 30–39 (16.5%). The distribution of age in NAFLD patients is shown in Table 1.
Figure 5.
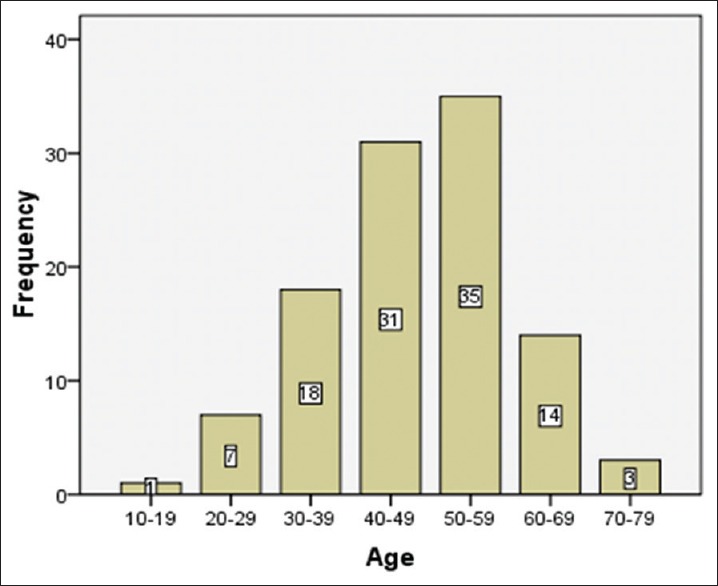
Patient distribution of age
Table 1.
Distribution of different grades of nonalcoholic fatty liver in different age groups
| Fatty liver grade | |||
|---|---|---|---|
| Grade I | Grade II | Grade III | |
| 10-19 | 1 | 0 | 0 |
| 20-29 | 6 | 1 | 0 |
| 30-39 | 8 | 9 | 1 |
| 40-49 | 21 | 9 | 1 |
| 50-59 | 24 | 11 | 0 |
| 60-69 | 12 | 1 | 1 |
| 70-79 | 3 | 0 | 0 |
| Total | 75 | 31 | 3 |
| 109(100%) | 68.8% | 28.4% | 2.8% |
Figure 6 shows the distribution of different grades of NAFLD among 109 samples. It was found that most of the patients with fatty liver had Grade I fatty liver changes (n = 75, 68.8%), followed by Grade II fatty liver changes (n = 31, 28.4%), and then, Grade III fatty liver changes (n = 3, 2.8%).
Figure 6.
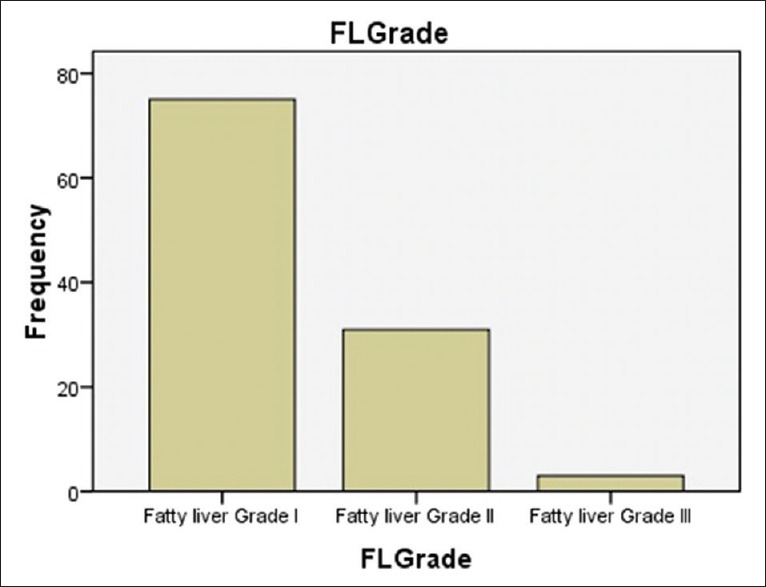
Distribution of different grades of nonalcoholic fatty liver among samples
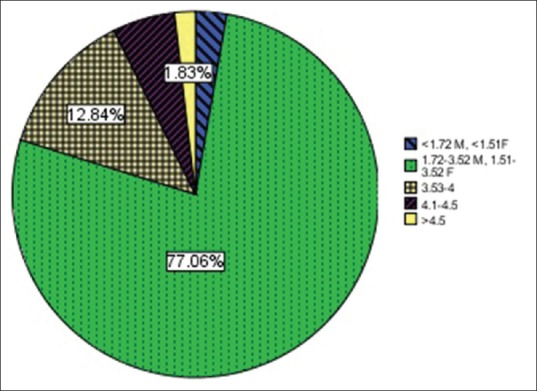
Out of 110 patients with fatty liver, it was found that most of them had liver size within normal range, which is < 15.5 cm (77.1% samples). It was found that 12.8% of patients with NAFLD had liver size from 15.6 mm to 16.6 mm and 10.1% of patients had liver size more than 16.6 cm [Figure 7].
Figure 7.
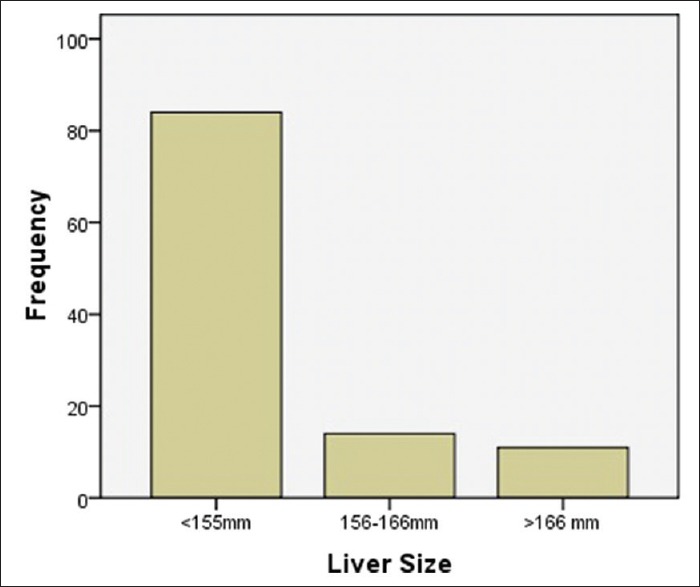
Distribution of different liver sizes in patients with nonalcoholic fatty liver disease
Table 2 shows the distribution of BMI among the NAFLD patients. In the study, it was found that most of the patients with NAFLD were overweight (56%), 16% were included in Class I obesity, and 9% were included in Class II obesity. Only 30% of samples had normal weight.
Table 2.
Distribution of body mass index among patients diagnosed with nonalcoholic fatty liver disease
| BMI | Frequency (%) |
|---|---|
| <18.5 | 6 (5.5) |
| 18.5-25 | 30 (27.5) |
| 25-30 | 56 (51.4) |
| 30-35 | 16 (14.7) |
| 35-40 | 1 (0.9) |
| Total | 109 (100.0) |
BMI: Body mass index
When the reports of lipid profile were obtained, it was found that almost 8.26% of samples had decreased level of HDL while normal level of HDL was found in 89.9% of cases. Few samples (1.8%) had higher level of HDL [Figure 8].
Figure 8.
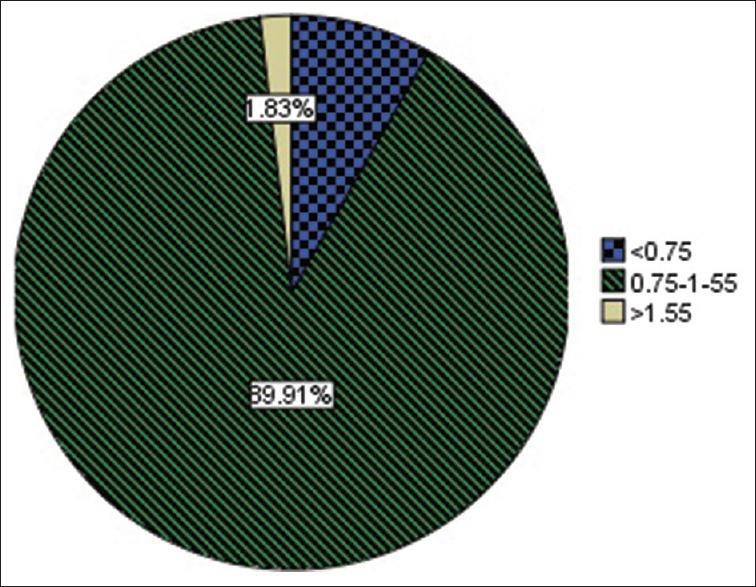
Distribution of high-density lipoprotein in patients with nonalcoholic fatty liver disease (mmol/L)
It was also observed that the levels of LDL were within normal range in 79.8% cases (cumulative frequency), however, it was increased in 20.2% of the cases [Figure 9]. In the study, out of the total samples, it was found that cholesterol levels were normal in 72.5% of cases (cumulative frequency) and was abnormally elevated in 17.5% of cases [Figure 10].
Figure 9.
Distribution of low-density lipoprotein in patients with nonalcoholic fatty liver disease (mmol/L)
Figure 10.
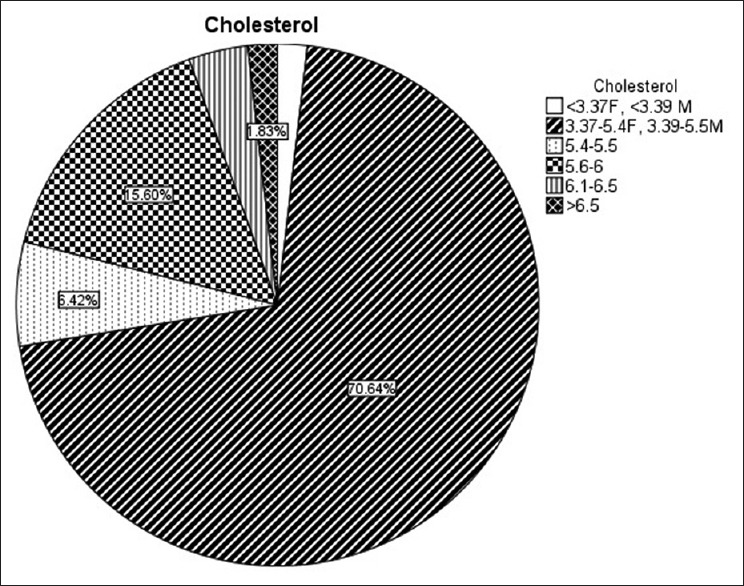
Distribution of cholesterol in patients diagnosed with nonalcoholic fatty liver disease
It was observed that the mean TGL value was 2.06 (within normal range). However, there were 26.6% of cases with elevated TGL levels [Figure 11]. After obtaining the distribution of age, sex, and lipid profile in different grades of fatty liver, comparison of fatty liver disease grading with HDL, LDL, cholesterol, TGL, and liver size was done. Following data and calculations were obtained.
Figure 11.
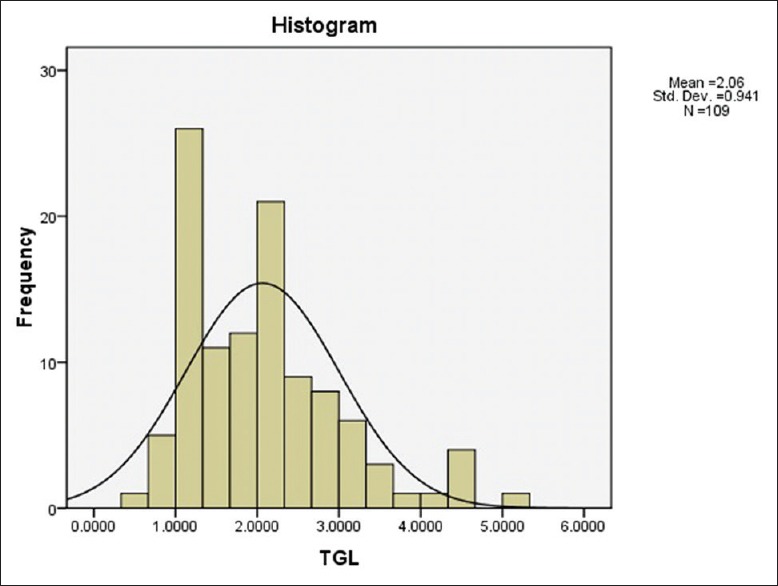
Histogram showing distribution of triglyceride levels among samples
Table 3 shows that serum TGL, cholesterol, HDL, and LDL were in abnormal ranges (increased TGL, cholesterol, LDL, and decreased HDL) was found in 26.6%, 27.5%, 1.8%, and 20.2% of samples, respectively.
Table 3.
Distribution of patients showing abnormal serum lipid profile in nonalcoholic fatty liver disease
| Lipid profile | US grades | Total | Percentage | |||||||
|---|---|---|---|---|---|---|---|---|---|---|
| I | II | III | ||||||||
| N | A | N | A | N | A | N | A | N | A | |
| TGL | 58 | 17 | 20 | 11 | 2 | 1 | 80 | 29 | 73.4 | 26.6 |
| Cholesterol | 58 | 17 | 18 | 13 | 3 | 0 | 79 | 30 | 72.5 | 27.5 |
| HDL | 74 | 1 | 30 | 1 | 3 | 0 | 107 | 2 | 98.2 | 1.8 |
| LDL | 63 | 12 | 21 | 10 | 3 | 0 | 87 | 22 | 79.8 | 20.2 |
US: Ultrasound, TGL: Triglyceride, HDL: High-density lipoprotein, LDL: Low-density lipoprotein, N: Normal, A: Abnormal
Table 4 shows that increasing grades of NAFLD were significantly associated with increasing levels of serum cholesterol (P = 0.028), LDL (P = 0.017), liver size (P = 0.001), and BMI (P = 0.045). Strong positive correlation was seen in between increasing levels of fatty liver and increasing liver size (r = 0.405), HDL (r = 0.119), LDL (r = 0.249), and BMI (r = 0.21). No significant association was seen in between the increasing grades of NAFLD and TGL levels or HDL levels.
Table 4.
Comparison between nonalcoholic fatty liver disease and serum lipid profile, body mass index, and liver size
| Serum lipid profile | USG grades | P | r | |||||
|---|---|---|---|---|---|---|---|---|
| Grade I | Grade II | Grade III | ||||||
| Mean | SD | Mean | SD | Mean | SD | |||
| TGL | 1.9760 | 0.779 | 2.277 | 1.181 | 2.033 | 1.83 | 0.32 | 0.12 |
| Cholesterol | 4.55 | 0.86 | 5.074 | 0.97 | 4.833 | 0.5686 | 0.028 | 0.22 |
| HDL | 1.048 | 0.21 | 1.125 | 0.246 | 1.033 | 0.251 | 0.25 | 0.119 |
| LDL | 2.637 | 0.718 | 3.122 | 0.951 | 2.966 | 0.461 | 0.017 | 0.249 |
| Liver size | 144.52 | 10.28 | 157.12 | 8.4 | 153.3 | 12.58 | 0.001 | 0.405 |
| BMI | 21.10 | 5.7 | 25.38 | 4.66 | 26.58 | 3.805 | 0.045 | 0.21 |
USG: Ultrasonography, TGL: Triglyceride, HDL: High-density lipoprotein, LDL: Low-density lipoprotein, SD: Standard deviation, BMI: Body mass index
DISCUSSION
In the study, NAFLD had male predominance with almost 57.8% cases were found males. Similar results were found by Shivram Prasad et al., in which male predominance was noted in cases of NAFLD. Jen Jung Pen et al. also studied the sex distribution among people with NAFLD and found that it was predominant in males. In the article by Jen Jung Pen et al., this was owed to the difference in body fat, lifestyle, and sex hormone metabolism. However, in the study conducted by Dhumal et al., female predominance in the distribution of sex among patients with NAFLD was reported.
It was also found in this study that the highest percentage of age group was in the fifth decade-42.2%. Similar finding was found in a study by Dhumal et al. In the study also, it was quoted that the largest per cent of people with fatty liver was in the age group of fourth-to-fifth decade. This is probably due to the sedentary lifestyle in this age group. This can possibly be attributed to the sedentary lifestyle and less engagement in physical activity in this age group. Most of the metabolic disorders including diabetes, hypertension, and NAFLD are probably a result of the lifestyle in this age group of most of the patients.
Liver size was normal in 77.1% cases. It was increased by 0–1 cm in 12% of cases and was increased by 0–2 cm in 10.8% of cases.
Most of the cases diagnosed as nonalcoholic fatty liver had Grade I fatty liver (68.8%), followed by Grade II (28%) and Grade III (2.8%). In the study by Dhumal et al., it was found that the prevalence of NAFLD Grade I was 47.1%, Grade II was 42.8%, and Grade III was 10%. This discrepancy probably is due to random selection of samples. In this study, it was noted that there were minimal samples diagnosed with Grade 3 fatty lliver.
In this study, only 30% had normal weight. 70% cases had increased weight with 56% being overweight, 16% had Class I obesity, and 9% had Class II obesity. In the study done by Ghobad et al. as well, the prevalence of obesity was 28.2% and 44.1% cases were found to be overweight. In a study done by Mohammad Aleem et al., it was found that increasing grades of fatty liver was associated with increasing weight. In a study conducted by Juneja et al., it was found that 52.8% were overweight and 22.6% were obese. These findings in other studies correlate quite well with this study showing that there is higher prevalence of overweight and obesity in people with NAFLD.
In this study, it was found that there was significant correlation of increasing grades of fatty liver with increasing grades of LDL, cholesterol, BMI, and liver size of patients. However, no significant correlation was found in between fatty liver and increasing levels of TGLs and decreasing grades of HDL. In study by Dhumal et al., it was found that increasing grades of fatty liver was significantly associated with increasing levels of cholesterol, LDL, very LDL (VLDL), and decreasing HDL. The results in this study are almost similar to a study by Dhumal et al. In both the studies, it was seen that increasing grades of fatty liver was not significantly associated with increasing levels of serum TGL. However, unlike the findings of significant association of increasing grades of fatty liver with decreasing HDL levels in study by Dhumal et al., no significant association was found in between the levels of HDL and increasing grades of fatty liver in this study. In a study by Ghobad et al., it was found that only increasing grades of TGL was significantly associated with increasing grades of fatty liver. This finding was not seen in this study. In the study by Mohammad Aleem et al., it was quoted that people with fatty liver and diabetes mellitus had increasing TGLs, VLDL, LDL, and decreasing HDL. Shivram Prasad et al. associated fatty liver with hyperlipidemia in 68% of cases. In summary, although variables vary, fatty liver was associated with deranged lipid profile. In some studies, only TGL was increased and correlated with increasing grades of fatty liver, while in others all other variables, namely, cholesterol, VLDL, HDL, and BMI were significantly correlated with increasing grades of fatty liver except levels of TGLs.
CONCLUSION
In summary, this study showed that fatty liver was more prevalent in male sex and age group of 40–50 years. Almost three quarters of fatty liver patients had normal liver size while one quarter had increased size of the liver. Almost half of the patients with fatty liver had increased BMI. Increasing grades of fatty liver had significant association with increasing LDL, cholesterol, BMI, and liver size. No significant association of increasing grades of NAFLD was noted with increasing levels of serum TGL s or decreasing levels of HDL.
Ultrasound is an important imaging tool for the diagnosis and grading of fatty liver. It is the first-line investigation modality for diagnosis of fatty liver. It is cheap, easy to use, and handle. However, it has some limitations like observer dependency. Next limitation of ultrasound in the cases of fatty liver is its inability to quantify the fat in the liver. Quantification of fat using CT scan or MRI may be more reliable for estimation and quantification of fat deposition in the liver. This can further be correlated with lipid profile in patients. Studies using CT and MRI for the quantification of fat and correlation with lipid profile can be done in the future.
Findings in our study can be used for further management of patients with fatty liver. From the study, it was shown that increasing grades of fatty liver had significant association with deranged lipid profile. Deranged lipid profile is associated with cardiovascular problems. Hence, increasing grades of fatty liver has indirect relationship with cardiovascular problems.
Financial support and sponsorship
Nil.
Conflicts of interest
There are no conflicts of interest.
REFERENCES
- 1.Bedogni G, Miglioli L, Masutti F, Tiribelli C, Marchesini G, Bellentani S, et al. Prevalence of and risk factors for nonalcoholic fatty liver disease: The dionysos nutrition and liver study. Hepatology. 2005;42:44–52. doi: 10.1002/hep.20734. [DOI] [PubMed] [Google Scholar]
- 2.Adams LA, Lymp JF, St, Sauver J, Sanderson SO, Lindor KD, Feldstein A, et al. The natural history of nonalcoholic fatty liver disease: A population-based cohort study. Gastroenterology. 2005;129:113–21. doi: 10.1053/j.gastro.2005.04.014. [DOI] [PubMed] [Google Scholar]
- 3.Chen SH, He F, Zhou HL, Wu HR, Xia C, Li YM, et al. Relationship between nonalcoholic fatty liver disease and metabolic syndrome. J Dig Dis. 2011;12:125–30. doi: 10.1111/j.1751-2980.2011.00487.x. [DOI] [PubMed] [Google Scholar]
- 4.Saadeh S, Younossi ZM, Remer EM, Gramlich T, Ong JP, Hurley M, et al. The utility of radiological imaging in nonalcoholic fatty liver disease. Gastroenterology. 2002;123:745–50. doi: 10.1053/gast.2002.35354. [DOI] [PubMed] [Google Scholar]
- 5.Tchelepi H, Ralls PW, Radin R, Grant E. Sonography of diffuse liver disease. J Ultrasound Med. 2002;21:1023–32. doi: 10.7863/jum.2002.21.9.1023. [DOI] [PubMed] [Google Scholar]
- 6.Strauss S, Gavish E, Gottlieb P, Katsnelson L. Interobserver and intraobserver variability in the sonographic assessment of fatty liver. AJR Am J Roentgenol. 2007;189:W320–3. doi: 10.2214/AJR.07.2123. [DOI] [PubMed] [Google Scholar]
- 7.Joy D, Thava VR, Scott BB. Diagnosis of fatty liver disease: Is biopsy necessary? Eur J Gastroenterol Hepatol. 2003;15:539–43. doi: 10.1097/01.meg.0000059112.41030.2e. [DOI] [PubMed] [Google Scholar]
- 8.Jain KA, McGahan JP. Spectrum of CT and sonographic appearance of fatty infiltration of the liver. Clin Imaging. 1993;17:162–8. doi: 10.1016/0899-7071(93)90060-z. [DOI] [PubMed] [Google Scholar]
- 9.Mahaling DU, Basavaraj MM, Bika AJ. Comparison of lipid profile in different grades of non-alcoholic fatty liver disease diagnosed on ultrasound. Asian Pac J Trop Biomed. 2013;3:907–12. [Google Scholar]
- 10.Szczepaniak LS, Nurenberg P, Leonard D, Browning JD, Reingold JS, Grundy S, et al. Magnetic resonance spectroscopy to measure hepatic triglyceride content: Prevalence of hepatic steatosis in the general population. Am J Physiol Endocrinol Metab. 2005;288:E462–8. doi: 10.1152/ajpendo.00064.2004. [DOI] [PubMed] [Google Scholar]
- 11.Vernon G, Baranova A, Younossi ZM. Systematic review: The epidemiology and natural history of non-alcoholic fatty liver disease and non-alcoholic steatohepatitis in adults. Aliment Pharmacol Ther. 2011;34:274–85. doi: 10.1111/j.1365-2036.2011.04724.x. [DOI] [PubMed] [Google Scholar]
- 12.Farrell GC, Larter CZ. Nonalcoholic fatty liver disease: From steatosis to cirrhosis. Hepatology. 2006;43:S99–112. doi: 10.1002/hep.20973. [DOI] [PubMed] [Google Scholar]
- 13.de Alwis NM, Day CP. Non-alcoholic fatty liver disease: The mist gradually clears. J Hepatol. 2008;48(Suppl 1):S104–12. doi: 10.1016/j.jhep.2008.01.009. [DOI] [PubMed] [Google Scholar]
- 14.Fierbinteanu-Braticevici C, Negreanu L, Tarantino G. Is fatty liver always benign and should not consequently be treated? J Physiol Pharmacol. 2013;64:3–9. [PubMed] [Google Scholar]
- 15.Day CP. Natural history of NAFLD: Remarkably benign in the absence of cirrhosis. Gastroenterology. 2005;129:375–8. doi: 10.1053/j.gastro.2005.05.041. [DOI] [PubMed] [Google Scholar]
- 16.Tarantino G. What has the optimistic bias got to do with the need to differentiate fatty liver from nonalcoholic steatohepatitis? J Gastrointestin Liver Dis. 2011;20:229–31. [PubMed] [Google Scholar]
- 17.Adams LA, Sanderson S, Lindor KD, Angulo P. The histological course of nonalcoholic fatty liver disease: A longitudinal study of 103 patients with sequential liver biopsies. J Hepatol. 2005;42:132–8. doi: 10.1016/j.jhep.2004.09.012. [DOI] [PubMed] [Google Scholar]
- 18.Ekstedt M, Franzén LE, Mathiesen UL, Thorelius L, Holmqvist M, Bodemar G, et al. Long-term follow-up of patients with NAFLD and elevated liver enzymes. Hepatology. 2006;44:865–73. doi: 10.1002/hep.21327. [DOI] [PubMed] [Google Scholar]
- 19.Tarantino G. Is assessing the presence of NASH by liver histology or surrogate markers always advisable? Hepat Mon. 2013;13:e7560. doi: 10.5812/hepatmon.7560. [DOI] [PMC free article] [PubMed] [Google Scholar]
- 20.Ascha MS, Hanouneh IA, Lopez R, Tamimi TA, Feldstein AF, Zein NN, et al. The incidence and risk factors of hepatocellular carcinoma in patients with nonalcoholic steatohepatitis. Hepatology. 2010;51:1972–8. doi: 10.1002/hep.23527. [DOI] [PubMed] [Google Scholar]
- 21.Juurinen L, Tiikkainen M, Häkkinen AM, Hakkarainen A, Yki-Järvinen H. Effects of insulin therapy on liver fat content and hepatic insulin sensitivity in patients with type 2 diabetes. Am J Physiol Endocrinol Metab. 2007;292:E829–35. doi: 10.1152/ajpendo.00133.2006. [DOI] [PubMed] [Google Scholar]
- 22.Nomura H, Kashiwagi S, Hayashi J, Kajiyama W, Tani S, Goto M, et al. Prevalence of fatty liver in a general population of Okinawa, Japan. Jpn J Med. 1988;27:142–9. doi: 10.2169/internalmedicine1962.27.142. [DOI] [PubMed] [Google Scholar]
- 23.Singh SP, Nayak S, Swain M, Rout N, Mallik RN, Agrawal O, et al. Prevalence of nonalcoholic fatty liver disease in coastal Eastern India: A preliminary ultrasonographic survey. Trop Gastroenterol. 2004;25:76–9. [PubMed] [Google Scholar]
- 24.Marchesini G, Brizi M, Bianchi G, Tomassetti S, Bugianesi E, Lenzi M, et al. Nonalcoholic fatty liver disease: A feature of the metabolic syndrome. Diabetes. 2001;50:1844–50. doi: 10.2337/diabetes.50.8.1844. [DOI] [PubMed] [Google Scholar]
- 25.Dixon JB, Bhathal PS, O’Brien PE. Nonalcoholic fatty liver disease: Predictors of nonalcoholic steatohepatitis and liver fibrosis in the severely obese. Gastroenterology. 2001;121:91–100. doi: 10.1053/gast.2001.25540. [DOI] [PubMed] [Google Scholar]