

Abstract
Objectives:
Some parents are concerned the childhood immunization schedule could increase risk for allergic disorders, including asthma. To inform future safety studies of this speculated association, a parent survey was conducted to examine the risk of misclassification of vaccination status in electronic health record data, and to assess the potential for confounding if asthma risk factors varied by vaccination status.
Methods:
A survey was conducted among parents of children 19 to 35 months old at 6 medical organizations within the Vaccine Safety Datalink. Parents of children in 4 vaccination groups were surveyed: 1) no vaccines by 12 months of age and a diagnosis of parental vaccine refusal; 2) consistent vaccine limiting (≤2 vaccines per visit); 3) not consistently vaccine limiting but otherwise undervaccinated with a vaccine refusal diagnosis; and 4) fully vaccinated with no delays and no vaccine refusal. Parents were surveyed about their child’s vaccination status and whether asthma risk factors existed.
Results:
Among a survey sample of 2043 parents, 1209 responded (59.2%). For receiving no vaccines, the observed agreement between parent report and electronic health record data was 94.0% (κ= 0.79); for receiving all vaccines with no delays, the observed agreement was 87.3% (κ= 0.73). Although most asthma risk factors (allergic rhinitis, eczema, food allergies, family asthma history) reported by parents did not differ significantly between children in the vaccination groups studied, several factors (aeroallergen sensitivity, breastfeeding) differed significantly between groups.
Conclusions:
Measurement and control of disease risk factors should be carefully considered in observational studies of the safety of the immunization schedule.
Keywords: asthma, child, immunization, undervaccination, vaccine, vaccine safety, vaccine schedule
Although vaccination coverage for young children in the United States remains high compared to historical rates,1,2 more than 10% of parents report having intentionally refused or delayed one or more vaccines for their children,3–5 and in 2016 an estimated 0.8% of 19-to 35-month-old children nationally had received no vaccines.2 Concern about vaccine safety is a primary reason parents refuse or delay vaccines.3,6,7 Some parents have questioned the safety of the immunization schedule as a whole,8–10 and some have speculated that the increasing prevalence of asthma and other allergic diseases11,12 could be linked to the increasing number of vaccines given during early childhood.13
In 2012, responding to public concern, an Institute of Medicine (IOM) committee conducted a scientific review of the safety of the recommended childhood immunization schedule.14 Although the IOM committee concluded that available evidence strongly supported the safety of the schedule, the committee also identified limitations with existing safety data, acknowledging that “studies designed to examine the long-term effects of the cumulative number of vaccines or other aspects of the immunization schedule have not been conducted.”14 While the committee asserted that it would be unethical to conduct randomized trials of the immunization schedule,14 it recommended new observational studies of the safety of the schedule in research networks such as the Vaccine Safety Datalink (VSD).15,16
Specifically, the IOM committee proposed conducting observational studies to compare adverse health outcomes between intentionally unvaccinated children, those on a limited or delayed schedule, and fully vaccinated children.14 However, using existing data to make such comparisons creates methodological challenges.14,17,18 While vaccination data from electronic health records (EHR) are generally accurate,19 vaccination status can be misclassified, such as when children who appear un- or undervaccinated in EHR data have received vaccines elsewhere.20 Additionally, parents who intentionally refuse or delay vaccines may differ in systematic ways from parents of fully vaccinated children.21,22 As the IOM committee summarized, any studies of the schedule “would need to account for the many confounding variables that distinguish distinct naturally occurring unimmunized populations…including [factors] that may play a role in the development of allergies, asthma, and other conditions.”14
The current investigation was undertaken to directly inform future studies of the safety of the recommended childhood immunization schedule. The objectives were to examine the risk of misclassification of vaccination status in an established research network, and to assess the prevalence of potential confounding variables with respect to the development of asthma and other allergic diseases. We conducted a survey of parents of unvaccinated, undervaccinated, and fully vaccinated children to confirm vaccination status and verify reasons for nonvaccination when present. Parents were also questioned regarding risk factors for asthma to assess whether these risk factors varied by their child’s vaccination status.
Methods
Study Setting
This study was conducted in the VSD network, a collaboration between the Centers for Disease Control and Prevention and 8 large medical care organizations (referred to as sites).15,16,23 Six VSD sites participated: Marshfield Clinic, Kaiser Permanente (KP) Washington, KP Northwest, KP Northern California, KP Southern California, and KP Colorado. The institutional review board at KP Colorado approved the study, and participating sites ceded research oversight to KP Colorado. Written consent was not required for survey administration, and parents could opt out of the survey verbally or in writing.
Study Population
We identified all children aged 19 to 35 months as of January 1, 2017, continuously insured at a participating VSD site, with health insurance starting at 6 weeks of age or younger. At Marshfield Clinic, in addition to those continuously insured, children were also included if they were residents of the Marshfield Epidemiologic Study area, an area from which health care encounters are captured with a high degree of completeness.24 Children were excluded from the study if they had fewer than 2 well-child visits before 12 months of age, received vaccines not routinely recommended under 2 years of age (eg, meningococcal conjugate vaccine), had obvious vaccine data errors (eg, unspecified vaccine type, vaccine date before date of birth), or had a diagnosis code for a medical contraindication to vaccination. As shown in the Figure, 77,974 children were identified, of whom 6612 (8.5%) were excluded.
Figure.
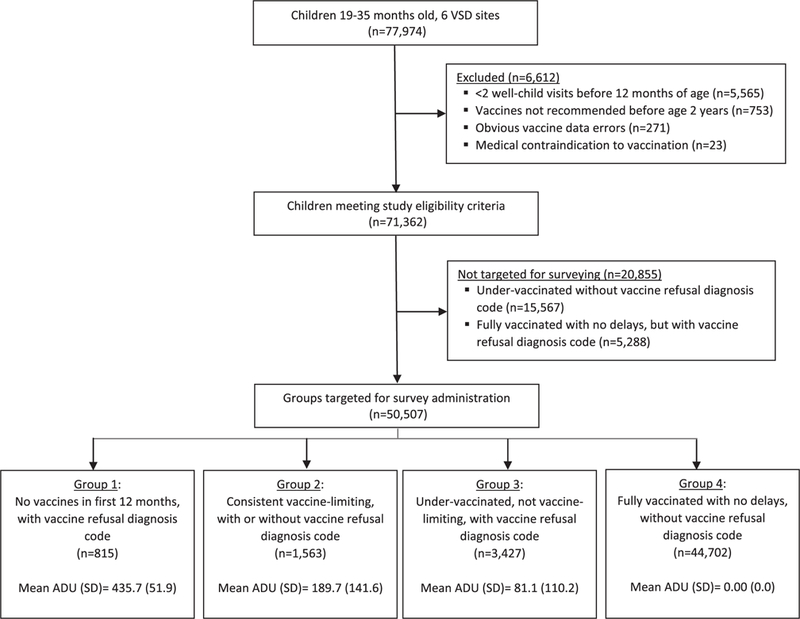
Study flow diagram.
Vaccination status was assessed for each child in the study population using EHR-derived vaccine data. While 3 VSD sites routinely incorporate vaccine data from their state-wide immunization information system,25 few additional vaccines (1% or less) are typically identified by this mechanism. We used a previously published algorithm21,26 to calculate the average days undervaccinated (ADU) for each child. The algorithm assessed all vaccines routinely recommended in the first 24 months of life by the Advisory Committee on Immunization Practices,27–29 except hepatitis A and influenza vaccines. The algorithm incorporated detailed information on the recommended schedule, including minimum ages, minimum intervals between doses, different dose requirements for different vaccine products, changes in recommendations over time, and national vaccine shortages. The value of ADU could range from a minimum of 0 days (ie, fully vaccinated, no delays) to a maximum of 479 days (ie, completely unvaccinated at 24 months of age).21,26
After ADU was calculated for each child, EHR data were searched for diagnosis codes indicating parental vaccine refusal (International Classification of Diseases, 9th Revision, Clinical Modification, codes V64.05 and V64.06; 10th Revision, codes Z28.1, Z28.20, Z28.21, Z28.82). In prior studies that used manual record review to confirm vaccination status, these codes identified children undervaccinated as a result of parental choice with a high degree of specificity.20,21 These codes do not indicate which specific vaccines were refused.
As shown in the Figure, we then identified 4 mutually exclusive groups of children for survey administration: 1) children with no vaccines in the first 12 months of life and a vaccine refusal diagnosis code; 2) children with consistent vaccine limiting,30 defined as 2 or fewer vaccines per visit at all vaccine visits within the first 12 months of life (regardless of whether a vaccine refusal diagnosis code was present); 3) children who were otherwise undervaccinated, did not meet the definition of vaccine-limiting, and had a vaccine refusal diagnosis code; and 4) children fully vaccinated with no delays (ie, ADU = 0) and no vaccine refusal diagnosis code. These vaccination groups were developed and refined on the basis of prior work.20,21
Children undervaccinated and without a vaccine refusal diagnosis code were not targeted for survey administration. These children likely represent a heterogeneous group who may face barriers to vaccination or care2,31 and would therefore be problematic to include in future safety studies.14,18 Children fully vaccinated with no delays but with a vaccine refusal diagnosis code were also not targeted for surveying (Figure).
Sampling for Survey Administration
A stratified random sample was selected for survey administration, with sampling stratified by vaccination group and VSD site. Sampling was performed with replacement because subjects were occasionally determined to be survey ineligible after sampling, such as because of recent health insurance disenrollment. A total of 2048 subjects were initially sampled, of whom 99 were subsequently found to be survey ineligible. Because 5 of these children could not be replaced within the same stratum, the total survey sample after replacement was 2043 subjects.
Survey Content
The survey instrument, based on a previously developed survey,20 was pilot tested with 10 parents and revised accordingly. The survey assessed whether parent report of their child’s vaccination status (fully vaccinated or undervaccinated) matched EHR vaccine data, and if undervaccinated, whether this was due to parental choice. Additionally, the survey assessed whether the child had received vaccines or health care outside their VSD site. The survey also included questions regarding risk factors for asthma and other allergic diseases to examine whether asthma risk factors varied by vaccination status. Asthma risk factor questions were based on previously published asthma epidemiology studies, including the Children’s Respiratory Study and the International Study of Asthma and Allergies in Childhood.32–34
Survey Administration
Surveys were administered by postal mail (up to 3 attempts) and e-mail (up to 3 attempts). All subjects who had not responded within approximately 6 weeks of survey launch received a reminder telephone call. Because different VSD sites had different rules regarding permitted survey administration methods, subjects from 2 VSD sites (Marshfield Clinic; KP Washington) did not receive surveys by e-mail, and subjects from one VSD site (KP Washington) did not receive a reminder telephone call. The survey was fielded from February 23 through June 8, 2017. A gift card of $20 was provided to survey respondents as compensation.
Analytic Methods
Survey respondents were compared to nonrespondents using chi-square and Student’s t tests. The EHR-derived data used for these comparisons included outpatient health care visit rates, as well as prior allergy- and asthma-related EHR diagnoses. Analyses of survey responses accounted for the complex sampling strategy: survey responses were weighted by the inverse probability of being sampled at each VSD site, and analyses incorporated a design effect to account for stratification by VSD site. Weighted percentages for survey responses were reported with Clopper-Pearson 95% confidence intervals. No adjustment was made to account for survey nonresponse. For each group of undervaccinated children (no vaccines and a vaccine refusal diagnosis; consistent vaccine limiting; undervaccinated and a vaccine refusal diagnosis), parental survey responses were compared to those of fully vaccinated children using Rao-Scott chi-square tests. We used kappa statistics to measure agreement between parental self-report of vaccination status and allergic conditions versus EHR-derived data. All analyses were conducted by SAS 9.4 (SAS Institute, Cary, NC).
Results
Survey Sample and Survey Response
The demographic characteristics and health care utilization of the survey sample are presented in Table 1. As anticipated, several characteristics differed by vaccination category. For example, children with no vaccines and a vaccine refusal diagnosis had fewer outpatient visits and fewer well-child visits in the first and second years of life compared to fully vaccinated children with no delays and no vaccine refusal diagnosis (Table 1).
Table 1.
Demographic and Utilization Characteristics of Survey Sample (N = 2043) Stratified by Vaccination Pattern Observed in Electronic Health Record–Derived Vaccine Data*
| Characteristic | No Vaccines, With Vaccine Refusal (n = 490) | Consistent Vaccine Limiting, Regardless of Vaccine Refusal (n = 479) | Otherwise Undervaccinated, With Vaccine Refusal (n = 472) | Fully Vaccinated, No Delays, No Vaccine Refusal (n = 602) |
|---|---|---|---|---|
| Child age (mo), mean (SD) | 29.3 (4.4) P < .001 | 29.4 (5.2) P < .001 | 30.3 (5.0) P < .0001 | 28.2 (5.7) |
| Child female sex, column % | 46.1 (P = .12) | 48.6 (P = .47) | 47.9 (P = .33) | 50.8 |
| Child race/ethnicity, column % | ||||
| Non-Hispanic white | 52.9 | 53.4 | 36.0 | 51.2 |
| Non-Hispanic black | 1.0 | 0.5 | 4.2 | 2.2 |
| Hispanic, any race | 16.3 | 13.6 | 18.2 | 10.1 |
| Asian | 2.5 | 2.5 | 4.7 | 8.5 |
| Other and multiracial | 5.3 | 3.6 | 3.8 | 2.7 |
| Missing | 22.0 | 24.8 | 33.1 | 24.4 |
| P < .0001 | P < .01 | P < .0001 | ||
| No. of outpatient visits, mean (SD) | ||||
| Between 30 and 364 days of age | 5.9 (3.4) P < .0001 | 9.0 (5.0) P < .01 | 7.8 (4.4) P = .31 | 8.1 (5.0) |
| Between 365 and 730 days of age | 3.9 (3.8) P < .0001 | 6.7 (6.8) P = .16 | 5.8 (4.3) P = .27 | 6.1 (6.0) |
| No. of well-child visits, mean (SD) | ||||
| Between 30 and 364 days of age | 3.3 (0.9) P < .0001 | 3.8 (0.8) P = .02 | 3.6 (0.8) P < .0001 | 3.9 (0.7) |
| Between 365 and 730 days of age | 1.5 (1.0) P < .0001 | 2.1 (0.9) P = .03 | 1.9 (0.8) P < .0001 | 2.2 (0.7) |
P values represent responses within each group compared to responses among fully vaccinated subjects. P values were calculated by chi-square test for categorical variables and t tests for continuous variables.
Among the survey sample of 2043 parents, 1209 completed the survey, for an overall response of 59.2%. Survey response was higher among parents of fully vaccinated children than among parents of undervaccinated children (67.1% vs 55.9%, respectively, P < .01). Respondents were not significantly different than nonrespondents with respect to child age, child sex, and the number of outpatient visits within the first year of life (data not shown). Also, respondents were not significantly more or less likely than nonrespondents to have had a diagnosis of asthma (13.7% vs 15.2%, respectively, P = .34), eczema (30.4% vs 29.5%, respectively, P = .68), food allergies (3.6% vs 3.5%, respectively, P = .85), or allergic rhinitis (7.0% vs 7.4%, respectively, P = .68) in EHR data. However, survey respondents differed from nonrespondents with respect to the child’s race/ethnicity (eg, 53.8% of respondents were non-Hispanic white vs 41.8% of nonrespondents, P < .001). The number of well-child visits in the second year of life also differed (2.0 visits for respondents vs 1.8 for nonrespondents, P < .001).
Confirmation of Vaccination Status
Parents were asked about their child’s current vaccination status. As shown in Table 2, relatively few parents (3.1% to 6.6%) reported that their child had received any vaccines outside their VSD site. Parents’ reports of their vaccination decisions and their child’s vaccination status generally corresponded to the vaccination pattern observed in EHR vaccination data. For example, 95.1% of parents in the group with no vaccines reported having refused vaccines, and 92.8% of parents in the consistent vaccine-limiting group reported having delayed vaccines, whereas few parents in the fully vaccinated group reported ever having refused (2.3%) or delayed (5.2%) any vaccines. For receiving no vaccines, the observed agreement between parent report and EHR data was 94.0% (κ= 0.79, 95% confidence interval [CI] 0.75–0.84); for receiving all vaccines on time, the observed agreement was 87.3% (κ= 0.73, 95% CI 0.69–0.77).
Table 2.
Parental Report of Vaccination Decisions and Child Vaccination Status Stratified by Apparent Vaccination Pattern*
| Item | No Vaccines, With Vaccine Refusal (n = 241) | Consistent Vaccine- Limiting, Regardless of Vaccine Refusal (n = 313) | Otherwise Undervaccinated, With Vaccine Refusal (n = 251) | Fully Vaccinated, No Delays, No Vaccine Refusal (n = 404) |
|---|---|---|---|---|
| Has your child received any vaccines at any place other than at [their respective VSD site]?† | 3.1 (1.3–6.3) | 5.2 (2.7–9.1) | 5.5 (2.4–10.4) | 6.6 (2.5–13.7) |
| Has there ever been a time when you chose not to get a vaccine for your child?‡ | 95.1 (91.2–97.6) | 53.7 (46.9–60.4) | 29.2 (22.0–37.2) | 2.3 (0.3–7.8) |
| Has there ever been a time when you chose to delay getting a vaccine for your child?§ | 89.3 (84.5–93.0) | 92.8 (88.4–96.0) | 46.9 (38.3–55.6) | 5.2 (1.8–11.3) |
| Parent report of their child’s vaccination status‖ | ||||
| My child has received all recommended vaccines on time | 1.4 (0.3–4.1) | 9.3 (5.8–14.0) | 51.3 (42.5–60.0) | 92.1 (85.2–96.4) |
| My child has received all recommended vaccines but some were not on time or were delayed | 3.2 (1.3–6.6) | 37.0 (30.6–43.7) | 24.2 (17.3–32.4) | 6.6 (2.8–12.9) |
| My child has received some but not all recommended vaccines | 22.9 (17.5–29.0) | 52.7 (46.0–59.3) | 23.5 (16.9–31.4) | 1.3 (0.0–6.7) |
| My child has not received any vaccines | 72.4 (66.1–78.2) | 1.0 (0.1–3.7) | 0.9 (0.1–3.0) | 0 |
VSD indicates Vaccine Safety Datalink.
Apparent vaccination pattern is based on electronic health record vaccination data; numbers represent weighted percent responding “yes,” with corresponding 95% confidence intervals in parentheses. Survey responses weighted by inverse probability of being sampled at each VSD site; analyses incorporated design effect to account for stratification of sampling by VSD site.
Parents were instructed not to consider hepatitis B vaccine given in hospital to their newborn after birth.
Parents were instructed to respond “no” if only vaccine they had chosen not to get was influenza vaccine.
Parents were instructed to respond “no” if only reason they had delayed vaccination was because their child was sick at time vaccines were due.
Parents were instructed to choose one best response from list of options.
Table 2 also highlights several circumstances in which EHR-based vaccination status appeared to differ from parental report. For example, 51.3% of parents of children otherwise undervaccinated with a vaccine refusal diagnosis code reported having received all recommended vaccines on time. Among these children, the majority (58.2%) had a vaccine refusal diagnosis code occur only once; the majority (60.6%) of first vaccine refusal codes occurred during influenza vaccination season (October through January); and the majority (59.4%) caught up with all recommended vaccine doses by 24 months of age, although by definition at least some vaccination delay was observed.
Asthma-Related Risk Factors
Parents’ reports of asthma-related risk factors within the 3 undervaccinated groups were compared to those of fully vaccinated children (Table 3). The prevalence of several risk factors did not differ significantly between undervaccinated and fully vaccinated children. For example, comparing children with no vaccines to those who were fully vaccinated, parents’ reports of their child ever having wheezed (28.7% vs 37.4%, respectively), having wheezed apart from colds (5.2% vs 2.8%), having been diagnosed with eczema by a health care provider (20.7% vs 27.7%), maternal history of asthma (18.9% vs 17.3%), and paternal history of asthma (13.2% vs 13.2%) did not differ significantly between these groups. Parents’ reports of provider-diagnosed food allergies also did not differ significantly between vaccine groups.
Table 3.
Parental Report of Allergy- and Asthma-Related Risk Factors for Child*
| Item | No Vaccines, With Vaccine Refusal Diagnosis (n = 241) | Consistent Vaccine Limiting, Regardless of Vaccine Refusal Diagnosis (n = 313) | Otherwise Undervaccinated, With Vaccine Refusal Diagnosis (n = 251) | Fully Vaccinated, No Delays, No Vaccine Refusal Diagnosis (n = 404) |
|---|---|---|---|---|
| Has your child’s chest ever sounded wheezy or whistling? | 28.7 (22.9–35.1) P = .11 | 43.2 (36.6–50.1) P = .31 | 50.4 (41.6–59.2) P = .04 | 37.4 (28.3–47.1) |
| Has your child’s chest sounded wheezy or whistling, at times other than during colds? | 5.2 (2.7–9.1) P = .31 | 6.8 (3.8–11.0) P = .13 | 10.2 (5.4–16.9) P = .02 | 2.8 (0.6–7.8) |
| Has your child had wheezing or whistling in his or her chest 4 or more times in past 12 months? | 4.0 (1.9–7.4) P = .58 | 7.8 (4.6–12.4) P = .43 | 9.4 (4.9–15.8) P = .27 | 5.4 (1.8–11.9) |
| Has your child’s biological mother ever been diagnosed with asthma by a doctor or other health professional? | 18.9 (13.8–25.0) P = .72 | 17.7 (12.9–23.4) P = .92 | 17.2 (11.3–24.6) P = .99 | 17.3 (10.6–25.9) |
| Has your child’s biological father ever been diagnosed with asthma by a doctor or other health professional? | 13.2 (9.0–18.4) P = .99 | 13.1 (9.1–18.2) P = .98 | 10.0 (5.6–16.1) P = .41 | 13.2 (7.8–20.5) |
| Has your child ever had a problem with sneezing, or a runny or blocked nose…and a doctor or other health professional thought these symptoms were due to allergies? | 8.1 (4.8–12.7) P = .67 | 10.7 (6.9–15.7) P = .75 | 14.5 (8.8–22.1) P = .26 | 9.6 (4.7–16.8) |
| Has a doctor or other health professional ever told you that your child has eczema? (Eczema is itchy, scaly red rash that comes and goes for months) | 20.7 (15.5–26.7) P = .16 | 26.6 (20.8–32.9) P = .83 | 28.5 (20.9–37.1) P = .89 | 27.7 (19.5–37.2) |
| Did your child’s biological mother smoke cigarettes while she was pregnant with this child? | 0.2 (0.0–1.9) P = .05 | 0.7 (0.1–2.6) P = .40 | 0.1 (0.0–1.6) P < .001 | 1.7 (0.2–6.4) |
| Did your child’s mother (or female caretaker) smoke cigarettes during your child’s first year of life? | 0.2 (0.0–1.9) P = .58 | 2.8 (1.0–6.0) P < .001 | 0.1 (0.0–1.7) P = .17 | 0.4 (0.0–1.6) |
| Does your child’s mother (or female caretaker) currently smoke cigarettes? | 0 | 1.1 (0.2–3.7) P = .94 | 2.1 (0.5–5.8) P = .54 | 1.2 (0.1–4.7) |
| Does your child’s father (or male caretaker) currently smoke cigarettes? | 2.5 (0.9–5.4) P = .29 | 4.0 (1.9–7.3) P = .81 | 5.9 (2.6–11.4) P = .62 | 4.5 (1.7–9.6) |
| Has your child ever been diagnosed by a doctor or other health professional as being allergic to pollen, house dust, cat dander, or dog dander? | 3.8 (1.7–7.4) P < .001 | 3.4 (1.4–6.9) P < .001 | 4.4 (1.6–9.4) P < .001 | 0.4 (0.1–0.6) |
| Has your child ever been diagnosed by a doctor or other health professional as being allergic to any of following foods? | ||||
| Peanuts | 1.3 (0.3–3.9) P = .57 | 2.8 (1.0–6.0) P = .73 | 3.7 (1.1–8.8) P = .48 | 2.1 (0.4–6.4) |
| Cow’s milk | 5.0 (2.5–8.9) P = .19 | 6.4 (3.6–10.4) P = .08 | 6.9 (3.4–12.3) P = .07 | 2.2 (0.4–6.4) |
| Eggs | 2.6 (0.9–5.7) P = .86 | 3.1 (1.2–6.3) P = .95 | 2.2 (0.4–6.8) P = .74 | 2.9 (0.7–7.8) |
| Parent report that their child was ever breastfed or fed breast milk | 97.5 (95.4–99.7) P < .01 | 98.9 (97.5–100.0) P < .001 | 92.7 (88.3–97.2) P = .49 | 90.1 (84.1–96.1) |
| Parent report that their child was older than 6 months when child completely stopped breastfeeding or being fed breast milk | 86.2 (81.6–90.8) P < .0001 | 81.4 (76.3–86.6) P < .001 | 57.6 (49.1–66.1) P = .62 | 60.8 (51.4–70.21) |
Numbers represent weighted percent responding “yes,” with corresponding 95% confidence intervals in parentheses. Survey responses weighted by inverse probability of being sampled at each Vaccine Safety Datalink site; analyses incorporated a design effect to account for this stratification of sampling by site. P values represent Rao-Scott chi-square test comparing each response to response among fully vaccinated subjects.
However, several significant differences were observed between undervaccinated groups and the comparison group of fully vaccinated children (Table 3). For example, parent-reported aeroallergen sensitivity (eg, allergy to pollen, house dust, cat dander, or dog dander) was significantly higher in undervaccinated groups compared to fully vaccinated children (P < .001 for all comparisons with the fully vaccinated group). As is also shown in Table 3, parents of children in the no vaccines and consistent vaccine-limiting groups were more likely to report ever having breastfed and breastfeeding after 6 months of age compared to fully vaccinated children. Although reports of exposure to tobacco during pregnancy or early childhood were uncommon, parents in the consistent vaccine-limiting group were more likely to report maternal smoking during the child’s first year of life than parents of fully vaccinated children.
We also examined parents’ reports of eczema and allergic rhinitis compared to EHR diagnoses for these same conditions. Parents’ report of their child having provider-diagnosed eczema was moderately correlated with an eczema diagnosis code being present within the same child’s HER data (κ= 0.46, 95% CI 0.41–0.52). For example, among 312 parents who reported their child having eczema, an EHR diagnosis of eczema was present in 208 children (66.7%). The agreement between parent report of allergic rhinitis and an EHR diagnosis of the same condition was lower (κ= 0.18, 95% CI 0.12–0.24).
Use of Other Sources of Health Care
As shown in Table 4, across the 3 undervaccinated groups and the fully vaccinated comparison group, between 15.5% and 21.4% of parents reported having taken their child to someplace other than their VSD site to obtain health care; the prevalence of this behavior did not differ significantly between groups. Between 90.2% and 97.6% of parents across surveyed groups reported that if their child had an urgent need for health care, they would take their child to their VSD site for care if a clinic was nearby and open. Finally, parent-reported use of alternative medical providers for their child (eg, chiropractor, naturalist, homeopath, or acupuncturist) differed significantly between groups (P < .001 for all comparisons with the fully vaccinated group).
Table 4.
Parental Report of Care-Seeking Behavior for Child Stratified by Apparent Vaccination Pattern Based on Electronic Health Record Vaccination Data*
| Item | No Vaccines, With Vaccine Refusal (n = 241) | Consistent Vaccine-Limiting, Regardless of Vaccine Refusal (n = 313) | Otherwise Undervaccinated, With Vaccine Refusal (n = 251) | Fully Vaccinated, No Delays, No Vaccine Refusal (n = 404) |
|---|---|---|---|---|
| Not counting time in hospital after your child was born, have you ever taken your child to someplace other than [their respective VSD site]? | 20.9 (15.8–26.7) P = .35 | 15.5 (11.2–20.8) P = .80 | 21.4 (14.8–29.3) P = .34 | 16.6 (10.2–24.8) |
| If your child had urgent need for health care, would you take them to [their respective VSD site] to get care, if a clinic was open and nearby? | 93.2 (89.2–96.1) P = .34 | 95.5 (92.3–97.7) P = .06 | 97.6 (94.1–99.3) P = .01 | 90.2 (82.6–95.3) |
| Have you ever taken your child to alternative medicine provider outside of [their respective VSD site], such as a chiropractor, naturalist, homeopath, or acupuncturist? | 34.7 (28.4–41.4) P < .001 | 17.4 (12.8–22.8) P < .001 | 9.5 (5.3–15.5) P < .001 | 0.8 (0.2–2.25) |
| Do you have any health insurance that covers your child, other than your insurance at [their respective VSD site]? | 4.1 (2.0–7.4) P = .03 | 6.2 (3.6–9.9) P = .22 | 6.9 (3.2–12.7) P = .39 | 10.0 (4.9–17.6) |
VSD indicates Vaccine Safety Datalink. P values represent Rao-Scott chi-square test comparing each response to response among fully vaccinated subjects.
Numbers represent weighted percent responding “yes,” with corresponding 95% confidence intervals. Survey responses weighted by inverse probability of being sampled at each VSD site; analyses incorporated a design effect to account for this stratification of sampling by VSD site.
Discussion
Important opportunities and significant challenges exist to using observational EHR-based data to assess the recommended childhood immunization schedule and subsequent risk of allergic diseases.14,17,18 To build a foundation for future studies in this area, we conducted surveys of parents to examine 2 distinct issues: the risk of misclassification of vaccination status and the potential for unmeasured confounding if risk factors for asthma and other allergic diseases varied by vaccination status. For children who appeared un- or undervaccinated as a result of parental choice, a high proportion of parents verified their child’s vaccination status, particularly for those with no vaccines and those who were consistently vaccine limiting. Although most risk factors for asthma did not differ significantly between children in the different vaccination groups studied, there were significant differences in parental report of several risk factors (eg, aeroallergen sensitivity, breastfeeding).
The IOM committee proposed that adverse health outcomes could be examined in children whose parents intentionally refused or delayed vaccines.14 In prior work, we found that a combination of EHR vaccine and diagnosis data could be used to identify distinct groups of un- and undervaccinated children.20,21 The current study examined the risk of misclassification of vaccination status within these groups: we found that misclassification (eg, due to missing vaccine data) appeared to be relatively minimal for children with no vaccines and a diagnosis code for vaccine refusal, and for children whose parents consistently vaccine limit. Children otherwise undervaccinated with a diagnosis code for vaccine refusal appeared more prone to misclassification, as 51.3% of parents reported that their child had received all recommended vaccines on time. Potential reasons for this finding include the following: the refusal code may have represented only refusal of influenza vaccine, which was not considered in our measures of undervaccination; parents may not have known their children missed, or received late, certain vaccines; or parents may have taken their children elsewhere for vaccines. In the context of future safety studies, restricting the study population to children whose vaccination status is unlikely to be misclassified will be necessary, although doing so may limit sample size and statistical power.
Because parents who intentionally refuse or delay vaccines for their children have different health-related attitudes and experiences than parents of fully vaccinated children,21 it is plausible that reported asthma risk factors could also differ among these families. In the current investigation, we found that some asthma risk factors (eg, a family history of asthma) did not vary significantly between the different vaccination groups while others did (eg, report of ever having wheezed, between otherwise undervaccinated compared to fully vaccinated). In the context of observational studies using EHR data, it is important to note that some potentially confounding variables may be ascertained from the EHR (eg, physician diagnosis of eczema) whereas other variables may be missing (eg, family history of asthma). Additionally, parents’ reports of allergic conditions such as eczema and allergic rhinitis may not match what is documented in the EHR, further complicating efforts to control for these potentially confounding variables.
How can the safety of the recommended immunization schedule, specifically the risk of allergic diseases such as asthma, be assessed while adequately addressing the many recognized challenges to validity?14,17,18 As mentioned above, restriction is one approach to minimizing the misclassification of vaccination status in future studies. Other techniques, such as quantitative bias analysis, could also be useful, particularly as a means of addressing unmeasured confounding.35 With quantitative bias analysis, the strength of association between the confounder and the outcome, as well as the prevalence of this confounder in the different exposure groups, can be used to estimate a “corrected” exposure–outcome association, accounting for the unmeasured confounder.35 To accomplish this in studies of immunization schedule safety, the strength of association between a risk factor and an outcome (eg, between a maternal history of asthma and asthma risk in the child) can be obtained from published literature, while surveys such as the one presented here can help estimate the distribution of risk factors among different vaccination groups. A recent study of bacillus Calmette-Guérin vaccination and asthma risk used 2-stage sampling and telephone interviews to collect data on asthma risk factors from a subset of individuals from a large Canadian disease registry;36 similar methods could be considered for future VSD studies.
This study is subject to several potential limitations. Parents of children undervaccinated but without a vaccine refusal diagnosis code were not surveyed; the rationale for excluding this group was because the undervaccination may reflect barriers to accessing care,2,31 which could lead to missing data on health outcomes of interest. Parents who intentionally miss well-child visits as a means of avoiding vaccination would not have been surveyed because we excluded children with fewer than 2 well-child visits before 12 months of age. Parents of undervaccinated children had a lower survey response than parents of fully vaccinated children, study results were not adjusted for survey nonresponse, and nonresponse bias could have affected results. Although respondents did not differ from nonrespondents with respect to allergy-related diagnoses in the EHR, these groups could have differed in other characteristics. Additionally, it is possible that parents did not recall having missed vaccine visits, or they may have misinterpreted survey questions related to vaccinating “on time.” In future vaccine safety studies, we would rely on EHR vaccine data as the reference standard, a decision supported by our finding that few parents reported receiving vaccines elsewhere. Finally, many environmental and genetic risk factors have been associated with the development of asthma and allergies in epidemiological studies; because of constraints of survey length, we focused on a more limited number of risk factors, particularly on asthma risk factors from the Children’s Respiratory Study and the International Study of Asthma and Allergies in Childhood.32–34
In conclusion, we conducted a large multisite survey to help plan future safety studies of the recommended immunization schedule, particularly the speculated association between the schedule and the risk of asthma and other allergic disorders. Parents’ reports of their child’s vaccination status generally corresponded to vaccination patterns observed within EHR data. Although most asthma risk factors reported by parents did not differ significantly between children in the vaccination groups studied, several risk factors differed between groups. These findings indicate that measurement and control of disease risk factors should be carefully considered in observational studies of the safety of the recommended childhood immunization schedule.
What’s New.
In an established research network, misclassification of vaccination status was uncommon. Parents’ reports of asthma risk factors generally did not vary by vaccination status. These data will be useful to help address confounding and bias in future vaccine safety studies.
Acknowledgment
This research was funded by the Centers for Disease Control and Prevention (CDC) through a Task Order (contract 200–2012-53582–0009), issued as part of the VSD project (contract 200–2012-53582).
HQM reports prior research support from MedImmune unrelated to this study. NPK reports research support from GlaxoSmithKline, Pfizer, Merck & Co, Sanofi Pasteur, Protein Science, MedImmune, and Dynavax unrelated to this study. MLJ reports research support from Sanofi Pasteur unrelated to this study.
Footnotes
The other authors have no conflicts of interest to disclose.
Contributor Information
Drs Matthew F. Daley, Department of Pediatrics, University of Colorado School of Medicine Aurora, Colo; Institute for Health Research, Kaiser Permanente Colorado.
Drs Jo Ann Shoup, Institute for Health Research, Kaiser Permanente Colorado.
Ms Sophia R. Newcomer, Institute for Health Research, Kaiser Permanente Colorado.
Dr Michael L. Jackson, Kaiser Permanente Washington Health Research Institute, Seattle, Wash.
Ms Holly C. Groom, Kaiser Permanente Northwest, Portland, Ore.
Dr Steven J. Jacobsen, Kaiser Permanente Southern California, Pasadena.
Dr Huong Q. McLean, Marshfield Clinic Research Institute Marshfield, Wisc.
Dr Nicola P. Klein, Kaiser Permanente Northern California Oakland, Calif.
Mr Eric S. Weintraub, Immunization Safety Office, Division of Healthcare Quality Promotion, National Center for Emerging and Zoonotic Infectious Diseases, Centers for Disease Control and Prevention Atlanta, Ga.
Dr Michael M. McNeil, Immunization Safety Office, Division of Healthcare Quality Promotion, National Center for Emerging and Zoonotic Infectious Diseases, Centers for Disease Control and Prevention Atlanta, Ga.
Drs Jason M. Glanz, Institute for Health Research, Kaiser Permanente Colorado.
References
- 1.Hill HA, Elam-Evans LD, Yankey D, et al. Vaccination coverage among children aged 19–35 months—United States, 2015. MMWR Morb Mortal Wkly Rep 2016;65:1065–1071. [DOI] [PubMed] [Google Scholar]
- 2.Hill HA, Elam-Evans LD, Yankey D, et al. Vaccination coverage among children aged 19–35 months—United States, 2016. MMWR Morb Mortal Wkly Rep 2017;66:1171–1177. [DOI] [PMC free article] [PubMed] [Google Scholar]
- 3.Dempsey AF, Schaffer S, Singer D, et al. Alternative vaccination schedule preferences among parents of young children. Pediatrics 2011;128:848–856. [DOI] [PubMed] [Google Scholar]
- 4.McCauley MM, Kennedy A, Basket M, et al. Exploring the choice to refuse or delay vaccines: a national survey of parents of 6-through 23-month-olds. Acad Pediatr 2012;12:375–383. [DOI] [PubMed] [Google Scholar]
- 5.Frew PM, Fisher AK, Basket MM, et al. Changes in childhood immunization decisions in the United States: results from 2012 and 2014 National Parental Surveys. Vaccine 2016;34:5689–5696. [DOI] [PMC free article] [PubMed] [Google Scholar]
- 6.Freed GL, Clark SJ, Butchart AT, et al. Parental vaccine safety concerns in 2009. Pediatrics 2010;125:654–659. [DOI] [PubMed] [Google Scholar]
- 7.Gust DA, Darling N, Kennedy A, et al. Parents with doubts about vaccines: which vaccines and reasons why. Pediatrics 2008;122:718–725. [DOI] [PubMed] [Google Scholar]
- 8.Hilton S, Petticrew M, Hunt K. Combined vaccines are like a sudden onslaught to the body’s immune system: parental concerns about vaccine “overload” and “immune-vulnerability.” Vaccine 2006;24:4321–327. [DOI] [PubMed] [Google Scholar]
- 9.Kennedy A, Lavail K, Nowak G, et al. Confidence about vaccines in the United States: understanding parents’ perceptions. Health Aff (Millwood) 2011;30:1151–1159. [DOI] [PubMed] [Google Scholar]
- 10.Lieu TA, Zikmund-Fisher BJ, Chou C, et al. Parents’ perspectives on how to improve the childhood vaccination process. Clin Pediatr (Phila) 2017;56:238–246. [DOI] [PubMed] [Google Scholar]
- 11.Akinbami LJ, Simon AE, Rossen LM. Changing trends in asthma prevalence among children. Pediatrics 2016;137. [DOI] [PMC free article] [PubMed] [Google Scholar]
- 12.Akinbami LJ, Simon AE, Schoendorf KC. Trends in allergy prevalence among children aged 0–17 years by asthma status, United States, 2001–2013. J Asthma 2016;53:356–362. [DOI] [PMC free article] [PubMed] [Google Scholar]
- 13.Robinson CL, Romero JR, Kempe A, et al. Advisory Committee on Immunization Practices recommended immunization schedule for children and adolescents aged 18 years or younger—United States, 2017. MMWR Morb Mortal Wkly Rep 2017;66:134–135. [DOI] [PMC free article] [PubMed] [Google Scholar]
- 14.Institute of Medicine. Childhood Immunization Schedule and Safety: Stakeholder Concerns, Scientific Evidence, and Future Studies Washington, DC: National Academies Press; 2013. Available at: https://www.nap.edu/catalog/13563/the-childhood-immunization-schedule-and-safety-stakeholder-concerns-scientific-evidence. Accessed May 23, 2016. [PubMed] [Google Scholar]
- 15.Baggs J, Gee J, Lewis E, et al. The Vaccine Safety Datalink: a model for monitoring immunization safety. Pediatrics 2011;127(suppl 1):S45–S53. [DOI] [PubMed] [Google Scholar]
- 16.McNeil MM, Gee J, Weintraub ES, et al. The Vaccine Safety Datalink: successes and challenges monitoring vaccine safety. Vaccine 2014;32:5390–5398. [DOI] [PMC free article] [PubMed] [Google Scholar]
- 17.Jackson ML. Challenges in comparing the safety of different vaccination schedules. Vaccine 2013;31:2126–2129. [DOI] [PubMed] [Google Scholar]
- 18.Glanz JM, Newcomer SR, Jackson ML, et al. White paper on studying the safety of the childhood immunization schedule in the Vaccine Safety Datalink. Vaccine 2016;34(suppl 1):A1–A29. [DOI] [PubMed] [Google Scholar]
- 19.Mullooly J, Drew L, Destefano F, et al. Quality of HMO vaccination databases used to monitor childhood vaccine safety. Vaccine Safety Datalink Team. Am J Epidemiol 1999;149:186–194. [DOI] [PubMed] [Google Scholar]
- 20.Daley MF, Glanz JM, Newcomer SR, et al. Assessing misclassification of vaccination status: implications for studies of the safety of the childhood immunization schedule. Vaccine 2017;35:1873–1878. [DOI] [PMC free article] [PubMed] [Google Scholar]
- 21.Glanz JM, Newcomer SR, Narwaney KJ, et al. A population-based cohort study of undervaccination in 8 managed care organizations across the United States. JAMA Pediatr 2013;167:274–281. [DOI] [PubMed] [Google Scholar]
- 22.Glanz JM, Wagner NM, Narwaney KJ, et al. A mixed methods study of parental vaccine decision making and parent-provider trust. Acad Pediatr 2013;13:481–488. [DOI] [PMC free article] [PubMed] [Google Scholar]
- 23.Sukumaran L, McCarthy NL, Li R, et al. Demographic characteristics of members of the Vaccine Safety Datalink (VSD): a comparison with the United States population. Vaccine 2015;33:4446–4450. [DOI] [PMC free article] [PubMed] [Google Scholar]
- 24.Kieke AL, Kieke BA Jr, Kopitzke SL, et al. Validation of health event capture in the Marshfield Epidemiologic Study Area. Clin Med Res 2015;13:103–111. [DOI] [PMC free article] [PubMed] [Google Scholar]
- 25.Fuller JE, Walter EB Jr, Dole N, et al. State-level immunization information systems: potential for childhood immunization data linkages. Matern Child Health J 2017;21:29–35. [DOI] [PMC free article] [PubMed] [Google Scholar]
- 26.Luman ET, Barker LE, Shaw KM, et al. Timeliness of childhood vaccinations in the United States: days undervaccinated and number of vaccines delayed. JAMA 2005;293:1204–1211. [DOI] [PubMed] [Google Scholar]
- 27.Centers for Disease Control and Prevention. Advisory Committee on Immunization Practices recommended immunization schedules for persons aged 0 through 18 years—United States, 2014. MMWR Morb Mortal Wkly Rep 2014;63:108–109. [PMC free article] [PubMed] [Google Scholar]
- 28.Centers for Disease Control and Prevention. Advisory Committee on Immunization Practices recommended immunization schedules for persons aged 0 through 18 years—United States, 2015. MMWR Morb Mortal Wkly Rep 2015;64:93–94. [PMC free article] [PubMed] [Google Scholar]
- 29.Centers for Disease Control and Prevention. Advisory Committee on Immunization Practices recommended immunization schedules for persons aged 0 through 18 years—United States, 2016. MMWR Morb Mortal Wkly Rep 2016;65:86–87. [DOI] [PubMed] [Google Scholar]
- 30.Robison SG, Groom H, Young C. Frequency of alternative immunization schedule use in a metropolitan area. Pediatrics 2012;130:32–38. [DOI] [PubMed] [Google Scholar]
- 31.Esposito S, Principi N, Cornaglia G, et al. Barriers to the vaccination of children and adolescents and possible solutions. Clin Microbiol Infect 2014;20(suppl 5):25–31. [DOI] [PubMed] [Google Scholar]
- 32.Castro-Rodriguez JA, Holberg CJ, Wright AL, et al. A clinical index to define risk of asthma in young children with recurrent wheezing. Am J Respir Crit Care Med 2000;162(4 pt 1):1403–1406. [DOI] [PubMed] [Google Scholar]
- 33.Castro-Rodriguez JA. The Asthma Predictive Index: a very useful tool for predicting asthma in young children. J Allergy Clin Immunol 2010;126:212–216. [DOI] [PubMed] [Google Scholar]
- 34.Mitchell EA, Beasley R, Keil U, et al. The association between tobacco and the risk of asthma, rhinoconjunctivitis and eczema in children and adolescents: analyses from Phase Three of the ISAAC programme. Thorax 2012;67:941–949. [DOI] [PubMed] [Google Scholar]
- 35.Lash TL, Fox MP, Fink AK. Applying Quantitative Bias Analysis to Epidemiologic Data New York, NY: Springer; 2011. [Google Scholar]
- 36.El-Zein M, Conus F, Benedetti A, et al. Association between bacillus Calmette-Guerin vaccination and childhood asthma in the Quebec Birth Cohort on Immunity and Health. Am J Epidemiol 2017;186:344–355. [DOI] [PMC free article] [PubMed] [Google Scholar]