Abstract
Pitch estimation in diverse naturalistic audio streams remains a challenge for speech processing and spoken language technology. In this study, we investigate the use of robust harmonic features for classification-based pitch estimation. The proposed pitch estimation algorithm is composed of two stages: pitch candidate generation and target pitch selection. Based on energy intensity and spectral envelope shape, five types of robust harmonic features are proposed to reflect pitch associated harmonic structure. A neural network is adopted for modeling the relationship between input harmonic features and output pitch salience for each specific pitch candidate. In the test stage, each pitch candidate is assessed with an output salience that indicates the potential as a true pitch value, based on its input feature vector processed through the neural network. Finally, according to the temporal continuity of pitch values, pitch contour tracking is performed using a hidden Markov model (HMM), and the Viterbi algorithm is used for HMM decoding. Experimental results show that the proposed algorithm outperforms several state-of-the-art pitch estimation methods in terms of accuracy in both high and low levels of additive noise.
Keywords: Fundamental frequency, F0, neural network, pitch estimation, robust harmonic feature
I. Introduction
PITCH is the perceived interpretation of the fundamental frequency (F0) within an acoustic audio stream. In this study, we treat pitch and F0 as having the same meaning. Since pitch carries important characteristics of the audio signal, such as speech prosody and music melody, accurate pitch estimation becomes essential for many audio signal processing and spoken language technology systems, (e.g., sound source separation, language/speaker identification, emotion recognition, music transcription, dialog system, etc.). Pitch detection has also been applied to the diagnosis of mental diseases [1], [2].
Earlier studies on pitch estimation either capitalize on the periodic pattern in the time domain, or leverage the harmonic structure in the frequency domain. Based on this principle, a number of pitch estimation algorithms have been proposed by [3]–[5]. In the time domain, an autocorrelation function (ACF), or an average magnitude difference function (AMDF), is applied directly to the waveform to measure the similarity between the original signal and its delayed version [6]–[8]. In the frequency domain, subharmonic summation or subharmonic production [9], [10] are used to estimate pitch by compressing the spectrum along the frequency axis with a series of integer factors, followed by adding (or multiplying) original and manipulated spectra. Consequently, all harmonic partials are therefore moved to the same location and constructively added together to generate a superimposed global peak associated with the expected true pitch. Alternatively, a comb filter has also been used for pitch estimation in the frequency domain [11]. The output of the comb filter reaches a maximum value when passband of the comb filter lines up with the harmonics.
Most of these pitch estimation algorithms can achieve high accuracy in clean or moderately noisy environments. However, the performance drops significantly at low signal-to-noise ratio (SNR) due to severe distortion of the pitch related harmonic structure. Therefore, pitch estimation in noisy naturalistic environments remains a challenging research problem.
To improve the robustness of pitch estimation in noisy environments, numerous approaches have been proposed using advanced signal processing methods. For example, adaptive speech representations such as wavelet transforms [12], [13] as well as the Gaussian basis function decomposition [14] have been employed to improve harmonic resolution. The temporal accumulated spectrum was proposed by [15] to enhance target speech harmonics from noise. In the study by [16], long-term average speech spectrum (LTASS) normalization was used to attenuate noise prior to pitch estimation. It has been shown that alternatively speech separation and pitch estimation processing can benefit from each other [17], [18]. Sparsity characteristics of speech have also inspired a number of methods to improve pitch estimation accuracy [19]–[24].
Besides signal processing strategies which are able to provide noise robust speech representation, statistical model based methods have also been proposed to deal with noise robust pitch estimation [25]–[28], [29]. Usually, a statistical model is created for the observed noisy speech in terms of a probability density function (PDF) parameterized by the pitch. The parameters are estimated with either a maximum likelihood or maximum a posteriori (MAP) method. For example, in [30], [31], the observed spectrum is modeled as a Gaussian mixture model (GMM) representing a sequence of spectral clusters, each governed by a common F0 contour. Next, the expectation maximization (EM) algorithm was applied for simultaneous estimation of pitch and harmonic structures. In [32], F0 estimation accuracy was improved by modeling the effects of noise on voiced speech spectra in a probabilistic framework. In their study, prominent SNR spectral peaks serve as the robust information source for estimating F0.
Machine learning algorithms have also been attempted for pitch estimation due to their explicit modeling capability to learn complex patterns of harmonic structure. For example, an artificial neural network (ANN) was applied for pitch candidate modeling and classification in a number of studies [33]–[35]. Principle component analysis (PCA) was proposed by [35] to reduce the dimensionality of sub-band autocorrelation based features for ANN model. A clustering-based method was proposed by [36] to perform multi-pitch analysis. In [37], a deep neural network (DNN)-based approach was proposed for noise robust pitch estimation. In their study, a preprocessed spectrum was used as the direct input to a large sized neural network without any feature extraction stage. The large size DNN-based methods is able to decrease estimation bias with its complex modeling ability. Meanwhile, the estimation variance tends to increase and requires more training data to fit the model, inevitably resulting in a heavy computational cost [38].
We infer that, given effective features, pitch estimation accuracy can be improved without increasing the complexity of the classification model. In past research, pitch related feature extraction is seldom studied under the statistical or machine learning framework. For instance, time domain periodic feature extraction followed by neural network modeling was proposed for pitch estimation by [33], though the time waveform based features are relatively sensitive to noise. Alternatively, the spectral energies over a series of semitone bins were directly submitted into a neural network for pitch detection in [34]. However, the formant information involved in the bin-dependent energy vector affects the accurate pitch detection. In both given algorithms [33], [34], a shallow neural network is used for classification-based pitch estimation. If the pitch related features are designed particularly as the input, a shallow or small size neural network might be able to achieve high accuracy performance for pitch estimation in noise.
In this study, we propose to use robust harmonic features and neural network (NN) classification for pitch estimation. A block diagram of the overall formulated algorithm is presented in Fig. 1. The proposed algorithm is composed of two steps: i) pitch candidate generation; and ii) target pitch selection. The long-short-term Fourier transform [39]–[41] is performed on the input noisy speech waveform to obtain the long-term and short-term frequency spectra respectively. The long-term spectrum serves as a noise robust speech representation in frequency domain. F0 candidates are extracted from both the original noisy speech spectrum and the subharmonic summation spectrum. Next, the pitch selection process is formulated as a neural network classification problem, which categorizes pitch candidates as true or false. We aim to contribute towards the development of robust harmonic features to project the pitch candidates into a more separable space to facilitate effective pitch candidate classification. We propose five harmonic features which are associated with properties of the speech harmonic structure in order to describe the salience of each pitch candidate. These harmonic features are derived from the harmonic energy intensity as well as shape of the harmonic spectrum envelope. All features are complementary to each other and represent the characteristics of pitch related speech harmonic structure. The output of the neural network indicates the likelihood of a pitch candidate to be a true pitch. Finally, an HMM model is used for pitch contour tracking according to the temporal continuity of speech. An initial version of the proposed algorithm is presented in our earlier work in [40]. We extend this previous work by applying a temporal continuity tracking algorithm using HMM to ensure more accurate pitch estimation.
Fig. 1.

Block diagram of the proposed two-stage pitch estimation algorithm.
The remainder of the paper is organized as follows. Sections II and III illustrate the processes of pitch candidate generation and target pitch selection respectively. Experiments and results are shown in Section IV. Finally, in Section V, conclusions and future directions are presented.
II. Pitch Candidate Generation
A. Long-Short-Term Spectrum Representation
In this section, pitch candidate extraction is performed in the frequency domain. First, we present the long-short-term spectrum analysis in this section. According to the sinusoidal model [42], voiced speech can be represented by a series of sinusoids with time-varying parameters (amplitude, frequency and phase). In a short-time analysis frame, we assume that the speech signal is quasi-stationary, and hence the sinusoidal parameters are constant. Therefore, the sinusoidal model is formulated as,
| (1) |
where n is the sample index, n =1,2, …, N, N is the signal length, n0 is the index of the delay of the analysis sample, R is the number of the total harmonic order, ar, fr, and are the instantaneous amplitude, frequency and initial phase of the rth order of harmonic component respectively, and w(n) is a short-time analysis window (typically 15 ~ 30 ms in duration, Hamming window). In addition, it is assumed that the rth order of harmonic frequency fr can be approximated as rF0.
When processing with a discrete time Fourier transform (DTFT), the time waveform signal is transformed into the frequency domain , represented as,
| (2) |
where W(f) is the spectrum of the analysis window, and f is the frequency variant in Hz. If we only consider the spectrum amplitude in the positive frequency range, and discard the index of the sample delay, (2) can be re-written as,
| (3) |
where δ(·) is the Dirac Delta function. Thus, in the frequency domain, the speech spectrum can be considered as a summation of a series of harmonic partials located at multiple integer times of the fundamental frequency. The spectrum of each harmonic partial is equivalent to the analysis window spectrum.
The duration of the short-time analysis window is usually set to a value in the range of 20–30 ms. However, when speech is contaminated by noise, the frequency resolution of the short-time window is insufficient for harmonics discrimination. As some harmonic partials are obscured by overlapped noise content, the corresponding harmonic peaks could be lost or deviate from the original frequency by an unexpected offset. In order to obtain a high frequency resolution for robust pitch estimation, we propose to use a longer analysis window with a duration in the range of 80 – 90 ms for noisy speech spectrum analysis. Selecting this window length results in the main lobe more concentrated around the harmonic frequency. Consequently, the long-term spectrum representation decreases excessive overlap between speech harmonics and noise interference in the frequency domain. In this way, pitch can be estimated with higher accuracy.
Fig. 2 demonstrates an example of the spectral representations for both long-term (80 ms) and short-term (30 ms) frame of signals. This frame of speech is derived from the TIMIT speech database [43]. The noisy signal is simulated by adding babble noise at an SNR level of 0 dB. From Fig. 2(a), we see that in the short-term spectrum, the 1st, 2nd, 3rd, and 6th order of harmonic partials are completely missing or significantly deviated from the original harmonic frequency locations. On the contrary, Fig. 2(b) shows that in the long-term spectrum, all harmonics are well preserved (note: here frequency content up to 800 Hz is shown, but consistent observations are also noted up to 4 kHz). We also notice some spurious peaks in the long-term spectrum; however, these peaks are relatively low and are removed before pitch candidate extraction as explained in the next section.
Fig. 2.
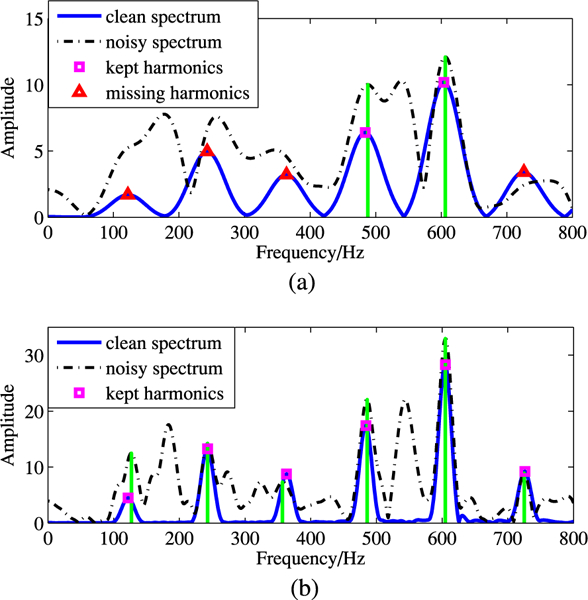
An example of harmonic resolution comparison between short-term and long-term spectrum analysis of clean and noisy signal. Noise type is babble, and SNR level is 0 dB. (a) Short-term spectrum. (b) Long-term spectrum.
B. Pitch Candidate Extraction
Next, we perform a pitch candidate extraction step. This step aims to obtain more reliable pitch candidates that include true pitch and decrease the computational complexity for subsequent stages. We propose two types of spectrum for extracting pitch candidates, one is the original noisy long-term speech spectrum, and the other is long-term subharmonic summation (SBH) spectrum [9]. In most cases, the spectral peak at F0 is preserved in the long-term noisy spectrum. However, if the SNR of the frequency bin where F0 is located is low, then the F0 spectral peak could disappear, which will result in absence of true pitch in the extracted pitch candidates. Nevertheless, SBH spectrum serves as a complementary source for pitch candidate extraction.
SBH spectrum has been shown to be an effective representation for pitch detection in clean and white noise condition [9], [10]. It is obtained by compressing the speech spectrum by a series of integer factors along the frequency axis, followed by summation of all the compressed and original spectra. As a result, multiple harmonics will coincide and therefore reinforce at the fundamental frequency location, boosting the maximum peak in the SBH spectrum. In this way, the F0 spectral peak can still be detected in the SBH spectrum, although it might be lost in the original noisy spectrum. The SBH spectrum, Ssbh, is given as follows,
| (4) |
where S(kf) is the compressed spectrum derived from the noisy speech with the integer compression factor of k, where k is also known as down-sampling rate. In addition, K is the maximum compression factor which is set to 10 in the current experiment. To illustrate this process, Fig. 3 shows an example of how to obtain the SBH spectrum. In this example, the original speech spectrum, which is in the frequency range of 0 to 800 Hz, is compressed by factors of 2, 3, 4, and 5 respectively along the frequency axis. And then all the 4 compressed spectrum vectors are added together with the original speech spectrum to form the SBH spectrum as shown on the bottom in Fig. 3. From Fig. 3, we observe that the maximum amplitude peak appears at the F0 frequency of the SBH spectrum. Moreover, SBH-based F0 estimation approach has been shown asymptotically identical to the maximum likelihood-based method [25].
Fig. 3.
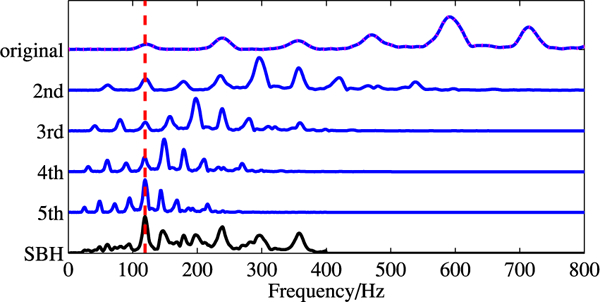
Estimation process of the SBH spectrum. The original speech is compressed by factors 2, 3, 4 and 5 times to obtain a summed up version SBH.
With the two types of spectrum obtained, we proceed to extract pitch candidates as follows: i) We set the pitch range to be between 50 Hz and 400 Hz. All the spectrum peaks outside of this frequency range are discarded in both original noisy spectrum and the SBH spectrum. ii) For the original noisy speech spectrum, a floor is set as 1/10 of its maximum amplitude. The spectrum peaks located in the pitch frequency above this floor are selected as potential pitch candidate peaks. iii) For the SBH spectrum, another floor is set as 1/2 of the maximum amplitude. All SBH spectrum peaks which exceed this floor while in the pitch frequency range are also selected as additional pitch candidates. It is noted that these thresholds are set empirically to ensure that not only the true pitch value is included in the pitch candidates list, but also the reduced amount of mis-detected pitch candidates.
III. Target Pitch Selection
After extracting pitch candidates as discussed in the previous section, we begin to perform target pitch selection. A neural network is adopted for pitch candidate classification, where the inputs are the harmonic feature sets, and the output is considered as the salience of the pitch candidate. In our method, the neural network is used to model the relationship between the harmonic features and the corresponding pitch candidate salience. Five types of harmonic features are developed for each pitch candidate to indicate its likelihood to be a true pitch. Specifically, the robust harmonic features are designed heuristically which are related to the energy intensity as well as the envelope shape of the identified harmonic structure associated with a certain pitch candidate. On one hand, the correct pitch corresponds to a stronger harmonic energy, since speech signal usually has a dominant energy in the voiced section. On the other hand, the envelope shape of the identified harmonic structures which are associated with the true pitch are often continuously and smoothly distributed along the frequency axis. Furthermore, the individual harmonic peak is assumed to be located at or as near as possible to an integer multiple times of the fundamental frequency. These five harmonic features are incorporated collectively to decide the salience of each pitch candidate. Compared to the linear method for combining the pitch related features in previous studies [14], [16], we propose a non-linear way with a neural network model which is more efficient and robust to noise. Finally, the temporal continuity constraints are utilized for pitch tracking based on hidden Markov model (HMM) and therefore further eliminate the errors of pitch estimation.
A. Harmonic Structure Extraction
The proposed harmonic features are related to the harmonic structure which is associated with a particular pitch candidate. Therefore, in this section, we explain how to extract the harmonic structure from the noisy speech spectrum for a given pitch candidate. Assuming there is a pitch candidate with the frequency value of F0′, the mth order of harmonic peak is estimated as below,
| (5) |
| (6) |
where and are the amplitude and frequency of the estimated mth order of harmonics respectively, and Al is the long-term noisy spectrum amplitude vector, the frequency range of the mth order of harmonics is set as In addition, ΔfH is the preset frequency deviation from the ideal harmonic frequency. In reality, the speech harmonics usually deviate from the exact harmonic frequency due to the instability of the glottal pulse sequence/shape during speech production, which is similar as the inharmonicity of music [44]. The harmonic deviation is typically larger as one moves towards higher frequency when compared to the low frequency. Therefore, we set the deviation threshold ΔfH differently depending on the frequency band. This is achieved by setting ΔfH to a smaller value in the low frequency, and a larger value in the high frequency, which is shown as below:
| (7) |
Moreover, if there is no harmonic peak detected at some order because of noise interference, we set and
B. Feature Extraction
After the harmonic structure is identified for a pitch candidate, the harmonic features for this pitch candidate can be extracted accordingly. The details of the feature extraction are described in terms of following five features: er, sr, hd, o2e, rh.
Harmonic energy ratio (er):
The harmonic energy ratio is the ratio between detected harmonic energy and the overall noisy spectrum energy. Mathematically, er is defined as:
| (8) |
Where c is a scaling factor to derive the short-term harmonic amplitude, given the estimated long-term harmonic amplitude . Here c is approximated as the length ratio between the long-term and short-term analysis windows. is the amplitude spectrum of the short-term analysis window, and fw is the band width of the corresponding main lobe. In addition, As(f) is the short-term spectrum vector of the original noisy speech, while fmax is the upper-bound frequency of the spectrum used for pitch estimation. Note that we use the short-term rather than long-term spectrum for computing the er value on account of non-stationary noise which could vary significantly over the long-term frame. It is also important to note that a larger er value usually indicates a higher SNR of the identified harmonic structure given the particular pitch candidate.
SBH amplitude ratio (sr):
SBH amplitude ratio is the ratio between the pitch candidate peak amplitude and the maximum peak amplitude of the SBH vector, which is calculated as follows,
| (9) |
where Ssbh is the SBH spectrum vector that is obtained with (4), and F0′ is a pitch candidate. For clean speech, if F0′ is a true pitch value, the maximum peak of SBH is expected to be located at the frequency of F0′ where multiple harmonics coincide after spectrum compression. For noisy speech, the peak at that F0′ frequency might not be the maximum one due to interference; however, its amplitude usually tends to be close to the maximum value. Therefore, a higher sr value usually indicates a higher likelihood the corresponding pitch candidate is a true pitch.
Harmonic frequency deviation (hd):
The harmonic frequency deviation stands for the average frequency deviation of the estimated harmonic partials from the ideal harmonic frequencies for a particular pitch candidate. It is obtained as below,
| (10) |
Where is the estimated frequency of the mth order of long-term harmonic partial, and M is the number of overall harmonic peaks which are detected, l1 and lM are the lower and upper bounds of the harmonic order. If is a true harmonic frequency for F0′, it should be as close as to mF0′, thus the difference tends to be close to 0. In other words, the smaller the value of hd, the more probable that the candidate is a true pitch candidate. Otherwise, if the value of hd is too large, which shows a high inharmonic feature, then the corresponding pitch candidate is not a true pitch.
Odd to Even harmonic energy ratio (o2e):
The odd to even harmonic energy ratio represents the energy ratio between the odd order and even order of harmonics. It is calculated as follows,
| (11) |
where and are the detected odd and even order of the long-term harmonic amplitudes respectively, R is the total number of harmonic partials in the analysis frequency range, (0 – 4000 Hz). Since the speech spectrum envelope is smoothly distributed along the frequency range, the overall energy of the odd order and even order of harmonics ought to be equivalent to each other. In theory, if o2e is significantly less than 1, then there is a high possibility that a half-pitch error has occurred. If o2e is significantly greater than 1, the corresponding pitch harmonics could belong to the noise interferences. Therefore, the use of o2e is able to control the half-pitch error rate as well as suppress the influence of noise interference.
Ratio of identified harmonic partials (rh):
The ratio of identified harmonic partials denotes the ratio between the number of detected harmonic partials and the ideal overall number of harmonic partials distributed in the analysis frequency range. The calculation of rh is presented in (12),
| (12) |
Where is the overall ideal number of harmonics distributed below fmax, and denotes the floor approximation to the closest integer number. Nh is the number of harmonics eventually estimated according to the harmonic structure extraction procedure proposed in Section IV-A. If there is a high ratio of harmonic partials identified for a particular pitch candidate, it indicates less noise interference within the speech harmonic structure. Thus, the corresponding pitch candidate is more likely to be the true pitch for the current frame.
C. Feature Analysis
The five harmonic features obtained from Section IV-B are complementary to each other in representing the characteristics of the pitch candidates. Fig. 4 and Table I present an example to illustrate the harmonic structure as well as the feature values for different pitch candidates. The signal frame used here is extracted from an utterance by a female speaker in the TIMIT database. Fig. 4(a) shows three different pitch candidates which are obtained from the SBH spectrum. The true pitch of this frame is equal to 241 Hz, shown as the third spectrum peak, which was estimated beforehand from the corresponding clean speech signal. The other two candidates (121 Hz and 81 Hz) are and of the true value respectively. These two incorrect candidates are very likely to be included in the potential pitch candidate list. In fact, some high SBH spectrum peaks occur at the frequencies equal to of the true pitch (n is a positive integer number). Fig. 4(b)–(d) present the identified harmonic structures for each pitch candidate. Fig. 4(b) demonstrates the harmonic structure for the correct pitch candidate, while Fig. 4(c) and (d) are for the two incorrect pitch candidates. It can be seen from Fig. 4(b) that the harmonic partials estimated for the true pitch candidate precisely fit with the original clean speech spectrum. However, in Fig. 4(c) and (d), the noise spectrum peaks are incorrectly detected as the target speech harmonic peaks. Especially in Fig. 4(c), all odd order of harmonic peaks are valleys indicating half-pitch errors.
Fig. 4.
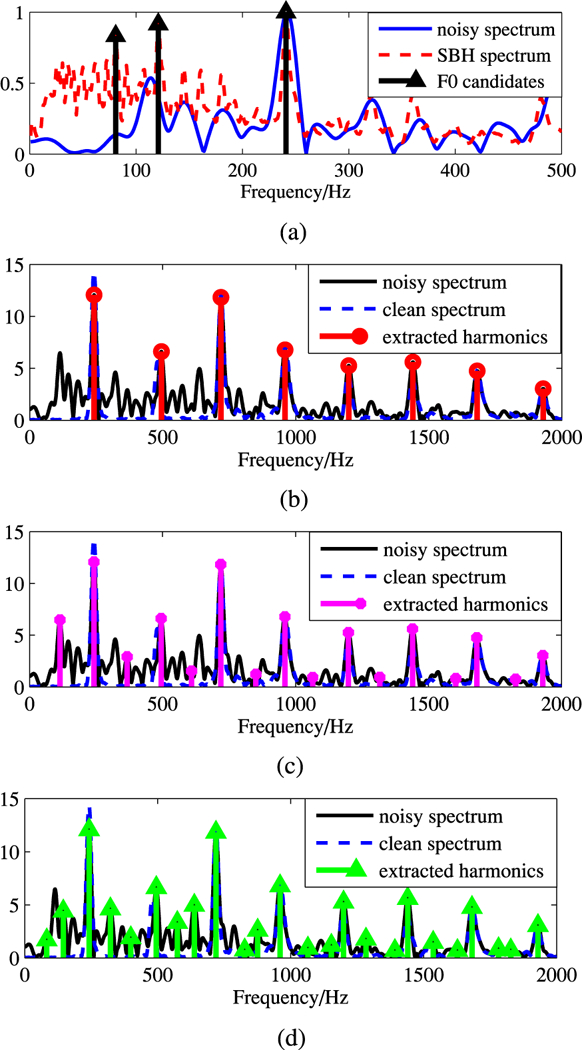
Illustration of pitch candidates and harmonic structure scenarios. (a) F0 candidate extraction. (b) Harmonic structure of the correct F0 candidates (241 Hz). (c) Harmonic structure of the wrong F0 candidates (121 Hz). (d) Harmonic structure of the wrong F0 candidates (81 Hz).
TABLE I.
Example Of Feature Values For Pitch Candidates
Table I lists the harmonic feature values for the above three F0 candidates. It can be seen from Table I that the true pitch candidate has a minimum hd value, a maximum sr value, and a minimum er value. The rh value is 1, which is the same as the other two candidates. The o2e value is 1.54, and its absolute difference from “1” lies as the second among the three. Alternatively, the incorrect pitch candidate with a frequency of 81 Hz ( of the true value) has the maximum er value among the three scenarios. An equivalence of calculating the er feature is the mean square error (MSE) estimation which is also used to derive the pitch value from the spectrum amplitude difference measure [45]–[47]. It indicates that larger the value of er for the candidate, the more energy is related to the pitch harmonics, and thus more likely the pitch candidate is considered to be the true pitch. However, this procedure neglects the distribution characteristics of the speech harmonics. For example, a large er value could be a result of a number of noise spectral peaks, which have been mis-labeled as harmonic partials. In such case, the detected harmonic structure identified with the corresponding pitch candidate will not follow the speech spectrum distribution. Therefore, target pitch selection cannot be determined by merely the er feature or based on the only MSE metric. Instead, we propose a combination of more features regarding both the energy intensity and the harmonic structure envelope shape to avoid such sustained errors.
In addition, we compute the mutual information (MI) between each feature set and the corresponding pitch candidate salience. If the pitch candidate differs from the true pitch within 20%, the pitch candidate salience is set to 1, otherwise to 0. The MI results are shown in Fig. 5. From Fig. 5 we see that among the five harmonic features, sr has the maximum mutual information, er and hd have equivalent but lower MI value. In addition, rh has the lowest MI value.
Fig. 5.
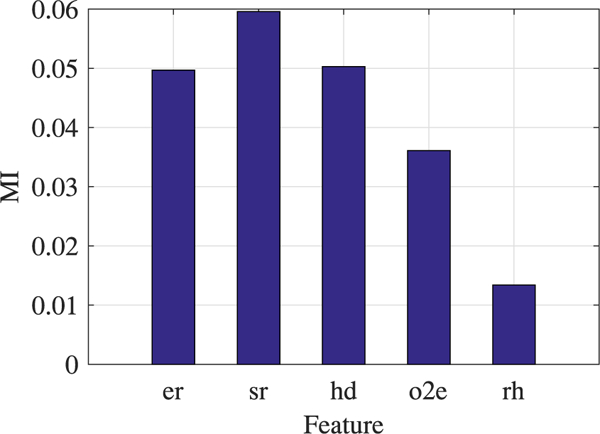
Mutual information (MI) between harmonic feature sets and pitch salience.
D. Pitch Classification based on Neural Network
Neural networks are often used to estimate or approximate an unknown function. With hidden layers containing both linear and sigmoid nodes, neural networks are able to model complex nonlinear relationships. In this section, we propose to address the pitch selection problem through pitch candidate classification based on feed-forward neural network. For each frame, we attempt to classify pitch candidates into pitch and non-pitch categories. The harmonic features extracted in Section IV-B are combined to form a collective input vector ([er sr hd o2e rh]) for neural network processing/classification. This is referred to as HarFeature vector in the rest of the paper. There is a single output from the neural network which indicates pitch candidate salience.
In the training phase, the neural network is established to model the relationship between input HarFeature sets and output pitch saliences. The output value is set to either 0 or 1, denoting either a false pitch or a true pitch value respectively. Specifically, the output is assigned according to the comparison between the pitch candidate and ground truth pitch value. If the pitch candidate differs from the ground truth pitch within 20%, it will be considered as true pitch, and the output will be set as 1 accordingly, vice versa. The objective function is set as minimum mean square error. The connecting weights between each layer in the neural network are obtained based on back-propagation [48]. In the testing phase, the input feature vector for a pitch candidate generates an output value between 0 and 1. The greater the output value, more probable the pitch candidate is a true pitch. For each testing frame, the pitch candidate with the maximum output is considered to be most probable as the true pitch value.
E. Temporal Continuity Constraint
In the testing phase of neural network classification, multiple pitch candidates might have similar output values which are close to the maximum. In this case, it is difficult to determine which pitch candidate to select in a single frame. In order to solve this problem, we perform pitch contour tracking based on temporal continuity constraint. Since speech is continuously produced by the human vocal system, a continuity constraint will ensure natural F0 contour. We model the pitch tracking with a Hidden Markov Model (HMM), which is a practical statistical tool for modeling time sequences [38] and has been used by previously pitch contour tracking very successfully [20], [21]. The problem of pitch contour tracking is then interpreted as, given the observation sequence, we attempt to estimate the hidden state (F0) sequence. HMM details are shown as follows.
-
i)
The observation sequences are defined as the values of pitch candidates paired with their corresponding harmonic feature vectors, denoted as O = o1, o2, ..., oT. Each observation component ot is composed of {Vt, F0t}. Specifically, F0t denotes the pitch candidate vector in the tth frame, and the ith element of F0t corresponds to the ith pitch candidate . In addition, Vt denotes the HarFeature matrix in the tth frame, where the ith row elements are comprised of the HarFeature vector [er sr hd o2e rh] for the corresponding pitch candidate .
-
ii)
The hidden state sequences, denoted as q = q1, q2, ..., qT, are the F0 contour vector, which are in the range from 50 Hz to 400 Hz. The frequency resolution in the state space is set as 1 Hz/state, therefore the hidden states are {50 Hz, 51 Hz, 52 Hz, ..., 400 Hz}. The total number of the hidden states is 351. Nevertheless, in each frame, there are limited amount of pitch candidates generated (Section III-B), hence the computational complexity stays reasonable.
-
iii)
The state transition probability array A reflects the conditional probability of the current pitch state dependent on the previous state, . Here, ai,j is obtained as the probability of pitch difference from the previous frame to the current frame in the logarithmic scale, given by:
| (13) |
where the basis d is set empirically to 1.5 to ensure the quasi-linearity of pitch change along a logarithmic scale across the pitch frequency range. Accordingly, the state transition probability distribution is learned as a priori based on a Gaussian mixture model (GMM, 2 mixtures) from the speech database: Keele [49] and CSTR [50]. Both Keele and CSTR datasets have ground truth pitch values. The GMM probability distribution of the spread of is presented in Fig. 6. It can be seen from Fig. 6 that the maximum peak of the log-frequency difference distribution is below 0, which indicates that the overall pitch trend is decreasing during neutral speech production (the spoken language in the database is British English). The parameters of the GMM are: w1 = 0.9268, μ1 = −0.0131, σ1 = 0.0023; w2 = 0.0732, μ2 = −0.0882, σ2 = 0.1562.
Fig. 6.
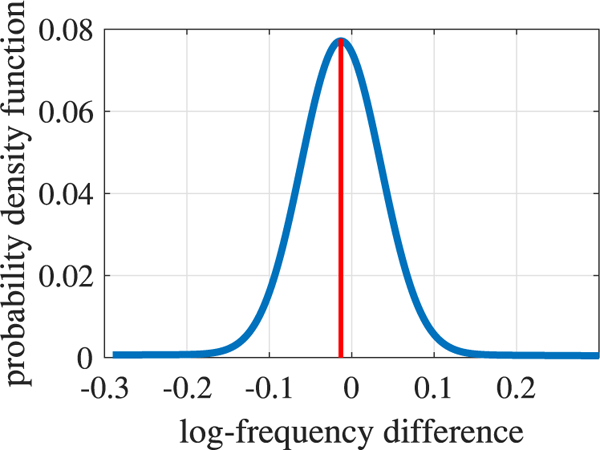
Probability density function (PDF) of pitch difference between adjacent frames in logarithmic scale
-
iv)
The observation probability B reflects the likelihood of the current observation ot being produced by a specific state q. In our case, the state qi is equal to one of the pitch candidate value in the corresponding observation sequence. In addition, the observation probability is equal to the output of the neural network given the pitch candidate and the corresponding HarFeature vector obtained in Section IV-D, shown below,
| (14) |
where ONN denotes output from the neural network when the input feature vector is and the corresponding pitch candidate is . In addition, i denotes the index of pitch candidate in the tth frame.
-
v)
Initial state distribution π is defined as the observation probabilities of all the pitch candidates in the first frame of a speech segment.
Once the above HMM parameters Λ = (A, B, π) are obtained, the Viterbi algorithm is used as a dynamic programming solution [51] to estimate the optimal pitch contour. The Viterbi algorithm is given as follows,
| (15) |
Where and are derived from the observation probability B and the state transition probability A respectively.
Finally, with the temporal continuity constraint in place, a smooth pitch contour can be obtained with greater noise resistance performance. At this point, we have completed the formulation of the overall pitch estimation algorithm.
IV. Experiment and Results
A. Evaluation Database
In order to evaluate performance of the proposed pitch estimation method, we use the Keele database [49] and CSTR database [50]. Both databases provide ground-truth pitch labels, which can be used as a reference for performance assessment. The Keele database contains 10 long English sentences spoken by five female and five male British English speakers, with a total duration of about 9 minutes. The CSTR database contains 100 English utterances, spoken by both a female and a male speaking British English. The total duration of the CSTR database is about 7 minutes.
We use six types of noise to simulate naturalistic noisy environments, including babble noise, exhibition noise, HF (high frequency)-channel noise, restaurant noise, street noise, and white noise [52], [53]. For each noise type, the SNR levels are set from – 10 dB to 20 dB in steps of 5 dB.
B. Evaluation Metrics
Pitch estimation performance is evaluated using gross pitch error (GPE) defined as:
| (16) |
where Nerr denotes the number of frames where the incorrect pitch estimation occurs, and Nv denotes the total number of voice frames. The incorrect estimation refers to the cases that the estimated pitch deviates from the true value by more than 5%.
C. Algorithm Parameter Settings
All speech and noise signals are first re-sampled at 16 kHz. Each sentence is partitioned into overlapping frames with a long-frame length of 80 ms, and a short-frame length of 30 ms respectively. The sequential frame shift is set to 10 ms. A 16000 point FFT is applied to calculate the frequency spectrum which generates a frequency resolution of 1 Hz per FFT point. This frequency resolution can ensure a lower variance of pitch estimation. For higher computational efficiency, we could resort to down-sampling the noisy speech, or use less FFT points combined with an interpolation stage to obtain a similar frequency resolution.
Fig. 7 shows the corresponding neural network architecture setting. From Fig. 7 we see that the neural network is comprised of five inputs which are the five harmonic features, three hidden layers, and one output which is the pitch salience of a specific pitch candidate. The first hidden layer is comprised of 10 linear units. The second and the third hidden layers contain 6 and 5 sigmoid units respectively. All the layers in the neural network are fully connected.
Fig. 7.
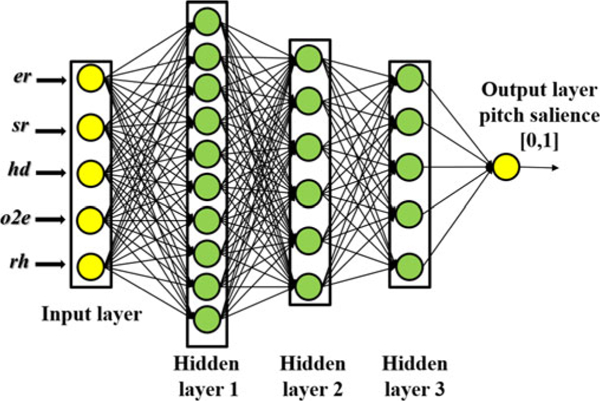
Neural network architecture setting. There are five inputs, one output and three hidden layers. The first layer has 10 linear units. The second and third layer have 6 and 5 sigmoid units respectively.
In the training stage, we use the Keele database mixed with babble noise at SNR of 5 dB as the training data. In the testing stage, both Keele and CSTR databases are mixed with different types of noise, and are used to assess how well our algorithm generalizes to unseen data. In the case of Keele database, we have five groups of evaluation sets. In each evaluation set, the features extracted from eight sentences (4 female + 4 male) were used to train the neural network model, and the remaining two sentences (1 female + 1 male) were used for test. In this way, all training and testing data were non-overlapping. Five groups of calculations were carried out, and the average result was calculated across all groups for each noisy condition. For CSTR database evaluation, the same neural network model trained with one of the above five groups of Keele data was used for test. In order to obtain an optimal iteration time for neural network training, we used the cross validation paradigm. In our experiments, 30 iterations yielded the best results.
The proposed algorithm was compared with five state-of-the-art pitch estimation methods including SAcC [35], JinWang [21], PEFAC [16], RAPT [7], and YIN [8]. Our proposed algorithm is denoted as HarFeature in this section. Among the comparing methods, SAcC is a supervised method, and the rest are unsupervised methods. The training data is set the same between SAcC method and the proposed HarFeature method. We set the analysis window size differently for each comparing method in order to maximize each method’s performance. Specifically, the window size is set as: JinWang −20 ms, SAcC −25 ms, PEFAC −90 ms, RAPT −30 ms, YIN −33 ms. From the above window size setting we can observe that frequency domain based pitch estimation methods (PEFAC and HarFeature) need a longer analysis window than time domain based methods to reach the maximum performance. The reason is that frequency domain methods require longer frame to achieve higher frequency resolution for discriminating the target harmonics from noise. Furthermore, except YIN, the rest of the methods perform post-processing for pitch contours based on temporal continuity.
D. Experimental Results
We present the gross pitch error (GPE) results for the Keele database and the CSTR database in Figs. 8 and 9 respectively. From Figs. 8 and 9, we see that the proposed HarFeature method consistently outperforms the other comparing pitch estimation algorithms in most of the noisy conditions. The results also show that the proposed pitch estimation method generalizes well to unseen noise in the training set in terms of both speech and noise database. At the SNR level of −10 dB in babble and street noise conditions, PEFAC has slightly lower GPE score than HarFeature. PEFAC has the advantage of normalizing the noisy speech spectrum with the long-term average speech spectrum, which is effective in controlling high level narrow-band noise. Moreover, YIN algorithm performs as well as the proposed HarFeature method at higher SNR levels (≥ 10 dB) in most of the conditions. However, at the lower SNR levels (≤ 5 dB), the performance of YIN method decreases rapidly. This indicates the effectiveness of the modified autocorrelation function features of YIN method in clean and moderately noisy environments. At lower SNR, the temporal continuity tracking might be able to improve the pitch estimation accuracy of YIN algorithm.
Fig. 8.
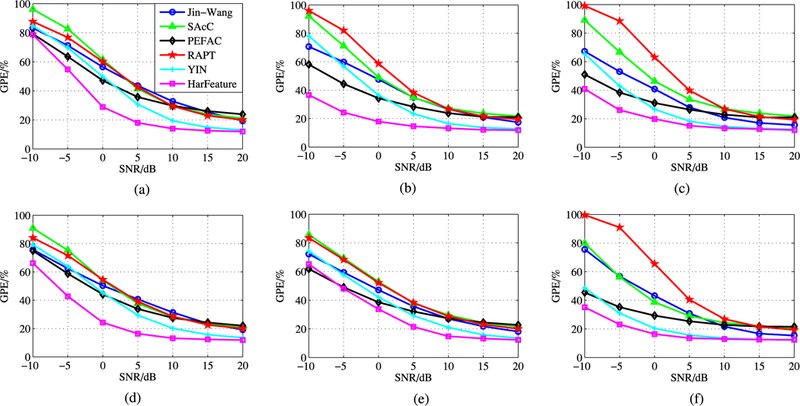
Gross pitch error results for Keele database in different noise types at multiple SNR levels. (a) Babble. (b) Exhibition. (c) Hf-channel. (d) Restaurant. (e) Street.
Fig. 9.
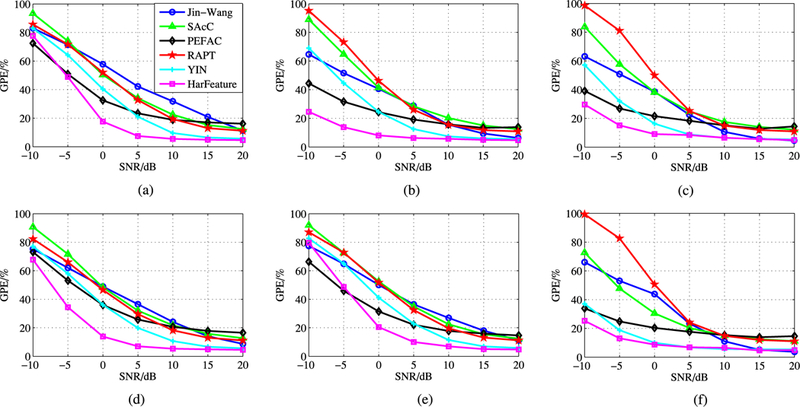
Gross pitch error results for CSTR database in different noise types at multiple SNR levels. (a) Babble. (b) Exhibition. (c) Hf-channel. (d) Restaurant. (e) Street. (f) white.
We also compute the average GPE gain of the proposed method over the second best performance across all six noise types at each different SNR level. For each SNR level, the GPE gain is obtained by reducing the GPE value of HarFeature from the GPE value of the second best performance approach. The average value is computed for all SNR levels. The results are shown in Table II from which we observe that the gain is high at low SNR levels, but decreases as the SNR level increases. The average gain across all noise types and all SNR levels are 6.43% and 5.23% for Keele and CSTR database respectively. Regarding the comparison methods, at lower SNR levels (≤0dB), PEFAC results are most comparable to the proposed method. However, at higher SNR levels (>0dB), YIN dominates the second best performance.
TABLE II.
Average GPE Performance Gain (%): HarFeature Method vs. the Second Best Performance Method
| SNR level | − 10 dB | − 5 dB | 0 dB | 5 dB | 10 dB | 15 dB | 20 dB | Avg |
|---|---|---|---|---|---|---|---|---|
| Keele database | 7.97 | 10.98 | 11.67 | 7.94 | 3.93 | 1.71 | 0.84 | 6.43 |
| CSTR database | 4.15 | 8.87 | 12.13 | 7.51 | 2.43 | 1.14 | 0.37 | 5.23 |
We also computed the logarithmic probability density function (log-PDF) for the ratio between the estimated pitch value and ground-truth values in white noise condition. Three SNRs are chosen here for evaluation, −10 dB, 0dB, and 10 dB. The log-PDF is shown in Fig 10. Fig 10(a) shows the log-PDF results for the mixture of female and male pitch. From Fig. 10(a) we see that there is a maximum peak near 0 dB, which indicates that most of the estimated pitch is equal to ground truth pitch values. We notice that there are some notable double-pitch errors. Particularly at the lower SNR levels, there are higher double-pitch errors. The log-PDF results are shown separately for female and male pitch in Fig. 10(b) and (c) respectively. Specifically, the results indicate that female pitch errors are mostly caused by underestimation. There is a seldom overestimation of female pitch due to the pitch frequency range restricted under 400 Hz. The double-pitch error for female speech is avoided because of this. On the other hand, both overestimation and underestimation is found in male pitch error. A peak of double-pitch errors is shown in the log-PDF distribution, however, half-pitch error is not shown. From this, we infer that the low half-pitch error for both female and male speech might be the result of the design of the o2e feature.
Fig. 10.
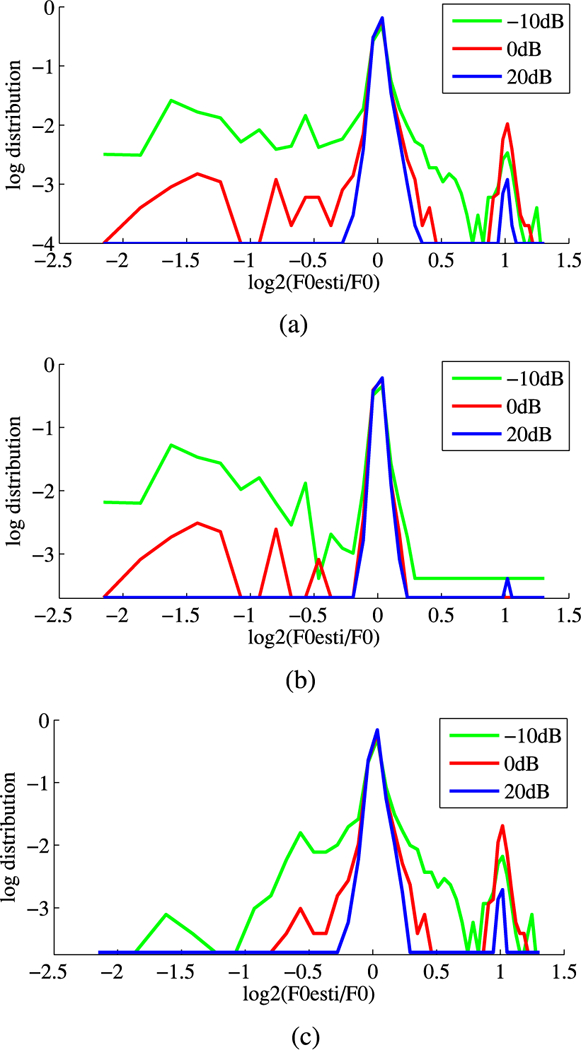
PDF of the ratio between estimated F0 and true F0 value (white noise). (a) Female + male. (b) Female. (c) Male.
Figs. 11 and 12 show examples of pitch contour estimation for two utterances, spoken by a female and male talker respectively. We plot the pitch contour results estimated by the proposed HarFeature method and PEFAC method. The ground-truth pitch values and the original noisy speech spectrum are presented as well. Both speech utterances are selected from the Keele database and are contaminated with babble noise at SNR of − 5 dB, 0 dB and 5 dB. The duration of both utterances is 2.5 secs. From Figs. 11 and 12, we observe that the pitch contours obtained from HarFeature method fit better to the reference pitch contour than the PEFAC method.
Fig. 11.
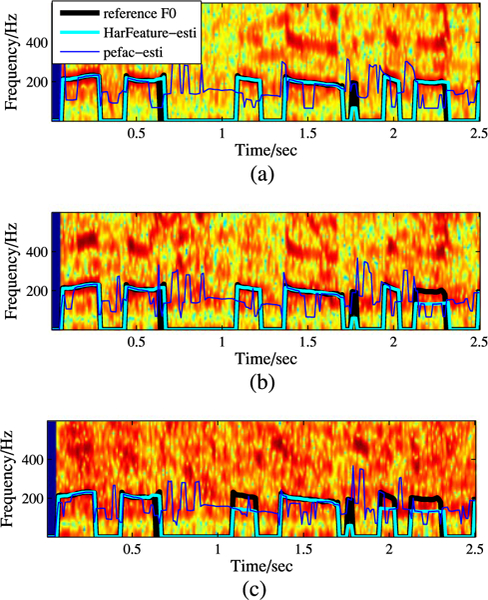
F0 contours examples (female speech + babble noise). (a) Female + male. (a) snr = 5 dB. (b) snr = 0 dB. (c) snr = − 5 dB.
Fig. 12.
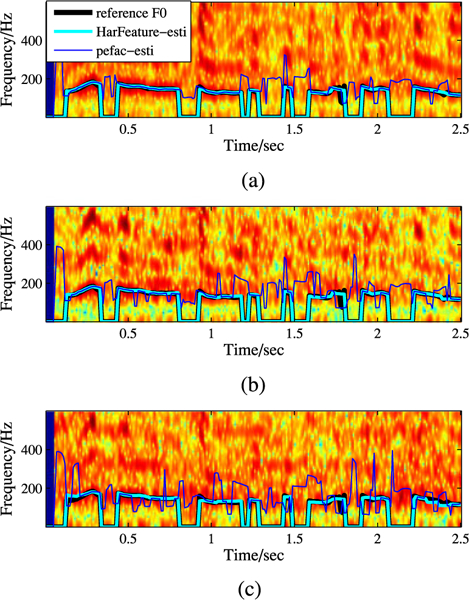
F0 contours examples (male speech + babble noise). (a) snr = 5 dB. (b) snr = 0 dB. (c) snr = − 5 dB.
V. Conclusion and Discussion
In this study, we used robust harmonic features along with an advanced classification framework based on a neural network for pitch estimation. Our proposed method entitled HarFeature consisted of two processing steps. In the first step, pitch candidates were generated from the original noisy speech spectrum as well as SBH spectrum. In the second step, pitch candidate classification was performed based on a neural network solution using multi-dimensional pitch related robust harmonic features. Specifically, we proposed five robust features based on the energy intensity and spectrum envelope characteristics of the speech harmonic structure. By using these robust harmonic features, we were able to provide complementary information for neural network-based pitch classification. Furthermore, we utilized long-term spectrum analysis to enhance the frequency resolution, making the resulting speech harmonics more discriminative against the background noise. Finally, by applying pitch temporal continuity constraints, the resulting pitch tracking was based on an HMM to select the optimal and smoothed pitch contours. Experimental results demonstrated that the proposed HarFeature algorithm yielded substantially better performance (lower GPE) than the compared state-of-the-art algorithms across various types and levels of noise.
For future research, it would be possible to explore additional alternative features for harmonic characteristics of the speech signal, which could contribute to greater overall pitch estimation performance for noisy, or reverberant conditions.
Acknowledgment
The authors would like to thank the anonymous reviewers for their constructive comments to improve the quality of the paper.
This work was supported in part by the National Institute of Health (NIH) under Grant R01 DC010494 and in part by the University of Texas at Dallas from the Distinguished University Chair in Telecommunications Engineering held by J. H. L. Hansen. The associate editor coordinating the review of this manuscript and approving it for publication was Dr. Hsin-min Wang.
Biography

Dongmei Wang received the B.S. degree in electrical engineering from Nanjing University of Information Science and Technology, Nanjing, China, in 2006, the M.S. degree in electrical engineering from Shanghai University, Shanghai, China, in 2010. She is currently working toward the Ph.D. degree in electrical engineering at The University of Texas at Dallas (UTD), Richardson, TX, USA, where she has been a Research Assistant since 2011. Before joining UTD, she was a Research Engineer at Huawei Technologies Co., Ltd., Shanghai. Her work focused on downlink MIMO optimization for LTE networks. She is currently focused on development of noise-reduction algorithms to improve speech intelligibility for both normal hearing and hearing-impaired listeners. Her general research interests include speech enhancement, speech separation, music separation, and speech intelligibility prediction.

Chengzhu Yu received the B.S. degree in electrical engineering from China University of Petroleum, Beijing, China, in 2008. He is currently working toward the Ph.D. degree in electrical engineering at The University of Texas at Dallas, Richardson, TX, USA, where he is currently a Research Assistant. His research interests include speaker recognition, automatic speech recognition, speaker diarization.

John H. L. Hansen (S’81–M’82–SM’93–F’07) received the Ph.D. and M.S. degrees in electrical engineering from Georgia Institute of Technology, Atlanta, GA, USA, in 1988 and 1983, and B.S.E.E. degree from Rutgers University, College of Engineering, New Brunswick, NJ, USA, in 1982. He was awarded the honorary degree “Doctor Technices Honoris Causa” from Aalborg University, Aalborg, Denmark, in April 2016, in recognition of his contributions to speech signal processing and speech/language/hearing science. In 2005, he joined the Erik Jonsson School of Engineering and Computer Science, University of Texas at Dallas (UTDallas), Richardson, TX, USA, where he is currently a Jonsson School Associate Dean for Research, as well as a Professor of electrical engineering, the Distinguished University Chair in Telecommunications Engineering, and a joint appointment as a Professor in the School of Behavioral and Brain Sciences (Speech & Hearing). He was previously the Department Head of Electrical Engineering from Aug. 2005 to Dec. 2012, overseeing a more than four times increase in research expenditures ($4.5M to $22.3M) with a 20% increase in enrollment along with hiring 18 additional T/TT faculty, growing UTDallas to the eighth largest electrical engineering program from ASEE rankings in terms of degrees awarded. At UTDallas, he established the Center for Robust Speech Systems (CRSS). He was the Chairman and a Professor in the Department of Speech, Language and Hearing Sciences, and a Professor in the Department of Electrical and Computer Engineering, University of Colorado Boulder (1998–2005), where he co-founded and was an Associate Director of the Center for Spoken Language Research. In 1988, he established the Robust Speech Processing Laboratory and continues to direct research activities in CRSS, UTDallas. He is the author/co-author of 640 journal and conference papers including 12 textbooks in the field of speech processing and language technology, co-author of textbook Discrete-Time Processing of Speech Signals (IEEE Press, 2000), the co-editor of DSP for In-Vehicle and Mobile Systems (Springer, 2004), Advances for In-Vehicle and Mobile Systems: Challenges for International Standards (Springer, 2006), In-Vehicle Corpus and Signal Processing for Driver Behavior (Springer, 2008), and the lead author of the report “The impact of speech under ‘stress’ on military speech technology,” (NATO RTO-TR-10, 2000). His research interests span the areas of digital speech processing, analysis and modeling of speech and speaker traits, speech enhancement, feature estimation in noise, robust speech recognition with emphasis on spoken document retrieval, and in-vehicle interactive systems for hands-free human-computer interaction. He has been named IEEE Fellow (2007) for contributions in “Robust Speech Recognition in Stress and Noise,” International Speech Communication Association (ISCA) Fellow (2010) for contributions on “research for speech processing of signals under adverse conditions,” and received the Acoustical Society of America.s 25 Year Award (2010)-in recognition of his service, contributions, and membership to the Acoustical Society of America. He is currently the elected Vice-President of ISCA and a member of the ISCA Board. He was also selected and is serving as Vice-Chair on the U.S. Office of Scientific Advisory Committees (OSAC) for OSAC-Speaker in the voice forensics domain (2015–2017). Previously, he served as the IEEE Technical Committee (TC) Chair and the member of the IEEE Signal Processing Society: Speech-Language Processing Technical Committee (SLTC) (2005–2008; 2010–2014; elected IEEE SLTC Chairman for 2011–2013, Past-Chair for 2014), and an elected ISCA Distinguished Lecturer (2011/12). He has served as a member of IEEE Signal Processing Society Educational Technical Committee (2005–08; 2008–10); Technical Advisor to the U.S. Delegate for NATO (IST/TG-01); an IEEE Signal Processing Society Distinguished Lecturer (2005/06), an Associate Editor of the IEEE TRANSASCTIONS ON SPEECH AND Audio Processing (1992–1999), an Associate Editor of the IEEE SIGNAL PROCESSING LETTERS (1998–2000), an editorial board member of the IEEE Signal Processing Magazine (2001–2003); and a Guest Editor (Oct. 1994) for special issue on Robust Speech Recognition for the IEEE TRANSACTIONS ON SPEECH AND AUDIO PROCESSING. He has served on the Speech Communications Technical Committee for Acoustical Society of America (2000–2003), and previously on the ISCA Advisory Council. He has supervised 78 Ph.D./M.S. thesis candidates (41Ph.D.,37 M.S./M.A.), received the 2005 University of Colorado Teacher Recognition Award as voted by the student body, He also organized and served as General Chair for ISCA Interspeech-2002, Sep. 16–20, 2002, the co-organizer and the Technical Program Chair for IEEE ICASSP-2010, Dallas, TX, USA, March 15–19, 2010, and the Co-Chair and the organizer of the IEEE SLT-2014, Dec. 7–10, 2014, in Lake Tahoe, NV, USA.
References
- [1].Asgari M, Bayestehtashk A, and Shafran, “Robust and accurate features for detecting and diagnosing autism spectrum disorders,” in Proc. INTERSPEECH, Lyon, France, Aug. 2013, pp. 191–194. [PMC free article] [PubMed] [Google Scholar]
- [2].Yang Y, Fairbirn C, and Cohn JF, “Detecting depression severity from vocal prosody,” IEEE Trans. Audio, Speech, Lang. Process, vol. 4, no. 2, pp. 142–150, Apr./June 2013. [DOI] [PMC free article] [PubMed] [Google Scholar]
- [3].Rabiner LR and Cheng MJ, “A comparative performance study of several pitch detection algorithm,” IEEE Trans. Acoust., Speech, Signal Process, vol. ASSP-24, no. 5, pp. 399–418, October 1976. [Google Scholar]
- [4].Hess W, Pitch Determination of Speech Signals. Berlin, Germany: Springer-Verlag, 1983. [Google Scholar]
- [5].Khurshid A and Denham SL, “A temporal-analysis-based pitch estimation system for noisy speech with a comparative study of performance of recent system,” IEEE Trans. Audio, Speech, Lang. Process, vol. 15, no. 5, pp. 1112–1124, September 2004. [DOI] [PubMed] [Google Scholar]
- [6].Gong Y and Haton J, “Time domian harmonic matching pitch estimation using time-dependent speech modeling,” IEEE Trans. Acoust., Speech, Signal Process, vol. ASSP-35, no. 10, pp. 1386–1400, October 1987. [Google Scholar]
- [7].Talkin D, “Robust algorithm for pitch tracking,” in Speech Coding and Synthesis, Kleijn WB and Paliwal KK, Eds. New York, NY, USA: Elsevier, 1995, pp. 495–518. [Google Scholar]
- [8].Cheveigne A and Kawahara H, “Yin, a fundamental frequency estimator for speech and music,” J. Acoust. Soc. Amer, vol. 111, no. 4, pp. 1917–1930, April 2002. [DOI] [PubMed] [Google Scholar]
- [9].Hermes DJ, “Measurement of pitch by subharmonic summation,” J. Acoust. Soc. Amer, vol. 83, no. 1, pp. 257–264, January 1988. [DOI] [PubMed] [Google Scholar]
- [10].Noll A, “Pitch estimation of human speech by the harmonic product spectrum, the harmonic sum spectrum, and a maximum likelihood estimate,” in Proc. Symp. Comput. Process. Commun, 1969, pp. 779–797. [Google Scholar]
- [11].Duifhuis H, Willems LF, and Sluyter RJ, “Measurement of pitch in speech: An implementation of Goldstein’s theory of pitch perception,” J. Acoust. Soc. Amer, vol. 71, no. 6, pp. 1568–1580, June 1982. [DOI] [PubMed] [Google Scholar]
- [12].Kawahara H, Masuda-Katsuse I, and Cheveigne de A, “Restructuring speech representation using a pitch-adaptive time-frequency smoothing and an instantaneous-frequency-based f0 extraction: Possible role of a repetitive structure in sounds,” Speech Commun, vol. 27, pp. 187–207, April 1999. [Google Scholar]
- [13].Kawahara H, Cheveigne de A, and Patterson RD, “An instantaneous-frequency-based pitch extraction method for high-quality speech transformation: Revised tempo in the straight suite,” in Proc. Int. Conf. Spoken Lang. Process, Sydney, NSW, Australia, Vol. 4, Dec. 1998, pp. 1367–1370. [Google Scholar]
- [14].Liu D and Lin C, “Fundamental frequency estimation based on the joint time-frequency analysis of harmonic spectral structure,” IEEE Trans. Audio, Speech, Lang. Process, vol. 9, no. 6, pp. 609–621, September 2001. [Google Scholar]
- [15].Huang F and Lee T, “Pitch estimation in noisy speech using accumulated peak spectrum and sparse estimation technique,” IEEE Trans. Audio, Speech, Lang. Process, vol. 21, no. 1, pp. 99–109, January 2013. [Google Scholar]
- [16].Gonzalez S and Brookes M, “PEFAC—A pitch estimation algorithm robust to high levels of noise,” IEEE/ACM Trans. Audio, Speech, Lang. Process., vol. 22, no. 2, pp. 518–530, February 2014. [Google Scholar]
- [17].Hu G and Wang D, “A tandem algorithm for pitch estimation and voiced speech segregation,” IEEE Trans. Audio, Speech, Lang. Process, vol. 18, no. 8, pp. 2067–2079, November 2010. [Google Scholar]
- [18].Zhang X, Zhang H, Nie S, Gao G, and Liu W, “A pairwise algorithm using the deep stacking network for speech separation and pitch estimation,” IEEE/ACM Trans. Audio, Speech, Lang. Process., vol. 24, no. 6, pp. 1066–1078, June 2016. [Google Scholar]
- [19].Hu G and Wang D, “Monaural speech segregation based on pitch tracking and amplitude modulation,” IEEE Trans. Neural Netw, vol. 15, no. 5, pp. 1135–1150, September 2004. [DOI] [PubMed] [Google Scholar]
- [20].Wu W, Wang D, and Brown GJ, “A multipitch tracking algorithm for noisy speech,” IEEE Trans. Speech Audio Process, vol. 11, no. 3, pp. 229–241, May 2003. [Google Scholar]
- [21].Jin Z and Wang DL, “HMM-based multipitch tracking for noisy and reverberant speech,” IEEE Trans. Audio, Speech, Lang. Process, vol. 19, no. 5, pp. 1091–1102, July 2011. [Google Scholar]
- [22].Tan LN and Alwan A, “Multi-band summary correlogram-based pitch detection for noisy speech,” Speech Commun, vol. 55, no. 7/8, pp. 841–856, September 2013. [Google Scholar]
- [23].Wang D, Hansen JHL, and Tobey E, “F0 estimation for noisy speech based on exploring local time-frequency segment,” in Proc. IEEE Workshop Appl. Signal Process. Audio Acoust, New Paltz, NY, USA, Oct. 2015, pp. 1–5. [Google Scholar]
- [24].Wang D and Hansen JHL, “F0 estimation for noisy speech by exploring temporal harmonic structures in local time frequency spectrum segment,”in Proc. IEEE Int. Conf. Acoust., Speech, Signal Process, Shanghai, China, Mar. 2016, pp. 6510–6514. [Google Scholar]
- [25].Christensen MG and Jakobsson A, Multi-Pitch Estimation, 1st ed. San Rafael, CA, USA: Morgan Claypool, 2009, ch. 2. [Google Scholar]
- [26].Christensen MG, Vera-Candeas P, Somasundaram SD, and Jakobsson A, “Robust subspace-based fundamental frequency estimation,” in Proc. IEEE Int. Conf. Acoust., Speech, Signal Process, Las Vegas, NV, USA, Mar. 2008, pp. 101–104. [Google Scholar]
- [27].Tabrikian J, Dubnov S, and Dickalov Y, “Maximum A-Posteriori probability pitch tracking in noisy environments using harmonic model,” IEEE Trans. Audio, Speech, Lang. Process, vol. 12, no. 1, pp. 76–87, January 2004. [Google Scholar]
- [28].Wohlmayr M, Stark M, and Pernkopf F, “A probabilistic interaction model for multipitch tracking with factorial hidden Markov models,” IEEE Trans. Audio, Speech, Lang. Process, vol. 19, no. 4, pp. 799–810, May 2011. [Google Scholar]
- [29].Duan Z, Pardo B, and Zhang C, “Multiple fundamental frequency estimation by modeling spectral peaks and non-peak regions,” IEEE Trans. Audio, Speech, Lang. Process, vol. 18, no. 8, pp. 2121–2133, November 2010. [Google Scholar]
- [30].Kameok Ha, Nishimoto T, and Sagayama S, “A multipitch analyzer based on harmonic temporal structured clustering,” IEEE Trans. Audio, Speech, Lang. Process., vol. 15, no. 30, pp. 982––994., March 2007. [Google Scholar]
- [31].Le Roux J, Kameoka H, Ono N, Cheveigne de A, and Sagayama S, “Single and multiple F0 contour estimation through parametric spectrogram modeling of speech in noisy environment,” IEEE Trans. Audio, Speech, Lang. Process, vol. 15, no. 4, pp. 1135–1145, May 2007. [Google Scholar]
- [32].Chu W and Alwan A, “SAFE: A statistical approach to F0 estimation under clean and noisy conditions,” IEEE Trans. Audio, Speech, Lang. Process, vol. 20, no. 3, pp. 933–944, March 2012. [Google Scholar]
- [33].Barnard E, Cole RA, Vea MP, and Alleva FA, “Pitch detection with a neural-net classifier,” IEEE Trans. Signal Process, vol. 39, no. 2, pp. 298–307, February 1991. [Google Scholar]
- [34].Taylor IJ and Greenhough M, “Neural network pitch tracking over the pitch continuum,” in Proc. Int. Comput. Music Conf, Banffi, AB, Canada, Sep. 1995, pp. 432–435. [Google Scholar]
- [35].Lee BS and Ellis DPW, “Noise robust pitch tracking by subband autocorrelation classification,” in Proc. INTERSPEECH, Portland, OR, USA, Sep. 2012, Paper P3b.05. [Google Scholar]
- [36].Duan Z, Han J, and Pardo B, “Multi-pitch streaming of harmonic sound mixtures,” IEEE Trans. Audio, Speech, Lang. Process, vol. 22, no. 1, pp. 138–150, January 2014. [Google Scholar]
- [37].Han K and Wang D, “Neural network based pitch tracking in very noisy speech,” IEEE/ACM Trans. Audio, Speech, Lang. Process., vol. 22, no. 12, pp. 2158–2168, December 2014. [Google Scholar]
- [38].Theodoridis S and Koutroumbas K, Pattern Recognition, 4th ed. Orlando, FL, USA: Academic, 2008, ch. 3,8. [Google Scholar]
- [39].Huang Q and Wang D, “Single channel speech separation based on long-short frame associated harmonic model,” Digital Signal Process, vol. 21, no. 4, pp. 497–507, July 2011. [Google Scholar]
- [40].Wang D, Loizou PC, and Hansen JHL, “F0 estimation in noisy speech based on long-term harmonic feature analysis combined with neural network classification,” in Proc. INTERSPEECH, Singapore, September 2014, pp. 2258–2262. [Google Scholar]
- [41].Wang D, Loizou PC, and Hansen JHL, “Noisy speech enhancement based on long term harmonic model to improve speech intelligibility for hearing impaired listeners,” in Proc. INTERSPEECH, Singapore, Sep. 2014, pp. 2059–2062. [Google Scholar]
- [42].McAulay RJ and Quatieri TF, “Speech analysis/synthesis based on sinusoidal representation,” IEEE Trans. Acoust., Speech, Signal Process, vol. ASSP-34, no. 4, pp. 744–754, August 1986. [Google Scholar]
- [43].Zue V, Seneff S, and Glass J, “Speech database development at MIT: Timit and beyond,” Speech Commun, vol. 9, no. 4, pp. 351–356, August 1990. [Google Scholar]
- [44].Duan Z, Zhang Y, Zhang C, and Shi Z, “Unsupervised single-channel music source separation by average harmonic structure modeling,” IEEE Trans. Audio, Speech, Lang. Process, vol. 16, no. 4, pp. 766–778, May 2008. [Google Scholar]
- [45].Dubost S and Cappe O, “Enhancement of speech based on non-parametric estimation of a time varying harmonic representation,” in Proc. ICASSP, Istanbul, Turkey, Jun. 2000, pp. 1859–1862. [Google Scholar]
- [46].Norholm SM, Jensen JR, and Christensen MG, “Enhancement of non-stationary speech using harmonic chirp filters,” in Proc. INTERSPEECH, Dresden, Germany, Sep. 2015, pp. 1755–1759. [Google Scholar]
- [47].Christensen MG and Jensen JR, “Pitch estimation for non-stationary speech,” in Proc. Asilomar Conf. Signals, Syst. Comput, Dresden, Germany, Nov. 2014, pp. 1400–1404. [Google Scholar]
- [48].Mitchell TM, Machine Learning, 2nd ed. New York, NY, USA: McGraw-Hill, 1997, ch. 4. [Google Scholar]
- [49].Plante F, Ainsworth WA, and Meyer G, “A pitch extraction reference database,” in Proc. EUROSPEECH, Madrid, Spain, 1995, pp. 837–840. [Google Scholar]
- [50].Bagshaw PC, Hiller SM, and Jack MA, “Enhanced pitch tracking and the processing of F0 contours for computer aided intonation teaching,” in Proc. EUROSPEECH, Berlin, Germany, Sep. 1993, pp. 1003–1006. [Google Scholar]
- [51].Forney GD, “The Viterbi algorithm,” Proc. IEEE, vol. 61, no. 3, pp. 268–278, March 1973. [Google Scholar]
- [52].ITU-T, “Test signals for use intelephonometry,” Int. Telcomm. Union, Geneva, Switzerland, Rec. ITU-T; P.501, August 1996. [Google Scholar]
- [53].Varga AP, Steeneken HJM, Tomlinson M, and Jones D, “The NOISEX-92 study on the effect of additive noise on automatic speech recognition,” DRA Speech Res. Unit, Worcestershire, U.K., 1992. [Google Scholar]


