

Abstract
Aims
The aim was to determine the relationship between (R) and (S)‐citalopram enantiomer exposure (AUC(0,24 h)) and therapeutic response in agitated individuals greater than 60 years old with Alzheimer's dementia (AD).
Methods
Citalopram enantiomer exposures (AUC(0,24 h)) derived from an established population pharmacokinetic analysis were utilized to explore the relationship between (R)‐ and (S)‐citalopram area under the curve (AUC(0,24 )) and Mini‐Mental State Examination (MMSE), Neurobehavioural Rating Scale‐Agitation Subscale (NBRS‐A), modified Alzheimer's Disease Cooperative Study‐Clinical Global Impression of Change (mADCS‐CGIC) and Neuropsychiatric Inventory Agitation subscale (NPIA) scores. Time dependent changes in these scores (disease progression) were accounted for prior to exploring the exposure effect relationship for each enantiomer. These relationships were evaluated using a non‐linear‐mixed effects modelling approach as implemented in nonmem v7.3.
Results
(S)‐AUC(0,24 h) and (R)‐AUC(0,24 h) each contributed to improvement in NBRS‐A scores (k3(R) −0.502; k4(S) −0.712) as did time in treatment. However, increasing (R)‐AUC(0,24 h) decreased the probability of patient response (maximum Δ −0.182%/AUC(0,24 h)) based on the CGIC while (S)‐AUC(0,24 h) improved the probability of response (maximum Δ 0.112%/AUC(0,24 h)). (R)‐AUC(0,24 h) was also associated with worsening in MMSE scores (−0.5 points).
Conclusions
Our results suggest that citalopram enantiomers contributed differentially to treatment outcomes. (R)‐citalopram accounted for a greater proportion of the adverse consequences associated with racemic citalopram treatment in patients with AD including a decreased probability of treatment response as measured by the CGIC and a reduction in MMSE scores. The S‐enantiomer was associated with increased probability of response based on the CGIC.
Keywords: agitation, Alzheimer's disease, citalopram, escitalopram, pharmacodynamics
What is Already Known about this Subject
Citalopram at 30 mg day−1 improves agitation for AD patients but has adverse effects on cognitive function. At lower dosages, citalopram has not been extensively studied.
Individual enantiomers of citalopram have differing affinities for the serotonin transporter.
(R)‐citalopram is a competitive inhibitor of (S)‐citalopram binding in vitro.
What this Study Adds
(R)‐citalopram exposure is the main factor associated with impaired cognitive functioning (MMSE). Also, (R)‐citalopram exposure is associated with a lower probability that a patient will have a clinical reduction in agitation, while increasing exposures of (S)‐citalopram are associated with increased probability of response (mADCS‐CGIC).
Although requiring further confirmation, we were able to examine the differential effects of (R)‐ and (S)‐citalopram on neuropsychiatric scores in elderly AD patients. This analysis demonstrated an association of adverse consequences with (R)‐citalopram exposure while (S)‐citalopram exposure provided therapeutic benefit in an exposure dependent fashion. In light of these findings, treatment with escitalopram may be a better choice than racemic citalopram.
Introduction
Older persons with Alzheimer's disease (AD) often exhibit agitation that is persistent, costly and difficult to treat with severe adverse consequences for both patients and caregivers 1, 2, 3. Citalopram, a selective serotonin re‐uptake inhibitor (SSRI), has been proposed as an alternative to the potentially deleterious use of antipsychotic drugs for agitation in dementia 4, 5, 6, 7.
The Citalopram in Alzheimer's Disease study (CitAD) was designed to evaluate the efficacy of citalopram for agitation in patients with AD without major depression 8. Compared with placebo, citalopram was associated with improvement on the Neurobehavioural Rating Scale‐Agitation Subscale (NBRS‐A) 8 and modified Alzheimer Disease Cooperative Study‐Clinical Global Impression of Change (mADCS‐CGIC) 9 but worsening on the Mini‐Mental State Examination (MMSE) 10. Thus, CitAD suggested both positive and negative outcomes associated with citalopram treatment.
Citalopram is a racemic mixture of two enantiomers: (R)‐citalopram and (S)‐citalopram (escitalopram) 11. These enantiomers differ in their affinities for the serotonin transporter. (S)‐citalopram's affinity is approximately 40‐ fold higher than that of (R)‐citalopram 12, 13, 14, 15. Moreover, (R)‐citalopram blocks (S)‐citalopram binding at the transporter in vitro 13, 14, 15. Hence, (R)‐citalopram may reduce the therapeutic benefit of citalopram assuming that its action in treating agitation is serotonergic.
Population models have been used to assess the relationship between drug exposure and treatment response. These approaches are increasingly used in drug development and for therapeutic optimization 16. CitAD provides the opportunity to use population pharmacokinetic and pharmacodynamic models to assess the impact of (R)‐citalopram AUC, (S)‐citalopram AUC or their combination on neuropsychiatric scores in patients with AD with agitation.
Methods
Participant data
CitAD was a randomized, placebo‐controlled, double‐blind, parallel group trial with 94 participants randomized to citalopram and 92 to placebo. The study was approved by the respective local institutional ethics committees. Over 90% of participants in both groups completed the 9 week trial 8. Assessments were conducted using the NBRS‐A, Neuropsychiatric Inventory agitation subscale (NPIA), (mADCS‐CGIC), and MMSE. Each assessment was collected by structured clinical interview. The NBRS and NPI collected information for a wide array of psychiatric symptoms including agitation 8, 9. The NBRS‐A and NPIA consist of a standardized set of assessments related to agitation with scores ranging from 0–18 and 0–12 respectively. Higher scores are associated with more severe agitation. Rather than assessing for a clinical state, the Clinical Global Impression of Change (CGIC) measures the change in a patient's symptoms. Scores range from 0–7 in each category. A score of 4 represents no change with deviations above and below 4 reflecting an improvement or deterioration. MMSE scores range between 0 and 30 points where lower scores indicate a greater cognitive impairment 10. Three hundred and thirty‐one total plasma samples were collected throughout the study at weeks 3, 6 and 9. Concentration measures were associated with dosages of 10, 20 and 30 mg. Five percent of the concentration samples were associated with a 10 mg dose, 20% with a 20 mg dose and 75% with a 30 mg dose. Citalopram and (S)‐ and (R)‐citalopram concentrations were determined by a sensitive high performance liquid chromatography (h.p.l.c.) using a chiral column with u.v. detection 17. The limit of quantitation for each enantiomer was 5 ng ml−1 and inter‐ and intra‐assay coefficients of variation, across a range of concentrations for all analytes, was less than 15%. Dose normalized concentrations (per mg dose) ranged from 0 to 0.013 ng ml−1 and 0 to 0.01 ng ml−1 for R and S respectively. A model of citalopram and desmethyl‐citalopram pharmacokinetics 18 derived from these measures was utilized to calculate the predicted (R)‐ and (S)‐citalopram 24 h AUC (AUC(0,24 h)) for each individual at each PD measurement day. Baseline patient demographics and PD measures are outlined in Table 1.
Table 1.
Study demographic and clinical data
| Patient demographics | |||
|---|---|---|---|
| Treatment (n = 81) | Placebo (n = 80) | P value | |
| Gender | M 41 | M 45 | 0.31 |
| F 40 | F 35 | ||
| Mean(SD) | Mean(SD) | ||
| Age (years) | 78(8.7) | 78(8.5) | 0.74 |
| MMSE * | 17(6.2) | 14.9(6.9) | 0.06 |
| NBRSA * | 7.2(3.3) | 7.5(3.0) | 0.59 |
| NPIA * | 7.6(2.2) | 7.8(2.4) | 0.61 |
Values obtained at baseline (before study intervention);
MMSE Mini‐Mental State Examination;
NBRS‐A Neurobehavioral Rating Scale‐Agitation subscale;
NPIA Neuropsychiatric Inventory Agitation subscale
Pharmacodynamic modelling
Non‐linear mixed effect models were developed using nonmem 7.3 19 to capture the effects of treatment time (i.e. time in the study), predicted (R)‐citalopram area under the curve ((R)‐AUC(0,24 h)) and predicted (S)‐citalopram AUC ((S)‐AUC(0,24 h)) on neuropsychiatric scores. Given that response measures were not necessarily taken at the same time as concentration measures, matched concentration effect data was not readily available in all subjects. It is important to note key differences in the covariates affecting the (R)‐ and (S)‐ citalopram enantiomer concentrations within individuals. Specifically, age and gender had effects on the (R)‐citalopram enantiomer pharmacokinetics whilst CYP2C19 genotype predicted phenotype and age affected the (S)‐enantiomer pharmacokinetic profile 18.
The models were developed using a two step process. The first step was to determine the best mathematical function representing the impact of the contributing factors to response measures using a non‐linear mixed effects modelling approach in order to preserve the within individual correlation and identify inter‐individual differences. The second step evaluated the individual and combination drug effects to determine the best model structure capturing participant response.
Step 1: For each contributing factor (treatment time, (R)‐AUC(0,24 h) and (S)‐AUC(0,24 h)) a linear function, Hill type function, Emax function and exponential functions were individually evaluated to determine the effect of these factors on participant response (NBRS‐A, MMSE, mADCS‐CGIC and NPIA). The introduction of parameters was done in a hierarchical manner. The time dependent change (i.e. the placebo effect) was modelled as a time dependent function. The objective was to describe adequately the variability in the data. Model choice was guided primarily by the change in the nonmem objective function value (OFV). The nonmem OFV approximates −2 times the log likelihood (−2LL). The change in −2LL approximates a chi‐squared distribution. An alpha level of α = 0.05 (3.84 point change in OFV for 1 degree of freedom) was used as the threshold for evaluating improvement in model fit. Subsequently, the participant specific factors were incorporated into the model as separate covariates on the response in those individuals. The random interindividual variability (IIV) was included in the model testing both additive and exponentiated forms. The residual error was modelled as an additive term, while additive, proportional and combined error models were tested. Parameters that could not assume negative values were constrained using an exponential (log normal) IIV. To account for the number of parameters evaluated in each model, the Akaike Information Criteria (AIC) 20 was employed to penalize the likelihood that guided model selection. The mathematical function with the lowest OFV and AIC was used to capture the effect of the contributing factor on the participant response.
Step 2: The mathematical function determined for each factor was used in this step to test the impact of covariates individually (i.e. time only, (R)‐AUC(0,24 h) only, (S)‐AUC(0,24 h) only) and in combination. These steps are outlined below using the approach for the MMSE model equations as an example:
- Baseline only (i.e. no time dependent treatment effect)
- X(t) = X0
- Baseline and treatment time
- Baseline, treatment time and (R)‐AUC(0,24 h)
- Baseline, treatment time and (S)‐AUC(0,24 h)
- Baseline, treatment time, (R)‐AUC(0,24 h) and (S)‐AUC(0,24 h)
The best model for each response was determined by a combination of NONMEM OFV, AIC criteria and the magnitude of the contribution of the factor to the overall response. The mADCS‐CGIC score (CGICA) was reported as a categorical outcome (categorical data) with participants classified using a binary scale (responders vs. non‐responders) 8. Response was defined in the CitAD study as a CGICA score lower at week 9 than at baseline. These categorical data were not amenable to the same modelling technique used for the other neuropsychiatric scores. Therefore, a logistic model 21 was used to calculate the probability of response using a similar process to that described earlier.
NBRS‐A, MMSE, NPIA general model structure
The final model structure for the simultaneous analyses of the contribution of the (R)‐ and (S)‐enantiomer AUC(0,24 h) for NBRS‐A, MMSE and NPIA are shown in the equations below:
| ((1)–MMSE) |
| ((2)–NBRS–A, NPIA) |
where X(t) is the score at the time t (NBRS‐A, ((2)–NBRS–A, NPIA), MMSE). A bi‐exponential time effect function best described the data for the time dependent change in the NBRS‐A and NPIA. A linear function best described the effects of the (R)‐ and (S)‐citalopram enantiomer exposures on these neuropsychiatric scores after accounting for the time effect mADCS‐CGIC model.
mADCS‐CGIC scores were converted to a categorical response per the original CITAD study. Equation (3) is the general logit transformation of a continuous bounded probability (0, 1) variable into the unconstrained domain (−inf, inf). Equation (4) shows the model structure that best described the participant response to treatment (P) in the logit transform,
| (3) |
| (4) |
where k 1 is the logistic baseline response of the participant in the placebo group with zero drug exposure, k 4 is a hypothetical intercept to allow flexibility in the drug model within observed exposure ranges and k 2/3 are treatment effectiveness factors. With additive residual variability (RUV), Equation (4) best described the effects of (R)‐AUC(0,24 h) and (S)‐AUC(0,24 h) on the probability of having a response. Further evaluation demonstrated that (R)‐AUC(0,24 h) was the primary contributor to a worsening probability of participant response and the (S)‐AUC(0,24 h) was associated with a higher probability of response. Since the outcome measure was a response referenced to the matched baseline, time was not incorporated explicitly into this model.
Results
Across all models, time in study was the main contributor to the observed improvements in NBRS‐A, MMSE and NPIA scores. Age and gender were not significant covariates on patient response to citalopram.
Final parameter estimates for the NBRS‐A analysis are in Table 2 and the impact on the response profile are shown in Table 3. A bi‐exponential function best characterized the change in NBRS‐A score over time. The incorporation of the bi‐exponential form improved the model fit by 16 OFV points (P < 0.001, 1 d.f.) compared with the mono‐exponential model. Varying k 1 had no effect on the objective function for k 1 < −1.5. Therefore, the value was fixed (k 1 = −2), and reflected a rapid decline in agitation that occurs before the first follow‐up period. Significant improvements in OFV were observed with the addition of individual drug effects (maximum 𝚫11.7, P < 0.001), signifying its importance, but the simultaneous analysis of the enantiomers resulted in instability in the estimation of IIV and no additional improvement in OFV change. Visual predictive checks (VPCs) on the R and S models are demonstrated in Figure 1. The 95% confidence intervals on drug effect demonstrated a consistent reduction in NBRS‐A score (k 3(R) −0.502(−0.154, 0.858); k 4(S) −0.712(−0.232, 1.24)) when the enantiomers were evaluated independently. Modelling results for the NBRS‐A scores are shown in Table 3.
Table 2.
nonmem parameter estimates for slopes, intercepts, inter‐individual variability and residual unknown variability for each of the biomarker profiles
| Parameter | Value (%SE) | Percent IIV (%SE) | Parameter | Value (%SE) | Percent IIV (%SE) |
|---|---|---|---|---|---|
| mADCS‐CGIC | MMSE | ||||
| k 1 | −1.17 | NE | MMSE0 | 14.4 | 47.8 |
| k 2 R | −7.28 | NE | k 1 | 0.00526 | 0.159 |
| k 3 S | 4.48 | NE | k 2 R | −0.000293 | 131.9 |
| k 4 | 6.02 | NE | k 3 S | NE | NE |
| RUV | 1.92 | ||||
| NPIA | NBRSA | ||||
| alpha | 2.64 (12) | NE | alpha | 1.68 (20) | 99.6 (18) |
| k 1 | −2 | NE | k 1 | −2 | NE |
| beta | 5 (7) | 33.8 (11) | beta | 5.26 (7) | 49.5 (10) |
| k 2 | −0.0138 (84) | 420 (12) | k 2 | −0.0137 (60) | 263 (20) |
| k 3 R alone | −0.192 (112) | 361 (30) | k 3 R alone | −0.493 (36) | 74 (112) |
| k 4 S alone | −0.331 (97) | 272 (39) | k 4 S alone | −0.687 (38) | 74 (151) |
| RUV | 1.84 (6.2) | RUV | 1.89 (7.2) | ||
IIV inter individual variability;
NE not estimated in final model;
RUV residual unknown variability;
%SE % standard error (covariance step was not available in all models)
Table 3.
Impact of treatment time, (R)‐, and (S)‐citalopram on NBRS‐A
| Time model | Time and (R)‐model | Time and (S)‐model | |||
|---|---|---|---|---|---|
| Time | Time | R | Time | S | |
| Minimum contribution | 1.70 | 1.23 | −0.35 | 1.27 | −0.27 |
| Maximum contribution | −7.47 | −6.86 | −1.92 | −7.00 | −2.11 |
| Mean | −3.70 | −3.35 | −0.85 | −3.40 | −0.76 |
| Median | −3.91 | −3.44 | −0.78 | −3.48 | −0.71 |
| SD | 1.49 | 1.39 | 0.33 | 1.40 | 0.35 |
| nonmem objective | 1771.88 | 1762.68 | 1764.08 | ||
Figure 1.
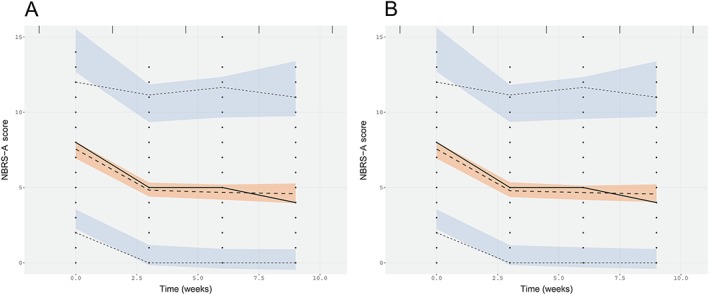
Visual predictive checks on (R) and (S) NBRS‐A models. A) (R)‐enantiomer model of NBRS‐A score and B) (S)‐enantiomer model of NBRS‐A score
The mADCS‐CGIC 8 response probability was analyzed against (R)‐AUC(0,24 h), (S)‐AUC(0,24 h) and both in combination. The combined linear logit yielded the best performance with respect to model objective value. The probability of response without treatment was 26%. The correct classification rate for responders was 76%. Differential effects were associated with (R)‐ and (S)‐enantiomers. Increasing (R)‐AUC(0,24 h) was associated with a reduced likelihood of response (maximum Δ −0.182%/AUC(0,24 h)) while elevated (S)‐AUC(0,24 h) simultaneously increased an individual's likelihood of treatment success (maximum Δ 0.112%/AUC(0,24 h)). Elevated (S)‐AUC(0,24 h) was a strong driver of response. Simulating an increase of (S)‐AUC(0,24 h) from 500 to 1500 μg l−1 day at a fixed (R)‐AUC(0,24 h) of 1425 μg l−1 day resulted in an 8.5‐fold increase in likelihood of response (10.8% to 91.4%). At the lowest (S)‐AUC(0,24 h) exposures (see Figure 2, blue dotted line), increasing (R)‐AUC(0,24 h) was associated with a very steep decrease in response probability. For the lowest combined exposure of (R)‐AUC(0,24 h) (819 μg l−1 day) and (S)‐AUC(0,24 h) (509 μg l−1 day) the probability of patient response was 91%. However, this benefit was negated above an (R)‐AUC(0,24 h) of 1284 μg l−1 day, where the probability of responding was below that of placebo. Response characteristics are shown in Figure 2. The model parameters for mADCS‐CGIC are shown in Table 2.
Figure 2.
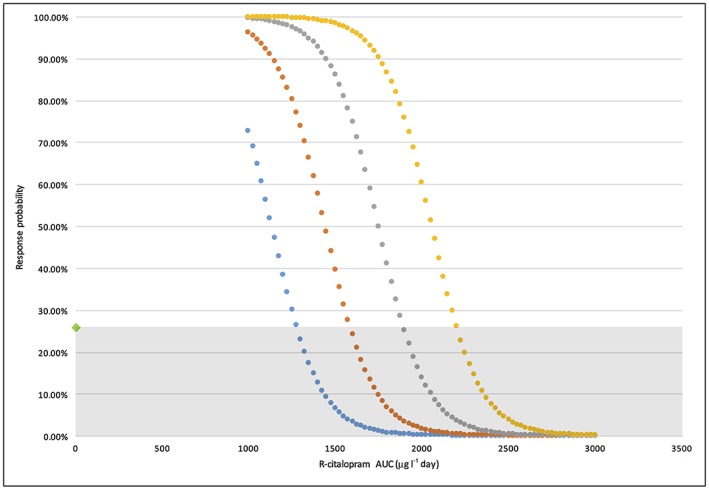
Response probability of participant mADSC‐CGIC vs. average (R)‐citalopram AUC(0,24 h). (S)‐citalopram of 500 μg l−1 day (blue); (S)‐citalopram of 1000 μg l−1 day (orange); (S)‐citalopram of 1500 μg l−1 day (grey); (S)‐citalopram of 2000 μg l−1 day (yellow); Grey shaded region: Treatment probability < placebo
The modelling results for MMSE scores are shown in Table 4. As described previously, the greatest observed effect was the time in the study. Over the course of the study, subjects' cognition tended to improve with time by 0.0678 units per week (0.0112–0.129). The mean treatment effect was negative with the addition of exposure data but parameter estimates were imprecise. 95% confidence intervals included zero when allowing for positive and negative IIV. Constraining IIV to one region of the real number space (positive/negative), using an exponential form, suggested that the primary driver of deterioration in MMSE scores was attributable to the (R)‐enantiomer. Parameter estimation was best accomplished in this form using (R)‐AUC(0,24 h) data. Model estimation of (S)‐AUC(0,24 h) effects regressed to negligible values without improving estimation. When both (R)‐AUC(0,24 h) and (S)‐AUC(0,24 h) were included into the model, there was no further improvement in model performance compared with (R)‐AUC(0,24 h). In this combination model, (R)‐AUC(0,24 h) was the major contributor to the decline in MMSE scores with an attributable decrease of −0.5 points (95% confidence interval −0.19, 1.09). Final model parameters for the MMSE model are shown in Table 2.
Table 4.
Impact of treatment time, (R)‐ and (S)‐citalopram on MMSE
| Time model | Time and (R)‐model | Time and (S)‐model | Time, (R)‐ and, (S)‐combination model | |||||
|---|---|---|---|---|---|---|---|---|
| Time | Time | R | Time | S | Time | R | S | |
| Maximum contribution | 1.04 | 1.40 | −9.38 | 1.43 | −2.07 | 1.43 | −1.09 | −0.18 |
| Minimum contribution | 0.06 | 0.10 | −0.16 | 0.09 | −0.23 | 0.09 | −0.19 | −0.03 |
| Mean | 0.37 | 0.51 | −0.91 | 0.52 | −0.61 | 0.52 | −0.51 | −0.07 |
| Median | 0.30 | 0.42 | −0.48 | 0.42 | −0.57 | 0.42 | −0.47 | −0.06 |
| SD | 0.22 | 0.30 | 1.30 | 0.31 | 0.30 | 0.31 | 0.18 | 0.03 |
| nonmem objective | 2033.00 | 2026.00 | 2028.00 | 2028.57 | ||||
Placebo response for the NPIA score was best described using a bi‐exponential model similar to that used for the longitudinal NBRS‐A scores. Characterization of the early time course was poorly estimated. Improvement in model fit drove selection of the bi‐exponential (OFV 844.4) over linear (OFV 889) or exponential (OFV 878.3) forms (P < 0.001). Extension of this function to the complete data set (placebo + treatment) demonstrated similar OFV improvements in the bi‐exponential form. Addition of drug effect yielded a significant improvement in model fit but no differences were discernible between enantiomers. Again, mean population effect was negative reflecting some improvement in agitation but confidence intervals spanning zero limited our ability to draw conclusions regarding specific treatment effects. Simultaneous modelling of both enantiomer's AUC(0,24 h) values resulted in model instability in IIV and are not reported. Specific contributions to response are shown in Table 5.
Table 5.
Impact of treatment time, (R)‐ and (S)‐citalopram on NPIA
| Time model | Time and (R)‐model | Time and (S)‐model | |||
|---|---|---|---|---|---|
| Time | Time | R | Time | S | |
| Minimum contribution | 4.63 | 4.97 | 2.29 | 4.85 | 1.37 |
| Maximum contribution | −7.07 | −6.92 | −4.16 | −6.92 | −4.29 |
| Mean | −3.92 | −3.78 | −0.42 | −3.77 | −0.45 |
| Median | −4.97 | −4.67 | −0.45 | −4.71 | −0.38 |
| SD | 2.57 | 2.41 | 0.80 | 2.41 | 0.69 |
| nonmem objective | 1464.45 | 1458.02 | 1458.46 | ||
The final models and parameter sets (Table 2) were used to simulate an average patient citalopram and placebo response in the CitAD study. The simulation results of NBRS‐A, MMSE and NPIA are shown in Figure 3. For each outcome measure an average patient in CitAD with 1500 μg l−1 day (R)‐AUC(0,24 h) and 1500 μg l−1 day (S)‐AUC(0,24 h) for 9 treatment weeks was used to generate the comparison between the two groups.
Figure 3.
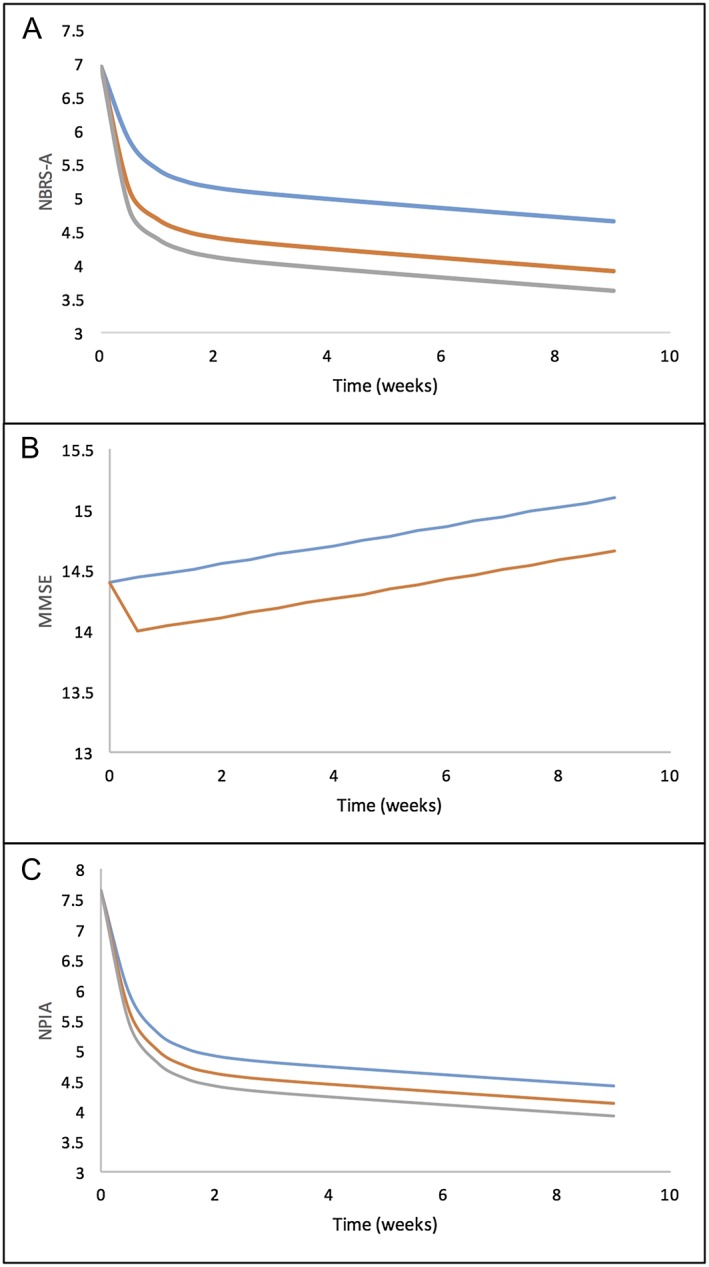
Model prediction of an average participant response in the placebo (blue line) and citalopram group (orange/grey lines). A) NBRS‐A score improvement with respect to treatment time, B) MMSE score improvement with respect to treatment time, C) NPIA score improvement with respect to treatment time. Average AUC(0,24 h) used in the model is 1500 μg l−1 day for (R)‐citalopram and 1500 μg l−1 day for (S)‐citalopram. placebo, (R)‐citalopram, (S)‐citalopram.  placebo,
  (R)‐citalopram,
  (S)‐citalopram
Discussion
Population pharmacodynamic models were used to explore the effects of exposure to (R)‐ and (S)‐citalopram on neuropsychiatric scores in aged participants of the CitAD study. These models provided insight into the impact of individual enantiomers on clinical outcomes. Although a few studies have examined the benefits of escitalopram vs. citalopram for antidepressant purpose 14, 15, none report the contribution of each enantiomer to patient response. Thus, through population modelling, we were able to examine in detail how (R)‐ and (S)‐citalopram altered patient dynamics.
Models for the NBRS‐A, MMSE and NPIA scores confirmed that time in study was the main contributing factor to the changes in these measures. Despite limitations in the CitAD study design 8, significant differences in the PK covariates allowed for enough differential exposure to characterize the individual enantiomer's effects.
The mADCS‐CGIC results reported in the CitAD study indicated that 26% of participants assigned to placebo responded 8, which is in agreement with the baseline treatment response probability (0.26) estimated by our logistic model. For the citalopram‐treated group, 40% had improvement from baseline in CitAD. We took the available data and demonstrated that response probability dropped as (R)‐AUC(0,24 h) increased past 819 μg l−1 day, the lowest observed exposure to (R)‐citalopram in the study. Response probability improved with increasing (S)‐AUC(0,24 h). This modelling result showed that as (R)‐AUC(0,24 h) increased above a particular threshold, there could be a lower chance for a patient to experience a response as assessed by mADCS‐CGIC (Figure 2). This response profile may be explained by the fact that at a low (R)‐AUC(0,24 h), there is less antagonism of (S)‐citalopram's action at the serotonin transporter. However, as (R)‐AUC(0,24 h) increases, (R)‐citalopram begins to compete for the same binding mechanism 22. This result suggests that (S)‐citalopram attenuates agitation through a specific action mediated by serotonin transporters and that escitalopram alone would increase a participant's mADCS‐CGIC response probability.
NBRS‐A scores improved with time and treatment according to our models. A bi‐exponential description of change fit the time course best. An initial rapid improvement was followed by a more protracted course as the study progressed. Drug effects were significant (𝚫OFV 10–12) but the individual (R)‐AUC(0,24 h) and (S)‐AUC(0,24 h) effects were not distinguishable (i.e. both apparently contributing to response). This is consistent with the original CitAD study, in which NBRS‐A improved by 1.3 points 8.
Changes in MMSE scores displayed the poorest signal to noise ratio. Our model predicted an overall negative effect with treatment but the unconstrained linear IIV was larger than the mean population estimation. The inherent variability in response made distinction of enantiomeric contributions difficult. An exponential model of IIV was employed to constrain error mathematically in an effort to highlight the enantiomer with a greater systematic detriment to cognitive functioning. The exponential MMSE model showed that (R)‐AUC(0,24 h) was the dominant contributor to poor response. The results of the CitAD study showed that the participants' MMSE diminished by approximately 1 point in the citalopram‐treated group compared with those receiving placebo 8, which is consistent with the changes predicted from the exponential model (Table 4). Effect estimations based on (S)‐AUC(0,24 h) tended to zero and resulted in poor parameter estimation suggesting minimal contribution of the (S)‐enantiomer exposure to worsening as measured by MMSE.
Changes in agitation as measured by the NPI agitation subscale (NPIA) exhibited similar properties to the MMSE. Drug effect was imprecisely characterized although its contribution was significant from a model fit perspective. As seen in the NBRS‐A, agitation over time was best characterized by a bi‐exponential function. The first exponential term (α) estimated a mean offset of 2.64 points from baseline at 3 weeks. Large IIV in drug effect superimposed on a small effect size limited the conclusions that could be made from the model estimation. These results (Table 5) fit with the reported effect size of −0.78 points, which failed to meet significance (P = 0.12) in the original paper 8.
The original study was not designed to evaluate specifically the effects of individual citalopram enantiomers. However, there are differences in the pharmacokinetic covariates that relate to the (R)‐ and (S)‐enantiomers of citalopram. This resulted in different exposures to the two enantiomers across individuals. The (S)‐enantiomer exposure is affected by CYP2C19 genotype and age and the R‐enantiomer exposure is affected by gender and age 18. This facilitated the exploration of differential contributions of the enantiomers to response and toxicity measures.
CitAD found that higher drug doses conferred an increased risk of adverse effects, but lacked enough low dose data to be conclusive 8. This analysis suggests that MMSE worsening and reduced mADCS‐CGIC response probability were attributable to (R)‐citalopram exposure. Moreover, (S)‐citalopram exposures were correlated with higher likelihood of response in the mADCS‐CGIC and NBRS‐A scales. These results suggest that (S)‐citalopram (escitalopram) is more efficacious for the treatment of agitation in an elderly population with AD. In a clinical environment with a paucity of available treatments and the significant morbidity and mortality associated with antipsychotics, the possibility of an alternative treatment for agitation would be an important step forward in AD care. Given the limited information previously reported on the differential effects of (R)‐ vs. (S)‐citalopram and the limitations of an in silico post‐hoc analysis, further study is advised to confirm the enantiomer specific effects.
Contributors
TH, RB, OS, BHM and BGP wrote the article. TH, RB and OS developed and analyzed the population model for this study. DMS managed and processed data. BHM, DPD, JEM, APP, LSS, DW, JY, LTD, DMS, CL and BGP developed conception, designed conduct of and managed the CitAD trial.
Competing Interests
All authors have completed the Unified Competing Interest form at www.icmje.org/coi_disclosure.pdf (available on request from the corresponding author) and declare no support from any organization for the submitted work. R Bies serves on the clinical pharmacology advisory board (paid) for Biogen Idec and has received grant funding from Takeda Pharmaceuticals. There are no other relationships or activities that could appear to have influenced the submitted work.
We thank Esther Giesbrecht BsC, ART (Clin Chem) and Cristiana Stefan, PhD of the CAMH laboratory for the citalopram analyses. This work was supported by the National Institute on Aging and the National Institute of Mental Health, R01 AG031248 and the Campbell Research Institute of CAMH.
Ho, T. , Pollock, B. G. , Mulsant, B. H. , Schantz, O. , Devanand, D. P. , Mintzer, J. E. , Porsteinsson, A. P. , Schneider, L. S. , Weintraub, D. , Yesavage, J. , Drye, L. T. , Munro, C. A. , Shade, D. M. , Lyketsos, C. , and Bies, R. (2016) R‐ and S‐citalopram concentrations have differential effects on neuropsychiatric scores in elders with dementia and agitation. Br J Clin Pharmacol, 82: 784–792. doi: 10.1111/bcp.12997.
References
- 1. Hurd MD, Martorell P, Delavande A, Mullen KJ, Langa KM. Monetary costs of dementia in the United States. N Engl J Med 2013; 368: 1326–34. [DOI] [PMC free article] [PubMed] [Google Scholar]
- 2. Steinberg M, Shao H, Zandi P, Lyketsos CG, Welsh‐Bohmer KA, Norton MC, et al. Point and 5‐year period prevalence of neuropsychiatric symptoms in dementia: the Cache County Study. Int J Geriatr Psychiatry 2008; 23: 170–7. [DOI] [PMC free article] [PubMed] [Google Scholar]
- 3. Geda YE, Schneider LS, Gitlin LN, Miller DS, Smith GS, Bell J, et al. Neuropsychiatric symptoms in Alzheimer's disease: past progress and anticipation of the future. Alzheimers Dement 2013; 9: 602–8. [DOI] [PMC free article] [PubMed] [Google Scholar]
- 4. Schneider LS, Dagerman KS, Insel P. Risk of death with atypical antipsychotic drug treatment for dementia: meta‐analysis of randomized placebo‐controlled trials. JAMA 2005; 294: 1934–43. [DOI] [PubMed] [Google Scholar]
- 5. Ballard C, Howard R. Neuroleptic drugs in dementia: benefits and harm. Nat Rev Neurosci 2006; 7: 492–500. [DOI] [PubMed] [Google Scholar]
- 6. Pollock BG, Mulsant BH, Rosen J, Sweet RA, Mazumdar S, Bharucha A, et al. Comparison of citalopram, perphenazine, and placebo for the acute treatment of psychosis and behavioral disturbances in hospitalized, demented patients. Am J Psychiatry 2002; 159 (3): 460–5. [DOI] [PubMed] [Google Scholar]
- 7. Pollock BG, Mulsant BH, Rosen J, Mazumdar S, Blakesley RE, Houck PR, et al. A double‐blind comparison of citalopram and risperidone for the treatment of behavioral and psychotic symptoms associated with dementia. Am J Geriatr Psychiatry 2007; 15: 942–52. [DOI] [PubMed] [Google Scholar]
- 8. Porsteinsson AP, Drye LT, Pollock BG, Devanand DP, Frangakis C. Effect of citalopram on agitation in Alzheimer disease: the CitAD randomized clinical trial. JAMA 2014; 311: 682–91. [DOI] [PMC free article] [PubMed] [Google Scholar]
- 9. Cummings JL, Mega M, Gray K, Rosenberg‐Thompson S, Carusi DA, Gornbein J. The Neuropsychiatric Inventory: Comprehensive assessment of psychopathology in dementia. Neurology 1994; 44: 2308–8. [DOI] [PubMed] [Google Scholar]
- 10. Folstein MF, Folstein SE, McHugh PR. ‘Mini‐mental state. J Psychiatr Res 1975; 12: 189–98. [DOI] [PubMed] [Google Scholar]
- 11. Keller DL. Prescribe escitalopram instead of citalopram. Am J Med 2013; 126: e21. [DOI] [PubMed] [Google Scholar]
- 12. Murdoch D, Keam SJ. Escitalopram Drugs 2005; 65: 2379–404. [DOI] [PubMed] [Google Scholar]
- 13. Chen F, Larsen MB, Sánchez C, Wiborg O. The S‐enantiomer of R,S‐citalopram, increases inhibitor binding to the human serotonin transporter by an allosteric mechanism. Comparison with other serotonin transporter inhibitors. Eur Neuropsychopharmacol 2005; 15: 193–8. [DOI] [PubMed] [Google Scholar]
- 14. Sánchez C. The pharmacology of citalopram enantiomers: the antagonism by R‐citalopram on the effect of S‐citalopram. Basic Clin Pharmacol Toxicol 2006; 99: 91–5. [DOI] [PubMed] [Google Scholar]
- 15. Kasper S, Sacher J, Klein N, Mossaheb N, Attarbaschi‐Steiner T, Lanzenberger R, et al. Differences in the dynamics of serotonin reuptake transporter occupancy may explain superior clinical efficacy of escitalopram versus citalopram. Int Clin Psychopharmacol 2009; 24: 119–25. [DOI] [PubMed] [Google Scholar]
- 16. Duffull SB, Wright DFB, Winter HR. Interpreting population pharmacokinetic‐pharmacodynamic analyses ‐ a clinical viewpoint. Br J Clin Pharmacol 2011; 71: 807–14. [DOI] [PMC free article] [PubMed] [Google Scholar]
- 17. Foglia JP, Pollock BG, Kirshner MA, Rosen J, Sweet R, Mulsant B. Plasma levels of citalopram enantiomers and metabolites in elderly patients. Psychopharmacol Bull 1997; 33: 109–12. [PubMed] [Google Scholar]
- 18. Akil A, Bies RR, Pollock BG, Avramopoulos D, Devanand DP, Mintzer JE, et al. A population pharmacokinetic model for R‐and S‐citalopram and desmethylcitalopram in Alzheimer's disease patients with agitation. J Pharm Pharmacol 2016; 43: 99–109. [DOI] [PMC free article] [PubMed] [Google Scholar]
- 19. Bauer RJ. NONMEM users guide: introduction to NONMEM 7.3.0. Hanover, MD: ICON Dev Solut, 2014. [Google Scholar]
- 20. Bozdogan H. Model Selection and Akaike's Information Criterion (AIC): The general theory and its analytical extensions. Psychometrika 1986; 52: 345–70. [Google Scholar]
- 21. Agresti A. Categorical Data Analysis. Hoboken, New Jersey: John Wiley & Sons, 2013. [Google Scholar]
- 22. Sánchez C, Bøgesø KP, Ebert B, Reines EH, Braestrup C. Escitalopram versus citalopram: the surprising role of the R‐enantiomer. Psychopharmacology (Berl) 2004; 174: 163–76. [DOI] [PubMed] [Google Scholar]