The structural changes that underlie ligand activation of nicotinic acetylcholine receptors remain unclear. Using computational tools, Tripathy et al. show that the distance between a nitrogen in the agonist and the center of the neurotransmitter binding pocket provides a good estimate of agonist affinity, efficacy, and efficiency.
Abstract
Agonists turn on receptors because they bind more strongly to active (R*) versus resting (R) conformations of their target sites. Here, to explore how agonists activate neuromuscular acetylcholine receptors, we built homology models of R and R* neurotransmitter binding sites, docked ligands to those sites, ran molecular dynamics simulations to relax (“equilibrate”) the structures, measured binding site structural parameters, and correlated them with experimental agonist binding energies. Each binding pocket is a pyramid formed by five aromatic amino acids and covered partially by loop C. We found that in R* versus R, loop C is displaced outward, the pocket is smaller and skewed, the agonist orientation is reversed, and a key nitrogen atom in the agonist is closer to the pocket center (distance dx) and a tryptophan pair but farther from αY190. Of these differences, the change in dx shows the largest correlation with experimental binding energy and provides a good estimate of agonist affinity, efficacy, and efficiency. Indeed, concentration–response curves can be calculated from just dx values. The contraction and twist of the binding pocket upon activation resemble gating rearrangements of the extracellular domain of related receptors at a smaller scale.
Introduction
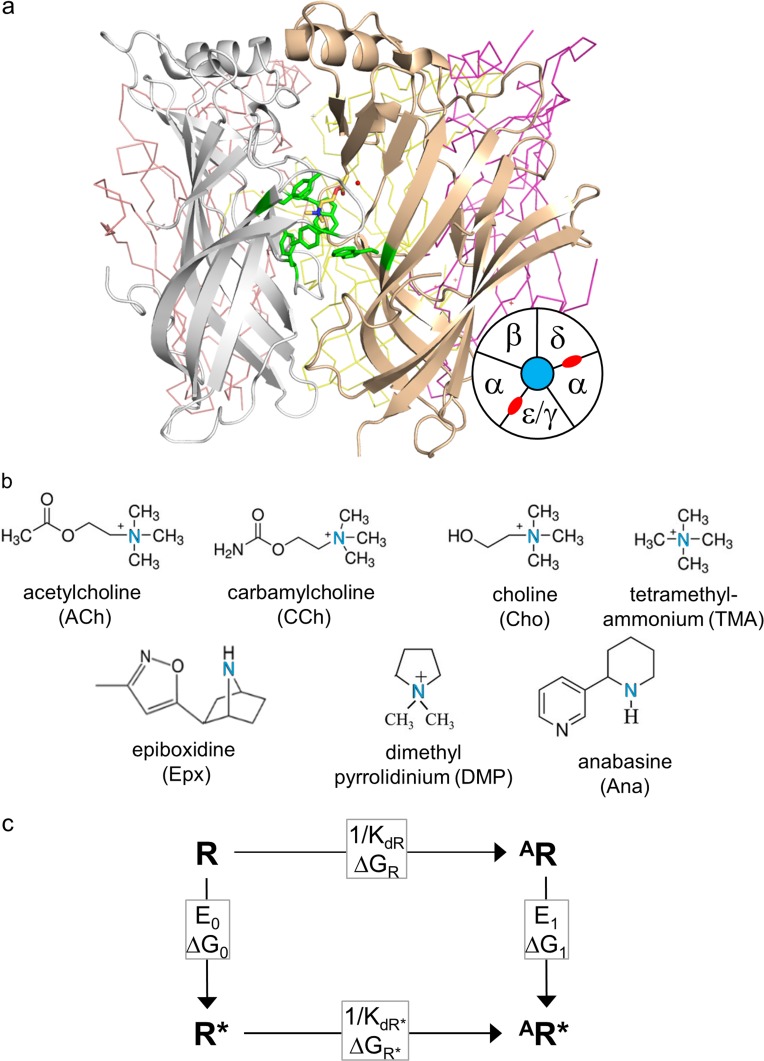
Nicotinic acetylcholine receptors (AChRs) at vertebrate neuromuscular synapses have two neurotransmitter binding sites located in the extracellular domain, at α−δ and either α−ε (adult) or α−γ (fetal) subunit interfaces (Fig. 1 a). These ion channels undergo a global, resting↔active (R↔R*) “gating” isomerization, within which the binding sites change affinity (low↔high), and the ion permeation pathway changes conductance (closed↔open). When the binding sites are unoccupied by agonists, the probability of R* is small, but when the neurotransmitter is present at both sites, the favorable binding energy generated within the channel-opening isomerization boosts this probability to ∼0.95 (Nayak and Auerbach, 2017). Here, we compare static, equilibrated neurotransmitter binding site conformations derived from x-ray and homology-model structures of AChRs in R and R* conformations and occupied by different agonists (Fig. 1 b). This process is analogous to comparing “off” and “on” conformations of voltage-sensing domains in voltage-gated ion channels.
Figure 1.
Sites, agonists, and cycle. (a) Ligand binding sites. Side view of an acetylcholine binding protein, homologous to the AChR extracellular domain (PDB ID: 3WIP; Olsen et al., 2014). Sites are at subunit interfaces. The agonist (ACh, yellow) is surrounded by a cluster of aromatic residues (green). In endplate AChRs, the principal subunit (white) is α and the complementary subunit is δ, ε (adult), or γ (fetal). Bottom right: Top-view schematic of endplate AChR subunits (neurotransmitter binding sites, red). (b) Agonist structures. The principal nitrogen is blue. (c) Cyclic activation scheme for a receptor having one functional binding site. Horizontal, agonist binding and vertical, receptor activation (“gating”). R, resting state (low affinity and closed channel); R*, active state (high affinity and open channel); A, agonist. Boxed, equilibrium constants and free-energy changes (in the direction of the arrow). KdR and KdR*, resting and active equilibrium dissociation constants; E0 and E1, un- and mono-liganded gating equilibrium constants.
At each AChR binding site, a group of aromatic residues—four in the α subunit and one in the complementary ε/δ/γ subunit—determine agonist binding energy (Fig. 1 a; Cohen et al., 1991; Li et al., 2001; Cecchini and Changeux, 2015; Changeux, 2018). These five aromatic rings form an electronegative pocket that hosts the hydrophobic, cationic quaternary amine group of ACh (Zhong et al., 1998; Brejc et al., 2001). The α-subunit aromatics make favorable contributions to ACh binding energy in the order (strongest to weakest) αY190>αW149>αY198>αY93 (Purohit et al., 2012), and a tryptophan in the complementary subunit (δ/εW55 or γW57) makes a large contribution to binding energy at the fetal α−γ site but not at the adult α−ε and α−δ sites (Nayak et al., 2014).
The simplest reaction scheme that describes agonist binding is A+R⇄AR⇄AR*, where A is the agonist and the stable states are apo resting, liganded resting, and liganded active, respectively. In the first step of this sequence, the agonist diffuses to the target and enters the pocket to form a low-affinity complex by a local rearrangement of the binding site called a “catch.” Evidence for this conformational change comes from measurements of agonist association rate constants to R that are slower than diffusion, differ by orders of magnitude for ligands of similar size and charge, and can be highly temperature dependent (Gupta and Auerbach, 2011; Jadey and Auerbach, 2012). In the second step of the reaction sequence (that is, part of gating), the pocket switches from low to high affinity by another binding site rearrangement called a “hold.” Evidence for the local nature of this conformational change is that gating φ values are higher for pocket residues compared with other amino acids, and that mutations of residues outside the pocket have little or no effect on the agonist affinity change (Purohit et al., 2013). Here, we explored structural changes in the "hold" conformational change revealed by comparing AR and AR* binding sites.
The neurotransmitter ACh binds more strongly to the fetal α−γ site compared with α−δ ≈ α−ε (Nayak and Auerbach, 2013). Previously, we used equilibrated homology models of resting AChR binding sites to investigate the structural basis for this ∼2.5-kcal/mol difference in binding energy (Nayak et al., 2016). Swapping side chains in silico, γ↔δ, identified a combination of four amino acids in the vicinity of the binding site that exchanged both ACh binding energy and the contribution of the tryptophan in the complementary subunit. Subsequent electrophysiology experiments confirmed that swapping these side chains indeed exchanges α−γ and α−δ affinities in vitro. That is, equilibrated homology models having side chain substitutions predicted an experimental result that could be used to engineer receptor affinity and cellular responses. This demonstrates that the homology models faithfully represented actual resting AChR binding sites and that the force fields and molecular dynamics simulation protocols were satisfactory.
Three more-recent developments motivated the work described below. First, binding free energies to both R and R* conformations of endplate AChRs were measured experimentally (from single-channel kinetics) for ACh, carbamylcholine (CCh), tetramethylammonium (TMA), and choline (Cho) at individual α−δ, α−ε, and α−γ sites and for epiboxidine (Epx) at α−δ (Nayak and Auerbach, 2017). These comprise an extensive database of experimental binding energies that we could correlate with binding site structures. Second, agonist energy efficiency (η), which is the fraction of binding energy apportioned to the gating conformational change, was measured experimentally for these and other agonists at each kind of binding site (Nayak et al., 2019). η can be different for different agonists at a given site and for the same agonist at different sites, and we sought to explain these results in terms of binding site structures. Third, an x-ray structure of a presumably desensitized neuronal nicotinic AChR was solved (Morales-Perez et al., 2016). Desensitized and active (open channel) AChRs have similar affinities, so this new structure offered the possibility of probing high-affinity R* binding sites. These advances allowed us to generate equilibrated homology structures of all three kinds of AChR binding site in both “off” (low-affinity R) and “on” (high-affinity R*) configurations and correlate structural differences with experimental agonist binding energies.
In brief, a single metric—the distance from a key nitrogen atom in the agonist to the center of the binding pocket—estimates quantitatively all agonist actions and predicts concentration–response curves (CRCs).
Materials and methods
Homology models
We built homology models of the mouse neuromuscular AChR extracellular domain using either adult subunits (α-ε-α-β-δ) or fetal subunits (α-γ-α-β-δ) in both active (R*) and resting (R) conformations. The template for R* was the human α4β2 neuronal nicotinic receptor occupied by nicotine (PDB ID: 5KXI) (Morales-Perez et al., 2016), and the template for R was the Aplysia californica ACh binding protein (AChBP) occupied by epibatidine (PDB ID: 2BYQ; Hansen et al., 2005). AChBP occupied by a conotoxin (PDB ID: 5XGL; Xu et al., 2017) or by ACh (PDB ID: 3WIP; Olsen et al., 2014), as the template for the resting α−γ site produced the same results regarding pocket volume and distances (see below).
Multiple sequence alignments were made with Clustal Omega (Sievers et al., 2011) and were used to build the hetero-pentamer homology models with Modeller v9.1 (Martí-Renom et al., 2000; Webb and Sali, 2014). The agonist was first removed from the starting templates. One hundred unique models for each pentamer were generated and analyzed using Procheck (Laskowski et al., 1993), and five different scores were used to select the R or R* models for docking. The selected models were minimized using a steepest-descent method in NAMD v2.9 (Phillips et al., 2005) and the CHARMM36 force field (Foloppe et al., 2000; Vanommeslaeghe et al., 2010) before docking.
Docking
Each hetero-pentamer has two binding sites: α−δ and either α−γ (fetal) or α−ε (adult) (Fig. 1 a, inset). An agonist (Fig. 1 b) was docked into each binding site of R and R* homology models using the flexible docking method in Autodock v4.2.6 (Morris et al., 2009), which generated 100 independent complexes for each structure. These were clustered based upon energy, and those with the two minimum energy conformations were chosen for MD simulations.
Equilibration
MD simulations were used to relax (equilibrate) the structures. The x-ray or homology model structures were solvated in a water box using TIP3P water and ionized with Na+ and Cl− ions using the Ionize module in VMD program (Humphrey et al., 1996) to neutralize the system and bring the ionic concentration to 150 mM. The water box extended 12 Å beyond the boundary of the protein complex in each dimension.
The simulations were performed using NAMD v2.9 and the CHARMM36 force field. The energy minimization was conducted in four sequential steps. In the first three steps, the complex was minimized by a steepest descent method for 20,000 steps each, during which there was a gradual release of restraints on the protein backbone. In the fourth step, the complex was further minimized for 40,000 steps with added restraints (force constant, 1 kcal/mol/Å2) on protein backbone atoms located >20 Å away from any atom in the ligand. Experiments show that amino acids beyond this distance do not influence agonist binding energy (Gupta et al., 2017). These restraints were enforced throughout the simulations, in order to maintain the global backbone conformation, yet allow atoms near the binding pocket to relax further.
Simulations were performed for each of the ligand–protein complexes for each agonist in AR and AR*. Each simulation comprised five trajectories of 50 ns each. The Nosé-Hoover method (Nosé, 1991) was used to set a temperature of 300°K and pressure of 1 atm. Periodic boundary conditions were applied. 10-Å switching and 12-Å cutoff distances were applied for nonbonded interactions. The particle mesh Ewald method (Deserno and Holm, 1998) was used to calculate long-range electrostatic interactions and the SHAKE algorithm (Hoover, 1985) was used to restrain bond lengths. The simulations were run with time steps of 2 fs, and the coordinates were saved every 1 ps.
To assess the conformational stability of the simulations, the RMSDs of the trajectories from the initial models were calculated for the Cα atoms for all binding sites and with all agonists. The RMSDs of these trajectories were also calculated without loop F, to check its contribution to the fluctuations. The average RMSDs for 10 trajectories was calculated.
Metrics
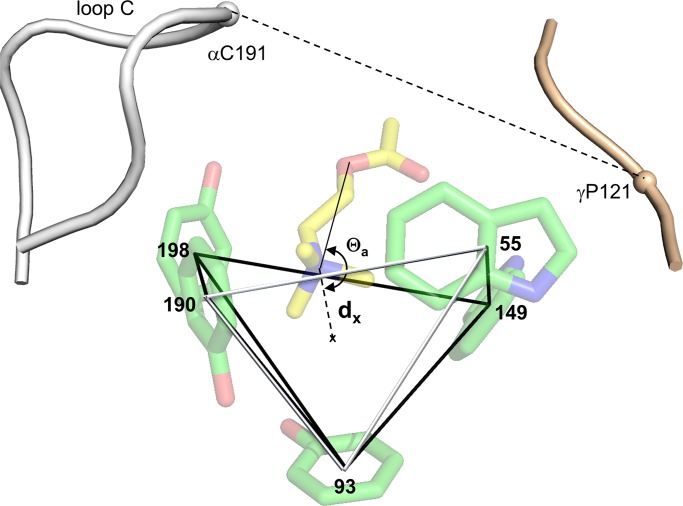
The binding pocket was modeled as a pyramid with vertices at the centers of the five aromatic rings. The volume of the pyramid was calculated as the sum of two adjoining tetrahedrons (common face: residues αY93-αY198-γW55). The volume of each tetrahedron was calculated by using the three-simplex determinant method, using the coordinates of the vertices (Karloff, 2008). A volume was calculated for each structure every 200 ps over the last 30 ns of each trajectory.
Distances were measured from each structure for last 30 ns of every trajectory (AR and AR* conformations, all sites and agonists). dx is the distance between the geometric center of the binding pocket (centroid of the five aromatic rings) and the agonist’s principal nitrogen (Fig. 1 b). The distances between this atom and the center of each aromatic ring are d93, d149, d190, d198, and d55. The distance between the tip of loop C in the principal (α) subunit (backbone center of α192/α193) and the αC of P121 in the complementary ε/γ subunit (P123 in δ) is dloopC. We also measured the distance from the principal nitrogen to the αC of αG147 or αG153, the separation between αC atoms of αG147 and γP121, and the distance between the αW149 backbone oxygen and an agonist oxygen atom. All distances were calculated using VMD v1.9 (Humphrey et al., 1996).
Four angles were measured for each agonist/structure combination. Θa is the agonist orientation angle formed by connecting the center of pocket, the agonist’s quaternary nitrogen (or bridge nitrogen, with Epx) and the closest agonist oxygen. Θs is the skew of the pyramid, defined as the angle between vectors joining the pocket center and (a) the center of the αY93 ring (the pyramid apex) and (b) the center of the pyramid base. ΘW is the orthogonality of the tryptophan pair (αW149 and γW55), estimated as the angle between perpendiculars to the planes of the indole rings. Θp is the angle of the pyramid axis relative to the pore axis. The pyramid axis was defined as the vector joining the center of the pocket with the αC of αH204, a line that passes though the pyramid apex (the center of αY93 ring). The respective coordinates were extracted using VMD v1.9, and the angles were calculated using MatLab (MathWorks).
The number of water molecules was measured in spheres with radii of 5 Å, 10 Å, or 20 Å, with an origin at the geometric center of the pyramid, using VMD.
Correlation with energy
We estimated correlations at the α−γ binding site between experimental agonist binding free energies determined previously by using single-channel electrophysiology (Nayak and Auerbach, 2017) and the above structural parameters. The overall correlation was the Pearson correlation coefficient ρ (Benesty et al., 2009; Sedgwick, 2012), calculated using Matlab:
| (1) |
where A and B are the energy and metric values, μ and σ are the mean and standard deviation of A and B, and N is the sample size (combining all 10 trajectories together for each conformation, N = 150, which is the number of structures taken every 200 ps over the last 30 ns). The significance of ρ was approximated by a t test (Cohen et al., 2014):
| (2) |
With N = 150, the threshold was t = 3.906 (P < 0.0001), which corresponds to ρ = 0.15.
CRCs
CRCs for wild-type AChRs (with two functional neurotransmitter binding sites) were calculated from dx values as follows. For each ligand we estimated resting- and active-state binding energies (ΔGR and ΔGR*) at each site from dxR and dxR* values using the empirical relationship shown in Fig. 10 a (Eq. 6). We then calculated the corresponding resting- and active-state equilibrium dissociation constants (KdR and KdR*) at each site from the free energies:
Figure 10.
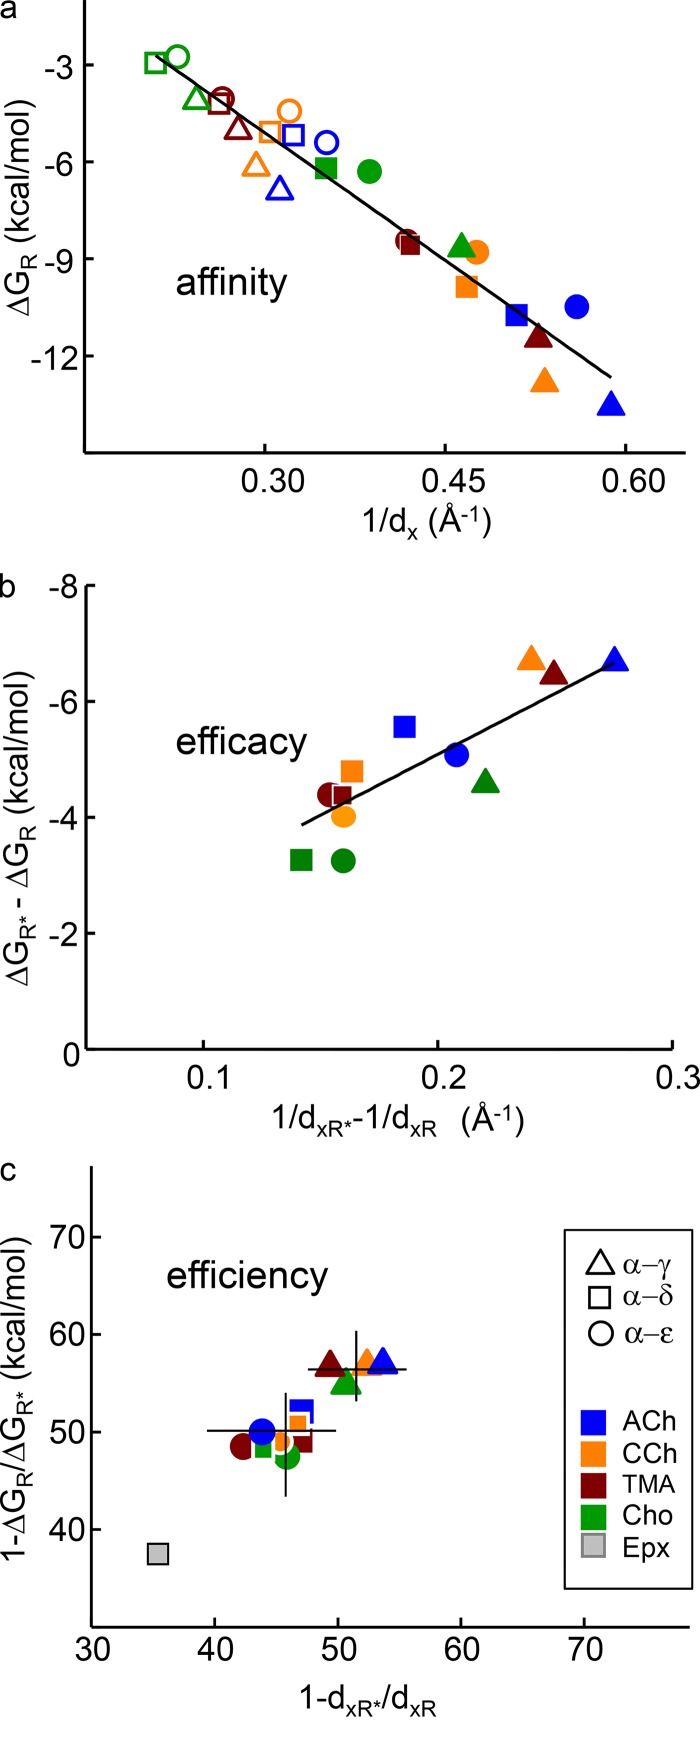
Affinity, efficacy, and efficiency. In each plot, y-axis values are free energies from electrophysiology experiments and x-axis values are distances from equilibrated structures. Open symbols, AR; closed symbols, AR*. (a) Distance between the agonist’s principal nitrogen (Fig. 1 b) and the pocket center (Fig. 3) is correlated linearly with agonist binding energy (Eq. 6; slope = 26.3 ± 1.6 Å · kcal/mol; y-intercept = 2.8 ± 0.6 kcal/mol). (b) Relative efficacy correlates with the active–resting difference in 1/dx. (c) The dx ratio, AR*/AR, predicts energy efficiency (within ∼10%). The higher efficiency of α−γ versus α-δ/ε (lines mark means) and the lower efficiency of Epx are apparent.
| (3) |
Next, for each agonist we calculated a diliganded gating equilibrium constant (E2),
| (4) |
where E0 is the unliganded gating equilibrium constant that is agonist independent and was measured previously to be 3.8 × 10⁻⁸ at a membrane potential of +70 mV in adult-type AChRs (Nayak et al., 2012). We then calculated p, the probability of being diliganded and active at agonist concentration [A],
| (5) |
where x1 is [A]/Kd1 and x2 is [A]/Kd2. In WT AChRs, essentially all of the membrane current arises from diliganded R*, so in a CRC the value of p is the “response.”
Results
Structure
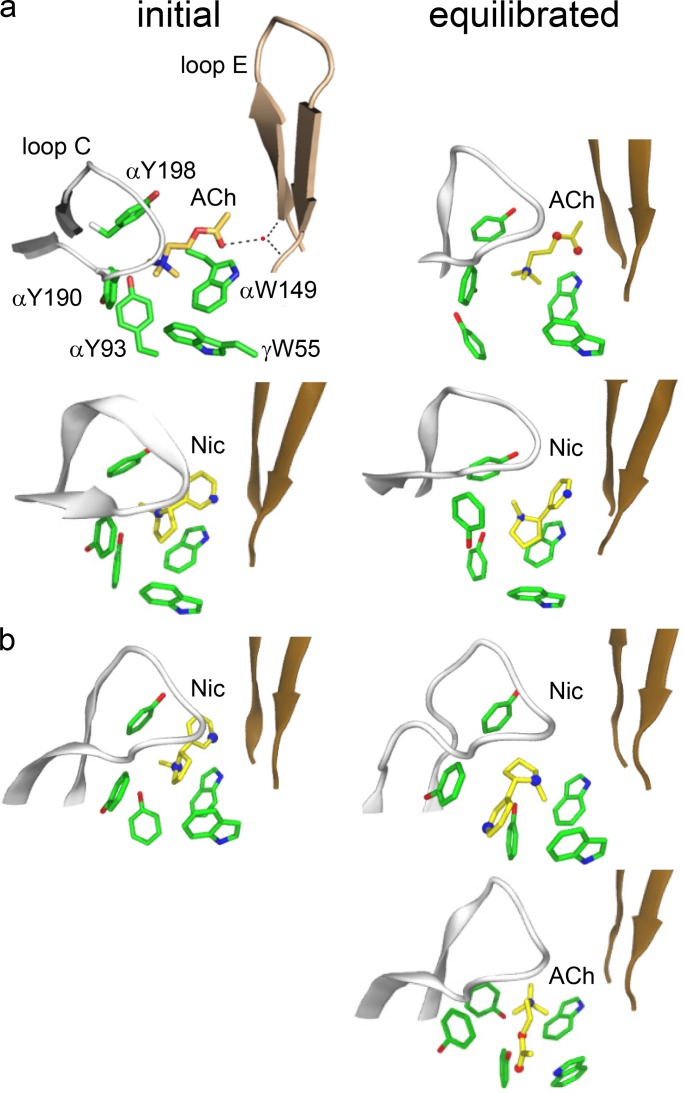
Our objective was to understand the AChR’s primary off↔on switch, which is the AR↔AR* rearrangement of a neurotransmitter binding site. To start, we compared initial and equilibrated binding sites of x-ray structures of AChBP, the template for resting sites (AR), and of an α4β2 nicotinic AChR, the template for active sites (AR*; Fig. 2).
Figure 2.
Binding site structures (x-ray). (a) AChBP with ACh (top; PDB ID: 3WIP; Olsen et al., 2014) or nicotine (bottom; PDB ID: 1UW6; Celie et al., 2004). Dashed lines are H-bonds; red dot is a structural water. (b) α4β2 AChR with nicotine (top; PDB ID: 5KXI; Morales-Perez et al., 2016) or docked ACh (bottom). In both structures, before equilibration the agonist tail points toward the complementary subunit, but after equilibration it is flipped only in α4β2 (Table 1).
To quantify structural differences between resting versus active binding sites, we defined parameters that could be measured and compared: AR versus AR*. Each pocket is a rectangular pyramid with vertices at the centers of the five aromatic rings (Fig. 3). We calculated binding pocket volume as that of the pyramid and estimated 12 other structural metrics. These were (a) seven distances: from the agonist’s principal nitrogen to the pocket center (dx) and each aromatic ring center (d93, d149, d190, d198, d55), and from the tip of loop C to the complementary subunit backbone (dloopC); (b) four angles: for agonist orientation (Θa), pyramid skew (Θs), indole alignment (ΘW), and pocket alignment (Θp); and (c) the density of water in the pocket.
Figure 3.
Binding site structural parameters. Pocket volume was calculated as that of the pyramid formed by joining the centers of the five aromatic rings (front face, white). Distances are between the agonist’s principal nitrogen (Fig. 1 b) and the pocket center (dx) or the five ring centers (d93, d149, d190, d198, and d55), and between loop C and the complementary subunit backbone (dloopC). Angle Θa is the agonist’s orientation. Not shown: angles Θs (pocket skew), ΘW (between indole planes), Θp (between pyramid and pore axes), and density of water in the pocket. PDB ID: 3WIP; residue numbers are for endplate AChRs.
Table 1 shows the values of some of these metrics in the x-ray structures before and after equilibration. Equilibration of AChBP (adding water and ions, raising the temperature to 300°K, and simulating for 20 ns) expands the pocket and points the agonist’s tail more toward the complementary subunit, with both nicotine and ACh. Equilibration of α4β2 (with nicotine only) has little effect on pocket volume but reverses the agonist orientation so that it points away from the complementary subunit. That is, before equilibration in both proteins the agonist’s “tail” points toward the complementary subunit, but after equilibration, this orientation is reversed in AR* but not AR. This result is provisional because the CHARMM36 force field does not incorporate cation–π interactions.
Table 1. Binding site metrics from x-ray structures.
| R | R* | |||
|---|---|---|---|---|
| AChBP 1UW6, Nic | α4β2 AChR 5KXI, Nic | |||
| Initial | Equilibrated | Initial | Equilibrated | |
| dx | 2.8 | 3.8 | 2.1 | 1.9 |
| dloopC | 12.9 | 12.9 | 13.5 | 14.6 |
| volume | 89.2 | 105.1 | 82.4 | 85.6 |
| Θs | 2.4 | 2.3 | 7.5 | 7.3 |
| Θa | 98.0 | 80.4 | 67.38 | 319.6 |
| 3WIP, ACh | 5KXI, ACh | |||
| Initial | Equilibrated | Initial | Equilibrated | |
| dx | 2.2 | 3.2 | - | 2.2 |
| dloopC | 14.3 | 13.8 | - | 14.9 |
| volume | 97.8 | 116.7 | - | 56.7 |
| Θs | 2.3 | 2.3 | - | 7.4 |
| Θa | 114.3 | 87.5 | - | 303.1 |
Distances, Å; volume, Å3; angles, degrees. Nic, nicotine.
Comparing the equilibrated, nicotine-occupied structures, in α4β2 pocket volume and dx are smaller, loop C is displaced outward, and agonist orientation is reversed. These differences were apparent in all trajectories.
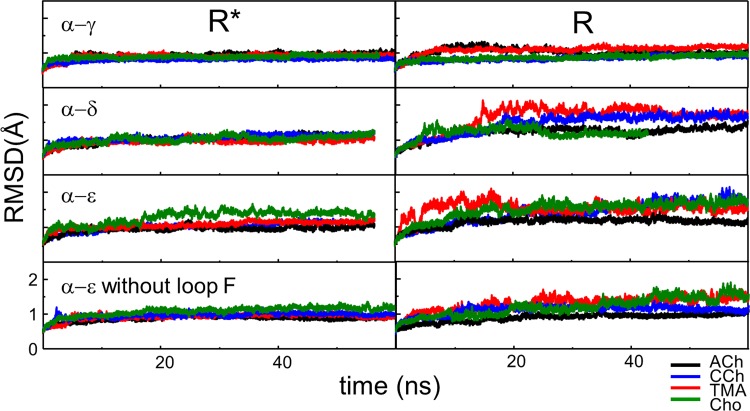
Next, we compared resting and active structures of endplate AChR neurotransmitter binding sites. We built homology models, docked ligands, equilibrated using MD, and measured the structural parameters. Fig. 4 shows the backbone RMSD for example trajectories. The system stabilized within ∼10 ns, with most of the remaining fluctuations generated by loop F.
Figure 4.
RMSD of the protein backbone. The backbone equilibrates within ∼10 ns. Most of the residual fluctuations are from loop F.
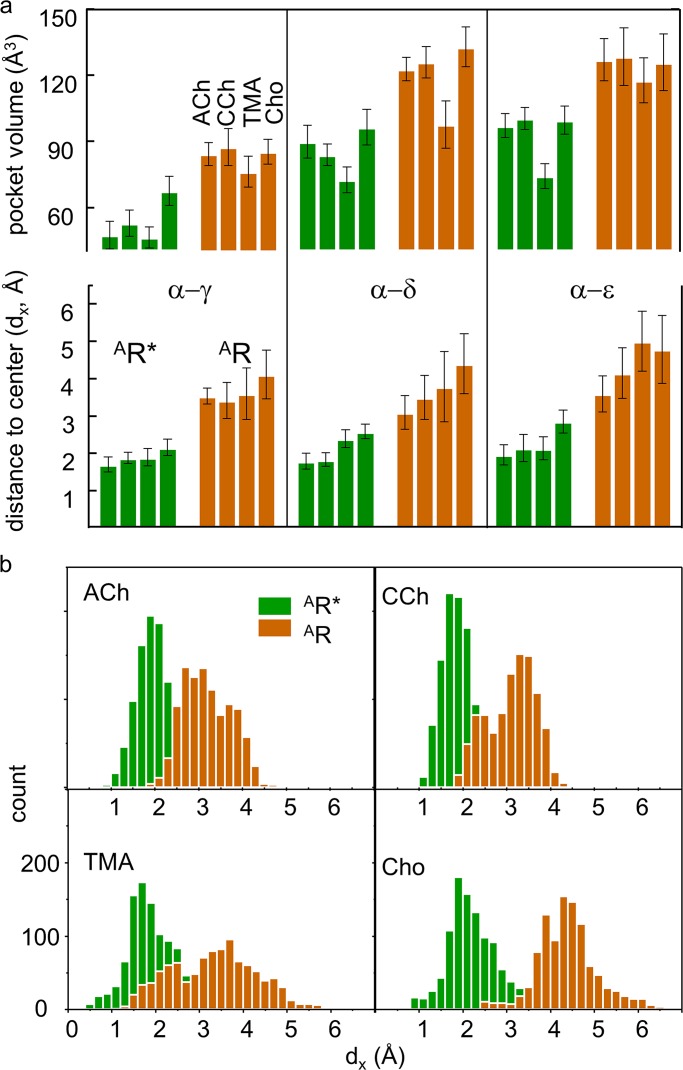
ACh-class agonists (ACh, CCh, TMA, and Cho; Fig. 1 b) are small and have a quaternary amine group. Fig. 5 a (top) shows pocket volumes for these four ligands at each kind of binding site in both resting and active conformations. As in the x-ray structures, for all ligands and sites the volumes are smaller in AR* compared with AR. In both AR and AR*, pocket volume is smallest at α−γ with all agonists and with TMA (the smallest agonist) at all sites.
Figure 5.
Pocket volume and dx. Resting, brown and active, green. (a) Top: Pocket volume. With all agonists, α−γ is the smallest (AR and AR*). At all sites, AR* is smaller than AR (all agonists) and pocket volume is smallest with TMA. Bottom: dx. Distance between the agonist’s principal nitrogen and the pocket center is approximately twofold smaller in AR* versus AR (all sites and agonists). (b) Example dx distributions. Each panel shows results from two MD trajectories (α−γ).
Fig. 5 a (bottom) shows dx values. At each site, the distance from the quaternary nitrogen atom to the pocket center is related inversely to binding energy in both resting and active conformations (ACh>CCh>TMA>Cho). At all sites and for all agonists, dx is approximately twofold smaller in active versus resting conformations. Fig. 5 b shows distributions of dx from individual trajectories that are approximately Gaussian and have a variance that is largest with TMA. The equilibrated homology structures suggest that, in the activation step, AR→AR*, the pocket shrinks, and the agonist becomes more centered within the pocket.
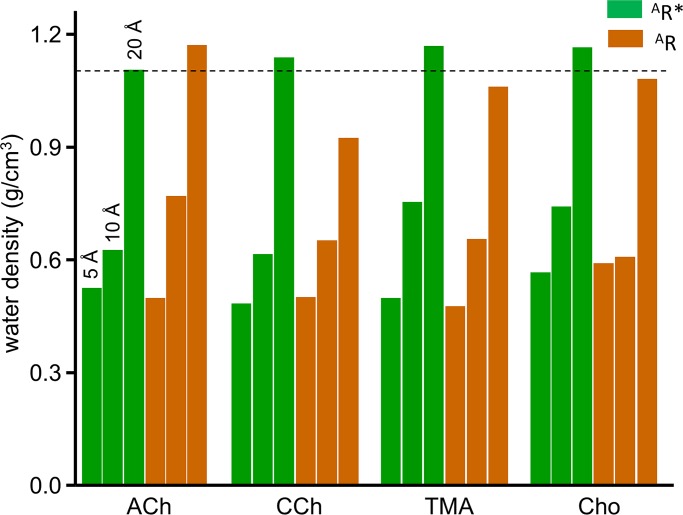
Fig. 6 shows calculated densities of water for spheres of different radii having the pocket center as the origin. This density is 0.49 g/cm3 for a 5-Å radius (inside the pocket) in both AR* and AR for all agonists and at all sites, which is about half the water density in the bulk solution. Although the pocket is smaller in AR* versus AR, pocket water density is the same.
Figure 6.
Water density. The number of water molecules was counted in spheres of radii 5, 10, and 20 Å, with the origin at the pocket center (α−γ). There is no significant difference between AR and AR* conformations or between agonists. The 20 Å values are the same as for the bulk solution (dashed line, 1 molecule per Å3 or 29.8 g/cm3).
In the active versus resting structures, the binding pocket is slightly skewed, and both ACh and CCh have reversed their orientation (Table 2). These differences are similar qualitatively to those apparent with ACh and nicotine in equilibrated x-ray structures (Table 1).
Table 2. Pyramid skew and agonist orientation, AR* versus AR homology structures (α−γ).
| Agonist | ΔΘs (degrees) | ΘaR* (degrees) | ΘaR (degrees) |
|---|---|---|---|
| ACh | 2.9 | 292.7 ± 9.8 | 125.2 ± 8.9 |
| CCh | 2.8 | 288.3 ± 9.3 | 123.9 ± 6.4 |
| TMA | 2.7 | - | - |
| Cho | 2.7 | 104.5 ± 7.6 | 126.4 ± 6.5 |
Positive ΔΘs is counterclockwise.
In the homology structures, the weak partial agonist Cho has the same orientation in resting and active sites (TMA does not have an orientation). To explore this further, we estimated the probability of H-bonds in the vicinity of the agonist’s tail. In AChBP, H-bonds tether the tail of ACh to the base of the loop E β-hairpin in the complementary subunit via a structural water (Fig. 2 a, left). In the AChR homology structures, the probability of H-bond formation within 3 Å of the carbonyl oxygen of ACh (94%) or CCh (59%) was 1.5-fold greater than in the rest of the pocket (AR*, α−γ). Previous results suggest that an H-bond between the Cho hydroxyl and the αW149 backbone serves to position the quaternary amine off center, to generate a weak resting binding energy for this ligand (Bruhova and Auerbach, 2017). Consistent with this hypothesis, in the equilibrated homology structures, the distance to the αW149 backbone is smaller for Cho than for the other agonists, even if it is the same in AR and AR* configurations (Table 3). These results suggest that ACh and CCh reverse orientation because they are tethered to the complementary subunit in resting but not in active pockets, but that Cho does not reverse orientation because it is tethered similarly to the α-subunit backbone at αW149 in both AR and AR* conformations.
Table 3. Distance between agonist oxygen and αW149 backbone (α−γ).
| Agonist | State | Distance (Å) |
|---|---|---|
| ACh | AR* | 7.8 ± 1.1 |
| AR | 8.1 ± 1.4 | |
| CCh | AR* | 7.7 ± 1.0 |
| AR | 8.3 ± 1.5 | |
| Cho | AR* | 6.3 ± 1.4 |
| AR | 6.6 ± 1.0 |
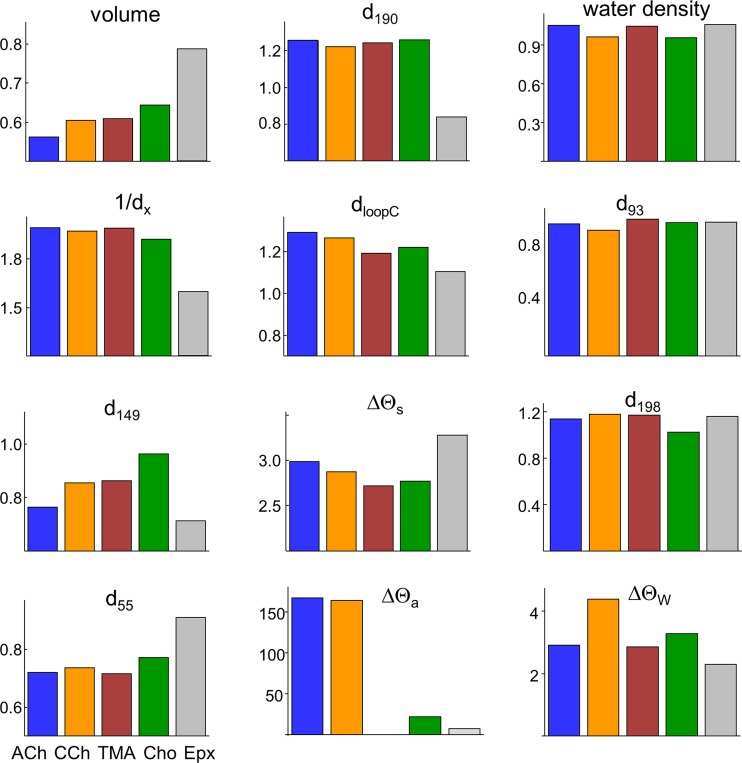
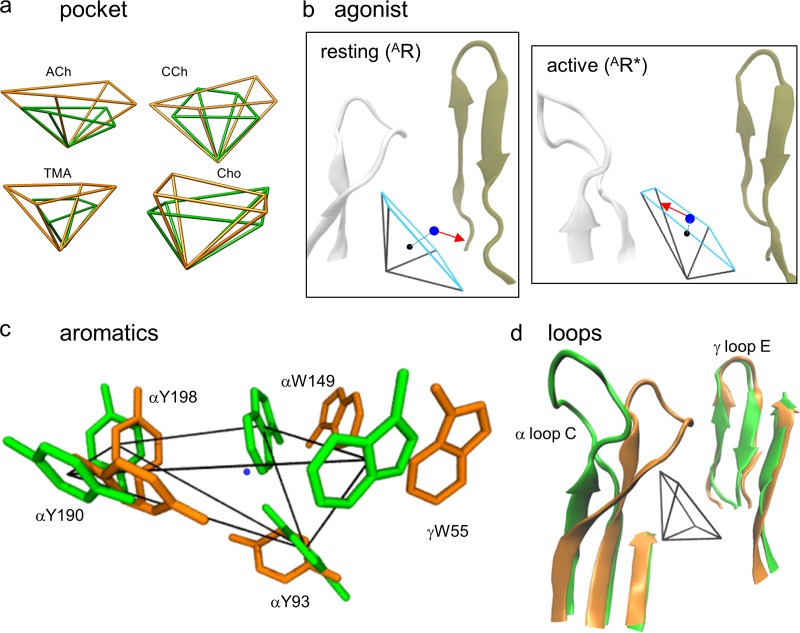
Fig. 7 compares all 12 structural metrics in resting versus active conformations. The pocket volume for ACh-class agonists and the distance of the quaternary nitrogen to the pocket center are smaller in AR* compared with AR, regardless of the resting equilibrium dissociation constant that at α−γ ranges from ∼10 µM for ACh to ∼1 mM for Cho. In AR*, the distance from the principal nitrogen to the tryptophan rings (d149 and d55) decreases, whereas the distance to a loop C tyrosine (d190) increases. In the homology structures, the separation between the tip of loop C and the complementary subunit backbone (dloopC) is larger in the active conformation, a result we consider further in the Discussion. As discussed earlier in this section, in AR* compared with AR, the agonist orientation is reversed (ΔΘa), and the pocket is twisted slightly (ΔΘs). The right column of Fig. 7 shows the four metrics that were the same in AR and AR* and for all sites and agonists: water density, d93, d198, the alignment of the indole rings (ΔΘW; ∼87°), and the angle between the pyramid axis and the pore axis (ΔΘW; 55.5 ± 1.7°; see Fig. 9 d).
Figure 7.
Resting versus active α−γ pocket metrics. Distances are AR*/AR ratios and angles are AR* – AR differences. Left and center columns: Metrics that differ significantly between AR* and AR. For ACh-class agonists (colored bars), in R* pocket volume is ∼40% smaller and 1/dx is ∼50% smaller. For Epx (gray), in R* pocket volume is 22% smaller and 1/dx is 37% smaller. Right column: Metrics that are the same in R and R*.
Figure 9.
Resting versus active α−γ neurotransmitter binding site. (a) For all agonists, the active pocket (AR*, green) is smaller than the resting pocket (AR, brown; Fig. 3). (b) AR* versus AR with ACh. In the active state, the agonist’s quaternary nitrogen (blue dot) is closer to the pocket center (black dot) and the agonist’s tail (red arrow) points away from the complementary subunit. (c) With ACh, in AR* versus AR, the tryptophan pair is closer to and αY190 is further from the quaternary nitrogen of ACh (blue dot). (d) In AR* versus AR, loop C in the α subunit is displaced outward, but loop E in the γ subunit is the same. The pore axis is approximately vertical.
In electrophysiology experiments, mutations of γP121 (Ohno et al., 1996; Gupta et al., 2013), αG147 (Gupta et al., 2013), and αG153 (Sine et al., 1995; Jadey et al., 2013) impact resting binding energy. In the simulations, the separations between the αC atoms of these residues and the quaternary nitrogen of the agonist are not different significantly in AR versus AR*. With regard to intersubunit backbone distances, the separation between the αC of γ/εP121 (δP123) and αG147, two residues that interact energetically, also is the same in AR and AR*.
To summarize, at all three kinds of binding site and for four ACh-class agonists, eight binding site structural parameters differ significantly between resting and active conformations: pocket volume; distances dx, d190, d149, d55 and dloopC; and angles Θa and Θs.
We also examined binding sites occupied by Epx, an agonist that, instead of a compact quaternary amine, has a large azabicycloheptane group (Fig. 1 b). As described elsewhere, Epx is an epibatidine class of agonists that at α−δ has a lower energy efficiency (39%) than ACh-class agonists (52%; Nayak et al., 2019). Structural metrics for Epx and ACh are compared in Table 4. At resting binding sites, pocket volume and dx are larger with Epx compared with ACh. The largest and smallest agonists, Epx and TMA, have the largest and smallest pocket volumes. Fig. 7 shows that the active/resting ratios in pocket volume and shape (dx and d190) are significantly smaller with Epx compared with the smaller agonists.
Table 4. Comparison of Epx and ACh binding site metrics (α−γ).
| Structural metrics | ACh | Epx | ||
|---|---|---|---|---|
| AR | AR* | AR | AR* | |
| dx (Å) | 3.5 | 1.7 | 4.9 | 3.1 |
| d93 | 6.4 | 6.1 | 8.1 | 4.9 |
| d149 | 6.6 | 5.0 | 7 | 5.0 |
| d190 | 5.6 | 7.0 | 7.7 | 6.4 |
| d198 | 5.3 | 5.0 | 8.8 | 6.6 |
| d55 | 7.7 | 5.5 | 5.7 | 5.1 |
| dloopC | 17.1 | 19.9 | 13.6 | 15.3 |
| volume (Å3) | 84.2 | 47.4 | 116.3 | 91.4 |
| Θs (degrees) | 5.4 | 2.4 | 5.7 | 2.3 |
| Θa | 125.2 | 292.7 | 45.6 | 321.5 |
Energy
We next investigated the correlations between binding site metrics and agonist binding energy measured by using electrophysiology. We focused on ACh-class agonists at α−γ and the eight metrics that differ between AR and AR*.
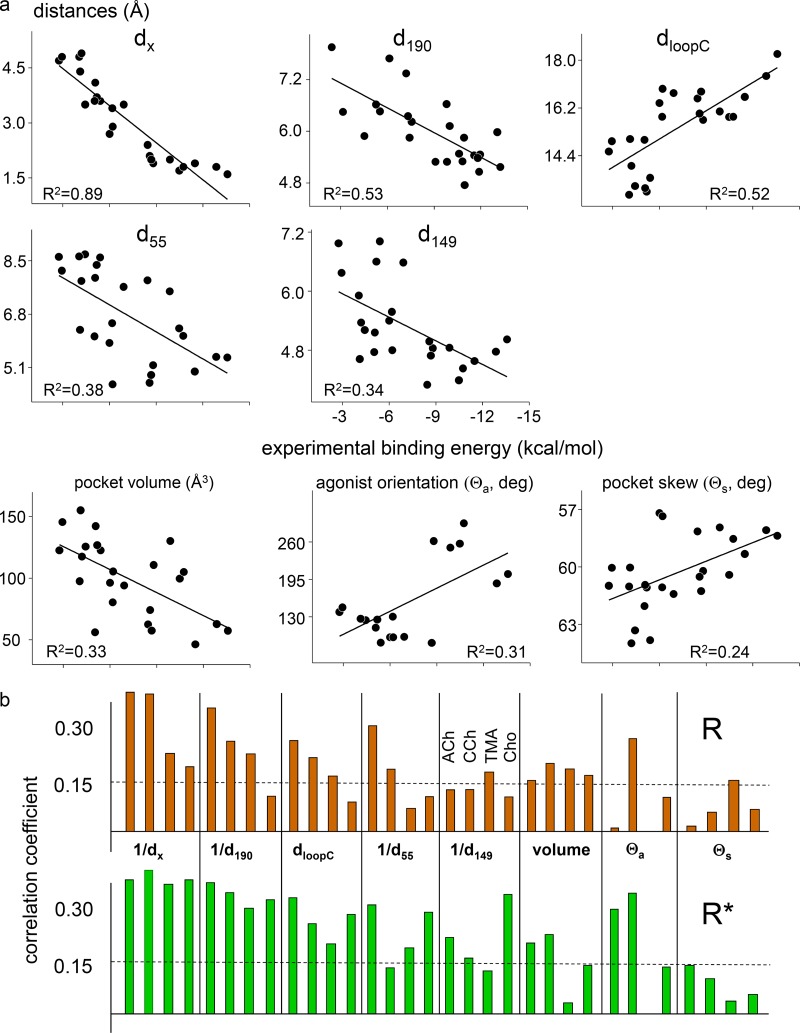
Fig. 8 shows the correlations. Considering all agonists and sites, the largest and most consistent correlation with experimental binding energy in both AR and AR* conformations is with 1/dx, followed by 1/d190 and dloopC. Pocket volume, 1/d149, 1/d55, and Θa are correlated modestly, and Θs is not correlated.
Figure 8.
Energy–structure correlations. (a) Linear correlations between experimental binding energy and binding site metrics (ACh, CCh, TMA, and Cho; all sites; AR and AR*). The highest correlation is with dx. (b) Pearson’s correlation coefficients by agonist (dashed lines, P < 0.0001 significance threshold).
There are some caveats. (a) Some metrics likely are correlated with others, for instance, dloopC and d190 (a residue in loop C). We think that dx just happens to be the single structural parameter that best encompasses the complex combination of ligand–protein interactions that determines ligand binding energy. (b) Correlation does not imply cause and effect. Here, we did not associate the reduction in dx upon activation with any particular molecular forces. (c) A metric that is not correlated with energy may still be important in the AR⇄AR* transition. For instance, the reversal in agonist orientation may be required for ACh and CCh, even if its extent is not correlated with the magnitude of the binding energy change. The main differences between AR and AR* conformations are summarized in Fig. 9.
In pharmacology, agonist actions at a binding site are characterized by resting affinity (1/Kd), relative efficacy (the maximum achievable response above the baseline), and energy efficiency (the fraction of agonist binding energy applied to gating). In terms of the energies of cyclic activation scheme (Fig. 1 c), these correspond to ΔGR, ΔGR* − ΔGR, and 1 − ΔGR/ΔGR*, respectively. Fig. 10 shows experimental values of these energy functions plotted against corresponding functions of dx. To a first approximation, dx values predict agonist resting affinity, relative efficacy, and energy efficiency. The match between dx and agonist binding energy is over a range of 3.6 Å in distance and, remarkably, an 11-kcal/mol range in energy that corresponds to a 108-fold range in equilibrium dissociation constant.
For ACh-class agonists and in both active and resting conformations, the empirical relationship between distance (dx in Å) and binding energy (ΔG in kcal/mol; Fig. 10 a) is
| (6) |
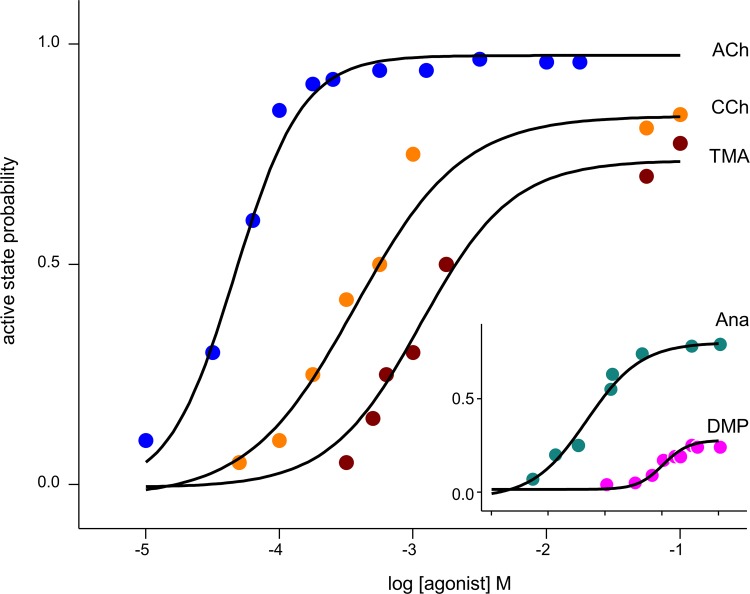
This equation allows the calculation of CRCs from dx. Briefly, the procedure (see Methods) is to convert dx values into free energies and then into equilibrium constants, and then calculate the probability of being in R* (the response) at a given agonist concentration. Fig. 11 shows CRCs for ACh, CCh, and TMA for adult-type AChRs calculated from dx values at α−ε and α−δ (continuous lines) superimposed on experimental patch-clamp results (symbols) (Jadey and Auerbach, 2012). The match is excellent. A complete CRC can be estimated accurately from a single structural metric, dx.
Figure 11.
CRCs. Symbols are from electrophysiology experiments, and solid lines are calculated from dx values. Inset: CRCs for two agonists that were not used in the energy–dx correlation (Fig. 10 a). See Fig. 1 b for agonist structures.
This agreement between calculated and experimental CRCs, however, is not surprising, because the agonists were used to calibrate the energy–distance relationship (Fig. 10 a and Eq. 6). To further test the ability of dx to predict function, we docked, equilibrated, and measured this distance for two agonists that also have an energy efficiency of ~50% but that were not used in the calibration: dimethylpiperizinium (DMP; Jadey and Auerbach, 2012) and anabasine (Ana; Jadey et al., 2013). DMP has a quaternary nitrogen, and Ana has a piperidyl nitrogen (Fig. 1 b). The CRCs calculated for these ligands by using Eq. 6 agree with experimental results (Fig. 11, inset).
Discussion
To understand how agonists turn on receptors, we compared equilibrated structures of resting and active conformations of AChR neurotransmitter binding sites (Fig. 9). In the active versus resting conformation, (a) the aromatic pocket is smaller; (b) the agonist molecule points away from the complementary subunit, is closer to the pocket center and a tryptophan pair but further from αY190; and (c) loop C is displaced outward. Of these, the approach of the agonist toward the center of the pocket is the structural change most correlated with the affinity change that activates the receptor. Indeed, a complete CRC can be estimated from just this distance.
Activation dynamics
A comparison of the static, equilibrated structures suggests the following dynamic rearrangements at the binding site in the activation process. With or without agonists, the pocket alternates between large- and small-volume configurations, R⇄R*. With only water present, we speculate that unfavorable interactions between the aromatic rings generate a large energy barrier that makes pocket contraction improbable and, therefore, unliganded openings infrequent.
A neurotransmitter molecule arrives by diffusion to form an “encounter” complex and then enters the pocket by a local conformational change to form a low-affinity complex. In AR, the agonist is not centered in the pocket, perhaps because its tail is tethered by H-bonds to the complementary subunit. Despite being off center, the presence of the positively charged nitrogen lowers the energy barrier separating the alternative pocket configurations to facilitate pocket contraction and the establishment of a high-affinity complex. Consequently, openings (transitions into AR*) are frequent when both neurotransmitter binding sites are occupied by ACh. Experiments show that each ACh molecule increases the opening rate constant by a factor of ∼5,700 (Jadey et al., 2011).
At some point in the pocket-contraction process, loop C is displaced outward along with αY190, and the quaternary nitrogen ends up closer to the pocket center, a movement that is perhaps facilitated by breaking the tether to the complementary subunit. The net consequence is to approximately double the ACh binding energy. These binding site conformational changes likely are not independent and perfectly synchronous, but we have no information regarding which events are coupled energetically or their sequence.
The scenario is similar with Cho, an ACh precursor and breakdown product that is present at high concentrations at cholinergic synapses. However, this very weak agonist of endplate AChRs is tethered to the principal subunit backbone at αW149 by an H-bond that is retained in the AR→AR* transition. Even though the fold decreases in pocket volume and dx are similar for Cho and ACh, the initial, suboptimal positioning of Cho causes the frequency of openings to increase much less than with ACh. Experiments show that each Cho molecule increases the opening rate constant by a factor of only ∼270 (Bruhova and Auerbach, 2017).
We hypothesize that the H-bonds that tether ACh and Cho in AR serve to keep the resting affinity low by preventing the quaternary nitrogen from reaching the center, so that when the pocket does contract, there is a free energy source available for activation.
Function from structure
Two experimental results were required to make the CRCs shown in Fig. 11: the fitted energy–distance relationship (Fig. 10 a) and ΔG0. (CRCs showing relative differences between agonists can be calculated without ΔG0.) Notably, CRCs calculated from dx values for two agonists that were not used to calibrate dx were accurate. It may be that Eq. 6 applies to a wide variety of small ligands that have energy efficiencies of ∼50%, regardless of the chemical form of their principal nitrogen (quaternary, bridged, piperidyl, and, perhaps, pyrrolidyl as in nicotine).
The templates for R and R*, an AChBP and an α4β2 nicotinic receptor, generated homology structures that apparently are accurate representations of actual adult and fetal endplate AChRs. This finding suggests that it may be possible to estimate CRCs from dx values, not only for other agonists at neuromuscular AChR transmitter binding sites, but also for agonists of other nicotinic receptor subtypes. Perhaps the approach we have used to calculate function from structure can in the future be generalized to encompass a wider range of ligand–receptor combinations.
In this regard, the results regarding energy efficiency are relevant. Fig. 10 c shows that it is possible to estimate efficiency from just dx values without using any distance–energy correlation. In terms of binding energies, efficiency is 1 − (ΔGR/ΔGR*) and, by substituting 1/dx for energy, we generate an expression for a distance efficiency:
| (7) |
At α−δ, the dx ratios for ACh, DMP, Ana, and Epx are 0.49, 0.51, 0.55, and 0.63 yielding ηd values of 51, 49, and 45, and 37%, respectively. These values agree with the corresponding, experimentally determined energy efficiencies of 53, 52, and 44, and 39%, respectively (Jadey et al., 2011, 2013; Nayak et al., 2019). Fig. 10 c also shows that distance efficiencies reveal the small α−δ versus α−γ difference in energy efficiency apparent in experiments. We conclude that agonist energy efficiency can be estimated from binding site structure alone.
Binding site flexibility
The overall structures of all three kinds of AChR binding site are similar with all ACh-class agonists. Pocket volume is slightly smaller with TMA and the distance to the αW149 backbone is slightly smaller with Cho, but these minor agonist dependencies are the same in AR and AR* and therefore are unrelated to activation. Aside from these exceptions, we are unable to distinguish from the pocket metrics alone which agonist is present, even if we can distinguish easily α-γ from α-δ/ε and AR from AR*. This suggests that for ACh-class agonists, the large- and small-pocket configurations are essentially agonist independent and, hence, that the ligand does not induce significant local conformational changes that influence affinity. Rather, the results suggest that it is the position of the ligand within preexisting, alternative conformations of the pocket that is the predominant, agonist-dependent influence on binding energy. We speculate that in unliganded gating (with only water in the pocket), the binding pockets switch between the same essential, large↔small, R↔R* structures.
The pocket, however, appears to be malleable (Ma et al., 2017). The pocket is larger with Epx compared with the other agonists we studied (Table 4). Also, with Epx, the changes in pocket structure upon activation are smaller (but in the same direction) as with the ACh-class agonists. More agonists need to be examined, but the results so far suggest that the pocket can adapt to agonists of different sizes and that energy efficiency decreases when the resting pocket is stretched by a bulky ligand.
Loop C
The role of loop C in receptor activation has garnered considerable attention (Maet al., 2017; Absalom et al., 2004; Gao et al., 2005; Cheng et al., 2006; Ulens et al., 2006). This loop contains two tyrosines, αY190 and αY198, that make important contributions to agonist binding energy. In all equilibrated x-ray and homology structures, the conformation of loop C in the active AR* conformation is displaced outward relative to AR by ∼3 Å, increasing the exposure of the aromatic cage to the bulk solution. This result is consistent with experimental measurements showing that the association rate constants of ACh, CCh, TMA, and Cho are up to ∼1,000-fold larger (and close to the diffusion limit) to active versus resting binding sites (Nayak and Auerbach, 2017). The higher affinity of the active R* binding site is caused by both a slower agonist “off” rate and a faster agonist “on” rate. This observation is consistent with the simulation results showing that loop C uncovers the pocket when the receptor is in the active conformation, but it is inconsistent with the idea that loop C covers (“caps”) the binding site in the active state to generate high affinity (see next paragraph). Regardless, loop C capping cannot be an essential event in receptor activation, because removing it completely has essentially no effect on unliganded gating (Purohit and Auerbach, 2013).
Some evidence, however, suggests that loop C capping increases during receptor activation. Targeted MD simulations of an α7 AChR homology model showed that loop C moves to cover the binding site in the apo-to-liganded transition (Cheng et al., 2006). These simulations compared loop C positions in R versus AR, whereas ours compare loop C in AR versus AR*, so the results do not necessarily conflict. Also, in AChBP, loop C is more capped when the pocket is occupied by AChR agonists compared with antagonists (Ma et al., 2017), which has been interpreted to indicate that activating ligands induce capping. However, the antagonists in question were all larger than the agonists and so may (like Epx) stretch the pocket to reduce the extent of capping (Table 4). Furthermore, AChBP is not an allosteric protein and does not switch AR↔AR*, so variations in loop C position with different ligands may be different than variations in the resting↔active conformational change at AChR binding sites. Finally, it has been reported that in AChRs, cross-linking the tip of loop C to the complementary subunit increases substantially the probability of unliganded openings (Mukhtasimova and Sine, 2018). This may or may not relate to the change in loop C position that takes place upon receptor activation with a ligand in place. Cross-linking of subunits is a major structural perturbation that could disturb the entire extracellular domain and promote activation by causing a contracture of an empty binding pocket. In summary, evidence regarding loop C displacement in AChR activation is not definitive. A comparison of high-resolution structures of liganded resting (AR) and active (AR*) liganded binding sites may settle the question of loop C capping during activation.
Our analyses did not address the nature of the “catch” conformational change (R↔AR). However, the free energy changes in catch and in hold correlate linearly (Jadey and Auerbach, 2012; Purohit et al., 2014), so it is possible that some or all of the structural changes we have identified in the activation process may also occur in agonist binding to the resting state. The AR→AR*, hold conformational change of the binding pocket occurs at the onset of the global, channel-opening process (Purohit et al., 2013), and the contraction and counterclockwise twist of the pocket are microcosms of the motions of the extracellular domain apparent in channel opening in related receptors (Taly et al., 2006; Sauguet et al., 2014; Martin et al., 2017). It is possible that the structural changes of the neurotransmitter binding pockets upon activation are coupled directly to those in the rest of the extracellular domain and, hence, nucleate the full gating transition.
Acknowledgments
We thank M. Shero, M. Teeling, and J. Jordan for technical assistance; T. N. Nayak for helpful discussions; and the UB Center for Computational Research for the use of their resources.
This work was funded by the National Institutes of Health (NS064969).
The authors declare no competing financial interests.
Author contributions: A. Auerbach and W. Zheng designed the experiments. S. Tripathy conducted research and analyzed the data. A. Auerbach wrote the paper.
Richard W. Aldrich served as editor.
References
- Absalom N.L., Lewis T.M., and Schofield P.R.. 2004. Mechanisms of channel gating of the ligand-gated ion channel superfamily inferred from protein structure. Exp. Physiol. 89:145–153. 10.1113/expphysiol.2003.026815 [DOI] [PubMed] [Google Scholar]
- Benesty J., Chen J., Huang Y., and Cohen I. (2009). Pearson correlation coefficient. Noise reduction in speech processing. Springer Topics in Signal Processing. Vol. 2. Springer, Berlin, Heidelberg. 1–4. [Google Scholar]
- Brejc K., van Dijk W.J., Klaassen R.V., Schuurmans M., van Der Oost J., Smit A.B., and Sixma T.K.. 2001. Crystal structure of an ACh-binding protein reveals the ligand-binding domain of nicotinic receptors. Nature. 411:269–276. 10.1038/35077011 [DOI] [PubMed] [Google Scholar]
- Bruhova I., and Auerbach A.. 2017. Molecular recognition at cholinergic synapses: acetylcholine versus choline. J. Physiol. 595:1253–1261. 10.1113/JP273291 [DOI] [PMC free article] [PubMed] [Google Scholar]
- Cecchini M., and Changeux J.-P.. 2015. The nicotinic acetylcholine receptor and its prokaryotic homologues: Structure, conformational transitions & allosteric modulation. Neuropharmacology. 96:137–149. 10.1016/j.neuropharm.2014.12.006 [DOI] [PubMed] [Google Scholar]
- Celie P.H., van Rossum-Fikkert S.E., van Dijk W.J., Brejc K., Smit A.B., and Sixma T.K.. 2004. Nicotine and carbamylcholine binding to nicotinic acetylcholine receptors as studied in AChBP crystal structures. Neuron. 41:907–914. 10.1016/S0896-6273(04)00115-1 [DOI] [PubMed] [Google Scholar]
- Changeux J.-P. (2018). The nicotinic acetylcholine receptor: a typical ‘allosteric machine’. Phil. Trans. R. Soc. B 373:20170174. [DOI] [PMC free article] [PubMed]
- Cheng X., Wang H., Grant B., Sine S.M., and McCammon J.A.. 2006. Targeted molecular dynamics study of C-loop closure and channel gating in nicotinic receptors. PLOS Comput. Biol. 2:e134 10.1371/journal.pcbi.0020134 [DOI] [PMC free article] [PubMed] [Google Scholar]
- Cohen J.B., Sharp S.D., and Liu W.S.. 1991. Structure of the agonist-binding site of the nicotinic acetylcholine receptor. [3H]acetylcholine mustard identifies residues in the cation-binding subsite. J. Biol. Chem. 266:23354–23364. [PubMed] [Google Scholar]
- Cohen P., West S.G., and Aiken L.S.. 2014. Applied Multiple Regression/Correlation Analysis for the Behavioral Sciences. Third edition. Lawrence Erlbaum Associates, Mahwah, NJ. 10.4324/9781410606266 [DOI] [Google Scholar]
- Deserno M., and Holm C.. 1998. How to mesh up Ewald sums. I. A theoretical and numerical comparison of various particle mesh routines. J. Chem. Phys. 109:7678–7693. 10.1063/1.477414 [DOI] [Google Scholar]
- Foloppe N., MacKerell J., and Alexander D.. 2000. All-atom empirical force field for nucleic acids: I. Parameter optimization based on small molecule and condensed phase macromolecular target data. J. Comput. Chem. 21:86–104. [DOI] [Google Scholar]
- Gao F., Bren N., Burghardt T.P., Hansen S., Henchman R.H., Taylor P., McCammon J.A., and Sine S.M.. 2005. Agonist-mediated conformational changes in acetylcholine-binding protein revealed by simulation and intrinsic tryptophan fluorescence. J. Biol. Chem. 280:8443–8451. 10.1074/jbc.M412389200 [DOI] [PubMed] [Google Scholar]
- Gupta S., and Auerbach A.. 2011. Temperature dependence of acetylcholine receptor channels activated by different agonists. Biophys. J. 100:895–903. 10.1016/j.bpj.2010.12.3727 [DOI] [PMC free article] [PubMed] [Google Scholar]
- Gupta S., Purohit P., and Auerbach A.. 2013. Function of interfacial prolines at the transmitter binding sites of the neuromuscular acetylcholine receptor. J. Biol. Chem. 288:12667–12679. 10.1074/jbc.M112.443911 [DOI] [PMC free article] [PubMed] [Google Scholar]
- Gupta S., Chakraborty S., Vij R., and Auerbach A.. 2017. A mechanism for acetylcholine receptor gating based on structure, coupling, phi, and flip. J. Gen. Physiol. 149:85–103. 10.1085/jgp.201611673 [DOI] [PMC free article] [PubMed] [Google Scholar]
- Hansen S.B., Sulzenbacher G., Huxford T., Marchot P., Taylor P., and Bourne Y.. 2005. Structures of Aplysia AChBP complexes with nicotinic agonists and antagonists reveal distinctive binding interfaces and conformations. EMBO J. 24:3635–3646. 10.1038/sj.emboj.7600828 [DOI] [PMC free article] [PubMed] [Google Scholar]
- Hoover W.G. 1985. Canonical dynamics: Equilibrium phase-space distributions. Phys. Rev. A Gen. Phys. 31:1695–1697. 10.1103/PhysRevA.31.1695 [DOI] [PubMed] [Google Scholar]
- Humphrey W., Dalke A., and Schulten K.. 1996. VMD: visual molecular dynamics. J. Mol. Graph. 14:33–38: 27–28. 10.1016/0263-7855(96)00018-5 [DOI] [PubMed] [Google Scholar]
- Jadey S., and Auerbach A.. 2012. An integrated catch-and-hold mechanism activates nicotinic acetylcholine receptors. J. Gen. Physiol. 140:17–28. 10.1085/jgp.201210801 [DOI] [PMC free article] [PubMed] [Google Scholar]
- Jadey S.V., Purohit P., Bruhova I., Gregg T.M., and Auerbach A.. 2011. Design and control of acetylcholine receptor conformational change. Proc. Natl. Acad. Sci. USA. 108:4328–4333. 10.1073/pnas.1016617108 [DOI] [PMC free article] [PubMed] [Google Scholar]
- Jadey S., Purohit P., and Auerbach A.. 2013. Action of nicotine and analogs on acetylcholine receptors having mutations of transmitter-binding site residue αG153. J. Gen. Physiol. 141:95–104. 10.1085/jgp.201210896 [DOI] [PMC free article] [PubMed] [Google Scholar]
- Karloff H. 2008. Linear Programming. Springer Science & Business Media, Berlin, Heidelberg. [Google Scholar]
- Laskowski R.A., MacArthur M.W., Moss D.S., and Thornton J.M.. 1993. PROCHECK: a program to check the stereochemical quality of protein structures. J. Appl. Cryst. 26:283–291. 10.1107/S0021889892009944 [DOI] [Google Scholar]
- Li L., Zhong W., Zacharias N., Gibbs C., Lester H.A., and Dougherty D.A.. 2001. The tethered agonist approach to mapping ion channel proteins--toward a structural model for the agonist binding site of the nicotinic acetylcholine receptor. Chem. Biol. 8:47–58. 10.1016/S1074-5521(00)00055-7 [DOI] [PubMed] [Google Scholar]
- Ma Q., Tae H.-S., Wu G., Jiang T., and Yu R.. 2017. Exploring the Relationship between Nicotinic Acetylcholine Receptor Ligand Size, Efficiency, Efficacy, and C-Loop Opening. J. Chem. Inf. Model. 57:1947–1956. 10.1021/acs.jcim.7b00152 [DOI] [PubMed] [Google Scholar]
- Martin N.E., Malik S., Calimet N., Changeux J.-P., and Cecchini M.. 2017. Un-gating and allosteric modulation of a pentameric ligand-gated ion channel captured by molecular dynamics. PLOS Comput. Biol. 13:e1005784 10.1371/journal.pcbi.1005784 [DOI] [PMC free article] [PubMed] [Google Scholar]
- Martí-Renom M.A., Stuart A.C., Fiser A., Sánchez R., Melo F., and Šali A.. 2000. Comparative protein structure modeling of genes and genomes. Annu. Rev. Biophys. Biomol. Struct. 29:291–325. 10.1146/annurev.biophys.29.1.291 [DOI] [PubMed] [Google Scholar]
- Morales-Perez C.L., Noviello C.M., and Hibbs R.E.. 2016. X-ray structure of the human α4β2 nicotinic receptor. Nature. 538:411–415. 10.1038/nature19785 [DOI] [PMC free article] [PubMed] [Google Scholar]
- Morris G.M., Huey R., Lindstrom W., Sanner M.F., Belew R.K., Goodsell D.S., and Olson A.J.. 2009. AutoDock4 and AutoDockTools4: Automated docking with selective receptor flexibility. J. Comput. Chem. 30:2785–2791. 10.1002/jcc.21256 [DOI] [PMC free article] [PubMed] [Google Scholar]
- Mukhtasimova N., and Sine S.M.. 2018. Full and partial agonists evoke distinct structural changes in opening the muscle acetylcholine receptor channel. J. Gen. Physiol. 150:713–729. 10.1085/jgp.201711881 [DOI] [PMC free article] [PubMed] [Google Scholar]
- Nayak T.K., and Auerbach A.. 2013. Asymmetric transmitter binding sites of fetal muscle acetylcholine receptors shape their synaptic response. Proc. Natl. Acad. Sci. USA. 110:13654–13659. 10.1073/pnas.1308247110 [DOI] [PMC free article] [PubMed] [Google Scholar]
- Nayak T.K., and Auerbach A. (2017). Cyclic activation of endplate acetylcholine receptors. Proc. Natl. Acad. Sci USA. 114:11914–11919. [DOI] [PMC free article] [PubMed] [Google Scholar]
- Nayak T.K., Purohit P.G., and Auerbach A.. 2012. The intrinsic energy of the gating isomerization of a neuromuscular acetylcholine receptor channel. J. Gen. Physiol. 139:349–358. 10.1085/jgp.201110752 [DOI] [PMC free article] [PubMed] [Google Scholar]
- Nayak T.K., Bruhova I., Chakraborty S., Gupta S., Zheng W., and Auerbach A.. 2014. Functional differences between neurotransmitter binding sites of muscle acetylcholine receptors. Proc. Natl. Acad. Sci. USA. 111:17660–17665. 10.1073/pnas.1414378111 [DOI] [PMC free article] [PubMed] [Google Scholar]
- Nayak T.K., Chakraborty S., Zheng W., and Auerbach A.. 2016. Structural correlates of affinity in fetal versus adult endplate nicotinic receptors. Nat. Commun. 7:11352 10.1038/ncomms11352 [DOI] [PMC free article] [PubMed] [Google Scholar]
- Nayak T.K., Vij R., Bruhova I., Shandilya J., and Auerbach A.. 2019. Efficiency measures the conversion of agonist binding energy into receptor conformational change. J. Gen. Physiol. 10.1085/jgp.201812215 [DOI] [PMC free article] [PubMed] [Google Scholar]
- Nosé S. 1991. Constant temperature molecular dynamics methods. Prog. Theor. Phys. Suppl. 103:1–46. 10.1143/PTPS.103.1 [DOI] [Google Scholar]
- Ohno K., Wang H.-L., Milone M., Bren N., Brengman J.M., Nakano S., Quiram P., Pruitt J.N., Sine S.M., and Engel A.G.. 1996. Congenital myasthenic syndrome caused by decreased agonist binding affinity due to a mutation in the acetylcholine receptor ε subunit. Neuron. 17:157–170. 10.1016/S0896-6273(00)80289-5 [DOI] [PubMed] [Google Scholar]
- Olsen J.A., Balle T., Gajhede M., Ahring P.K., and Kastrup J.S.. 2014. Molecular recognition of the neurotransmitter acetylcholine by an acetylcholine binding protein reveals determinants of binding to nicotinic acetylcholine receptors. PLoS One. 9:e91232 10.1371/journal.pone.0091232 [DOI] [PMC free article] [PubMed] [Google Scholar]
- Phillips J.C., Braun R., Wang W., Gumbart J., Tajkhorshid E., Villa E., Chipot C., Skeel R.D., Kalé L., and Schulten K.. 2005. Scalable molecular dynamics with NAMD. J. Comput. Chem. 26:1781–1802. 10.1002/jcc.20289 [DOI] [PMC free article] [PubMed] [Google Scholar]
- Purohit P., and Auerbach A.. 2013. Loop C and the mechanism of acetylcholine receptor-channel gating. J. Gen. Physiol. 141:467–478. 10.1085/jgp.201210946 [DOI] [PMC free article] [PubMed] [Google Scholar]
- Purohit P., Bruhova I., and Auerbach A.. 2012. Sources of energy for gating by neurotransmitters in acetylcholine receptor channels. Proc. Natl. Acad. Sci. USA. 109:9384–9389. 10.1073/pnas.1203633109 [DOI] [PMC free article] [PubMed] [Google Scholar]
- Purohit P., Gupta S., Jadey S., and Auerbach A.. 2013. Functional anatomy of an allosteric protein. Nat. Commun. 4:2984 10.1038/ncomms3984 [DOI] [PMC free article] [PubMed] [Google Scholar]
- Purohit P., Bruhova I., Gupta S., and Auerbach A.. 2014. Catch-and-hold activation of muscle acetylcholine receptors having transmitter binding site mutations. Biophys. J. 107:88–99. 10.1016/j.bpj.2014.04.057 [DOI] [PMC free article] [PubMed] [Google Scholar]
- Sauguet L., Shahsavar A., Poitevin F., Huon C., Menny A., Nemecz À., Haouz A., Changeux J.-P., Corringer P.-J., and Delarue M.. 2014. Crystal structures of a pentameric ligand-gated ion channel provide a mechanism for activation. Proc. Natl. Acad. Sci. USA. 111:966–971. 10.1073/pnas.1314997111 [DOI] [PMC free article] [PubMed] [Google Scholar]
- Sedgwick P. 2012. Pearson’s correlation coefficient. BMJ. 345(jul04 1):e4483 10.1136/bmj.e4483 [DOI] [Google Scholar]
- Sievers F., Wilm A., Dineen D., Gibson T.J., Karplus K., Li W., Lopez R., McWilliam H., Remmert M., Söding J., et al. 2011. Fast, scalable generation of high-quality protein multiple sequence alignments using Clustal Omega. Mol. Syst. Biol. 7:539 10.1038/msb.2011.75 [DOI] [PMC free article] [PubMed] [Google Scholar]
- Sine S.M., Ohno K., Bouzat C., Auerbach A., Milone M., Pruitt J.N., and Engel A.G.. 1995. Mutation of the acetylcholine receptor α subunit causes a slow-channel myasthenic syndrome by enhancing agonist binding affinity. Neuron. 15:229–239. 10.1016/0896-6273(95)90080-2 [DOI] [PubMed] [Google Scholar]
- Taly A., Corringer P.-J., Grutter T., Prado de Carvalho L., Karplus M., and Changeux J.-P.. 2006. Implications of the quaternary twist allosteric model for the physiology and pathology of nicotinic acetylcholine receptors. Proc. Natl. Acad. Sci. USA. 103:16965–16970. 10.1073/pnas.0607477103 [DOI] [PMC free article] [PubMed] [Google Scholar]
- Ulens C., Hogg R.C., Celie P.H., Bertrand D., Tsetlin V., Smit A.B., and Sixma T.K.. 2006. Structural determinants of selective α-conotoxin binding to a nicotinic acetylcholine receptor homolog AChBP. Proc. Natl. Acad. Sci. USA. 103:3615–3620. 10.1073/pnas.0507889103 [DOI] [PMC free article] [PubMed] [Google Scholar]
- Vanommeslaeghe K., Hatcher E., Acharya C., Kundu S., Zhong S., Shim J., Darian E., Guvench O., Lopes P., Vorobyov I., and Mackerell A.D. Jr. 2010. CHARMM general force field: A force field for drug-like molecules compatible with the CHARMM all-atom additive biological force fields. J. Comput. Chem. 31:671–690. [DOI] [PMC free article] [PubMed] [Google Scholar]
- Webb B., and Sali A.. 2014. Comparative protein structure modeling using MODELLER. Curr Protoc. Bioinformatics. 47: 5.6.1–5.6.32. [DOI] [PubMed]
- Xu M., Zhu X., Yu J., Yu J., Luo S., and Wang X.. 2017. The crystal structure of Ac-AChBP in complex with α-conotoxin LvIA reveals the mechanism of its selectivity towards different nAChR subtypes. Protein Cell. 8:675–685. 10.1007/s13238-017-0426-2 [DOI] [PMC free article] [PubMed] [Google Scholar]
- Zhong W., Gallivan J.P., Zhang Y., Li L., Lester H.A., and Dougherty D.A.. 1998. From ab initio quantum mechanics to molecular neurobiology: a cation-π binding site in the nicotinic receptor. Proc. Natl. Acad. Sci. USA. 95:12088–12093. 10.1073/pnas.95.21.12088 [DOI] [PMC free article] [PubMed] [Google Scholar]


