

Models of muscle contraction often assume that a myosin motor interacts with areas of one to three distinct binding sites along an actin filament. Månsson shows that computational models employing different numbers of sites return similar predictions, suggesting one-site models are often sufficient.
Abstract
Mechanokinetic statistical models describe the mechanisms of muscle contraction on the basis of the average behavior of a large ensemble of actin–myosin motors. Such models often assume that myosin II motor domains bind to regularly spaced, discrete target zones along the actin-based thin filaments and develop force in a series of strain-dependent transitions under the turnover of ATP. The simplest models assume that there is just one myosin-binding site per target zone and a uniform spatial distribution of the myosin motor domains in relation to each site. However, most of the recently developed models assume three myosin-binding sites per target zone, and some models include a spatially explicit 3-D treatment of the myofilament lattice and thereby of the geometry of the actin–myosin contact points. Here, I show that the predictions for steady-state contractile behavior of muscle are very similar whether one or three myosin-binding sites per target zone is assumed, provided that the model responses are appropriately scaled to the number of sites. Comparison of the model predictions for isometrically contracting mammalian muscle cells suggests that each target zone contains three or more myosin-binding sites. Finally, I discuss the strengths and weaknesses of one-site spatially inexplicit models in relation to three-site models, including those that take into account the detailed 3-D geometry of the myofilament lattice. The results of this study suggest that single-site models, with reduced computational cost compared with multisite models, are useful for several purposes, e.g., facilitated molecular mechanistic insights.
Introduction
In muscle contraction, myosin II motor domains in the thick filaments of the sarcomere interact cyclically with actin-binding sites in the overlapping thin filaments to produce force and shortening of the sarcomere and the muscle. These actomyosin cross-bridge cycles are powered by the turnover of ATP into its products, ADP and Pi, on the active site of myosin. On basis of solution biochemistry, using isolated actin filaments and myosin motor fragments, the process can be described in terms of kinetic substeps and intermediate states. It is clear from such studies that the states with, in succession, ATP, ADP + Pi, ADP alone, and finally no nucleotide at the active site, are characterized by progressively increasing actin affinity. Lymn and Taylor (1971) associated the biochemical kinetic scheme with structural data (Huxley, 1969) to produce a cross-bridge model of muscle contraction. Later (Hill, 1974; Eisenberg and Hill, 1978; Eisenberg and Greene, 1980; Eisenberg et al., 1980), a theoretical formalism was developed for statistical mechanokinetic models. In these developments, biochemical and structural cross-bridge characteristics were integrated with elastic properties (Huxley, 1957; Huxley and Simmons, 1971) to account for both transient and steady-state aspects of muscle mechanics and energetics on basis of the action of a large ensemble of actin–myosin interactions.
Following recipes from the above studies, a vast number of other mechanokinetic statistical models have been developed with a progressively increasing level of complexity. Several of these models have assumed continuous (Duke, 1999; Vilfan and Duke, 2003) or discrete (Schoenberg, 1985; Lombardi et al., 1995; Caremani et al., 2013) myosin-binding sites along the actin filament, in the discrete case often with intervals between binding sites given by the actin monomer repeat of ∼5.5 nm. Whereas all these models seem to account well for several aspects of muscle contraction, they are at variance with evidence (Molloy et al., 1995; Steffen et al., 2001), suggesting that a given myosin molecule can only bind to appropriately oriented target zones defined by the 36-nm half-repeat of the actin filament double helix.
Some recent models (e.g., Månsson, 2016; Rahman et al., 2018) that incorporate the target zone concept assume just one myosin-binding site per zone, in similarity to the earliest models (Huxley, 1957; Eisenberg and Hill, 1978; Eisenberg et al., 1980). Such models are here denoted one-site models. Most recent models that include the target zone concept, however, assume several binding sites (usually three per target zone; Smith and Geeves, 1995a,b; Smith et al., 2008; Smith and Mijailovich, 2008; Offer and Ranatunga, 2013; Mijailovich et al., 2016; Ujfalusi et al., 2018). Some “multisite” models of this type also include detailed consideration of the 3-D geometrical arrangement of the thin and thick filaments in the sarcomere (e.g., Mijailovich et al., 2016). In addition to incorporating kinetic properties of the thin-filament–based regulatory proteins (troponin and tropomyosin), models on this level of complexity also have the potential to consider effects of other accessory proteins such as myosin-binding protein C and titin. The complexity is both a strength and weakness. It makes it challenging to assign appropriate values to all relevant parameters based on independent experimental data obtained under coherent conditions. The potential of reaching detailed mechanistic insights may also be compromised by the complexity (e.g., it may be difficult to interpret the model results in terms of specific molecular mechanisms). However, provided that parameter values can be properly assigned, these models would give better approximation of the real muscle behavior and a wider range of phenomena may be evaluated, such as those attributed to changes in the myofilament lattice geometry (Daniel et al., 1998; Tanner et al., 2007; Williams et al., 2013) and in accessory protein properties. However, recently, it was found that a wide spectrum of contractile properties, from single molecules to muscle, could be accounted for by simple single-site models including only actin and myosin (Månsson, 2016; Rahman et al., 2018). Importantly, all states and transitions in these models were clearly defined based on solution biochemistry and the parameter values referred to as coherent conditions as possible with regard to ionic strength, temperature, myosin isoform, and animal species. Whereas the single-site models (Månsson, 2016; Rahman et al., 2018) are successful overall, they cannot account for the high maximum isometric force per cross-sectional area in a muscle (Månsson, 2010) or the relationship between the myosin surface density and the sliding velocity in the in vitro motility assay (Månsson, 2016; Rahman et al., 2018). The experimental data in these cases seem to suggest the need for approximately three actin sites per 36 nm. The latter idea is also consistent with single-molecule mechanics data (Steffen et al., 2001) and seems reasonable from a structural point of view. In recent studies (Månsson, 2016; Rahman et al., 2018), we accommodated the effect simply by assuming three independent cross-bridges per 36-nm half-repeat, each behaving as suggested by the model with just one site. Arguments to support this approach have been provided previously (Månsson, 2010, 2016; Rahman et al., 2018). However, whereas models with three neighboring sites are frequently employed (see above), no detailed comparison has (to the best of my knowledge) been made between single-site and multisite models. Such comparison is important, because it would clarify possible complications introduced by making the single-site assumption. Furthermore, if the complications are minor, this would argue for the use of single-site models because of reduced computational cost and facilitated mechanistic insights. Finally, any potential differences between single-site and three-site models may give mechanistic insights themselves.
Here, model simulations are performed with a focus on steady-state data assuming either one or three neighboring myosin-binding sites per 36-nm actin half-repeat. The studies are performed with a primary goal to test the hypothesis that a three-site model and a one-site model give similar results if the responses are appropriately scaled to the number of sites. The results largely corroborate this hypothesis, suggesting that simple one-site models are useful for a range of purposes, such as to evaluate the effects of drugs (Albet-Torres et al., 2009; Rahman et al., 2018) or myosin mutations of importance in hereditary cardiomyopathies (Spudich et al., 2016). Furthermore, comparison of the present simulation results to the maximum isometric force in experimental studies in the literature suggests three or even more than three myosin-binding sites per actin target zone. The results are also consistent with the view (Månsson, 2016; Månsson et al., 2018) that properties of single myosin molecules interacting with actin filaments account very well for steady-state contractile properties of muscle at a given sarcomere length without the need to consider effects of the 3-D hierarchical order and/or roles of accessory proteins. The present simulation results are also compatible with the idea (Adamovic et al., 2008; Smith, 2014; Månsson et al., 2019) that the cross-bridge elasticity in muscle exhibits similar nonlinearity as previously found in single myosin molecules in vitro (Kaya and Higuchi, 2010).
Materials and methods
Model
The model is based on that in Månsson (2016), which was previously defined for the case of a single myosin-binding site in each target zone with target zones spaced at 36-nm intervals along the actin filament. Here, models with either one or three neighboring sites per target zone are compared. The model geometries are illustrated in Fig. 1 A, the relevant kinetic scheme for the actomyosin interaction is shown in Fig. 1 B, and the free energy diagrams are shown in Fig. 1 C. All model states and transitions are supported by independent evidence as described in detail previously (Månsson, 2016; for further details, see Månsson et al., 2019). Considering developed nonuniformities in sarcomere behavior during contraction as well as static irregularities in the myofilament lattice (Edman and Reggiani, 1984, 1987; Vilfan and Duke, 2003; Luther and Squire, 2014; see Discussion), we take the approach (compare Huxley, 1957; Hill, 1974) to assume a uniform distance (x) distribution of myosin heads relative to the center of the nearest actin target zone. In the absence of generally accepted evidence to the contrary, we also assume that the two heads of each myosin molecule are independent in their interaction with the actin filaments.
Figure 1.

Model. (A) Schematic illustration of the geometry showing an actin filament with subunits (monomers) along two right-handed protofilament helices and two-headed myosin motor domains extending from the thick filament backbone. Target zones for myosin head binding indicated by darker monomers. A one-site model with one myosin-binding site per target zone on top and a three-site model with three binding sites per target zone on the bottom is shown. The figure is approximately to scale longitudinally, but the interfilament distance is greatly exaggerated compared with the longitudinal scale. (B) Kinetic scheme for the actin–myosin interaction at the central site of a target zone shown in black (compare Eqs. 4, 5, 6, 7, 8, 9, 10, 11, and 12). Connections of the kinetic schemes to nearest neighbor sites at 5.5 nm on either side of the central site indicated by gray or green arrows and with states and rate functions indexed by superscript p for the site closer to the actin filament plus end (dark gray) and superscript m for the site closer to the minus end (green). A, actin; D, ADP; M, myosin; P/Pi, inorganic phosphate; T, ATP. The symbols ki, k+i, and k-i represent rate constants, whereas KI represents the equilibrium constant for fast equilibria. If an argument (x) is included, this indicates strain dependence. The states MT, MDP, and AMDP are common for all sites in a target zone. The AMDPT state is a transient intermediate and therefore not included in the free energy diagrams in C or in calculations of force or other contractile variables. (C) Free energy diagrams for model with three sites giving three identical sets of diagrams but displaced relative each other along the x axis. Dashed, dotted, and dashed-dotted colored lines represent free energies for the case with nonlinear cross-bridge elasticity (compare Fig. S1 and Eq. 10). Note that the site at the most positive x-value is toward the actin filament minus end. (D) Transition rate functions from state AMDP to AMDL (k+P; Eq. 4) and the reverse rate (k-P; Eq. 5) for the central site shown for linear (full lines) and nonlinear (dashed lines) cross-bridge elasticity. Transition rate functions for peripheral sites have identical shape but are shifted 5.5 nm along the x axis in the positive direction (m-site) or the negative direction (p-site). The stepwise change in rate functions at x = −2.8 nm reflect limitation of the attachment range assumed in the model (compare Månsson et al., 2019). (E) Other rate functions than those shown in D for transitions between states for the central site (Eqs. 7, 8, 9, 10, and 11). Rate functions for linear and nonlinear cross-bridge elasticity shown by full and dashed lines, respectively.
Unless otherwise stated, the free energy of each attached cross-bridge state with ATP (T), ADP (D), and/or Pi at the active site (compare Fig. 1 B) is assumed to have a similar minimum value and be characterized by the same stiffness for all sites in the target zone (Fig. 1 C). The parameter values (Tables S1 and S2) are similar to those used in a recent update (Månsson et al., 2019) of the original model (Månsson, 2016). In total, the model with three sites encompasses 12 states. Out of these states, three are detached from actin or weakly attached (MT, MDP, AMDP; see Fig. 1 for definitions) and shared between all sites in the target zone. The attached sites are of three biochemical/structural types (AMDL, AMDH, and AM/AMD; Fig. 1), but each of these biochemical states exists for each site giving nine attached states for the three-site model. The subscripts “L” and “H” in AMDL and AMDH refer to “low” and “high” force, respectively. Based on recent evidence for negligible frictional forces due to weak binding interactions in the AMDP state (Rahman et al., 2018), we here assume that the stiffness of cross-bridges in this state is zero.
Below, elastic properties and rate functions are given for the central site in the target zone. The rate functions for the neighboring sites are obtained by exchanging xi (x1, x2, x3; in nanometers) for xi + 5.5 and xi − 5.5, respectively. Parameter values are given in Tables S1 and S2. The cross-bridge stiffness in the different states, AMDL (ksi(x)), AMDH (ksii(x)), and AM (ksiii(x); lumped together with AMD; AM/AMD) is constant (2.8 pN/nm) if the cross-bridge elasticity is assumed to be linear but varies with x if the cross-bridge elasticity is assumed nonlinear as described in Eqs. 1 (a and b), 2 (a and b), and 3 (a–e):
| (1a) |
| (1b) |
| (2a) |
| (2b) |
| (3a) |
| (3b) |
| (3c) |
| (3d) |
| (3e) |
Parameter c in Eqs. 3b and 3c) was either set to 1 to simulate linear cross-bridge elasticity or to 0.0255 to simulate nonlinear cross-bridge elasticity of the AM/AMD state equal to that in Månsson et al. (2019).
The stiffness of the other attached states (AMDL and AMDH) for x < xi is approximated by the slope of the gray straight line in Fig. S1 A. The latter approximation simplified the calculations and is justified by the low population of these states for x < xi.
The equilibrium constant, Kw, for the weak binding as function of the distance, x, to the center of the target zone (Fig. 1 C) is given by Kw = exp(ΔGw) and Kw = 0 inside and outside the range −2.8 nm < x < 18.2 nm, respectively. Here, the quantity ΔGw denotes the free energy difference between the MDP state and the AMDP state. Throughout, the free energy differences (ΔGw, ΔGAMDP-AMDL, ΔGAMDL-AMDH, and ΔGAMDH-AM) are given in units of kBT (≈ 4 pN nm), where kB is the Boltzmann constant and T is the absolute temperature.
The transition from the AMDP state to a phosphate-free prepower-stroke (AMDL) state (Fig. 1) is governed by
| (4) |
for −2.8 nm < x < 18.2 nm and 0 otherwise.
The reversal of this transition is governed by the rate function:
| (5) |
where [Pi] is the concentration of inorganic phosphate, KC is the phosphate dissociation constant, and
| (6) |
The power-stroke is assumed to be a rapid equilibrium governed by
| (7) |
where
| (8) |
and
| (9) |
The cross-bridge detachment from the AMDH state (Capitanio et al., 2006; Albet-Torres et al., 2009) involves a strain-dependent transition that is associated with an ∼1-nm extra swing of the lever arm (in addition to the main power-stroke) and a structural change that opens up the nucleotide pocket to allow free diffusion of nucleotide in and out of that pocket (Nyitrai and Geeves, 2004; Capitanio et al., 2006; Albet-Torres et al., 2009). The rate function of that transition is governed by
| (10a) |
where
| (10b) |
Here, is the piecewise linear force function given by full black lines in Fig. S1 A. By assuming that [MgADP]= 0 mM and by lumping the states AMD, AM, and AMT together into what we denote an AM/AMD state (compare Månsson, 2010), the detachment rate (koff(x)) for the transition from the AMD to the MT state at [MgADP] = 0 mM is given by (Persson et al., 2013):
| (11) |
where
| (12) |
Here, the constants k2(0) and k6 govern ATP-induced detachment from the AMT state at x = 0 and ADP dissociation from the AMD state, respectively. The quantity K1 is the equilibrium constant for MgATP binding to the AM/AMD state (Fig. 1 B), and xcrit is a parameter (Bell, 1978) that defines the strain sensitivity.
For stability in the numerical computations, the value of any rate function (Eqs. 4, 5, 6, 7, 8, 9, 10, 11, and 12) was limited to between a minimum (rmin) of 1 × 10⁻⁶ s−1 and a maximum (rmax) of 100,000 s−1 for isometric contraction or 1,000,000 s−1 for the fastest velocities of shortening. If any of the limits were exceeded, the parameter value was set to either rmax or rmin.
Steady-state contraction with constant velocity, v, was simulated under different conditions based on solution of differential equations for the state probabilities (for all l,k):
| (13) |
where ak(x) and al(x) are the state probabilities for the states (Fig. 1) MT (l,k = 4), MDP (l,k = 5), AMDP (l,k = 6), AMDL (l,k = 1,7,8), AMDH (l,k = 2,9,10), and AM/AMD (l,k = 3,11,12). Here, the MT, MDP, and AMDP states are shared between all three sites in a target zone. However, there are three versions of each of the strongly attached states because of the three sites per target zone. The rate functions kkl(x) and klk(x) govern transitions into state l from n1 neighboring states and out of state l into n2 neighboring states, respectively, at each given value of x. The model simulations were implemented by numeric solution of the master equations (Eq. 13) followed by calculation of observable parameters (e.g., force and ATP turnover rate) from appropriate state probabilities (Månsson, 2010) by averaging over the distance between target zones (36 nm) along the actin filament. Thus, average force, <F> (in piconewtons), per myosin head (whether attached to actin or not) is calculated as
| (14) |
Here, ksk(x) is the cross-bridge stiffness (Eqs. 1a, 1b, 2a, 2b, 3a, and 3b), whereas the quantities xk are given in Table S1 for the strongly attached states at the central site in the target zone (k = 1,2,3; see above). The values for the corresponding sites in the periphery are obtained by subtraction or addition of 5.5 nm from/to the xk values for the states in the central site. In Eqs. 14 and 15, summation is over all states for simplicity of denotation, but the contribution from the MT, MDP, and AMDP states is zero due to zero stiffness in these states. The stiffness (Eq. 15) and the fraction of attached myosin heads (<Na>; Eq. 16) are obtained as follows:
| (15) |
and
| (16) |
The quantity x is in nanometers, and the denominators provide the appropriate averaging over all myosin cross-bridges (whether attached or detached).
The ATP turnover rate (<ATPase>) per myosin head is obtained as follows:
| (17) |
Numerical integration of Eqs. 13, 14, 15, 16, and 17 starts at x = 19.5 nm and progresses in the negative x direction. At x = 19.5 nm, the initial values for all attached states are set to zero, whereas the equilibrium distribution is assumed for the MT and MDP states.
The basis for the wide integration range in Eqs. 14, 15, 16, and 17 ([−50, 19.5] nm) compared to the narrower (36 nm) physical separation of neighboring target zones has been considered previously (Månsson et al., 2019). The population of the AMDL and the AMDH states is very low for x < −16.5 nm, independent of velocity, nonlinearity of cross-bridge elasticity, or other conditions tested. Also, the population of the AM/AMD state is very low for x < −16.5 nm in the case of linear cross-bridge elasticity. In all the conditions mentioned, there would be negligible changes to the quantities obtained in Eqs. 14, 15, 16, and 17 if the integration had been limited to the appropriate 36-nm range (19.5 nm to −16.5 nm) However, because some cross-bridges stay attached in the AM/AMD state for a sliding distance appreciably greater than 36 nm with nonlinear cross-bridge elasticity, integration down to x = −50 nm is used. The approximation with independent target zones is not formally correct under these conditions. However, importantly, it does not produce significantly different results than a formally more correct (but appreciably slower) method in which the target zones are considered as interacting by the use of periodic boundary conditions (Månsson et al., 2019).
The system of differential equations was solved numerically using Simnon software (Department of Automatic Control, Lund Institute of Technology, Lund, Sweden) using a Runge–Kutta–Fehlberg (4/5) integration algorithm. The source code is given in the supplemental Materials and methods, with explanations and comments. See also previous use of the program (e.g., Albet-Torres et al., 2009).
Experimental data from the literature
Experimental data from the literature were derived from copied figures in cited papers and measurements were made using ImageJ (Schneider et al., 2012).
Online supplemental information
The supplemental Materials and methods contains the Simnon source code. Figure S1 shows parameter values determining shape of free energy diagrams for simulation of contractile properties of fast mammalian muscle at 30°C. Table S1 lists parameter values determining the shape of free energy diagrams for simulation of contractile properties of fast mammalian muscle at 30°C. Table S2 lists parameter values defining rate functions and kinetic constants for simulation of contractile properties of fast mammalian muscle at 30°C.
Results
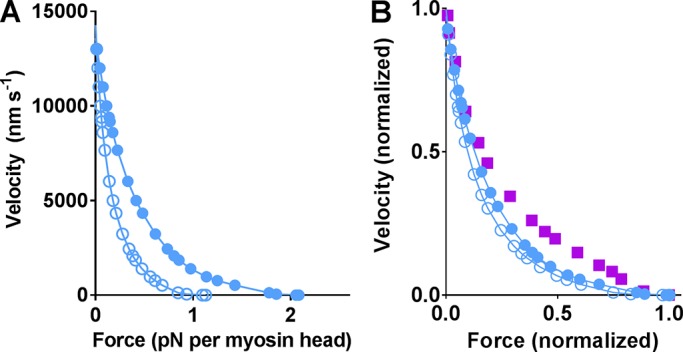
For comparison of one-site and three-site models, steady-state contractile phenomena were simulated under the assumption of complete and constant activation. The latter constraints eliminate complications due to time-varying activation (e.g., various cooperative effects) and possible nonlinearity of the myofilament compliance (Ma et al., 2018). First, the one-site and three-site models were compared with respect to their predictions for the relationship between the steady load on the muscle and the shortening velocity (i.e., the force–velocity relationship). Initially, the cross-bridge elasticity was assumed to be linear. The results (Fig. 2 A) show similar maximum velocity of shortening and very similar shape of the force–velocity relationship (Fig. 2 B) whether one or three sites are assumed per target zone. Further, as expected, the maximum isometric force was almost three times as high (2.8×) with three sites. The numerical value was ∼2.1 pN, averaged over all cross-bridges (whether attached or not), corresponding to a maximum isometric force per cross-sectional area in a muscle fiber of 390 kPa. The latter value follows from the assumption of 294 independent myosin heads per half thick filament and a corresponding cross-sectional area of 1.6 × 10⁻¹⁵ m2 (Millman, 1998). The predicted force almost reaches the maximum isometric force of ∼500 kPa per myofibrillar cross-sectional area in intact single mouse skeletal muscle fibers (Westerblad et al., 1997) calculated from the data assuming that myofibrils occupy ∼80% of the fiber cross section (Mobley and Eisenberg, 1975).
Figure 2.

Comparison of model predictions for steady-state contractile properties assuming either one or three myosin-binding sites per actin target zone. (A) Simulations of force–velocity relationships using parameter values in Tables S1 and S2 for linear cross-bridge elasticity. Data plotted as half-sarcomere shortening velocity versus absolute force averaged over all myosin heads for either the one-site model (black) or the three-site model (blue). (B) Same data as in A but normalized to maximum velocity and maximum isometric force. Simulation results compared with experimental data (purple) from living muscle (Månsson et al., 1989) at 30°C (purple squares) and a small ensemble of myosin molecules in vitro (Pertici et al., 2018) at 23°C (purple dashed line). (C) Simulated force–velocity data using parameter values in Tables S1 and S2 but for nonlinear cross-bridge elasticity. Data plotted as in A for either the one-site model (red, filled symbols) or the three-site model (open red symbols). (D) Plots of the data in C after normalization to the maximum values. Simulation results compared with experimental data (purple) as in B. (E) Simulated [MgATP]–velocity data assuming one site per target zone and linear (black) or nonlinear (red) cross-bridge elasticity. (F) Simulated [MgATP]–velocity relationships assuming three sites per target zone and linear (blue) or nonlinear (red) cross-bridge elasticity. The purple data points in both E and F are experimental data from Persson et al. (2013). Note, in E and F, the quantitatively similar difference between linear and nonlinear cross-bridge elasticity in the prediction of the experimental data for one-site and three-site models. Nonlinearity in cross-bridge elasticity is based on that in Kaya and Higuchi (2010); see also Månsson et al. (2019).
The contractile properties of muscle may be subdivided into “intensive” properties, which do not change with increased number of available binding sites, and “extensive” properties, which change in approximate proportion to the number of sites. The intensive properties include sliding velocity, the shape of the force–velocity relationship, and average strain as well as average force per attached cross-bridge. The extensive properties include, in addition to the isometric force, the ATP turnover rate, the fraction of attached cross-bridges, and the force averaged over all cross-bridges. As can be seen in Fig. 2 (A–D) and Table 1, intensive properties are very similar for the one-site and three-site models, whereas variables reporting extensive properties have almost three times higher values for the three-site model.
Table 1. Comparison between key contractile variables for a model with one and three myosin-binding sites per target zone on the actin filament at a cross-bridge stiffness of 2.8 pN/nm and 30°C for fast mammalian skeletal muscle.
| Variable | Experimental (muscle cells) | Three-site model | One-site model | Ratio (three site/one site) |
|---|---|---|---|---|
| Sliding velocity (nm/s) | 13,000–18,000 nm/s (Ranatunga, 1984; Månsson et al., 1989; Asmussen et al., 1994; Thedinga et al., 1999) | 13,800 | 14,300 | 0.965 |
| Maximum isometric force | 400 kPa (Westerblad et al., 1997) translates into 500 kPa for myofibrils | 390 kPa 2.08 pN/head | 109 kPa 0.74 pN/head | 2.81 |
| Isometric ATPase | 8–35 s−1 (Reggiani et al., 1997; He et al., 1999; Sun et al., 2001) | 11.7 s−1 | 5.0 s−1 | 2.34 |
| Fraction of attached cross-bridges (isometric) | 0.33 ± 0.05 (Linari et al., 2007) 0.4 (Koubassova et al., 2008) | 0.31 | 0.108 | 2.87 |
| Average cross-bridge strain | >5 nm (Linari et al., 2007) | 2.4 nm | 2.46 nm | 0.976 |
It was shown recently (Månsson et al., 2019) using one-site models that nonlinear cross-bridge elasticity, similar to that found in single-molecule studies (Kaya and Higuchi, 2010), would not appreciably change the force–velocity relationship of muscle cells compared with the situation with linear cross-bridge elasticity. It was possible to predict a maximum velocity in the experimental range only if the ATP-induced detachment rate is strain dependent (xcrit = 0.6 nm) in the case of linear cross-bridge elasticity but strain independent (xcrit = 0 nm) with nonlinear elasticity (Månsson et al., 2019; cf. Fig. 1 E). The latter result seems consistent with ultrafast force-clamp studies using single-molecule optical tweezers experiments (Capitanio et al., 2012).
The force–velocity relationship (including maximum force and velocity) is rather similar (Fig. 2, A–D) for models with linear and nonlinear cross-bridge elasticity (also assuming different xcrit value). However, for both the one-site and three-site models (Fig. 2, C and D), the curvature of the force–velocity relationship (and thereby maximum power output) is more faithfully predicted on the assumption of nonlinear cross-bridge elasticity than linear cross-bridge elasticity.
Recent work (Månsson et al., 2019) suggests that nonlinearity of the cross-bridge elasticity similar to that in single molecules (Kaya and Higuchi, 2010) would be associated with higher [MgATP] at half maximum velocity (KMv) than if the cross-bridge elasticity is linear. It is shown in Fig. 2 (E and F) that the predictions for a model with one and three sites are virtually indistinguishable in this regard.
In one set of simulations, we investigated the effects on the force–velocity relationship of lower myosin affinity at the two peripheral actin sites in a target zone. Such an investigation was motivated by a single-molecule optical tweezers study (Steffen et al., 2001) that probed the interaction between one-headed myosin motor fragments (subfragment 1; S1) and actin target zones. That study suggested lower affinity at the peripheral sites. The most noticeable effect of introducing such lower affinity for the peripheral sites in the model (Fig. 3) is that the maximum isometric force is reduced appreciably below the experimentally observed value of >2 pN/myosin head (∼500 kPa; see above). This simulation result argues for three or more binding sites per target zone. Furthermore, the data seem to suggest similar myosin affinity at all sites (in contrast to Steffen et al., 2001) and/or higher force per site in muscle than predicted by the model.
Figure 3.
Effect on the force–velocity relationship of lower affinity for the myosin head at the two peripheral sites in the target zone. (A) Simulations of force–velocity relationships using parameter values in Tables S1 and S2 (linear cross-bridge elasticity) assuming three sites per target zone. Data are plotted as half-sarcomere shortening velocity versus absolute force averaged over all myosin heads for either equal myosin affinity per site (filled blue symbols; same as in Fig. 2 A) or with lower affinity by 2.7 kBT (blue open symbols) for peripheral sites (shifting free energy at these sites; Fig. 1 C) by 2.7 kBT upwards. (B) The data in A are replotted after normalization. Simulation results compared with experimental data (purple) from Månsson et al. (1989).
The similarity of the predictions (Fig. 2) for the one-site and three-site models in the situation with similar myosin affinity of all sites in a given target zone can be easily understood by observing that the cross-bridge distributions for the two cases show great similarities (Fig. 4). Particularly, if the cross-bridge distribution (both for isometric contraction and shortening at 4,000 nm/s) for each site is plotted relative to the position of the free energy minimum of the AM state at that site, it is clear that the distributions at each site are nearly identical or at least have similar shape (if normalized to maximum value; Fig. 4, B and D–F) as those for the single-site model.
Figure 4.

Population of different cross-bridge states in simulations using one-site and three-site models under different conditions. (A) Cross-bridge distributions in isometric contraction assuming three sites per target zone (each with identical myosin affinity) and linear cross-bridge elasticity. (B) Cross-bridge distributions in A shifted so that the distributions for the three sites overlap (dark lines: dashed [left site], full [middle], and dotted [right]). These distributions are also superimposed on cross-bridge distributions for one-site model (bright thick lines). (C) Cross-bridge distributions during steady-state shortening at 4,000 nm/s for otherwise similar conditions as in A. (D) Same type of plot as in B but for velocity of 4,000 nm/s (as in C). (E) Cross-bridge distributions in isometric contraction assuming one or three sites per target zone (with similar actin affinity) and nonlinear cross-bridge elasticity as in Fig. S1. Distributions are plotted as in B. (F) Cross-bridge distributions for shortening at 4,000 nm/s assuming one or three sites per target zone and nonlinear cross-bridge elasticity as in Fig. S1. (G) Cross-bridge distributions for isometric contraction assuming three sites per target zone and linear cross-bridge elasticity but 2.7 kBT higher free energy (lower affinity) of two peripheral sites compared with the central site. In all other panels, the minimum free-energy levels are assumed identical for all sites. Color coding as in A in all panels. Note the appreciable similarity between distributions for one and three sites when plotted as in B and D–F.
The effects of reduced myosin affinity at the peripheral sites of the target zone may be understood from the cross-bridge distributions in Fig. 4 G. Fewer cross-bridges are attached at these peripheral sites with an average reduction compared with the central site that is similar for all states and all strain levels. This leads to small changes in intensive properties compared with a model where the affinity is similar at all sites. These properties include the curvature of the force–velocity relationship (compare Fig. 3 B) and the average cross-bridge strain during isometric contraction. The latter value is 2.45 nm, 2.40 nm, and 2.15 nm for a one-site cross-bridge model, a three-site model with equal affinity at each site, and a three-site model with lower affinity at peripheral sites, respectively.
In the cases with nonlinear cross-bridge elasticity, there are tails further toward negative strain in the distributions for both the AM and AMDH states (Fig. 4, E and F). However, importantly, the positive strain data are very little changed compared with the linear case (Fig. 4, B and D). This explains the very similar shape of the force–velocity relationship for linear and nonlinear elasticity. Thus, in both cases, the force in cross-bridges at negative strain is equal in magnitude but opposite in direction to the force due to the cross-bridges with positive strain.
It seems reasonable to hypothesize that the similarity in behavior of the one-site and three-site models with a scaling factor for extensive properties of ∼3 requires that the cross-bridges have rather high stiffness. A high stiffness would limit the possible x-ranges for actin attachment of a given myosin head and thereby also limit interactions between cross-bridges at neighboring sites in a target zone. To test this idea, contractile properties were simulated for different values of the cross-bridge stiffness. The shape of the force–velocity relationship is somewhat changed as a result of this intervention (Fig. 5 A), attributed to altered strain-dependent transition rates between states. This effect can be counteracted by linked changes in the x-positions of the free-energy minima of the attached states. Importantly, however, the change in shape is similar for the one-site and three-site models. To minimize the complexities in the analysis, the detailed investigations were focused on how reduced cross-bridge stiffness affects predictions for contractile variables during isometric contraction (Fig. 6). Major effects of lowering cross-bridge stiffness from 2.8 pN/nm to 1.5 pN/nm are reduced isometric force and reduced fraction of attached cross-bridges. Both effects are attributed primarily to increased average strain-dependent detachment rate when cross-bridge stiffness is increased. This also leads to increased ATP turnover rate during isometric contraction, because this rate is limited by the cross-bridge detachment rate. A ratio in the range 2–3 between the three-site and one-site models is maintained for the isometric force, the fraction of attached cross-bridges, and ATP turnover rate for all levels of cross-bridge stiffness.
Figure 5.

Force–velocity relationship after lowering cross-bridge stiffness in the model from a standard value of 2.8 pN/nm (Fig. 2, A and B) to 1.5 pN/nm. (A) The three-site model (blue) compared with the one-site model (black) with cross-bridge stiffness 1.5 pN/nm. (B) Same data as in A replotted after normalization to maximum values. Color coding as in A, but experimental data (purple; from Månsson et al., 1989) are also included for reference.
Figure 6.

Simulated isometric contractile properties compared for one-site and three-site model under the assumptions of different cross-bridge stiffness in the range 1.5 to 3.3 pN/nm. (A) Extensive cross-bridge properties (Force, ATP turnover rate and fraction of attached myosin heads) for one site model (filled black symbols) and three site model (red filled symbols). Data normalized to those at a stiffness of 2.8 pN/nm for the one-site model. See Table 1 for absolute values at the latter stiffness level. The ratio between the results for three-site and one-site model indicated by open symbols. (B) Intensive cross-bridge properties (average force per cross-bridge and average strain) normalized as in A. Color coding analogous to that in A.
In partial corroboration of the hypothesis, stated in the previous paragraph, the ratio between the values for force as well as fraction of attached cross-bridges between the three-site and one-site models tended to decrease from 3 toward 2 (P = 0.056 and P = 0.071; F-test) with a decrease in cross-bridge stiffness in the range 3.3 pN/nm to 1.5 pN/nm. This range covers the stiffness values estimated in recent experiments using muscle fibers and single molecules (Linari et al., 2007; Piazzesi et al., 2007; Lewalle et al., 2008; Kaya and Higuchi, 2010, 2013). The ratios for force and the number of attached cross-bridges were 2.83 and 2.91, respectively, for a cross-bridge stiffness of 3.3 pN/nm compared with 2.43 and 2.39, respectively, for a cross-bridge stiffness of 1.5 pN/nm. No change in the ATPase rate was observed with altered cross-bridge stiffness, presumably because the change in cross-bridge stiffness affects the ATP turnover rate both by changes in effective attachment range and by changes in the cross-bridge detachment rate (West et al., 2009). The intensive properties such as average cross-bridge strain and average force per attached cross-bridge show a ratio between the three-site and one-site models that is not significantly different from 1 over the range of cross-bridge stiffness investigated. Overall, the findings are compatible with the idea that for sufficiently high cross-bridge stiffness (say above 1.5 pN/nm), a one-site model gives predictions closely similar to those of a three-site model if the extensive model predictions are multiplied by ∼3.
The above analysis provides strong support for the idea that one-site models are virtually interchangeable with three-site models as long as the extensive properties are appropriately scaled. However, for the two types of models to really be interchangeable, the effect of a range of changes in parameter values should also give similar effects whether one or three sites are assumed. This was tested by studying the effect of 50% reduction in each of several key parameter values related to the cross-bridge attachment rate, cross-bridge detachment rate, and the free energy difference between different attached states. It is shown in Fig. 7 (assuming linear cross-bridge elasticity) that each of these interventions gives similar effects on maximum velocity, maximum isometric force, and the shape of the force–velocity relationship for one-site and three-site models.
Figure 7.

Simulated effects of model parameter changes on force–velocity relationships for one-site and three-site models assumed to have linear cross-bridge elasticity. (A) One-site model where key parameter values, as indicated, are reduced by 50% compared with the control values (filled black symbols; same data as in Fig. 2 A). (B) Three-site model where key parameter values, as indicated by color coding in A, are reduced by 50% compared with the control values (filled black symbols; same data as in Fig. 2 A). (C) The data for one-site model in A replotted after normalization to isometric force and maximum unloaded shortening velocity. Experimental data (purple; from Månsson et al., 1989) are included for reference. (D) Data for the three-site model in B are replotted after normalization to isometric force and maximum unloaded shortening velocity. Experimental data (purple; from Månsson et al., 1989) are included for reference.
Discussion
Summary of results and relation to other mean-field models without geometrical details
A central result of the present study is that a mechanokinetic model, assuming target zones for myosin binding at 36-nm intervals along the actin filament, gives very similar predictions whether one or several sites per target zone is assumed. This applies provided that extensive properties such as force, stiffness, and ATP turnover rate are appropriately scaled. The same conclusion is valid whether the cross-bridge elasticity is assumed to be linear or exhibits nonlinearity similar to that suggested recently (Kaya and Higuchi, 2010; Månsson et al., 2019). Whereas the present analysis is limited to steady-state conditions, there is no reason to believe that the isometric tension transients or the rate of raise of force during full activation would be much different with one or three sites. This follows from very similar isometric cross-bridge distributions relative to the nearest myosin-binding site for each of the three sites in the three-site model and for the single site in the one-site model (compare Eisenberg and Hill, 1978; Månsson et al., 2018).
Models assuming target zones with three sites have been used previously (Smith and Geeves, 1995a,b; Vilfan and Duke, 2003; Smith et al., 2008; Smith and Mijailovich, 2008; Offer and Ranatunga, 2013; Smith, 2014) and some of these models have also included details of the 3-D arrangement of actin and myosin in the myofilament lattice, as well as accessory proteins (Mijailovich et al., 2016). Importantly, however, to the best of my knowledge, models with one and three sites per target zone have not previously been directly compared. Smith and Mijailovich (2008) mentioned a lack of scaling effect (e.g., no effect on absolute isometric force) between the assumption of one and three sites per target zone. However, the model used in that study assumed a fixed geometry of the myofilament lattice throughout the muscle with a given spatial relationship between the myosin crowns on the thick filaments and the target zones on the thin filament in all sarcomeres included in the Monte Carlo simulations. In contrast, we consider average behavior of cross-bridges in muscle cells with billions of myosin motors and, as discussed below, a uniform myosin density distribution with respect to the distance to the nearest target zone.
Good fits to experimental force–velocity data have been demonstrated using models assuming one target zone per 36 nm of an actin filament, each with either one or three sites. However, comparison to data in the literature suggests that models making other assumptions, such as continuous sites (Duke, 1999; Vilfan and Duke, 2003; Walcott et al., 2012) or a linear array of sites separated by ∼5.5 nm (Piazzesi and Lombardi, 1995; Caremani et al., 2013), give predictions of steady-state contractile behavior of muscle that are quite consistent with experimental results (compare Mijailovich et al., 2016). The latter models are useful, for example, for simulating slippage of myosin heads between neighboring sites (see also Schoenberg, 1985). The present study suggests that a model assuming a target zone with just one site but a realistic kinetic scheme and realistic parameter values is a simple and durable alternative for most purposes. These include efforts to deduce how changes in cross-bridge interaction parameters (e.g., due to drugs, mutations, or posttranslational modifications) affect several aspects of contractile function (compare Albet-Torres et al., 2009; Rahman et al., 2018). A linear array of sites separated by ∼5.5 nm (Piazzesi and Lombardi, 1995; Caremani et al., 2013) may seem physically unrealistic (compare Molloy et al., 1995; Steffen et al., 2001; Capitanio et al., 2006) and make it more difficult to account for some phenomena (Vilfan and Duke, 2003). However, the present evidence consistent with the possibility of more than three sites per target zone hints why models of this type nevertheless may give a reasonable approximation to muscle behavior.
Relation of the present models to spatially explicit models on different levels of complexity
How can a simple one-site model, similar to that used here, be successful in accounting for a wide range of experimental findings despite ignoring a wide set of real physical properties, including 3-D structural information (compare Mijailovich et al., 2016, 2017)? One answer to this question comes from the great similarity between cross-bridge distributions for the one-site and three-site models (Fig. 4). Another answer comes from the fact that the muscle geometry is not perfect. There are imperfections of the double-helical arrangements of the actin filaments and the triple-helical arrangement of thick filaments relative to each other, added to imperfection in the longitudinal alignment of all filaments. Such disorder can be ascribed both to imperfect packing (static disorder) of the filaments in the myofilament lattice (Luther and Squire, 2014) and to Brownian motion (dynamic disorder) as well as additional disorder caused by force and sarcomere redistributions along and across a muscle cell during activity (Edman and Reggiani, 1984, 1987; Vilfan and Duke, 2003; Koubassova et al., 2008). As a result of all the mentioned types of disorder, it is not unlikely that a uniform spatial distribution of myosin heads relative to their target zones, as assumed here, is a better approximation of the real situation than a distribution based on a perfect geometrical model assuming no variability.
Spatially explicit models on different levels of complexity (Williams et al., 2012; Mijailovich et al., 2016) naturally have the potential to simulate and analyze a wide range of phenomena. However, the interpretation of model results may, in itself, be challenging due to the complexity. Furthermore, it is not straightforward to assign appropriate values to all parameter values. This is partly due to the fact that the real muscle geometry differs from that in structural models (see above). Furthermore, it may be difficult to find experimental data for coherent conditions for all parameters that need to be assigned to define a spatially explicit model. In this case, it is of interest to consider the optical tweezers data of Steffen et al. (2001) that has been used (Vilfan and Duke, 2003; Mijailovich et al., 2016) to assign probabilities for cross-bridge attachment at different sites within a target zone. Importantly, however, this geometry is unlikely to reflect that in a muscle cell, because isolated S1 motor domains as used by Steffen et al. (2001) would be expected to exhibit appreciably lower flexibility than full-length myosin (compare Gundapaneni et al., 2005; Persson et al., 2010; and Yamada et al., 1997). As a result, the probability of S1 attachment at geometrically unfavorable actin sites is expected to be appreciably lower than for the heads of full-length myosin. This is consistent with the present modeling results indicating that it may not be enough with three sites per target zone, even if each of these has similar high probability of myosin head attachment, to account for the absolute value of the isometric force.
A specific consideration in relation to the myofilament geometry is the possibility of several different springs associated with the lever arm of the myosin motor domain (Williams et al., 2010, 2012). This would be expected to cause nonlinearity of the apparent cross-bridge elasticity in the axial direction of the muscle with reduced stiffness for negative x-values and increased stiffness for large positive x-values. Additionally, these effects would vary with the interfilament spacing and thereby with sarcomere length in a living muscle due to constant volume behavior (Williams et al., 2013). One may argue, however, that for a constant sarcomere length (as considered here) and x-values close to the minimum of the axial free energy profile, any free energy profile is well approximated by a second-order polynomial, because this corresponds to the first terms in the Taylor expansion. Another reason to stick with the simple model is its success in accounting for the data and, as discussed above, the challenges to find appropriate parameter values from experimental studies to appropriately characterize the properties of all springs. Nevertheless, a model assuming several springs is clearly of importance to consider, for example, when muscles operate over a rather wide range of sarcomere lengths (associated with altered myofilament lattice spacing). This is of greater relevance for heart muscle than for skeletal muscle under physiological conditions.
A remaining uncertainty in any model at present (compare Månsson et al., 2018) is the role of the two heads of myosin. Here, we have assumed, with some support (Pertici et al., 2018), that the two heads interact with the actin filaments independently of each other, giving 294 heads in total per half thick filament. This would presumably mean that the two heads can interact with two different filaments (as suggested, e.g., in Conibear, 1999) and as demonstrated using rigor muscle fibers (Trinick and Offer, 1979). Whereas this idea is speculative, it may be regarded as equally speculative to assume that the two heads cooperate (e.g., that they work in sequence) or that only one head can bind to actin at a given time.
The behavior of partially activated muscle cells (e.g., during cardiac systole) would be possible to simulate using the current steady-state models for both one and three sites on the simplifying assumptions that activation is time invariant and that there is no cooperativity that spreads the activation along the thin filament. Whereas these assumptions are not valid in living cardiac muscle (Desai et al., 2015; Land et al., 2017; Risi et al., 2017), some mechanistic insights might be gained by using the present models to interpret steady-state properties of skinned cardiac preparations or isolated ensembles of cardiac myosin motors (Pertici et al., 2018), cases where Ca activation may be kept constant on different levels. Under these conditions, varying activation levels may be simulated simply by assuming a varying number of open regulatory units along the thin filament, each exposing either one (one-site model) or three (three-site model) binding sites for myosin. The implementation of both one-site and three-site models would be expected to be straightforward, because each regulatory unit seems to include 7–11 actin monomers (Campbell et al., 2010; Desai et al., 2015). To extend the model in future work to include time-varying activation with cooperative effects, it would seem necessary to use computationally costly Monte Carlo simulation approaches or other recently described techniques (Rice et al., 2008; Campbell et al., 2010).
Also at maximal level of activation, the possibility exists that the mere presence of the regulatory proteins (e.g., tropomyosin) significantly affects the kinetics of the actomyosin interaction. Interestingly, there is evidence both for and against this idea. First, one may consider the similarity of force–velocity data recorded using an ensemble of isolated myosin molecules interacting with an actin filament in vitro (without any regulatory proteins; Pertici et al., 2018), similar data from the muscle cell (Månsson et al., 2019), and data from the present model simulations (Fig. 2, B and D). This suggests that neither the myofilament lattice dimensions nor the presence of regulatory proteins is of critical importance in determining steady-state properties of muscle under physiological conditions, at least those reflected in the shape of the force–velocity relationship. On the other hand, the maximum isometric force given by the model with three sites (∼390 kPa) is slightly lower than that found in experiments on muscle cells (500 kPa; see above). This is either due to more than three sites per target zone in a muscle or a higher force per site than predicted by the model. One possibility in the latter regard is that the presence of troponin and particularly tropomyosin alters model parameters, consistent with experimental findings (Homsher et al., 2003; Behrmann et al., 2012; Ishii et al., 2018), or that minor experimental uncertainties in the model parameters would contribute. On the assumption of three sites per target zone, the present model predicts that 31% of all myosin heads are attached to actin. This numerical value accords with the idea of three or more sites per target zone in view of experimental data for fractional attachment: (1) 33% (Table 1) from comparison of stiffness data in active contraction to stiffness in rigor (Linari et al., 2007) and (2) 40% from the intensity of the actin layer line (Koubassova et al., 2008), with both estimates using permeabilized rabbit psoas muscle fibers.
Two interrelated parameter values affected by experimental uncertainties are the cross-bridge stiffness and the average force per cross-bridge (equal to cross-bridge stiffness times average cross-bridge strain). Here, we assumed a cross-bridge stiffness at positive x-values of 2.8 pN/nm, close to that found by Kaya and Higuchi (2010) in single-molecule studies from fast skeletal muscle myosin from the rabbit. Together with the cross-bridge kinetics and other parameters of the present model, this stiffness value leads to an average cross-bridge strain of 2.4 nm and an average isometric force per attached cross-bridge of 6.7 pN/nm. Whereas the latter value is similar to that calculated by Linari et al. (2007) and Kaya and Higuchi (2010), it is low compared with the single-molecule data (9 pN) in Takagi et al. (2006). However, whereas the isometric force per cross-bridge is similar to that in (Linari et al., 2007), the average strain is lower than half the value estimated in that study. This is directly related to the almost two times higher cross-bridge stiffness in the present model (based on Kaya and Higuchi, 2010) than found in Linari et al. (2007). The present model might need to be modified in certain respects to accommodate a higher average force per attached cross-bridge. However, it is not compatible with much higher cross-bridge strain than 2–3 nm if we assume that the cross-bridge stiffness is ∼3 pN/nm. In this context, one must also consider the experimental uncertainty in these values whether obtained using single molecules (reviewed in Kaya and Higuchi, 2013; Månsson et al., 2018) or muscle fibers (Offer and Ranatunga, 2010).
Conclusions
The present study suggests that mechanokinetic models with target zones and only one myosin-binding site per target zone are useful to predict several aspects of normal physiology. Particularly, they seem to give very similar predictions as a more realistic model with three sites per target zone provided that the predictions from the one-site models are appropriately scaled. However, despite some complexities discussed above, the present results suggest that the effective target zones may contain more sites than suggested by single-molecule experiments using subfragment 1 (Steffen et al., 2001). This finding, together with the similarity of the predictions of the one-site and three-site models, may explain why both target zone models with one site per 36 nm along actin and models assuming a linear array of sites at 5.5-nm intervals account well for a range of contractile properties. A further important result is that model simulations assuming both one and three sites per target zone are consistent with the idea that the cross-bridge elasticity in muscle cells exhibits nonlinearity similar to that observed in single-molecule studies (Kaya and Higuchi, 2010). This is of relevance, because the elastic properties of the cross-bridges determine several aspects of muscle contraction and critically affect the interpretation of stiffness measurements, frequently used in muscle mechanical studies (Månsson et al., 2019).
Finally, the present findings support the view (Månsson, 2016; Månsson et al., 2018; Pertici et al., 2018) that a wide range of contractile phenomena can be predicted on basis of actin–myosin kinetics data obtained in solution studies and single-molecule analysis. It does not seem necessary (at least not under physiological conditions) to invoke effects of cooperativity between the two myosin heads, effects of accessory proteins (such as thin filament regulatory proteins, titin, and myosin-binding protein C), or intersite slippage of myosin heads (Månsson, 2010; Caremani et al., 2013; Marcucci and Reggiani, 2016).
Supplementary Material
Acknowledgments
Helpful discussions with Dr. H. Westerblad on the maximum isometric force of living muscle cells are acknowledged.
This work was funded by the Swedish Research Council (grant 2015-05290) and the Faculty of Health and Life Sciences at Linnaeus University, Sweden.
The author declares no competing interests.
Henk L. Granzier served as editor.
References
- Adamovic I., Mijailovich S.M., and Karplus M.. 2008. The elastic properties of the structurally characterized myosin II S2 subdomain: a molecular dynamics and normal mode analysis. Biophys. J. 94:3779–3789. 10.1529/biophysj.107.122028 [DOI] [PMC free article] [PubMed] [Google Scholar]
- Albet-Torres N., Bloemink M.J., Barman T., Candau R., Frölander K., Geeves M.A., Golker K., Herrmann C., Lionne C., Piperio C., et al. 2009. Drug effect unveils inter-head cooperativity and strain-dependent ADP release in fast skeletal actomyosin. J. Biol. Chem. 284:22926–22937. 10.1074/jbc.M109.019232 [DOI] [PMC free article] [PubMed] [Google Scholar]
- Asmussen G., Beckers-Bleukx G., and Maréchal G.. 1994. The force-velocity relation of the rabbit inferior oblique muscle; influence of temperature. Pflugers Arch. 426:542–547. 10.1007/BF00378532 [DOI] [PubMed] [Google Scholar]
- Behrmann E., Müller M., Penczek P.A., Mannherz H.G., Manstein D.J., and Raunser S.. 2012. Structure of the rigor actin-tropomyosin-myosin complex. Cell. 150:327–338. 10.1016/j.cell.2012.05.037 [DOI] [PMC free article] [PubMed] [Google Scholar]
- Bell G.I. 1978. Models for the specific adhesion of cells to cells. Science. 200:618–627. 10.1126/science.347575 [DOI] [PubMed] [Google Scholar]
- Campbell S.G., Lionetti F.V., Campbell K.S., and McCulloch A.D.. 2010. Coupling of adjacent tropomyosins enhances cross-bridge-mediated cooperative activation in a markov model of the cardiac thin filament. Biophys. J. 98:2254–2264. 10.1016/j.bpj.2010.02.010 [DOI] [PMC free article] [PubMed] [Google Scholar]
- Capitanio M., Canepari M., Cacciafesta P., Lombardi V., Cicchi R., Maffei M., Pavone F.S., and Bottinelli R.. 2006. Two independent mechanical events in the interaction cycle of skeletal muscle myosin with actin. Proc. Natl. Acad. Sci. USA. 103:87–92. 10.1073/pnas.0506830102 [DOI] [PMC free article] [PubMed] [Google Scholar]
- Capitanio M., Canepari M., Maffei M., Beneventi D., Monico C., Vanzi F., Bottinelli R., and Pavone F.S.. 2012. Ultrafast force-clamp spectroscopy of single molecules reveals load dependence of myosin working stroke. Nat. Methods. 9:1013–1019. 10.1038/nmeth.2152 [DOI] [PubMed] [Google Scholar]
- Caremani M., Melli L., Dolfi M., Lombardi V., and Linari M.. 2013. The working stroke of the myosin II motor in muscle is not tightly coupled to release of orthophosphate from its active site. J. Physiol. 591:5187–5205. 10.1113/jphysiol.2013.257410 [DOI] [PMC free article] [PubMed] [Google Scholar]
- Conibear P.B. 1999. Kinetic studies on the effects of ADP and ionic strength on the interaction between myosin subfragment-1 and actin: implications for load-sensitivity and regulation of the crossbridge cycle. J. Muscle Res. Cell Motil. 20:727–742. 10.1023/A:1005696017544 [DOI] [PubMed] [Google Scholar]
- Daniel T.L., Trimble A.C., and Chase P.B.. 1998. Compliant realignment of binding sites in muscle: transient behavior and mechanical tuning. Biophys. J. 74:1611–1621. 10.1016/S0006-3495(98)77875-0 [DOI] [PMC free article] [PubMed] [Google Scholar]
- Desai R., Geeves M.A., and Kad N.M.. 2015. Using fluorescent myosin to directly visualize cooperative activation of thin filaments. J. Biol. Chem. 290:1915–1925. 10.1074/jbc.M114.609743 [DOI] [PMC free article] [PubMed] [Google Scholar]
- Duke T.A. 1999. Molecular model of muscle contraction. Proc. Natl. Acad. Sci. USA. 96:2770–2775. 10.1073/pnas.96.6.2770 [DOI] [PMC free article] [PubMed] [Google Scholar]
- Edman K.A., and Reggiani C.. 1984. Redistribution of sarcomere length during isometric contraction of frog muscle fibres and its relation to tension creep. J. Physiol. 351:169–198. 10.1113/jphysiol.1984.sp015240 [DOI] [PMC free article] [PubMed] [Google Scholar]
- Edman K.A., and Reggiani C.. 1987. The sarcomere length-tension relation determined in short segments of intact muscle fibres of the frog. J. Physiol. 385:709–732. 10.1113/jphysiol.1987.sp016516 [DOI] [PMC free article] [PubMed] [Google Scholar]
- Eisenberg E., and Greene L.E.. 1980. The relation of muscle biochemistry to muscle physiology. Annu. Rev. Physiol. 42:293–309. 10.1146/annurev.ph.42.030180.001453 [DOI] [PubMed] [Google Scholar]
- Eisenberg E., and Hill T.L.. 1978. A cross-bridge model of muscle contraction. Prog. Biophys. Mol. Biol. 33:55–82. 10.1016/0079-6107(79)90025-7 [DOI] [PubMed] [Google Scholar]
- Eisenberg E., Hill T.L., and Chen Y.. 1980. Cross-bridge model of muscle contraction. Quantitative analysis. Biophys. J. 29:195–227. 10.1016/S0006-3495(80)85126-5 [DOI] [PMC free article] [PubMed] [Google Scholar]
- Gundapaneni D., Xu J., and Root D.D.. 2005. High flexibility of the actomyosin crossbridge resides in skeletal muscle myosin subfragment-2 as demonstrated by a new single molecule assay. J. Struct. Biol. 149:117–126. 10.1016/j.jsb.2004.10.005 [DOI] [PubMed] [Google Scholar]
- He Z.H., Chillingworth R.K., Brune M., Corrie J.E., Webb M.R., and Ferenczi M.A.. 1999. The efficiency of contraction in rabbit skeletal muscle fibres, determined from the rate of release of inorganic phosphate. J. Physiol. 517:839–854. 10.1111/j.1469-7793.1999.0839s.x [DOI] [PMC free article] [PubMed] [Google Scholar]
- Hill T.L. 1974. Theoretical formalism for the sliding filament model of contraction of striated muscle. Part I. Prog. Biophys. Mol. Biol. 28:267–340. 10.1016/0079-6107(74)90020-0 [DOI] [PubMed] [Google Scholar]
- Homsher E., Nili M., Chen I.Y., and Tobacman L.S.. 2003. Regulatory proteins alter nucleotide binding to acto-myosin of sliding filaments in motility assays. Biophys. J. 85:1046–1052. 10.1016/S0006-3495(03)74543-3 [DOI] [PMC free article] [PubMed] [Google Scholar]
- Huxley A.F. 1957. Muscle structure and theories of contraction. Prog. Biophys. Biophys. Chem. 7:255–318. 10.1016/S0096-4174(18)30128-8 [DOI] [PubMed] [Google Scholar]
- Huxley H.E. 1969. The mechanism of muscular contraction. Science. 164:1356–1365. 10.1126/science.164.3886.1356 [DOI] [PubMed] [Google Scholar]
- Huxley A.F., and Simmons R.M.. 1971. Proposed mechanism of force generation in striated muscle. Nature. 233:533–538. 10.1038/233533a0 [DOI] [PubMed] [Google Scholar]
- Ishii S., Kawai M., Ishiwata S., and Suzuki M.. 2018. Estimation of actomyosin active force maintained by tropomyosin and troponin complex under vertical forces in the in vitro motility assay system. PLoS One. 13:e0192558 10.1371/journal.pone.0192558 [DOI] [PMC free article] [PubMed] [Google Scholar]
- Kaya M., and Higuchi H.. 2010. Nonlinear elasticity and an 8-nm working stroke of single myosin molecules in myofilaments. Science. 329:686–689. 10.1126/science.1191484 [DOI] [PubMed] [Google Scholar]
- Kaya M., and Higuchi H.. 2013. Stiffness, working stroke, and force of single-myosin molecules in skeletal muscle: elucidation of these mechanical properties via nonlinear elasticity evaluation. Cell. Mol. Life Sci. 70:4275–4292. 10.1007/s00018-013-1353-x [DOI] [PMC free article] [PubMed] [Google Scholar]
- Koubassova N.A., Bershitsky S.Y., Ferenczi M.A., and Tsaturyan A.K.. 2008. Direct modeling of X-ray diffraction pattern from contracting skeletal muscle. Biophys. J. 95:2880–2894. 10.1529/biophysj.107.120832 [DOI] [PMC free article] [PubMed] [Google Scholar]
- Land S., Park-Holohan S.J., Smith N.P., Dos Remedios C.G., Kentish J.C., and Niederer S.A.. 2017. A model of cardiac contraction based on novel measurements of tension development in human cardiomyocytes. J. Mol. Cell. Cardiol. 106:68–83. 10.1016/j.yjmcc.2017.03.008 [DOI] [PubMed] [Google Scholar]
- Lewalle A., Steffen W., Stevenson O., Ouyang Z., and Sleep J.. 2008. Single-molecule measurement of the stiffness of the rigor myosin head. Biophys. J. 94:2160–2169. 10.1529/biophysj.107.119396 [DOI] [PMC free article] [PubMed] [Google Scholar]
- Linari M., Caremani M., Piperio C., Brandt P., and Lombardi V.. 2007. Stiffness and fraction of Myosin motors responsible for active force in permeabilized muscle fibers from rabbit psoas. Biophys. J. 92:2476–2490. 10.1529/biophysj.106.099549 [DOI] [PMC free article] [PubMed] [Google Scholar]
- Lombardi V., Piazzesi G., Ferenczi M.A., Thirlwell H., Dobbie I., and Irving M.. 1995. Elastic distortion of myosin heads and repriming of the working stroke in muscle. Nature. 374:553–555. 10.1038/374553a0 [DOI] [PubMed] [Google Scholar]
- Luther P.K., and Squire J.M.. 2014. The intriguing dual lattices of the Myosin filaments in vertebrate striated muscles: evolution and advantage. Biology (Basel). 3:846–865. [DOI] [PMC free article] [PubMed] [Google Scholar]
- Lymn R.W., and Taylor E.W.. 1971. Mechanism of adenosine triphosphate hydrolysis by actomyosin. Biochemistry. 10:4617–4624. 10.1021/bi00801a004 [DOI] [PubMed] [Google Scholar]
- Ma W., Gong H., Kiss B., Lee E.J., Granzier H., and Irving T.. 2018. Thick-Filament Extensibility in Intact Skeletal Muscle. Biophys. J. 115:1580–1588. 10.1016/j.bpj.2018.08.038 [DOI] [PMC free article] [PubMed] [Google Scholar]
- Månsson A. 2010. Actomyosin-ADP states, interhead cooperativity, and the force-velocity relation of skeletal muscle. Biophys. J. 98:1237–1246. 10.1016/j.bpj.2009.12.4285 [DOI] [PMC free article] [PubMed] [Google Scholar]
- Månsson A. 2016. Actomyosin based contraction: one mechanokinetic model from single molecules to muscle? J. Muscle Res. Cell Motil. 37:181–194. 10.1007/s10974-016-9458-0 [DOI] [PMC free article] [PubMed] [Google Scholar]
- Månsson A., Mörner J., and Edman K.A.. 1989. Effects of amrinone on twitch, tetanus and shortening kinetics in mammalian skeletal muscle. Acta Physiol. Scand. 136:37–45. 10.1111/j.1748-1716.1989.tb08627.x [DOI] [PubMed] [Google Scholar]
- Månsson A., Ušaj M., Moretto L., and Rassier D.E.. 2018. Do Actomyosin Single-Molecule Mechanics Data Predict Mechanics of Contracting Muscle? Int. J. Mol. Sci. 19:19 10.3390/ijms19071863 [DOI] [PMC free article] [PubMed] [Google Scholar]
- Månsson A., Persson M., Shalabi N., and Rassier D.E.. 2019. Non-linear actomyosin elasticity in muscle? Biophys. J. 116:330–346. 10.1016/j.bpj.2018.12.004 [DOI] [PMC free article] [PubMed] [Google Scholar]
- Marcucci L., and Reggiani C.. 2016. Mechanosensing in Myosin Filament Solves a 60 Years Old Conflict in Skeletal Muscle Modeling between High Power Output and Slow Rise in Tension. Front. Physiol. 7:427 10.3389/fphys.2016.00427 [DOI] [PMC free article] [PubMed] [Google Scholar]
- Mijailovich S.M., Kayser-Herold O., Stojanovic B., Nedic D., Irving T.C., and Geeves M.A.. 2016. Three-dimensional stochastic model of actin-myosin binding in the sarcomere lattice. J. Gen. Physiol. 148:459–488. 10.1085/jgp.201611608 [DOI] [PMC free article] [PubMed] [Google Scholar]
- Mijailovich S.M., Nedic D., Svicevic M., Stojanovic B., Walklate J., Ujfalusi Z., and Geeves M.A.. 2017. Modeling the Actin.myosin ATPase Cross-Bridge Cycle for Skeletal and Cardiac Muscle Myosin Isoforms. Biophys. J. 112:984–996. 10.1016/j.bpj.2017.01.021 [DOI] [PMC free article] [PubMed] [Google Scholar]
- Millman B.M. 1998. The filament lattice of striated muscle. Physiol. Rev. 78:359–391. 10.1152/physrev.1998.78.2.359 [DOI] [PubMed] [Google Scholar]
- Mobley B.A., and Eisenberg B.R.. 1975. Sizes of components in frog skeletal muscle measured by methods of stereology. J. Gen. Physiol. 66:31–45. 10.1085/jgp.66.1.31 [DOI] [PMC free article] [PubMed] [Google Scholar]
- Molloy J.E., Burns J.E., Sparrow J.C., Tregear R.T., Kendrick-Jones J., and White D.C.. 1995. Single-molecule mechanics of heavy meromyosin and S1 interacting with rabbit or Drosophila actins using optical tweezers. Biophys. J. 68:298S–305S. [PMC free article] [PubMed] [Google Scholar]
- Nyitrai M., and Geeves M.A.. 2004. Adenosine diphosphate and strain sensitivity in myosin motors. Philos. Trans. R. Soc. Lond. B Biol. Sci. 359:1867–1877. 10.1098/rstb.2004.1560 [DOI] [PMC free article] [PubMed] [Google Scholar]
- Offer G., and Ranatunga K.W.. 2010. Crossbridge and filament compliance in muscle: implications for tension generation and lever arm swing. J. Muscle Res. Cell Motil. 31:245–265. 10.1007/s10974-010-9232-7 [DOI] [PubMed] [Google Scholar]
- Offer G., and Ranatunga K.W.. 2013. A cross-bridge cycle with two tension-generating steps simulates skeletal muscle mechanics. Biophys. J. 105:928–940. 10.1016/j.bpj.2013.07.009 [DOI] [PMC free article] [PubMed] [Google Scholar]
- Persson M., Albet-Torres N., Ionov L., Sundberg M., Höök F., Diez S., Månsson A., and Balaz M.. 2010. Heavy meromyosin molecules extending more than 50 nm above adsorbing electronegative surfaces. Langmuir. 26:9927–9936. 10.1021/la100395a [DOI] [PubMed] [Google Scholar]
- Persson M., Bengtsson E., ten Siethoff L., and Månsson A.. 2013. Nonlinear cross-bridge elasticity and post-power-stroke events in fast skeletal muscle actomyosin. Biophys. J. 105:1871–1881. 10.1016/j.bpj.2013.08.044 [DOI] [PMC free article] [PubMed] [Google Scholar]
- Pertici I., Bongini L., Melli L., Bianchi G., Salvi L., Falorsi G., Squarci C., Bozó T., Cojoc D., Kellermayer M.S.Z., et al. 2018. A myosin II nanomachine mimicking the striated muscle. Nat. Commun. 9:3532 10.1038/s41467-018-06073-9 [DOI] [PMC free article] [PubMed] [Google Scholar]
- Piazzesi G., and Lombardi V.. 1995. A cross-bridge model that is able to explain mechanical and energetic properties of shortening muscle. Biophys. J. 68:1966–1979. 10.1016/S0006-3495(95)80374-7 [DOI] [PMC free article] [PubMed] [Google Scholar]
- Piazzesi G., Reconditi M., Linari M., Lucii L., Bianco P., Brunello E., Decostre V., Stewart A., Gore D.B., Irving T.C., et al. 2007. Skeletal muscle performance determined by modulation of number of myosin motors rather than motor force or stroke size. Cell. 131:784–795. 10.1016/j.cell.2007.09.045 [DOI] [PubMed] [Google Scholar]
- Rahman M.A., Ušaj M., Rassier D.E., and Månsson A.. 2018. Blebbistatin Effects Expose Hidden Secrets in the Force-Generating Cycle of Actin and Myosin. Biophys. J. 115:386–397. 10.1016/j.bpj.2018.05.037 [DOI] [PMC free article] [PubMed] [Google Scholar]
- Ranatunga K.W. 1984. The force-velocity relation of rat fast- and slow-twitch muscles examined at different temperatures. J. Physiol. 351:517–529. 10.1113/jphysiol.1984.sp015260 [DOI] [PMC free article] [PubMed] [Google Scholar]
- Reggiani C., Potma E.J., Bottinelli R., Canepari M., Pellegrino M.A., and Stienen G.J.. 1997. Chemo-mechanical energy transduction in relation to myosin isoform composition in skeletal muscle fibres of the rat. J. Physiol. 502:449–460. 10.1111/j.1469-7793.1997.449bk.x [DOI] [PMC free article] [PubMed] [Google Scholar]
- Rice J.J., Wang F., Bers D.M., and de Tombe P.P.. 2008. Approximate model of cooperative activation and crossbridge cycling in cardiac muscle using ordinary differential equations. Biophys. J. 95:2368–2390. 10.1529/biophysj.107.119487 [DOI] [PMC free article] [PubMed] [Google Scholar]
- Risi C., Eisner J., Belknap B., Heeley D.H., White H.D., Schröder G.F., and Galkin V.E.. 2017. Ca2+-induced movement of tropomyosin on native cardiac thin filaments revealed by cryoelectron microscopy. Proc. Natl. Acad. Sci. USA. 114:6782–6787. [DOI] [PMC free article] [PubMed] [Google Scholar]
- Schneider C.A., Rasband W.S., and Eliceiri K.W.. 2012. NIH Image to ImageJ: 25 years of image analysis. Nat. Methods. 9:671–675. 10.1038/nmeth.2089 [DOI] [PMC free article] [PubMed] [Google Scholar]
- Schoenberg M. 1985. Equilibrium muscle cross-bridge behavior. Theoretical considerations. Biophys. J. 48:467–475. 10.1016/S0006-3495(85)83802-9 [DOI] [PMC free article] [PubMed] [Google Scholar]
- Smith D.A. 2014. A new mechanokinetic model for muscle contraction, where force and movement are triggered by phosphate release. J. Muscle Res. Cell Motil. 35:295–306. 10.1007/s10974-014-9391-z [DOI] [PubMed] [Google Scholar]
- Smith D.A., and Geeves M.A.. 1995a Strain-dependent cross-bridge cycle for muscle. Biophys. J. 69:524–537. 10.1016/S0006-3495(95)79926-X [DOI] [PMC free article] [PubMed] [Google Scholar]
- Smith D.A., and Geeves M.A.. 1995b Strain-dependent cross-bridge cycle for muscle. II. Steady-state behavior. Biophys. J. 69:538–552. 10.1016/S0006-3495(95)79927-1 [DOI] [PMC free article] [PubMed] [Google Scholar]
- Smith D.A., and Mijailovich S.M.. 2008. Toward a unified theory of muscle contraction. II: predictions with the mean-field approximation. Ann. Biomed. Eng. 36:1353–1371. 10.1007/s10439-008-9514-z [DOI] [PubMed] [Google Scholar]
- Smith D.A., Geeves M.A., Sleep J., and Mijailovich S.M.. 2008. Towards a unified theory of muscle contraction. I: foundations. Ann. Biomed. Eng. 36:1624–1640. 10.1007/s10439-008-9536-6 [DOI] [PubMed] [Google Scholar]
- Spudich J.A., Aksel T., Bartholomew S.R., Nag S., Kawana M., Yu E.C., Sarkar S.S., Sung J., Sommese R.F., Sutton S., et al. 2016. Effects of hypertrophic and dilated cardiomyopathy mutations on power output by human β-cardiac myosin. J. Exp. Biol. 219:161–167. 10.1242/jeb.125930 [DOI] [PMC free article] [PubMed] [Google Scholar]
- Steffen W., Smith D., Simmons R., and Sleep J.. 2001. Mapping the actin filament with myosin. Proc. Natl. Acad. Sci. USA. 98:14949–14954. 10.1073/pnas.261560698 [DOI] [PMC free article] [PubMed] [Google Scholar]
- Sun Y.B., Hilber K., and Irving M.. 2001. Effect of active shortening on the rate of ATP utilisation by rabbit psoas muscle fibres. J. Physiol. 531:781–791. 10.1111/j.1469-7793.2001.0781h.x [DOI] [PMC free article] [PubMed] [Google Scholar]
- Takagi Y., Homsher E.E., Goldman Y.E., and Shuman H.. 2006. Force generation in single conventional actomyosin complexes under high dynamic load. Biophys. J. 90:1295–1307. 10.1529/biophysj.105.068429 [DOI] [PMC free article] [PubMed] [Google Scholar]
- Tanner B.C., Daniel T.L., and Regnier M.. 2007. Sarcomere lattice geometry influences cooperative myosin binding in muscle. PLOS Comput. Biol. 3:e115 10.1371/journal.pcbi.0030115 [DOI] [PMC free article] [PubMed] [Google Scholar]
- Thedinga E., Karim N., Kraft T., and Brenner B.. 1999. A single-fiber in vitro motility assay. In vitro sliding velocity of F-actin vs. unloaded shortening velocity in skinned muscle fibers. J. Muscle Res. Cell Motil. 20:785–796. 10.1023/A:1005658825375 [DOI] [PubMed] [Google Scholar]
- Trinick J., and Offer G.. 1979. Cross-linking of actin filaments by heavy meromyosin. J. Mol. Biol. 133:549–556. 10.1016/0022-2836(79)90407-8 [DOI] [PubMed] [Google Scholar]
- Ujfalusi Z., Vera C.D., Mijailovich S.M., Svicevic M., Yu E.C., Kawana M., Ruppel K.M., Spudich J.A., Geeves M.A., and Leinwand L.A.. 2018. Dilated cardiomyopathy myosin mutants have reduced force-generating capacity. J. Biol. Chem. 293:9017–9029. 10.1074/jbc.RA118.001938 [DOI] [PMC free article] [PubMed] [Google Scholar]
- Vilfan A., and Duke T.. 2003. Instabilities in the transient response of muscle. Biophys. J. 85:818–827. 10.1016/S0006-3495(03)74522-6 [DOI] [PMC free article] [PubMed] [Google Scholar]
- Walcott S., Warshaw D.M., and Debold E.P.. 2012. Mechanical coupling between myosin molecules causes differences between ensemble and single-molecule measurements. Biophys. J. 103:501–510. 10.1016/j.bpj.2012.06.031 [DOI] [PMC free article] [PubMed] [Google Scholar]
- West T.G., Hild G., Siththanandan V.B., Webb M.R., Corrie J.E., and Ferenczi M.A.. 2009. Time course and strain dependence of ADP release during contraction of permeabilized skeletal muscle fibers. Biophys. J. 96:3281–3294. 10.1016/j.bpj.2009.01.016 [DOI] [PMC free article] [PubMed] [Google Scholar]
- Westerblad H., Bruton J.D., and Lännergren J.. 1997. The effect of intracellular pH on contractile function of intact, single fibres of mouse muscle declines with increasing temperature. J. Physiol. 500:193–204. 10.1113/jphysiol.1997.sp022009 [DOI] [PMC free article] [PubMed] [Google Scholar]
- Williams C.D., Regnier M., and Daniel T.L.. 2010. Axial and radial forces of cross-bridges depend on lattice spacing. PLOS Comput. Biol. 6:e1001018 10.1371/journal.pcbi.1001018 [DOI] [PMC free article] [PubMed] [Google Scholar]
- Williams C.D., Regnier M., and Daniel T.L.. 2012. Elastic energy storage and radial forces in the myofilament lattice depend on sarcomere length. PLOS Comput. Biol. 8:e1002770 10.1371/journal.pcbi.1002770 [DOI] [PMC free article] [PubMed] [Google Scholar]
- Williams C.D., Salcedo M.K., Irving T.C., Regnier M., and Daniel T.L.. 2013. The length-tension curve in muscle depends on lattice spacing. Proc. Biol. Sci. 280:20130697 10.1098/rspb.2013.0697 [DOI] [PMC free article] [PubMed] [Google Scholar]
- Yamada A., Yoshio M., and Nakayama H.. 1997. Bi-directional movement of actin filaments along long bipolar tracks of oriented rabbit skeletal muscle myosin molecules. FEBS Lett. 409:380–384. 10.1016/S0014-5793(97)00558-9 [DOI] [PubMed] [Google Scholar]
Associated Data
This section collects any data citations, data availability statements, or supplementary materials included in this article.