INTRODUCTION:
Malnutrition is a leading cause of morbidity and mortality in cirrhosis. Although multiple noninvasive measures of nutritional status have been studied, no consensus exists for early identification of malnutrition in cirrhosis. Serum metabolomics offers a novel approach for identifying biomarkers in multiple disease states. To characterize alterations in metabolic pathways associated with malnutrition in hospitalized cirrhotic patients and to identify biomarkers for disease prognosis.
METHODS:
In this cross-sectional, observational cohort study, 51 hospitalized cirrhotic patients were classified as malnourished (42.3%) or nourished (57.7%) based on low mid-arm muscle circumference and dominant handgrip strength. Anthropometric measurements and computed tomography body composition analysis were performed. Serum was collected after overnight fasting for unbiased metabolomics analysis.
RESULTS:
Malnourished cirrhotic patients exhibited mild reductions in skeletal muscle index, with more marked reductions in visceral fat index. Seventy-one biochemicals were significantly altered in malnourished subjects. The serum metabolite profile was significantly different between nourished and malnourished cirrhotic patients. Pathway analysis demonstrated that only sphingolipid metabolic pathways were significantly enriched in altered metabolites. Hierarchical clustering revealed that sphingolipid metabolites clustered into nourished and malnourished cohorts. Spearman analysis demonstrated multiple statistically significant correlations between sphingolipid species and Model for End-Stage Liver Disease-Sodium. Using logistic regression, we identified 8 sphingolipids that were significantly associated with malnutrition after controlling for Model for End-Stage Liver Disease-Sodium, age, and gender.
CONCLUSIONS:
Malnutrition in hospitalized cirrhotic patients is characterized by reductions in multiple sphingolipid species. Dysregulated sphingolipid metabolism may be involved in the pathophysiology of malnutrition in cirrhosis and potentially serve as a biomarker of nutritional status in this population.
INTRODUCTION
Malnutrition is characterized by skeletal muscle loss with or without adipose tissue loss. It is a common complication of cirrhosis, with an estimated prevalence as high as 65% (1–3). Studies have identified malnutrition as an independent predictor of both pre- and post-transplant mortalities, hepatic decompensation, and poor quality of life (4–8). Despite the prognostic significance of malnutrition in chronic liver disease, the pathophysiologic mechanisms remain unclear, and no validated objective biomarkers for identification and monitoring of malnutrition are currently available.
Approaches to identification of malnutrition have included clinical laboratory and anthropometric measurements, but these are inaccurate in patients with hepatic synthetic dysfunction and edema (3,9,10). Body composition analysis with dual energy x-ray absorptiometry is not widely available in clinical practice (11), and cross-sectional imaging of body composition fails to capture the functional measures of nutritional status (12). More recently, the functional measurements of grip strength and balance have been incorporated into scoring systems for nutritional status, but these still require validation in larger populations (13). Therefore, there is an important need for the development of objective and reproducible markers that capture the complex pathogenesis of malnutrition in end-stage liver disease.
With progressive hepatic failure, multiple metabolic pathways are disrupted; hence, metabolomics represents a powerful strategy for diagnosis and monitoring of metabolic dysfunction in end-stage liver disease. Our group has previously demonstrated that patients with severe acute alcoholic hepatitis exhibit a circulating metabolic signature distinct from subjects with compensated alcoholic cirrhosis (14). Others have shown alterations in the circulating metabolome of subjects with nonalcoholic fatty liver disease with progressive fibrosis (15). These and other studies highlight the promise of metabolomics for clinical staging of liver disease severity and metabolic dysfunction.
Therefore, the aim of our study was to characterize global metabolic phenotypes in cirrhosis-related malnutrition. We performed an unbiased serum metabolomics analysis in a prospectively collected cohort of hospitalized cirrhotic patients with and without malnutrition to identify potential metabolic biomarkers of malnutrition.
METHODS
Study population
This was a prospective, observational cohort study approved by the institutional review board at the University of Pittsburgh. Fifty-one hospitalized, cirrhotic patients were enrolled at the University of Pittsburgh Medical Center in Pittsburgh, Pennsylvania from November 2014 to June 2016. Informed consent was obtained from either the subject or a legally designated representative. Inclusion criteria included age over 18 years, ability and willingness to perform diagnostic tests. Exclusion criteria included prior history of solid organ transplant or hematopoietic stem cell transplant, death or transplantation during the hospitalization, and discharge with hospice care. Among 62 patients evaluated for study enrollment, 11 (17.7%) were excluded to death, discharge to hospice, or transplantation during hospitalization.
Clinical evaluation
Participants underwent a structured clinical assessment within 48 hours prior to hospital discharge. Age, gender, self-reported ethnicity, and medical history were obtained from review of medical charts and from patient interviews. Medical records were reviewed by 2 hepatologists (J.B. and V.R.) to establish etiology of cirrhosis, cirrhosis-related complications, and hospital admission diagnoses. Laboratory tests were obtained after overnight fasting. Routine clinical laboratory measurements were performed in the University of Pittsburgh Clinical Laboratories, which include serum glucose, potassium, blood urea nitrogen, creatinine, alanine aminotransferase, aspartate aminotransferase, total bilirubin, alkaline phosphatase, total protein, albumin, complete blood cell counts, and international normalized ratio. Model for End-Stage Liver Disease-Sodium (MELD-Na) score and Child-Turcott-Pugh Score and Class were determined as previously described (16,17).
Nutritional evaluation
Patients were measured on a standard upright weight scale, and this was designated as wet weight. Dry weight was determined as wet weight with 5% subtracted if mild ascites was present, 10% subtracted if moderate ascites was present, and 15% if tense ascites was present. If a patient underwent paracentesis with total removal of 10 L or more during the hospitalization, then the postparacentesis weight was considered the dry weight. An additional 5% was subtracted if lower extremity edema was present (18). Wet and dry body mass indices were calculated from height and weight (19). Dominant mid-arm circumference was assessed with a measuring tape at the midpoint between the acromion and epicondylar process. Triceps skinfold thickness was measured at the same location using the Lange Skinfold Caliper (Cambridge Scientific Industries, Cambridge, MD). Mid-arm muscle circumference (MAMC) was calculated as follows:
Dominant handgrip strength was assessed using the Jamar dynamometer (J.A. Preston, Jackson, MI). Patients underwent 3 repeated measurements, and the mean grip strength was then calculated. Malnutrition was defined as MAMC < 23 cm and handgrip strength <30 kg (20,21).
Radiographic analysis of body composition
Thirty-eight patients (74.5%) underwent abdominal computed tomography (CT), and 13 patients (25.5%) underwent abdominal MRI within 3 months of study enrollment. Images were analyzed using SliceOmatic (version 4.3) software (TomoVision, Quebec, Canada) to partition paraspinal skeletal muscle and visceral adipose tissue depots. Two consecutive axial CT images at the level of the L3 vertebral body were chosen for analysis, and these were reconstructed at 5 mm thickness with no interslice gap; mean skeletal muscle and visceral fat areas (in squared centimeter) from the 2 images were reported. Our institution Liver protocol MRI does not routinely extend beyond the L2/L3 intervertebral disk. Therefore, the single most caudal image from nonfat-saturated spoiled echo T1-weighted images was chosen for analysis. The most cranial level included was at the L1/L2 intervertebral disk. MRIs were acquired at 8 mm thickness with 2-mm inter-slice gap using both 1.5-T (n = 6) and 3-T (n = 7) magnets. The skeletal muscle index (SMI) and visceral fat index (VFI) were calculated as follows (22,23):
Sample collection, data acquisition, and statistical analysis
Twenty milliliters of blood was collected in sterile EDTA-containing tubes for metabolomics analysis within 48 hours of hospital discharge. Samples were obtained between 4 am and 6 am Serum was separated by centrifugation and was immediately stored at −80 °C until testing.
Samples were analyzed over a 2-day period, and missing values for a given metabolite were replaced with the lowest observed value for that metabolite. Raw data counts were then normalized to the median value of each biochemical.
Levels of inflammatory cytokines (interleukin 1β, interleukin 6, and tumor necrosis factor α) as well as serum insulin levels were measured on a Luminex platform at the University of Pittsburgh Genomics and Proteomics Core Facility (Pittsburgh, PA).
Statistical analysis was carried out using R (http://cran.r-project.org) and Stata version 11 (StataCorp, College Station, TX). Welch's t tests were performed on log-transformed data to compare relative levels of biochemical. False discovery rate was estimated using q values to account for multiple comparisons.
Partial least squares discriminant analysis was performed to measure variation between groups (24). Random forest methods with mean decrease accuracy (MDA) were used to determine the relative contribution of individual metabolites to patient groupings (25), and Ward hierarchical clustering was performed on the top 25 metabolites identified by MDA (26). Pathway analysis using MetaboAnalyst 3.0 (http://www.metaboanalyst.ca/faces/home.xhtml, (27)) was carried out on significantly altered metabolites to identify metabolic pathways significantly enriched between nourished and malnourished groups.
Clinical, demographic, and nutritional variables were reported as absolute frequencies, percentages, medians and interquartile ranges. The χ2 test was used to compare categorical variables between groups (or Fischer's exact test when expected values were ≤5), and the Mann-Whitney U test was used to compare continuous variables between groups. A P-value < 0.05 was considered statistically significant.
RESULTS
Demographic, clinical, and nutritional characteristics
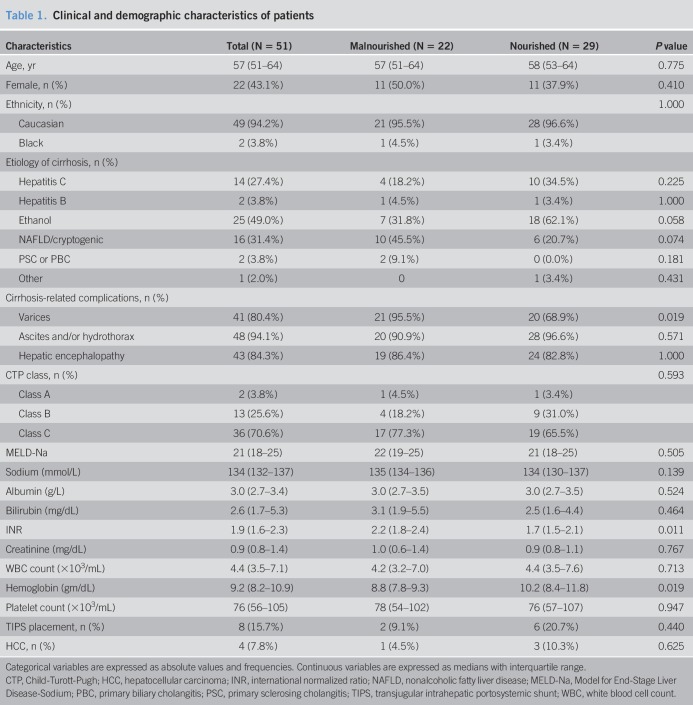
Clinical and demographic characteristics are presented in Table 1. Twenty-two patients (42.3%) met functional and anthropometric criteria for malnutrition. Age, gender, and ethnic distributions were similar between nourished and malnourished cohorts. The leading etiology of cirrhosis was alcoholic liver disease, and although gastroesophageal varices were more common in malnourished patients, rates of ascites and encephalopathy were similar between groups. Eight patients had prior TIPS placement (15.7%), and 4 patients had hepatocellular carcinoma (7.8%). 70.6% of patients had Child's Class C cirrhosis, and the median MELD-Na was 21 (18–25). As summarized in Supplemental Digital Content 2 (Table 1, http://links.lww.com/CTG/A9) admission diagnoses were similar between groups, and the length of hospitalization was similar between nourished and malnourished subjects (7.0 (3–12) days vs 8 (3–12) days, P = 0.702). Although international normalized ratio levels were higher in malnourished patients (2.2 (1.8–2.4) vs 1.7 (1.5–2.1), P = 0.011), MELD-Na scores were similar between groups, and malnourished patients exhibited a greater degree of anemia. There were no differences in Charlson Comorbidity Index, an important predictor of in-hospital mortality (28), between nourished and malnourished patients (6 (4–7) vs 5 (4–7), P = 0.708).
Table 1.
Clinical and demographic characteristics of patients
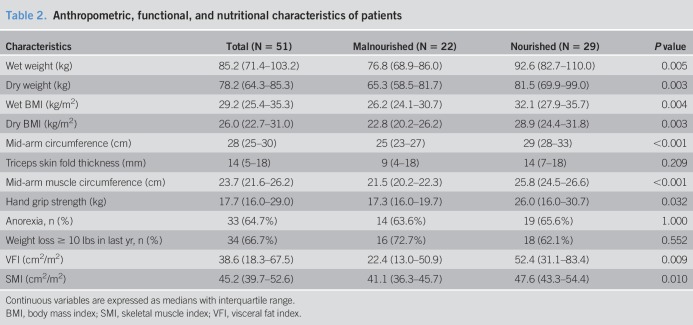
Anthropometric, functional, and nutritional features are summarized in Table 2. Malnourished patients had lower wet and dry body mass indices, mid-arm circumference, triceps skinfold thickness, MAMC, and handgrip strength. While SMI was slightly lower in malnourished patients (41.1 (36.3–45.7) cm2/m2 vs 47.6 (43.3–54.4) cm2/m2, P = 0.010) larger reductions in VFI (22.4 (13.0–50.9) cm2/m2 vs 52.4 (31.1–83.4) cm2/m2, P = 0.009) were observed in cirrhosis-related malnutrition.
Table 2.
Anthropometric, functional, and nutritional characteristics of patients
As acute inflammation can alter circulating metabolomics profiles, we measured IL-1β, IL-6, and tumor necrosis factor-α in collected serum, and levels of each cytokine did not differ between nourished and malnourished subjects. Similarly, as metabolic syndrome and insulin resistance can impact the circulating metabolome, we measured serum insulin, glucose, and Homeostatic Model Assessment for Insulin Resistance in serum samples, and there were no differences between groups (see Table 2, Supplemental Digital Content 2, http://links.lww.com/CTG/A9).
Overview of metabolomics analysis
A total of 747 distinct, named metabolites were identified in serum samples. Differences in metabolite concentrations between groups were measured and expressed as ratios between group means, and these data are displayed in Supplemental Digital Content 1 (Table 3, http://links.lww.com/CTG/A8). Overall, 71 statistically significant biochemical changes were identified: 31 metabolites were increased in malnourished patients, and 40 were decreased. In addition, 17 biochemicals exhibited trends toward statistical significance between groups (0.05 < P < 0.10). Most metabolites belonged to the lipid superpathway (46.5%; n = 33), followed by amino acid (25.3%; n = 18), carbohydrate (23.9%; n = 17), and xenobiotic pathways.
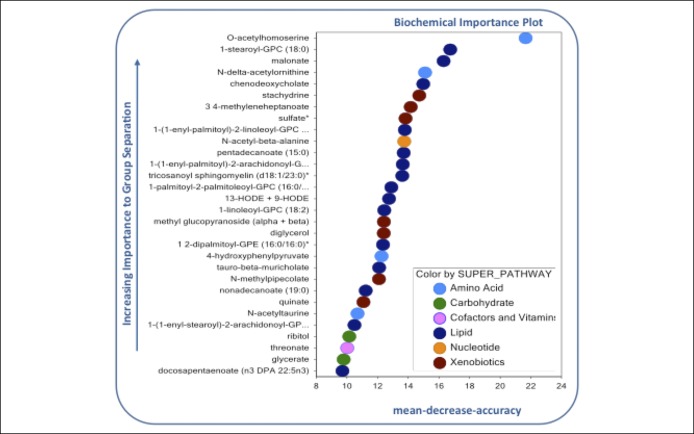
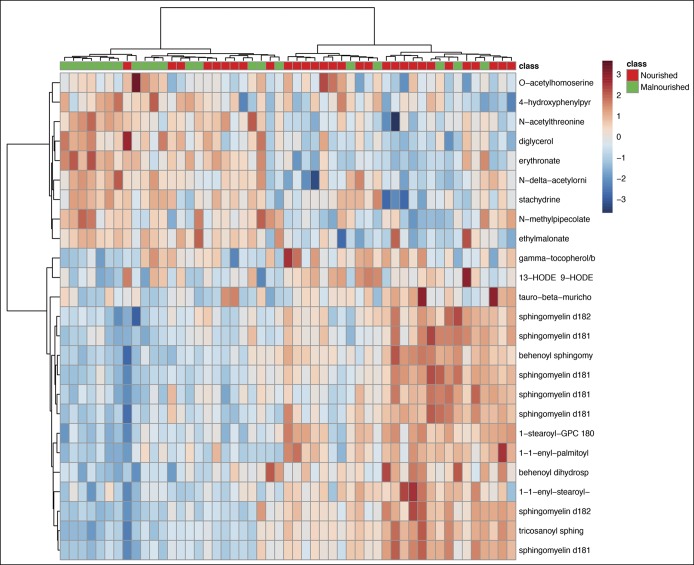
Partial least squares discriminant analysis demonstrated that the first 2 variable components accounted for 18.6% of data variance between groups (Figure 1), and as shown, there was separation of nourished and malnourished patients across the first 2 principal metabolite components. We then used random forest analysis with mean decreased accuracy (MDA) methods to assess the relative contributions of each metabolite for group classification. As summarized in Figure 2, the 30 most important biochemicals clustered primarily within lipid (14.7%; n = 14), xenobiotic (26.7%; n = 8), amino acid (13.3%; n = 4), carbohydrate (10%; n = 3), and amino acid (3.3%; n = 1) superpathways. Ward hierarchical clustering analysis was carried out on these metabolites to demonstrate accurate separation of nourished and malnourished cohorts (Figure 3).
Figure 1.
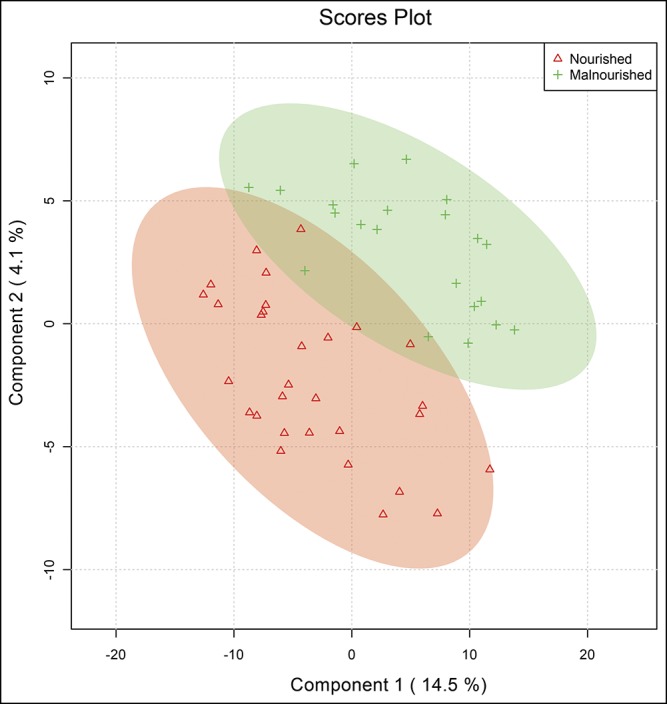
Partial least squares discriminant analysis of metabolomics data reveals clustering of data into separate nourished and malnourished cohorts.
Figure 2.
Random forest analysis of the 30 most important metabolites distinguishing nourished and malnourished patients with cirrhosis.
Figure 3.
Ward hierarchical clustering of metabolites between cohorts. Analysis was performed on the top 25 metabolites as determined by mean decreased accuracy analysis.
Malnourished cirrhotic patients exhibit alterations in sphingolipid metabolism
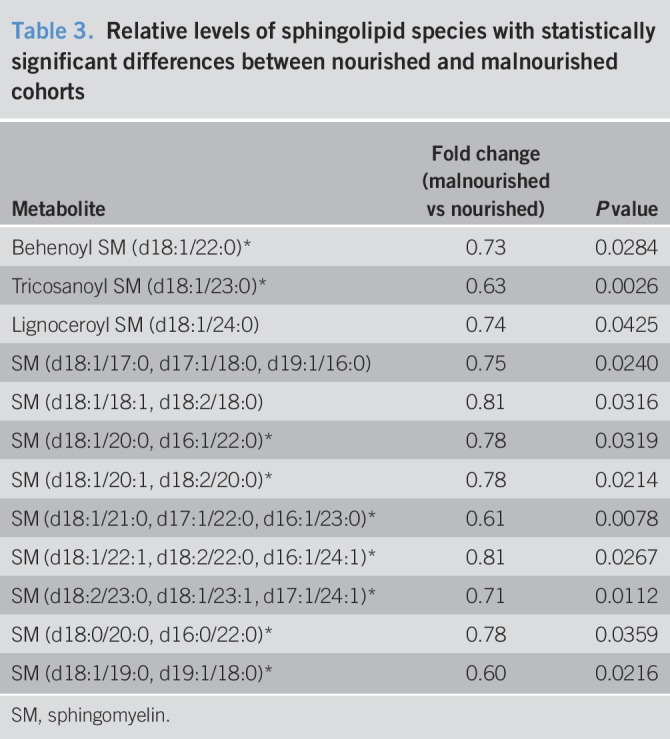
Twenty-three metabolic pathways were represented by at least measured 5 biochemicals, and enrichment analysis demonstrated that only the sphingolipid metabolic pathway was significantly enriched in malnourished cirrhotic subjects (enrichment factor 3.61, P = 3.11 × 10⁻⁵, see Table 4, Supplemental Digital Content, http://links.lww.com/CTG/A9). Circulating levels of 12/35 sphingolipid species were significantly reduced in malnourished cirrhotic subjects, and these clustered primarily among 18:1 and 18:2 sphingomyelins (Table 3).
Table 3.
Relative levels of sphingolipid species with statistically significant differences between nourished and malnourished cohorts
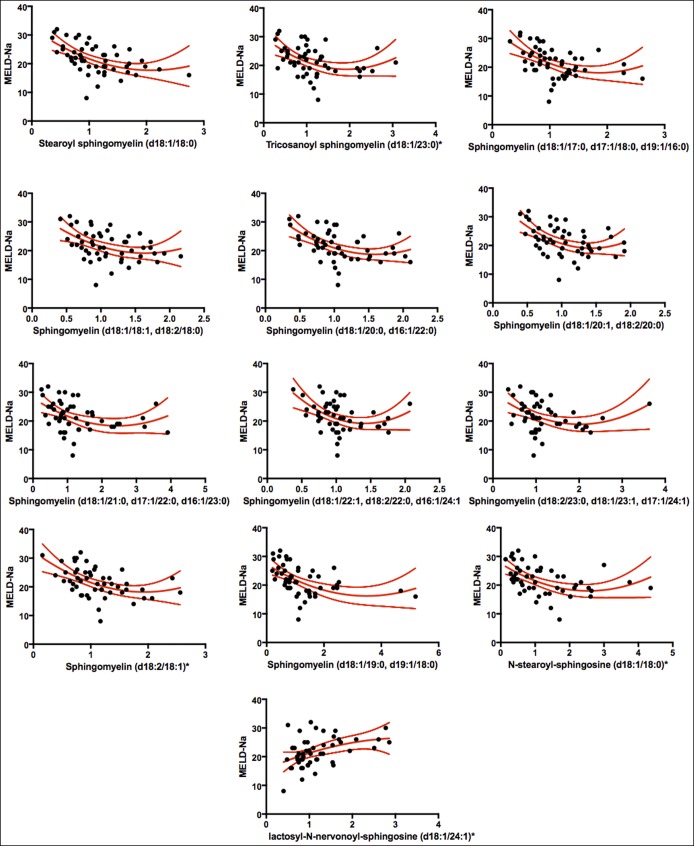
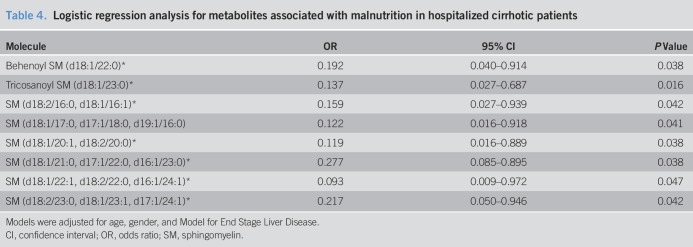
We then asked whether observed changes in circulating sphingolipids were due to the underlying hepatic dysfunction or rather represented a distinct subphenotype of cirrhosis. As Model for End-Stage Liver Disease is the primary clinical marker for assessing liver disease severity, we performed Spearman correlations between MELD-Na and sphingolipids (see Table 5, Supplemental digital Content 2, http://links.lww.com/CTG/A9). There was a high degree of overlap in sphingolipid species significantly related to MELD-Na and nutritional status. Scatterplots and fitted regression curves are depicted in Figure 4. Using multivariate logistic regression models adjusted for MELD-Na, age, and gender, we found that multiple sphingolipid species were associated with malnutrition independent of MELD-Na (Table 4). Together, these findings suggest that low circulating sphingolipids may link malnutrition to hepatic dysfunction in hospitalized cirrhotic patients.
Figure 4.
Scatterplots and fitted regression curves using natural cubic splines for the 13 sphingolipid metabolites exhibiting a significant Spearman correlation with Model for End-Stage Liver Disease score. MELD-Na, Model for End-Stage Liver Disease-Sodium.
Table 4.
Logistic regression analysis for metabolites associated with malnutrition in hospitalized cirrhotic patients
DISCUSSION
In the current study, we demonstrated the utility of serum metabolomics for the identification of malnutrition in patients with decompensated cirrhosis. We uncovered a serum metabolic profile characterized by reduced sphingolipid levels, and this profile accurately discriminated between nourished and malnourished cirrhotic patients. We then showed that metabolic profiles of malnourished cirrhotic patients were independent of liver disease severity, as (i) Model for End-Stage Liver Disease scores did not differ between nourished and malnourished subjects, and (ii) the sphingolipid profile remained statistically significantly associated with malnutrition even after for adjusting for MELD-Na.
Malnutrition remains under-recognized in clinical practice, as there is no consensus regarding the optimal approach to identification in decompensated cirrhosis (12). Anthropometric measurements, including body mass index and waist circumference, are often confounded by the presence of edema and ascites in cirrhotic patients (3). Serum levels of proteins, creatinine, and other catabolic markers are affected by impaired synthetic function in end-stage liver disease (9). More recently, cross-sectional measurement of paraspinal skeletal muscle area using CT has been assessed in cirrhosis (29). In a study of cirrhotic patients awaiting liver transplant, MAMC < 23 cm and hand grip strength <30 kg demonstrated 94% sensitivity and 97% specificity for identification of low body cell mass determined from isotope dilution techniques (20,21). Despite these advances, there is still an important need for development of markers that capture the complex pathogenesis of malnutrition in end-stage liver disease. To this end, we performed an unbiased serum metabolomics analysis to characterize metabolic phenotypes in cirrhosis-related malnutrition, and our findings highlighted derangements of sphingolipid metabolic pathways.
Sphingolipids constitute a class of complex lipids characterized by a polar head group with 2 nonpolar tails containing the long-chain amino alcohol sphingosine. Sphingolipids are major constituents of both the plasma membrane and endoplasmic reticulum in mammalian cells, where they function as scaffolding structures for membrane-bound receptors (30). More recently, multiple sphingolipid species have been identified as signaling molecules that activate G protein-coupled receptors and downstream effectors, and dysregulated sphingolipid metabolism has been implicated in the pathophysiology of both over- and undernutrition (31).
Low circulating sphingolipid levels have been described in other forms of malnutrition. In a metabolomics analysis of Malawian children with varying degrees of malnutrition, 6 of 15 measured sphingolipid species were reduced in subjects with stunting (32), and 2 species exhibited strong correlations with height-for-age Z scores, an important marker of growth in children. Other studies have demonstrated low circulating sphingolipid levels in children with severe acute malnutrition that persist even after adequate nutritional stabilization (33). In chronic liver diseases, circulating sphingolipid fall with progressive fibrosis, and low levels of both long-chain ceramides and sphinogsine-1-phosphate were associated with hepatic decompensation and death in cirrhotic subjects (34–36). In the current study, there was a significant overlap in the sphingolipid species associated with both malnutrition and increased MELD-Na. Therefore, we suspect that low sphingolipid levels may identify malnourished cirrhotic patients at high risk of death who stand to benefit from early nutritional interventions. Further studies are ongoing to test this hypothesis.
Although SMI was slightly lower in malnourished, cirrhotic subjects, VFI was more profoundly reduced. Mechanisms linking low sphingolipid levels to reduced adipose tissue mass and malnutrition, however, remain unclear. One speculation is that sphingolipid depletion disrupts insulinlike growth factor 1 (IGF-1) signaling. Studies in Caenorhabditis elegans have demonstrated that sphingolipid depletion abrogates IGF-1 signaling during starvation-induced cell cycle arrest (37). Furthermore, murine models have highlighted a role for sphingolipids in stabilization of membrane lipid rafts for IGF-1 receptor function in adipose tissue (38,39). Alternatively, low-circulating sphingolipids may reflect a decreased de novo sphingolipid synthesis in adipose tissue, as recent work has shown that adipose-specific ablation of de novo sphingolipid synthesis drives adipose tissue depletion, fibrosis, and white adipose tissue browning with nonshivering thermogenesis in mice (40–42). Together, these findings suggest a role for dysregulated sphingolipid metabolism as a driver of adipose tissue loss and subsequent malnutrition.
A few limitations are noted. First, there are no consensus definitions of malnutrition in cirrhosis. However, we used beside anthropometric measures (MAMC < 23 cm and dominant hand grip strength <30 kg) that exhibited over 90% sensitivity for identification of malnutrition, and the observed incidence of malnutrition (42.3%) is in similar to the rates identified in other studies. Second, food intake was not obtained, and differences in both nutritional status and serum metabolites may be influenced by both total caloric intake and macronutrient composition. Third, subject enrollment was limited to hospitalized patients with decompensated cirrhosis, and previous studies have demonstrated that severe acute illness can rapidly reduce muscle mass (43). However, subjects were enrolled within 72 hours of hospital discharge to allow for recovery from acute illness responsible for hospitalization. Regardless, it would be important to validate the observed findings in other clinical settings. Finally, small sample may contribute to increased risk of type II errors of hypothesis testing; despite this, we identified statistically significant reductions in multiple sphingolipid species from malnourished cirrhotic patients.
In conclusion, low serum sphingolipid levels were associated with malnutrition in hospitalized patients with decompensated cirrhosis. Future investigations are planned to assess the utility of sphingolipid profiles for early identification and monitoring of malnutrition in response to treatment.
CONFLICTS OF INTEREST
Guarantor of the article: Jaideep Behari, MD, PhD.
Specific author contributions: V.R.: study design, data collection, data analysis, drafting of the manuscript; J.A.: data analysis; A.A.B.: data collection and data analysis; R.B.: critical review of the manuscript; A.T.: critical review of the manuscript; J.B.: study design, data collection, data analysis, drafting of the manuscript, and guarantor of the article. All the authors reviewed the manuscript and approved the final draft submitted.
Financial support: Funding for this study was provided through a University of Pittsburgh Startup Fund (to V.R.). The study sponsor did not play any role in the study design, collection, analysis, and interpretation of the data and in the writing of the report.
Potential competing interests: None.
Study Highlights.
WHAT IS KNOWN
✓ Malnutrition is common in patients with cirrhosis.
✓ Malnutrition is associated with poor outcomes.
✓ Biomarkers for malnutrition in cirrhosis are lacking.
WHAT IS NEW HERE
✓ VFI is reduced in malnourished cirrhotic patients.
✓ Serum metabolite profile of malnourished cirrhotic patients is distinct.
✓ Serum sphingolipids are reduced in malnourished cirrhotic patients.
✓ Sphingolipids may potentially serve as biomarkers for cirrhosis-associated malnutrition.
TRANSLATIONAL IMPACT
✓ Test for early recognition of malnutrition in cirrhosis.
✓ Potential biomarker for grading malnutrition severity in cirrhosis.
✓ Potential biomarker of treatment response in cirrhosis-related malnutrition.
Supplementary Material
Footnotes
SUPPLEMENTARY MATERIAL accompanies this paper at http://links.lww.com/CTG/A8 and http://links.lww.com/CTG/A9
REFERENCES
- 1.Nutritional status in cirrhosis: Italian Multicentre Cooperative Project on nutrition in liver cirrhosis. J Hepatol 1994;21:317–25. [PubMed] [Google Scholar]
- 2.Caregaro L, Alberino F, Amodio P, et al. Malnutrition in alcoholic and virus-related cirrhosis. Am J Clin Nutr 1996;63:602–9. [DOI] [PubMed] [Google Scholar]
- 3.O'Brien A, Williams R. Nutrition in end-stage liver disease: Principles and practice. Gastroenterology 2008;134:1729–40. [DOI] [PubMed] [Google Scholar]
- 4.Alberino F, Gatta A, Amodio P, et al. Nutrition and survival in patients with liver cirrhosis. Nutrition 2001;17:445–50. [DOI] [PubMed] [Google Scholar]
- 5.Shiraki M, Nishiguchi S, Saito M, et al. Nutritional status and quality of life in current patients with liver cirrhosis as assessed in 2007-2011. Hepatol Res 2013;43:106–12. [DOI] [PubMed] [Google Scholar]
- 6.Alvares-da-Silva MR, Reverbel da Silveira T. Comparison between handgrip strength, subjective global assessment, and prognostic nutritional index in assessing malnutrition and predicting clinical outcome in cirrhotic outpatients. Nutrition 2005;21:113–7. [DOI] [PubMed] [Google Scholar]
- 7.Holecek M. Ammonia and amino acid profiles in liver cirrhosis: Effects of variables leading to hepatic encephalopathy. Nutrition 2015;31:14–20. [DOI] [PubMed] [Google Scholar]
- 8.Norman K, Kirchner H, Lochs H, et al. Malnutrition affects quality of life in gastroenterology patients. World J Gastroenterol 2006;12:3380–5. [DOI] [PMC free article] [PubMed] [Google Scholar]
- 9.Fuhrman MP, Charney P, Mueller CM. Hepatic proteins and nutrition assessment. J Am Diet Assoc 2004;104:1258–64. [DOI] [PubMed] [Google Scholar]
- 10.Pirlich M, Selberg O, Boker K, et al. The creatinine approach to estimate skeletal muscle mass in patients with cirrhosis. Hepatology 1996;24:1422–7. [DOI] [PubMed] [Google Scholar]
- 11.Fiore P, Merli M, Andreoli A, et al. A comparison of skinfold anthropometry and dual-energy x-ray absorptiometry for the evaluation of body fat in cirrhotic patients. Clin Nutr 1999;18:349–51. [DOI] [PubMed] [Google Scholar]
- 12.Tandon P, Raman M, Mourtzakis M, et al. A practical approach to nutritional screening and assessment in cirrhosis. Hepatology 2017;65:1044–57. [DOI] [PubMed] [Google Scholar]
- 13.Lai JC, Covinsky KE, Dodge JL, et al. Development of a novel frailty index to predict mortality in patients with end-stage liver disease. Hepatology 2017;66:564–74. [DOI] [PMC free article] [PubMed] [Google Scholar]
- 14.Rachakonda V, Gabbert C, Raina A, et al. Serum metabolomic profiling in acute alcoholic hepatitis identifies multiple dysregulated pathways. PLoS One 2014;9:e113860. [DOI] [PMC free article] [PubMed] [Google Scholar]
- 15.Kalhan SC, Guo L, Edmison J, et al. Plasma metabolomic profile in nonalcoholic fatty liver disease. Metabolism 2011;60:404–13. [DOI] [PMC free article] [PubMed] [Google Scholar]
- 16.Kim WR, Biggins SW, Kremers WK, et al. Hyponatremia and mortality among patients on the liver-transplant waiting list. N Engl J Med 2008;359:1018–26. [DOI] [PMC free article] [PubMed] [Google Scholar]
- 17.Pugh RN, Murray-Lyon IM, Dawson JL, et al. Transection of the oesophagus for bleeding oesophageal varices. Br J Surg 1973;60:646–9. [DOI] [PubMed] [Google Scholar]
- 18.Tandon P, Ney M, Irwin I, et al. Severe muscle depletion in patients on the liver transplant wait list: Its prevalence and independent prognostic value. Liver Transpl 2012;18:1209–16. [DOI] [PubMed] [Google Scholar]
- 19.Keys A, Fidanza F, Karvonen MJ, et al. Indices of relative weight and obesity. Int J Epidemiol 2014;43:655–65. [DOI] [PubMed] [Google Scholar]
- 20.Figueiredo FA, Dickson ER, Pasha TM, et al. Utility of standard nutritional parameters in detecting body cell mass depletion in patients with end-stage liver disease. Liver Transpl 2000;6:575–81. [DOI] [PubMed] [Google Scholar]
- 21.Singal AK, Kamath PS, Francisco Ziller N, et al. Nutritional status of patients with alcoholic cirrhosis undergoing liver transplantation: Time trends and impact on survival. Transpl Int 2013;26:788–94. [DOI] [PMC free article] [PubMed] [Google Scholar]
- 22.Montano-Loza AJ, Duarte-Rojo A, Meza-Junco J, et al. Inclusion of sarcopenia within MELD (MELD-sarcopenia) and the prediction of mortality in patients with cirrhosis. Clin Transl Gastroenterol 2015;6:e102. [DOI] [PMC free article] [PubMed] [Google Scholar]
- 23.Montano-Loza AJ, Meza-Junco J, Prado CM, et al. Muscle wasting is associated with mortality in patients with cirrhosis. Clin Gastroenterol Hepatol 2012;10:166–73, 173.e1. [DOI] [PubMed] [Google Scholar]
- 24.Worley B, Powers R. Multivariate analysis in metabolomics. Curr Metabolomics 2013;1:92–107. [DOI] [PMC free article] [PubMed] [Google Scholar]
- 25.Goldstein BA, Hubbard AE, Cutler A, et al. An application of random forests to a genome-wide association dataset: Methodological considerations & new findings. BMC Genet 2010;11:49. [DOI] [PMC free article] [PubMed] [Google Scholar]
- 26.Beckonert O, Keun HC, Ebbels TM, et al. Metabolic profiling, metabolomic and metabonomic procedures for NMR spectroscopy of urine, plasma, serum and tissue extracts. Nat Protoc 2007;2:2692–703. [DOI] [PubMed] [Google Scholar]
- 27.Xia J, Wishart DS. Using metaboanalyst 3.0 for comprehensive metabolomics data analysis. Curr Protoc Bioinformatics 2016;55:14.10.1–91. [DOI] [PubMed] [Google Scholar]
- 28.Tapper EB, Finkelstein D, Mittleman MA, et al. Standard assessments of frailty are validated predictors of mortality in hospitalized patients with cirrhosis. Hepatology 2015;62:584–90. [DOI] [PMC free article] [PubMed] [Google Scholar]
- 29.Carey EJ, Lai JC, Wang CW, et al. A multicenter study to define sarcopenia in patients with end-stage liver disease. Liver Transplant 2017;23:625–33. [DOI] [PMC free article] [PubMed] [Google Scholar]
- 30.Kolter T. A view on sphingolipids and disease. Chem Phys Lipids 2011;164:590–606. [DOI] [PubMed] [Google Scholar]
- 31.Merrill AH., Jr Sphingolipid and glycosphingolipid metabolic pathways in the era of sphingolipidomics. Chem Rev 2011;111:6387–422. [DOI] [PMC free article] [PubMed] [Google Scholar]
- 32.Semba RD, Shardell M, Sakr Ashour FA, et al. Child stunting is associated with low circulating essential amino acids. EBioMedicine 2016;6:246–52. [DOI] [PMC free article] [PubMed] [Google Scholar]
- 33.Di Giovanni V, Bourdon C, Wang DX, et al. Metabolomic changes in serum of children with different clinical diagnoses of malnutrition. J Nutr 2016;146:2436–44. [DOI] [PMC free article] [PubMed] [Google Scholar]
- 34.Becker S, Kinny-Köster B, Bartels M, et al. Low sphingosine-1-phosphate plasma levels are predictive for increased mortality in patients with liver cirrhosis. PLoS One 2017;12:e0174424. [DOI] [PMC free article] [PubMed] [Google Scholar]
- 35.Grammatikos G, Ferreiros N, Waidmann O, et al. Serum sphingolipid variations associate with hepatic decompensation and survival in patients with cirrhosis. PLoS One 2015;10:e0138130. [DOI] [PMC free article] [PubMed] [Google Scholar]
- 36.Krautbauer S, Wiest R, Liebisch G, et al. Associations of systemic sphingolipids with measures of hepatic function in liver cirrhosis are related to cholesterol. Prostaglandins Other Lipid Mediat 2017;131:25–32. [DOI] [PubMed] [Google Scholar]
- 37.Cui M, Wang Y, Cavaleri J, et al. Starvation-induced stress response is critically impacted by ceramide levels in Caenorhabditis elegans. Genetics 2017;205:775–85. [DOI] [PMC free article] [PubMed] [Google Scholar]
- 38.Hong S, Huo H, Xu J, et al. Insulin-like growth factor-1 receptor signaling in 3T3-L1 adipocyte differentiation requires lipid rafts but not caveolae. Cell Death Differ 2004;11:714–23. [DOI] [PubMed] [Google Scholar]
- 39.Huo H, Guo X, Hong S, et al. Lipid rafts/caveolae are essential for insulin-like growth factor-1 receptor signaling during 3T3-L1 preadipocyte differentiation induction. J Biol Chem 2003;278:11561–9. [DOI] [PubMed] [Google Scholar]
- 40.Alexaki A, Clarke BA, Gavrilova O, et al. De novo sphingolipid biosynthesis is required for adipocyte survival and metabolic homeostasis. J Biol Chem 2017;292:3929–39. [DOI] [PMC free article] [PubMed] [Google Scholar]
- 41.Chaurasia B, Kaddai VA, Lancaster GI, et al. Adipocyte ceramides regulate subcutaneous adipose browning, inflammation, and metabolism. Cell Metab 2016;24:820–34. [DOI] [PubMed] [Google Scholar]
- 42.Lee SY, Lee HY, Song JH, et al. Adipocyte-specific deficiency of de novo sphingolipid biosynthesis leads to lipodystrophy and insulin resistance. Diabetes 2017;66:2596–609. [DOI] [PMC free article] [PubMed] [Google Scholar]
- 43.Puthucheary ZA, Rawal J, McPhail M, et al. Acute skeletal muscle wasting in critical illness. JAMA 2013;310:1591–600. [DOI] [PubMed] [Google Scholar]
Associated Data
This section collects any data citations, data availability statements, or supplementary materials included in this article.


