

Abstract
Purpose:
Cancer cells often have deficiencies in cell cycle control mechanisms and could be dependent on specific cell cycle checkpoints to maintain viability. Due to the documented role of KRAS in driving replication stress, we targeted the checkpoint governing DNA replication using CHK1 kinase inhibitors in pancreatic ductal adenocarcinoma (PDAC) models and examined mechanisms of resistance.
Experimental Design:
Single agent efficacy of CHK1 inhibition was investigated in established and primary PDAC lines. Drug screening was performed to identify cooperative agents. In vitro and in vivo studies were employed to interrogate combination treatment efficacy and mechanisms of resistance.
Results:
Many PDAC models evade single agent inhibition through mechanisms that allow S-phase progression with CHK1 inhibited. Gene expression analysis revealed FOXM1 as a potential marker of CHK1 sensitivity and defined a form of pancreatic cancer with poor prognosis. Drug screen analysis identified WEE1 as a cooperative agent with CHK1 and was effective in cell culture. In vivo experiments validated the combination efficacy; however, resistance could evolve. Resistance was due to selection of a stable sub-clone from the original PDX tumor, which harbored high baseline replication stress. In vitro analysis revealed that gemcitabine could eliminate viability in the resistant models. The triplet regimen of gemcitabine, CHK1 and WEE1 inhibition provided strong disease control in all xenograft models interrogated.
Conclusions:
These results demonstrate the therapeutic resiliency of pancreatic cancer and indicate that coordinately targeting cell cycle checkpoints in concert with chemotherapy could be particularly efficacious.
Keywords: cell cycle, CHK1, WEE1, replication stress, drug resistance
INTRODUCTION
Pancreatic ductal adenocarcinoma (PDAC) is one of the most lethal types of cancer, with an overall 5- year survival rate of approximately 10% (1–3). Although there has been substantial effort in determining an effective therapy for PDAC, most targeted regimens have not demonstrated clinical disease control beyond combination chemotherapy (4). While FOLFIRINOX (oxaliplatin, irinotecan, leucovorin, and 5-FU) and gemcitabine with nab-paclitaxel have increased survival, improvements have been relatively modest and the vast majority of patients succumb to the disease (5,6). Thus, there is an urgent need for effective new therapies for the treatment of PDAC that consider the intrinsic therapeutic resistance.
Cancer cells harbor a wide spectrum of mutations that drive the cancer phenotype and support uncontrolled proliferation. In pancreatic cancer activating KRAS mutations are considered the key event in disease etiology and are observed in >90% of cases (7–9). KRAS mutations drive deregulated proliferation and activate survival signals, but can also elicit replication stress, induction of reactive oxygen species, and promote oncogene-induced senescence (10–13). KRAS induced replication stress is balanced by other aberrations that facilitate disease progression in pancreatic cancer, including loss of CDKN2A or mutation of TP53 (8,9,14,15).
Cell cycle checkpoint mechanisms play a key role in the tolerance of replication and mitotic dysregulation. Conventionally, cell cycle checkpoints coordinate the pausing of DNA replication or mitosis with activating DNA repair processes to facilitate recovery and viability in the face of replication stress or under-replicated DNA (16–18). These highly conserved pathways, while discovered in yeast, are highly germane to cancer and are believed to enable the viability of cancer cells in the face of deregulated cellular proliferation (19). The CHK1 kinase plays a critical role in recovery from DNA replication stress by functioning downstream from ATR to coordinate inhibition of DNA replication and repair of strand breaks (20–22). In part, the inhibition of DNA replication is mediated by the suppression of CDK2 activity (23,24). Another important negative regulator of CDK activity is WEE1 (25–27). While identified as a key regulator of mitotic progression via the control of CDK1 activity, emerging data in yeast and mammalian cells indicates that WEE1 also acts in S-phase to modulate DNA replication checkpoints (27,28). As such, there is growing literature that the combination of CHK1 and WEE1 could represent an important treatment modality (29–31)
Since cell cycle dysregulation is a hallmark function of cancer (32), and KRAS is strongly linked to oncogene induced replication stress (33) we interrogated the action of cell cycle checkpoint inhibitors as therapeutic agents for pancreatic cancer in a wide panel of established and low passage patient derived models. The findings illustrate the challenge of treating pancreatic cancer and the importance of rationally designed combination therapy that minimize the selection of resistance.
MATERIALS AND METHODS
Cell Culture and Chemicals
Established cell lines (PL45, PANC1, MiaPaca2, YAPC, BXPC3, CAPAN2) were purchased from ATCC and cultured in recommended media. Primary cell lines (EMC828, EMC7310, EMC3226, EMC226) were grown in keratinocyte serum-free (KSF) medium with 0.2ng/mL EFG, 30 μg/mL bovine pituitary extract (Life Technologies, 10744019), and 2% fetal bovine serum on collagen coated (Millipore 08-115) plates. Cells were grown at 37°C with 5% CO2. The 4662 syngeneic model was provided by Dr. Robert Vonderheide’s laboratory and cultured as previously described (34). Drugs used in this study were purchased from Selleck Chemicals and DMSO was used as control.
| Name | Target |
|---|---|
| CHIR-124 | CHK1 |
| AZD7762 | CHK1 |
| Prexasertib | CHK1 |
| MK1775 | WEE1 |
| Gemcitabine | Ribonucleotide Reductase DNA replication machinery |
| PD0332991 | CDK4/6 |
FUCCI (fluorescent, ubiquitination-based cell cycle indicator) Transfection
ES-FUCCI, a gift from Pierre Neveu (Addgene plasmid #62451), was transfected to EMC226 cell line using Lipofectamine 3000 Reagent (Invitrogen LSL3000001) by manufacturer’s protocol. Transfected cells were selected using Hygromycin and sorted with FACSAria.
Proliferation/Viability Assays
Cells were seeded in 96 well, 12 well, or 6 well plates, and treated with drugs as indicated for 72 hours. Viability was assessed using CellTiter-Glo Reagent (Promega), and luminescence was read on a Biotek Synergy 2 plate reader. Crystal violet staining was performed after 72 hours on 6 well and 12 well plates. IncuCyte S3 Live-Cell Analysis System (Essen Biosciences) was utilized for live cell analysis. Primary PDAC cells were labeled with H2B-GFP and seeded in 96-well collagen-coated plates. Cells were treated with DMSO, CHIR-124, and AZD7762 for 72 hours. Two phase and fluorescent images per well were captured hourly for 72 hours at 10X magnification. Essen Bioscience software was used to quantify number of cells per well and normalized to DMSO treated cell proliferation. Data was exported to Prism 7 (GraphPad) for statistical analyses. Each drug treatment was performed in quadruplicate and verified in three independent experiments.
Gene Expression Analysis
Mutations and copy number variations were assessed from whole exome sequencing for the primary cell lines as previously described (35). Mutation data was collected for the established cell lines from the Cancer Cell Line Encyclopedia (CCLE). Note that PL45 did not have mutation data listed, thus KRAS and other gene variant status was unable to be determined. Cell lines were ordered based on CHK1 sensitivity data. Gene expression for the primary cell lines was determined by RNA sequencing (35), which was log2 transformed and normalized using the edgeR R package (36,37). Gene expression for the established cell lines was obtained from the cancer cell line encyclopedia. Z-scores were calculated for the primary and established cell lines separately, then combined into a single data matrix. A correlation heat map was generated for genes with correlation coefficients between the z-score expression and sensitivity (AUC values) greater than +/−0.5 for either treatment. Genes in the FOXM1 gene signature were selected by using the correlation coefficient between cell line gene expression and sensitivity greater than +/−0.4 for both the AZD7762 and CHIR-124 treatments, as well as a correlation coefficient greater than 0.4 between the Cancer Genome Atlas (TCGA) PDAC gene expression and TCGA FOXM1 expression. Hierarchical clustering using Manhattan distance was performed with z-score centered gene expression and low, intermediate and high FOXM1 signature expression groups were defined based on the resulting clustering. The Kaplan-Meier plot was generated, comparing each of the defined groups and a log rank p-value was calculated. All clustering and survival analysis was performed in R.
Synergy Maps
Synergy scores using the Bliss independence model were calculated using the SynergyFinder web application.
Spectral karyotyping (SKY)
Parental and resistant EMC226 cell lines were cultured and provided to Roswell Park Pathology Network Services for Spectral Karyotyping (SKY) analysis. Fragile site analysis was performed for chromosome number and abnormalities.
siRNA
Cells were reverse transfected with Dharmacon Human ON-TARGETplus siRNA: CHEK1 (L-003255-00-0005), WEE1 (L-005050-00-0005), FOXM1 (L-009762-00-0005), UBB (L-013382-00-0055) and non-targeting siRNA (D-001810-10-05). Transfection was done using Lipofectamine RNAiMax Transfection Reagent (Invitrogen, 13778150) according to manufacturer’s protocol. Cells were then analyzed for viability using CellTiterGlo. Immunoblot analysis was performed to confirm knock down.
Flow Cytometry Cell Cycle analysis
For BrdU analysis, cells were treated with CHIR-124 for 48 hours. Prior to harvesting, cells were pulsed with 5-Bromo-2-DeoxyUridine, (BrdU, Sigma) for 1 hour. Cells were trypsinized after BrdU pulse and fixed in 70% EtOH overnight in 4°C. Cell pellets were washed with IFA buffer (1× HEPES, 4% FBS and 0.1% NaN3) and then with IFA + 0.5% Tween20. Pellets were incubated in FITC-conjugated anti-BrdU (BD Pharmingen) or FITC anti-H2AX (phospho-Ser139) for 1 hour at room temperature. Cells were resuspended in propidium iodide and RNAse before analysis in FASCanto II flow cytometer. Cell cycle analysis was performed with propidium iodide staining after indicated time of treatment. For yH2AX analysis, cells were treated for 48 hours and trypsinized. Cell pellets were fixed and permeabilized using fixation and permeabilization solution. Cells were then stained with Anti-phospho H2A.X FITC conjugate and propidium iodide before analysis in flow cytometer. Analysis was done with FlowJo software. Annexin V staining was performed using Annexin V-FITC Apoptosis Detection Kit (Sigma) after 48 hours of treatment. Analysis was done with FlowJo software.
Western blot analysis
Cells were seeded in 60mm plates and treated the next day with drug. After 48 hours, cells were collected and lysed with RIPA buffer (50mM Tris, 150mM NaCl, 1% Triton X-100, 1% sodium deoxycholate, 0.1% SDS, sodium orthovanadate, sodium fluoride, EDTA, and leupeptin). Protein concentration was determined by Bradford Protein Assay dye (Bio-Rad) and 30ug of protein per sample was resolved by SDS-PAGE. Gel was transferred to Immobilon-P membrane (Millipore). Blots were blocked with 5% milk for 1 hour at room temperature and incubated with primary antibody overnight at 4°C. Incubation in secondary antibody was at room temperature for one hour. Antibodies for specific antibodies detected were: from Cell Signaling-PARP, CHK1, LC3B and CyclinB1, CDK2. Antibodies from Santa Cruz were: GAPDH, B-Actin, CDK1, pCDK1 (Tyr15), Cyclin A, WEE1, and FOXM1. Abcam antibodies used were RPA32 (pT21) and RPA32.
Immunofluorescence:
Cells were seeded on glass coverslips and treated with drug (AZD7762, CHIR-124, MK1775) for 48 hours. Cells were washed in PBS and fixed in 4% paraformaldehyde. Then they were permeabilized in 0.5% Triton X-100. For PCNA staining, cells were pre-extracted with CSK buffer (10mM HEPES, 300mM Sucrose, 100mM NaCl, and 3mM MgCl2) and extraction buffer (50mM NaF, 0.1mM NaOrthovanadate, 1mM PMSF, 0.5% Triton X-100, protease inhibitor). After permeabilization, cells were blocked in IF buffer (5% BSA, 0.4% NP40 in PBS) and incubated with primary antibody diluted in IF buffer for one hour in 37°C. Primary antibodies used in this study were: yH2AX (phospho-ser139) from Cell Signaling, MCM7 (sc-9966) from Santa Cruz, Anti-phospho-Histone H3 (ser10) (06-570) from Millipore, and RPA32 (pT21) from Abcam. Coverslips were washed in PBS and secondary antibody diluted in IF buffer was applied for one hour in 37°C. Coverslips were washed again after secondary and mounted on slides. Images were taken with either Leica Confocal Microscope at 63× magnification or fluorescence microscope at 40×. Quantification was performed using ImageJ.
In vivo xenograft studies
All animal studies were approved by Roswell Park Cancer Institute IACUC. NSG mice were subcutaneously implanted with early passage PDX tumor fragments. Mice were randomized to control, AZD7762, MK1775, and combination (AZD and MK) groups when tumor volumes reached 150-200mm3. In the control group, mice were administered with vehicle. AZD7762 group was administered AZD7762 (35mg/kg) via intraperitoneal (IP) injection. Combination group was treated with MK1775 (30mg/kg, gastric gavage) and AZD7762 (35mg/kg, IP). AZD7762 was prepared in 11.3% 2-hydroxyproply-β-cyclodextrin (Sigma, St Louis, MO) and sterile saline. MK1775 was dissolved in 0.5% methylcellulose. Tumor size was measured every other day, and volume was calculated per the following equation: V = 0.5 × ([greatest diameter] × [shortest diameter]2). For single and combination treatment, mice were randomized to control, AZD7762, MK1775, and combination of AZD7762 and MK1775 (AZD + MK). For regiments with gemcitabine, mice were randomized to control, gemcitabine, combination of gemcitabine and AZD7762 (Gem + AZD) or gemcitabine and MK1775 (Gem + MK), and triple therapy of gemcitabine, MK1775, and AZD7762 (Gem + AZD + MK). Gemcitabine was prepared with sterile saline. Treatment lasted for 21 days, and tumors were harvested at end of treatment, or when tumor volumes reached 2000mm3. For orthotopic studies, 5 × 10⁵ EMC226 or 4662 cells were injected into the pancreas of NSG and C57BL/6J mice, respectively. Mice were scanned with MRI for baseline volume at the imaging core facility at Roswell Park Comprehensive Cancer Center.
Mice were then randomized to control or triple therapy (gemcitabine, MK1775, and AZD7762) treatment groups. Upon completion of treatment tumors and major body organs (liver, lung, small intestine, and kidney) were harvested and processed for histologic evaluation. Immunohistochemistry for Ki67 was performed using Ki67 antibody (Thermo Scientific; catalog# RM-9106-S1, 1/200 dilution) on DAKO Omnis autostainer. For the evaluation of drug toxicity, organs were formalin-fixed and paraffin-embedded. Tissue sections were stained with hematoxylin and eosin (H&E). In each organ cell damage (e.g. cell ballooning, apoptosis, necrosis) and degree of inflammation were evaluated.
RESULTS
PDAC cells exhibit a range of response to CHK1 inhibition
Targeting DNA replication checkpoints has emerged as a therapeutic approach that could have broad application to tumors that are proliferating under substantial oncogene induced replication stress (38,39). To investigate the effect of single agent CHK1 inhibition, we subjected established PDAC cell lines (PL45, PANC1, MiaPaca2, BXPC3, YAPC, and CAPAN2) and primary PDAC cell lines (EMC3226, EMC226, EMC7310, EMC810, EMC828, EMC519), to two CHK1 inhibitors, CHIR-124 and AZD7762. Established cell lines were also treated with additional CHK1 inhibitor, prexasertib (LY2606368). We observed that both established and primary cell lines had variable sensitivities (Figure 1 and S1). In the established lines, PL45 and MiaPaca2 were more sensitive, whereas PANC1 and YAPC lines were more resistant (Figure 1A and B). To ensure that the sensitivity was not due to off target effects, we utilized CHK1 siRNA and confirmed PL45 sensitivity and PANC1 resistance to CHK1 inhibition (Figure 1C). Primary cell lines were also grouped into sensitive and resistant categories (Figure 1D). To monitor effect on overall cell growth, primary cell lines were transfected with H2B-GFP and treated with CHIR-124 and AZD7762 for live cell analysis (Figure 1E). As expected, growth was inhibited in the sensitive lines EMC226 and EMC3226, whereas the resistant lines EMC828 and EMC7310 growth rates did not change with treatment. Thus, there is a diversity of response to CHK1 inhibition and understanding the basis of resistance could yield rational combination therapies.
Figure 1: PDAC cells have variable sensitivity to CHK1 inhibition.
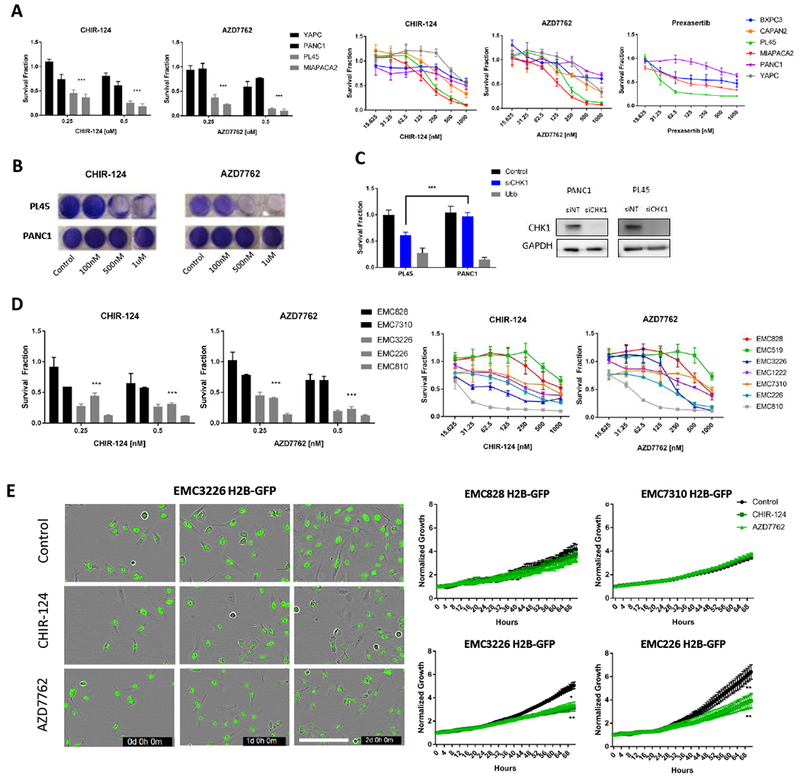
A. The indicated cell lines in the left panel were treated with increasing concentration of CHK inhibitors CHIR-124 and AZD7762. CellTiterGlo (CTG) was used to quantify viability following 72 hours of treatment. Aggregate analysis of resistant lines (YAPC, PANC1) compared to sensitive lines (PL45, MiaPaca2) shows statistical significance (*** p-value <0.001 t test). Right panel shows established PDAC lines (BXPC3, CAPAN2, PL45, MiaPaca2, PANC1, YAPC) treated with CHK1 inhibitors CHIR-124 and AZD7762 at increasing doses for 72 hours. A subset of the established lines was also treated with CHK1 inhibitor prexasertib to further validate response. Viability was determined with CTG. The mean and standard deviation are shown. B. Crystal violet staining of sensitive (PL45) and resistant (PANC1) PDAC lines in response to CHK1 inhibition (representative images are shown). C. The indicated cell lines were subjected to depletion of CHK1 by RNAi, (control and Ubb represent negative and positive controls respectively). At 72 hours post-transfection viability was determined by CTG analysis. The PL45 model is significantly more sensitive to CHK1 depletion (*** p-value <0.001 t test). Western blot analysis confirms CHK1 knock down in the transfected cells. D. The indicated primary cell lines were treated with increasing concentration of CHK inhibitors CHIR-124 and AZD7762. CellTiterGlo (CTG) was used to quantify viability following 72 hours of treatment. Aggregate analysis of resistant lines (EMC828, EMC7310) compared to sensitive lines (EMC3226, EMC226, EMC810) display statistical significance (*** p- value <0.001 t test). Right panel shows primary PDAC lines (EMC828, 519, 3226, 1222, 7310, 226, 810) were treated with CHK1 inhibitors CHIR-124 and AZD7762 at increasing doses for 72 hours. CTG was used to quantify viability after treatment. The mean and standard deviation are shown. E. The indicated cell lines were treated with CHK inhibitors CHIR-124 and AZD7762 and IncuCyte live cell analysis of H2B-GFP labeled cells was performed. Representative images of three time points (t=0d, 1d, 2d) for EMC3226 H2B-GFP cells treated for 72 hours (Scale bar 200µm). Relative H2B-GFP positive cells was determined over 72 hours of monitoring (* p-value <0.05, ** p-value <0.01 t test).
CHK1 inhibition induces replication stress in sensitive lines
To understand the potential mechanism of resistance, we first examined the level of DNA damage upon CHK1 inhibition. Flow cytometry analysis of yH2AX, an indicator of DNA damage, was utilized to investigate differences between sensitive lines (PL45, EMC226) and resistant lines (PANC1, YAPC). We observed that there was greater induction of yH2AX in the sensitive lines compared to resistant (Figure 2A). Immunofluorescence analysis also confirmed flow cytometry findings, where sensitive lines had a greater percentage of yH2AX positive cells than resistant line PANC1 (Figure 2B). Further, annexin V staining indicated that the sensitive lines (PL45 and MiaPaca2) had greater percentage of apoptotic cells upon CHK1 inhibition than resistant (PANC1 and YAPC) lines (Figure 2C). Although aberrations in nuclear morphology were observed in cells that were treated with CHK1 inhibitors, this event surprisingly did not correlate with cytotoxic response (Figure 2D). To determine if the levels of DNA damage were related to the proliferation of the cell lines, EdU incorporation levels were measured before and after treatment (Figure 2E and S2). Baseline levels of EdU incorporation were not associated with sensitivity; and in all cell lines there was a similar inhibition of overall incorporation. Flow cytometry was used to specifically examine cell cycle stages and DNA synthesis concordantly. Consistent with the EdU incorporation, the overall BrdU incorporation levels between sensitive and resistant lines did not differ. However, the amount of S-phase cells (DNA-content between 2N and 4N) compromised for BrdU incorporation was associated with sensitivity (Figure 2F). To further explore the DNA replication defect, we performed a time course treatment and probed for a marker of single strand breaks, phosphorylated RPA (pRPA). Sensitive cell lines had induction of pRPA at earlier time points and at greater levels than resistant lines (Figure 2G and S2). Immunofluorescence analysis also revealed greater magnitude of pRPA levels in sensitive lines compared to resistant line (Figure 2H and S2). Together, the data suggest that sensitive lines are more susceptible to replication stress and DNA damage upon CHK1 inhibition, whereas the resistant cell models essentially do not require CHK1 to pass through S-phase.
Figure 2: CHK1 inhibition induces replication stress at greater magnitude in sensitive cell lines.
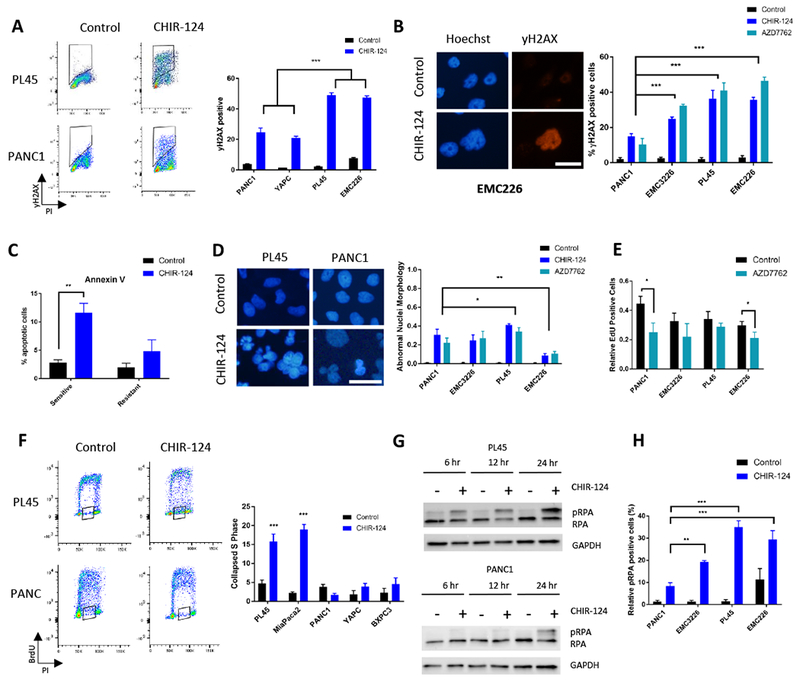
A. PL45, EMC226, YAPC, and PANC1 were treated with CHIR-124 (IC50: 125nM for PL45, 250nM for EMC226, and 1μM for YAPC and PANC1) treatment for 48 hours and flow cytometric analysis of yH2AX and propidium iodide (PI) was performed (y-axis is yH2AX, and x-axis is PI). Quantification was performed, and the mean and standard deviation are shown. Aggregate comparison of sensitive (PL45 and EMC226) and resistant (PANC1 and YAPC) shows significant difference between the yH2AX levels (*** p-value <0.001 t test). B. Immunofluorescence staining of yH2AX on cell lines (PANC1, EMC3226, PL45, and EMC226) treated with CHIR-124 and AZD7762 (PANC1 treated with 1μM; EMC3226 and EMC226 treated with 250nM; PL45 treated with 125nM) was performed. Representative images are shown (scale bar is 25 μm). Quantitation of the yH2AX-positive cells was determined and the mean and standard deviation are shown (*** p- value <0.001 t test). C. Annexin V staining of sensitive (PL45 and MiaPaca2) and resistant (PANC1 and YAPC) lines was conducted after 48 hours of treatment with CHIR-124 at 125nM and 1uM doses, respectively. The induction of apoptosis is significantly greater in sensitive lines than resistant (** p-value <0.01 t test). D. Established (PL45, PANC1) and primary (EMC3226, EMC226) lines were treated CHIR-124 and AZD7762 (PANC1 with 1μM; PL45 with 125nM; EMC3226 and EMC226 with 250nM) for 48 hours and stained with DAPI. Representative images of cells treated with CHIR-124 are shown (scale bar is 25 μm). Quantitation of aberrant nuclear morphology with the mean and standard deviation are shown (* p-value <0.05, ** p-value <0.01 t test). E. The percent EdU-positive cells was determined from in indicated cell lines treated with AZD7762 for 48 hours (PANC1 with 1μM; PL45 with 125nM; EMC3226 and EMC226 with 250nM). The mean and standard deviation are shown (* p-value <0.05 t test). F. The indicated cells were treated with CHIR-124 (PL45 and MiaPaca2 with 125nM; PANC1, YAPC, and BXPC3 with 1 μM) and flow cytometry analysis for BrdU and PI co-staining was performed (y-axis is BrdU, and x-axis is PI). The collapsed S phase (shown in box outline) was quantified across resistant lines (PANC1, YAPC, BXPC3) and sensitive (PL45 and MiaPaca2) cell lines (*** p-value <0.001 t test). G. Immunoblot analysis of PL45 and PANC1 in time course was done over 24 hours of CHIR-124 treatment at IC50s (125nM and 1μM, for PL45 and PANC1 respectively). Phosphorylated RPA (pRPA) levels increase at earlier time points in sensitive line PL45 than in resistant line PANC1. H. The indicated cell lines were treated with CHIR-124 (PANC1 with 1μM; PL45 with 125nM; EMC3226 and EMC226 with 250nM) for 48 hours, and the percent of cells scoring pRPA-positive was determined by immunofluorescence staining. Graph shows the mean and standard deviation (** p-value <0.01, *** p-value <0.001 t test).
FOXM1 is a potential marker of sensitivity
To determine if the common mutations present in PDAC are associated with sensitivity to CHK1 inhibition we evaluated the genetics of the cell lines used in the study (Figure 3A). These data showed no significant relationship between KRAS, SMAD4, TP53 or CDKN2A genetic alterations and susceptibility to CHK1 inhibitor. Correlation analysis of gene expression data from the cell lines was used to investigate gene expression levels associated with response. Using AUC values of CHIR-124 and AZD7762, we first confirmed that there was a strong correlation between genes associated with the response to either drug indicating that the sensitivities were not unique to a particularly drug, but encompassed the class of CHK1 inhibitors (Figure 3B). We found that multiple genes related to cell cycle and DNA damage repair were correlated with sensitivity (Figure 3B, S2 and supplemental data 1). One of these genes, FOXM1, is a known transcriptional driver for the expression of many of the genes associated with response (40). To determine the functional role of FOXM1 in sensitivity, FOXM1 was knocked down in PL45 and MiaPaca2 lines before treatment with CHK1 inhibitors CHIR-124 and prexasertib. FOXM1 knockdown significantly rescued sensitivity to CHK1 inhibitors (Figure 3C and S3). We also employed CDK4/6 inhibitor, palbociclib (PD) since it has been reported that CDK4/6 regulates the stability of FOXM1 (41). As expected, palbociclib treatment reduced levels of FOXM1 and pre-treatment with palbociclib, before CHIR-124 and AZD7762 were added, reduced pRPA levels (Figure 3D) and increased survival (Figure 3E). We also interrogated FOXM1 expression levels in The Cancer Genome Atlas (TCGA) data and found that high expression of FOXM1 signature corresponded with poor overall survival (Figure 3F). These data suggest that there is a proportion of PDAC cases with poor prognosis that could be particularly responsive to CHK1 inhibitors.
Figure 3: Gene expression analysis reveals FOXM1 as potential marker of sensitivity.
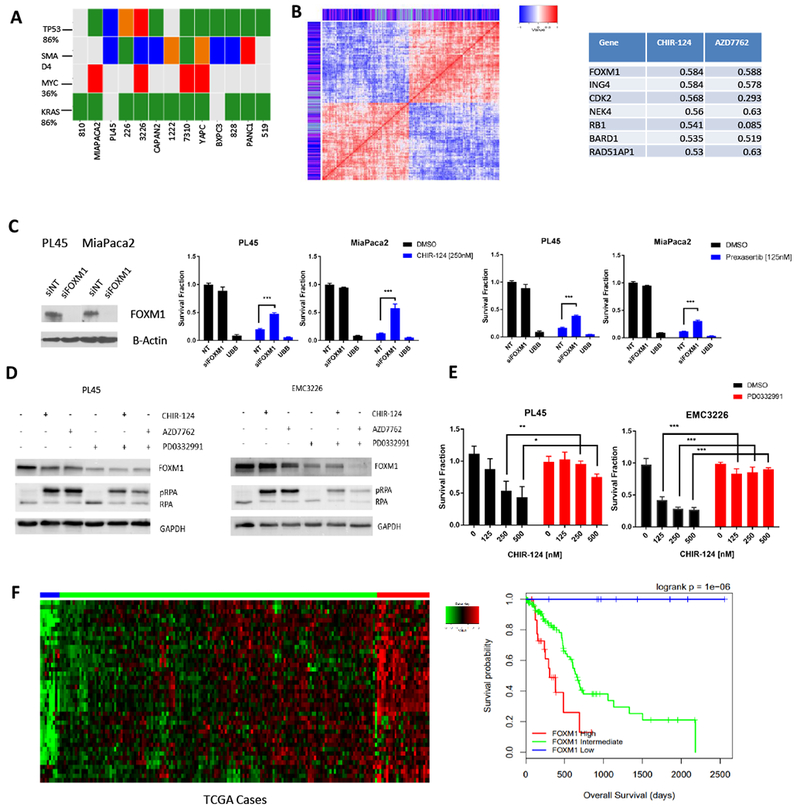
A. Genetic features of primary and established PDAC lines (somatic single nucleotide variant: green, homozygous deletion: blue, small insertion/deletion: orange, amplification: red) vs sensitivity to CHK1 inhibition. B. Analysis of genes which are positively and negatively correlated with sensitivity (for one or both drug treatments of CHIR-124 or AZD7762) display high levels of correlation amongst themselves. Color bar shows which drug sensitivity the gene expression is correlated with (purple = both, blue = CHIR-124, light blue = AZD7762). Table shows correlation coefficient values of genes related to cell cycle and DNA damage repair, one of which is FOXM1. Full list of genes is provided in supplemental data 1. C. siRNA knockdown of FOXM1 in PL45 and MiaPaca2 cells was confirmed with immunoblot analysis. Treatment with CHIR-124 after transfection rescued sensitivity to CHK1 inhibition (*** p-value <0.001 t test). D. Immunoblot analysis of PL45 and EMC3226 lines were pre-treated with CDK4/6 inhibitor palbociclib (1μM for 24 hours) and then exposed to CHIR-124 and AZD7762 for 48 hours (PL45 was treated with 125nM and EMC3226 was treated with 250nM). E. PL45 and EMC3226 cells were pre-treated with CDK4/6 inhibitor palbociclib for 24 hours (1μM) and then exposed to CHIR-124 at increasing doses for 72 hours. Cell viability was determined by CTG analysis with the mean and standard deviation shown (* p-value <0.05, ** p-value <0.01, *** p-value <0.001 t test). F. The FOXM1 gene expression signature in the pancreatic TCGA data is shown in the heat map. Expression was grouped in low, intermediate, and high levels based on clustering of the clinical cases in the heat map. The low expression of the FOXM1 signature was found to have improved survival rates in TCGA data.
Drug screen reveals cooperation between WEE1 and CHK1 inhibition
Since only a subset of pancreatic cancer cells is sensitive to CHK1 inhibition at reasonably low-doses that are clinically achievable, there is the need for combination with other agents to enhance efficacy. To define agents that cooperate with CHK1 inhibitors we pre-treated H2B-GFP labeled cell lines with DMSO or CHIR-124 for 24 hours and performed a drug screen with over 300 agents (supplemental data 2) by live cell analysis. We identified agents that were cooperative with CHIR-124 in various drug groups such as EGFR inhibitors. However, there was exceptionally potent cooperation with the WEE1 inhibitor, MK1775 present in the compound library (Figure 4A). Further analysis of the growth rate in two different cell models confirmed that cell proliferation was significantly suppressed by combination treatment with CHIR-124 and MK1775 (Figure 4B). To ensure that the combination would be effective across more PDAC models a small drug panel was screened for cooperation with CHK1 inhibition by viability analysis. We observed that MK1775 and CHIR-124 were cooperative (Figure 4C and S4), while amongst the relatively large spectrum of different chemotherapies and related compounds (i.e. BCL2 and ATM/ATR inhibitors) only gemcitabine elicited a low-dose interaction with CHIR-124. While single agent MK1775 and CHIR-124 showed little effect, dose-response analysis between MK1775 and CHIR-124 validated potent synergistic low dose effects in established lines PANC1 and PL45 (Figure 4D and S4). Synergy scores of MK1775 and CHIR-124 were calculated through the Bliss independence model in a range of primary cell lines to confirm results seen in established lines (Figures 4E and S4). These results indicate that WEE1 and CHK1 inhibition is a promising combination in PDAC cells.
Figure 4: WEE1 inhibition and CHK1 inhibition is synergistic in PDAC models.
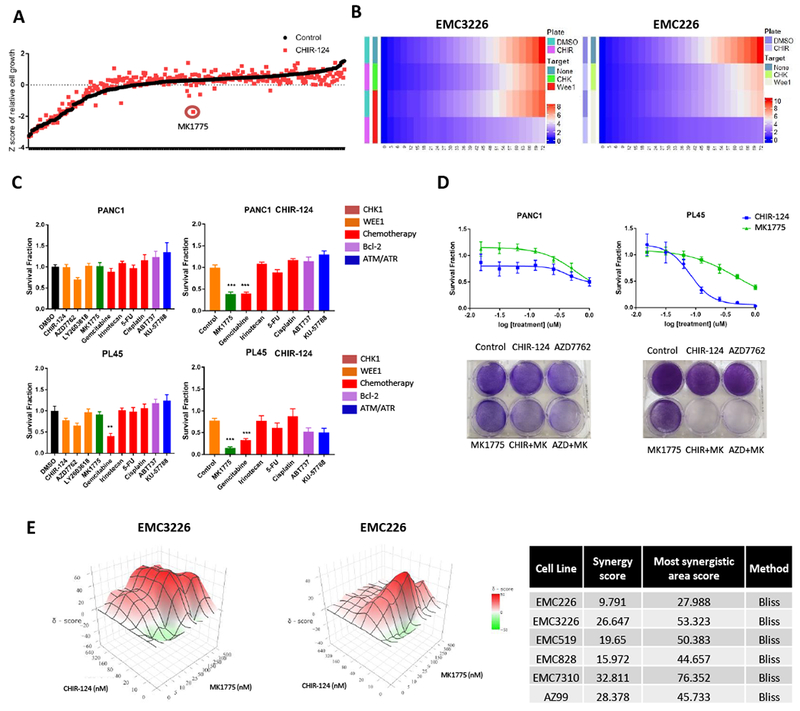
A. The indicated cells harboring H2B-GFP were either treated with DMSO or CHIR-124 (100nM) for 24 hours before screening with a library consisting of over 300 cancer drugs (100nM). Following 72 hours, relative viability was determined by analysis of H2B-GFP. Graph shows the Z-score of the cell viability of each agent alone and with CHIR-124 pre-treatment. MK1775 has a highly potent cooperative effect with CHIR-124. B. Heat maps showing the relative growth from drug screen analysis of two cell lines, EMC3326 and EMC226, of DMSO and CHIR-124 pre-treatment and combination with WEE1 inhibitor MK1775. Growth is represented by change in gradient from blue to red. C. PANC1 and PL45 cell lines were subjected to either DMSO or CHIR-124 (1μM PANC1, 125nM PL45) pre-treatment for 24 hours and then exposed to the indicated agents (250nM) for 72 hours. Graph legend shows colored grouping of the selected agents used in the small screening (i.e. orange represents agents that target CHK1). Cell viability was determined by CTG analysis and the mean and standard deviation is shown (** p-value <0.01, *** p-value <0.001 t test). D. In left panel, dose response of single agent CHIR-124 and MK1775 in PANC1 shown via CTG analysis at 72 hours illustrates relative resistance to single agent treatments. Crystal violet staining of single agent (CHIR-124, AZD7762, and MK1775 at 1μM) and combination treatment (at 1μM for each agent) shows cooperation. Right panel shows dose response of single agent CHIR-124 and MK1775 shown via CTG analysis at 72 hours and confirms PL45 sensitivity to CHIR-124 but resistance to MK1775. Crystal violet staining of single agent (CHIR-124 and AZD7762 at 125nM, MK1775 at 1μM) and combination treatment (CHIR-124 and AZD7762 at 125nM and MK1775 at 1μM) shows cooperation. Cells were treated for 72 hours prior to staining. E. EMC3226 and EMC226 cells were treated with increasing dose of CHIR-124 and MK1775. Cells were treated for 72 hours prior to CTG analysis. Calculated 3D synergy plots using SynergyFinder confirm synergistic relationship of CHIR-124 and MK1775. Table shows synergy score of primary PDAC cell lines with the Bliss independence model.
WEE1 and CHK1 inhibition causes apoptosis through S phase accumulation and DNA damage
To elucidate the underlying mechanism of cooperation, we first examined proliferation levels through EdU incorporation. Although single agent affected proliferation in some cell lines, inhibition of both WEE1 and CHK1 caused a highly significant decrease in EdU incorporation. (Figure 5A, 5B). We examined cell cycle stage through flow cytometric analysis we found that all tested cells (both sensitive and resistant to CHK1 inhibition) were arrested with an S-phase DNA content, in spite of lack of EdU incorporation with combination treatment (Figure 5C and Figure S5). Comparison of active chromatin-associated MCM7 levels in single agent and combination treatment revealed significant decrease upon combined CHK1 and WEE1 inhibition (Figure 5D) indicating the DNA-replication licensing is perturbed (31). Additionally, we performed flow cytometry analysis of EMC226 cells transfected with the FUCCI (fluorescent, ubiquitination-based cell cycle indicator) plasmid (42) to examine features of cell cycle coordination (Figure S5). Combination treatment led to a population of cells that have neither APC-CDH1 (indicated by unchanged GFP levels) nor SCF-SKP2 (seen by increased RFP levels) activity as would typically occur at the exit of mitosis, although the cells have an S-phase DNA content. To investigate whether DNA damage was occurring in cells undergoing replication, cells were co-stained with yH2AX and EdU after treatment with single agents and combination. The lack of overlap in the yH2AX and EdU positive cells indicates the damaged cells are not actively undergoing DNA replication (Figure 5E). Based on these results, we examined if the treated cells progressed through mitosis. Cells were stained for phosphorylated Ser10 Histone H3 (pH3), 24 hours and 48 hours after treatment with CHIR-124, MK1775 or combination. While control cells and cells treated with MK1775 or CHIR-124 single agent exhibit progression through anaphase (Figure 5F and not shown), we found that veritably no cells treated with the combination progressed through anaphase or exhibited appropriately condensed chromatin (Figure 5F). These data suggest that while cells are not actively replicating there are multiple elements of cell cycle deregulation that are occurring in the cells arrested in S-phase. Further evaluation of DNA damage by immunofluorescence also revealed a dramatic increase in replication stress and strand breaks upon combination treatment (Figure 5G and S5). To understand the mechanism by which the cells were arrested, immunoblot analysis was performed on cells treated with single agent and combination. In addition, knockdown of CHK1 and WEE1 was performed to parallel single agent and combination treatments. Consistent with the FUCCI results, we observed decrease in both CDK1 and Cyclin B1 associated with mitotic exit (Figure 5H and S5). Cell cycle agents can induce cell death through multiple processes and have been associated with increased autophagy, apoptosis, and necroptosis (43). To determine the mode of death in combination treatments, markers of apoptosis (annexin V staining and PARP/Cleaved PARP), autophagy (LC3I/II), and necroptosis were measured (Figure 5H and S6). Both cleaved PARP and annexin V were induced by combination treatment, as was the conversion of LC3 forms reflecting enhanced autophagic flux (Figure 5H and S6). Morphological analysis failed to show evidence of necroptosis, while demonstrating membrane swelling and nuclear condensation indicative of apoptosis (Figure S6). Further, utilizing inhibitors of autophagy (Chloroquine), necroptosis (Necrostatin), and apoptosis (Z-vad FMK) revealed that only inhibition of apoptosis could partially rescue viability (Figure 5I). These findings confirm that significant DNA damage and replication stress upon combined CHK1 and WEE1 inhibition causes cells to undergo apoptosis.
Figure 5: Combination of CHK1 and WEE1 inhibition causes accumulation in S phase and DNA damage.
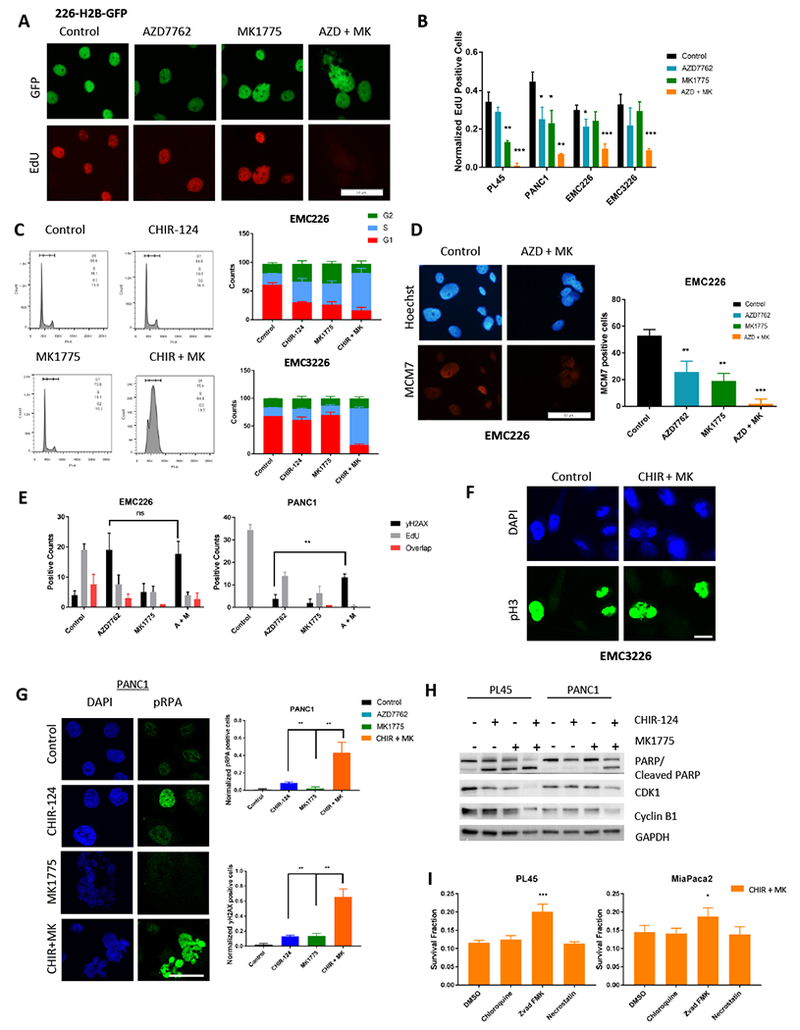
A. EMC226 H2B-GFP cells after 48 hours of indicated treatments were pulsed with EdU for 1 hour and then stained. Representative images are shown (Scale bar is 50μm). B. Quantitation of percent EdU positive cells treated with the indicated agents at 250nM dose for 48 hours. Graph shows the mean and standard deviation (* p-value <0.05, ** p-value <0.01, *** p-value <0.001 t-test). C. Representative histogram of propidium iodide stained cells treated with CHIR-124 (250nM), MK1775 (250nM), and combination (CHIR-124 + MK1775 at 250nM) for 48 hours. Quantitation of DNA content in respective cell cycle phase (mean and standard deviation) is shown in the graph. D. Immunofluorescence staining of chromatin associated MCM7 in EMC226 cells with single agent (AZD7762, MK1775 250nM) and combination treatment (at 250nM for each agent) after 48 hours. Representative micrograph is shown (scale bar is 50μm). Quantitation shows the mean and standard deviation (** p-value <0.01, *** p-value <0.001 t test). E. PDAC cell lines EMC226 and PANC1 were treated for 48 hours of indicated treatments then co-stained for EdU and yH2AX. Positive counts are shown in bar graphs. There was an increase in yH2AX positive cells in the combination treatment for resistant line PANC1 compared to single agent (** p-value <0.01) while EdU levels decreased. F. EMC3226 cells were treated with CHIR-124 (250nM) for 24 and 48 hours. At the indicated time points, cells on coverslips were stained with DAPI and phospho-Histone H3 (scale bar is 10μm). G. PANC1 treatment with CHIR-124 (1μM), MK1775 (1μM), and combination for 48 hours were stained for pRPA and yH2AX. Representative immunofluorescence micrograph is shown (Scale bar is 75μm). Quantitation of the mean and standard deviation are shown (** p-value <0.01). H. Immunoblot analysis of PL45 and PANC1 cells treated for 48 hours on indicated treatments. PL45 was treated with CHIR-124 at 125nM, and PANC1 was treated with 1μM. Both lines were treated with MK1775 at 1μM. Sensitive line PL45 undergoes apoptosis in single agent as well as combination treatment, whereas in resistant line it is only seen in combination treatment. CDK1 levels and CyclinB1 levels decrease in both lines exclusively with combination treatment. I. PL45 and MiaPaca2 cells were treated with Chloroquine (10μM), Z-vad FMK (50μM), and necrostatin (50μM) with combination treatment of CHIR-124 and MK1775 (125nM and 250nM, respectively). CTG analysis was performed after 72 hours of treatment. Graph shows survival fraction and protective effects of Z-vad FMK (* p-value <0.05, *** p-value <0.001 t test).
WEE1 and CHK1 inhibition is effective in vivo, however, resistance can develop
To confirm the efficacy of the therapy in vivo, we employed patient-derived xenograft (PDX) models that match three of the cell lines (EMC226, EMC3226 and EMC828) and subjected them to treatment with single agent and the combination for 21 days (Figure 6A). To monitor toxicity, body weight was measured and there was no significant decrease in weight in single or double agent treatment groups (Figure S7). Two models showed a significant delay in tumor growth in response to combination treatment that significantly exceeded both single agent treatments (Figure 6B and 6C). Histological examination of the tumors harvested at the end of treatment, revealed increased necrotic regions in the tumors from combination therapy arm compared to single agent arms (Figure 6D). In the 226 PDX model there was an initial response to treatment, which was rapidly overcome with tumor growth on treatment, paralleling single agent or control (Figure 6E). To investigate the mechanism of resistance to combination treatment, we developed a resistant cell line, 226R, from a tumor that was progressing on therapy. We confirmed resistance by dose response analysis of CHK1 and WEE1 inhibitor (Figure 6F). Immunoblot analysis indicated that 226R harbored increased levels of baseline pRPA relative to the parental EMC226 line and had constant levels of CDK1 in spite of the reduction in Cyclin A with treatment (Figure 6G). This suggests that the resistance can develop as the cells evolve mechanisms that allow them to withstand higher levels of the replication stress induced by the combination treatment. Spectral karyotyping (SKY) analysis of parental and resistant line showed a decrease in chromosome numbers as well as more homogeneous pattern of translocations relative to the parental sensitive line indicating selective pressure for a sub-clone of the PDX (Figure 6H). Functionally, the levels of EdU incorporation were higher in 226R than the parental model (Figure 6I and S7), indicating that the resistant model has in place mechanisms to continue DNA replication even in the face of combined blockade of WEE1 and CHK1. Since we found gemcitabine also cooperated with CHK1 inhibition and has a distinct mechanism of action (i.e. perturbation of dNTP pools and replication block), we interrogated its ability to rescue the sensitivity to CHK1/WEE1 in the resistant cells. Cell viability analysis demonstrated that the triple combination was effective in the resistant cell line (Figure 6J) and chromatin bound MCM7 levels were effectively decreased upon triple treatment compared to combination (Figure 6K). Thus, employing two different agents that cooperate with CHK1 inhibition could be particularly efficacious to limit evolution of resistance.
Figure 6: Combination treatment is effective in vivo, but resistance may develop.
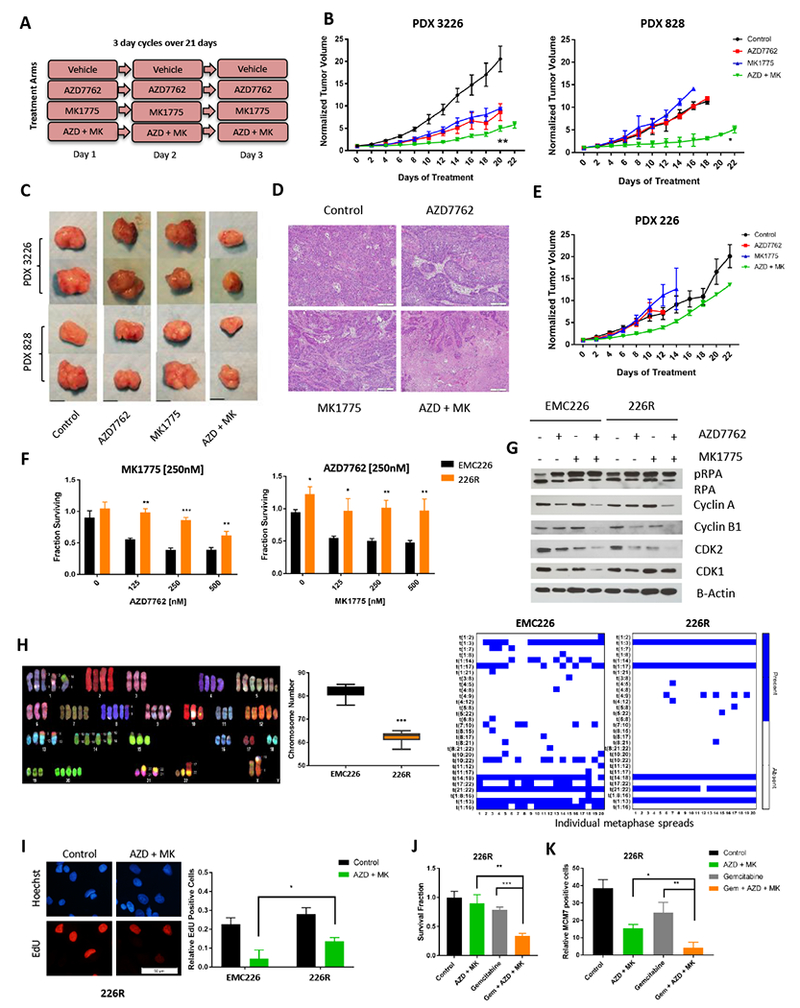
A. Schedule of treatment groups; 3 day cycles repeated over 21 days (n=5 per group, per PDX model). B. PDX3226 and PDX828 were randomized at ~200 mm3 and treated with vehicle (control), single agent, and combinations as indicated for 21 days. Tumor volume was measured every 2 days (* p-value<0.05, ** p-value <0.01 t test). C. Representative images of tumors of PDX models that were harvested at the completion of treatment (scale bar is 1cm). D. Tumors were harvested at the completion of treatment and subjected to hematoxylin and eosin staining. Large areas of necrosis are apparent in combination treated tumors relative to single agents AZD7762 and MK1775. Representative images are shown (scale bar is 100 μm). E. PDX 226 were randomized at ~200 mm3 and treated with vehicle (control), single agent, and combinations as indicated for 21 days. Tumor volume was measured every 2 days. F. The 226R line was treated with the indicated doses of MK1775 and AZD7762 for 72 hours. Cell viability assay was determined by CTG analysis (* p-value <0.05, ** p-value <0.01, *** p-value <0.001 t test). G. Immunoblot analysis of pRPA, Cyclin A, Cyclin B1 CDK1, CDK2 and B-Actin of EMC226 parental and 226R line with indicated treatments (AZD7762 at 250nM, MK1775 at 250nM) for 48 hours. H. Representative image of spectral karyotyping (SKY) of EMC226 parental cells. Chromosome numbers of EMC226 are significantly higher than 226R cells (*** p-value <0.001 t test). Chromosome translocations of EMC226 parental are greater in number and variation than 226R line. I. EMC226 and 226R lines were treated with combination of AZD7762 and MK1775 at 250nM over 48 hours and EdU incorporation was determined. Representative micrograph of 226R cell line is shown (scale bar is 50μm). Quantitation shows the mean and standard deviation of the percent EdU positive cells (* p-value <0.05 t test). J. 226R lines were treated with AZD7762 (250nM) and MK1775 (250nM), single agent gemcitabine (100nM), and triple combination (gemcitabine 100nM, AZD7762 and MK1775 250nM). Cell viability was determined by CTG analysis at 72 hours (** p-value <0.01, *** p-value <0.001 t test). K. Immunofluorescence staining of chromatin bound MCM7 was done in 226R lines after 48 hours treatment of AZD7762 (250nM) and MK1775 (250nM), single agent gemcitabine (100nM), and triple combination (Gem + AZD + MK). Graph shows mean and standard deviation of relative MCM7 positive cells (* p-value <0.05, ** p-value <0.01 t test).
In vivo efficacy of targeting cell cycle checkpoints and gemcitabine
To evaluate the efficacy of triple drug combination in vivo we utilized the same PDX models that were employed for double treatment therapy as well as additional orthotopic models (Figure 7). Addition of gemcitabine to the treatment regimen (Figure 7A) did not yield additional toxicities as seen by body weight (Figure 7B). Histologic evaluation of major organs (lung, small intestine, liver, and kidney) did not reveal significant toxicities (Figure 7C). Murine cell line 4662 and EMC226 line were used for the orthotopic models. Mice were imaged by MRI to ensure volumes were similar at baseline prior to randomization to treatment arms (Figure S8). The 4662 orthotopic model gave rise to metastatic disease (60% of mice), which was absent in the triple regimen group (0% of mice), which also showed robust control of tumor growth (Figure 7D). The PDX 226 model also had significant decrease in tumor growth as determined by tumor weight at end of treatment (Figure 7E). Upon treatment completion, tumor and small intestine were stained with Ki67 to examine impact on proliferation in tumor and in intestinal crypts which contain progenitor cells essential for self-renewing capacity of the intestinal mucosa (Figure 7F). Staining revealed that there was minimal inhibition of proliferation in the intestine while Ki67 levels dramatically decreased in tumors. We also evaluated if addition of gemcitabine to CHK1 and WEE1 inhibitors could minimize resistance observed in the 226 PDX model with dual (CHK1 and WEE1) treatment (Figure 7G). Analysis of tumor tissue revealed more extensive zones of necrosis in the triple therapy arm compared to the single and double therapy (Figure 7H). Triple combination treatment was evaluated in additional PDX models confirming that addition of gemcitabine to AZD7762 and MK1775 results in increased disease control (Figure 7I and 7J). Therefore, while CHK1 and WEE1 inhibition is effective in vivo, resistance to this therapy can be minimized by agents that further enhance replication stress and perturb dNTP pools such as gemcitabine.
Figure 7: Gemcitabine minimizes resistance to combination treatment.
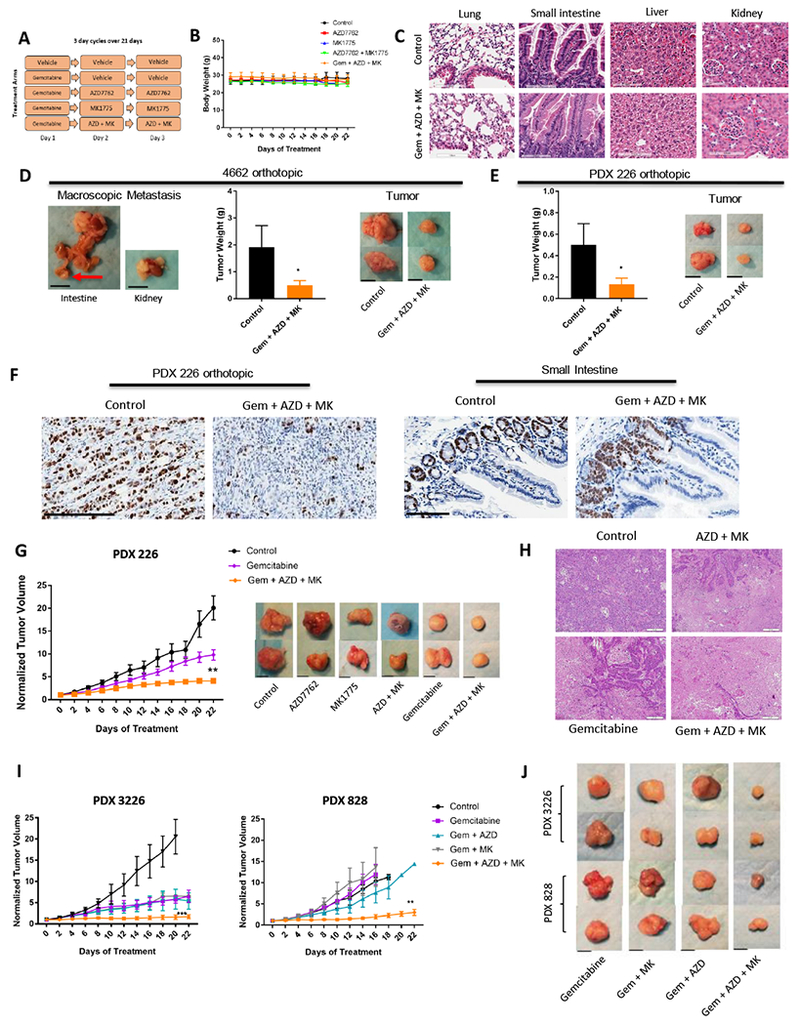
A. Schedule of treatment groups; 3 day cycles over 21 days (n=5 per group, per PDX model) B. Body weight of mice aggregated into treatment groups. Graph shows mean and standard error of mean. C. Hematoxylin and eosin staining was performed on major organs (lung, small intestine, liver, kidney) upon treatment completion (scale bar is 100μm). D. Left panel shows macroscopic metastasis seen in control group. Tumor weights of orthotopic 4662 model of treatment groups are shown (* p-value <0.05 t test). Panel of tumors harvested after treatment was completed is shown on the right panel (scale bar is 1cm) E. Tumor weights of orthotopic 226 PDX model of treatment groups are shown (* p-value <0.05 t test). Panel of tumors harvested after treatment was completed is shown on the right (scale bar is 1cm). F. Tumors and small intestine were stained with ki67 from control and triple treatment group (scale bar is 250μm and 100μm, respectively). G. Graph of PDX 226 model with indicated treatments (** p-value <0.01 t test). Graph of single agent AZD7762 and MK1775, as well as combination treatment can be viewed on Figure 6E. Panel of tumors harvested after completion of treatment is shown for each group (scale bar is 1cm). H. Tumors were harvested at the completion of treatment and subjected to hematoxylin and eosin staining. Staining shows more necrotic regions in triple treatment than combination and single treatment. Representative images are shown (scale bar is 50μm). I. Graphs of PDX 3226 and 828 models of single agent gemcitabine, combination, and triple treatment of indicated agents (** p-value <0.01, *** p-value <0.001 t test). J. Panel of tumors harvested after treatment was completed in 3226 and 828 PDX models. Refer to Fig. 6C for control panel. Representative images are shown (scale bar is 1cm).
DISCUSSION
Pancreatic cancer is a therapy recalcitrant disease; therefore, understanding limitations of specific targeted strategies and defining effective combination therapies is particularly important (44,45). KRAS drives multiple survival and proliferative processes that likely contributes to the difficulty in targeting effector pathways (e.g. MEK) to much effect (46). Since DNA replication stress is a downstream biological consequence of KRAS oncogene, we reasoned that targeting cell cycle checkpoints could be particularly efficacious and perhaps represent a precision approach to pancreatic cancer treatment.
In multiple PDAC models we found that CHK1 inhibition could elicit cytotoxic effect, although this response was highly heterogeneous. This heterogeneity was observed in both established and patient-derived models of pancreatic cancer. Mechanistically, the response to CHK1 inhibition is related to induction of replication failure and increased DNA damage, while resistance is associated with cells that have adapted means to pass through DNA synthesis with essentially little requirement for CHK1. This resistance suggests that such pancreatic cancer cells have evolved alternative mechanisms to bypass replication stress. While it has been proposed that TP53 mutation is associated with sensitivity to CHK1 inhibition (47–50), we observed that none of the common genetic alterations present in pancreatic cancer (e.g. TP53, CDKN2A or SMAD4) were associated with response. Similarly, the gene expression level of CHK1 was not significantly associated with sensitivity (not shown). However, a gene expression signature related to FOXM1 correlated with sensitivity in the cell models. FOXM1 is a potent driver of cell cycle progression suggesting that the hyper-active cell cycle is a determinant for the sensitivity to CHK1 inhibition (40). Interestingly, this same signature is associated with particularly poor prognosis in pancreatic cancer clinical cases, suggesting the CHK1 inhibition could have efficacy in a small fraction of very aggressive pancreatic cancers.
In spite of the findings related to single agent CHK1 inhibition (47,50,51), we strove to define combination approaches that would be active at low dose and would provide a means to broaden the efficacy. Using both broad and focused drug screens, we found that CHK1 inhibition was particularly synergistic in combination with WEE1 inhibition. This combination was effective against all cell lines tested and effectively converted CHK1 resistant cells to sensitivity. This finding agrees with genetic data from yeast that CHK1 and WEE1 are synthetically lethal, and synergistic effects of this combination that have been observed in cancer cells (29–31,52–54). Other studies have indicated the dual effect of CHK1 and WEE1 inhibition leads to a state that has been equated to mitotic catastrophe (29,31). Since WEE1 inhibition enhances the replication stress in cells that are resistant to CHK1 inhibition, it strongly indicates that WEE1 plays a role in the bypass to single agent CHK1 inhibition that is operable in many pancreatic cancer models (Figure 5G). However, we also observe that the combination specifically leads to an S-phase arrest, with reduced expression of CDK1, Cyclin B1, and loss of MCM7 from chromatin. Likely this reflects both the replication stress and specific effects of WEE1 on CDK-activity (55). This population with S-phase content has SCF-SKP2 inhibited upon combined treatment with CHK1 and WEE1 inhibitors, suggesting that the cells likely lack requisite CDK-activity and thus are trapped in a “replicative-catastrophe”. These cells ultimately die through what appears to be an apoptotic process (Figure S5). Consistent with the cell-based sensitivity the combination of CHK1 and WEE1 was effective in PDX models; however, despite initial response progression on therapy could occur.
That a potent therapy in vitro failed to achieve durable disease control underscores the clinical issue of therapeutic resistance that is commonly observed in pancreatic cancer. However, it also provided the opportunity to delineate the nature of the resistance. In the context of pancreatic cancer, there is the possibility that resistance is associated with the tumor microenvironment or lack of drug access (56,57). This does not appear to be the case as cells derived from the resistant PDX exhibited intrinsic resistance in cell culture. Interestingly, the resistant cell line represented a more chromosomally homogeneous sub-clone compared to parental model. In addition, the resistant model has high base line replication stress and thus has apparently evolved a mechanism to evade the dual inhibition of CHK1 and WEE1 presumably at the cost of having an inefficient S-phase. Since we found that gemcitabine also cooperates with CHK1 inhibition and could further interfere with S-phase due to mediating replication blocks and perturbation of dNTP pools, the triple regiment (gemcitabine, CHK1 and WEE1 inhibitors) was employed in the treatment of multiple distinct xenograft models. In all cases there was potent disease control that far exceeded any of the other treatments employed. Therefore, coordinately targeting replication stress and disrupting two major cell cycle checkpoint pathways enables consistent control of tumor growth. In general, triplet therapies are associated with additional toxicities; however, in our study we did not observe significant toxicity in the mice with the utilized doses and schedules and treatments appear to be highly tumor selective. Together, our study illustrates the challenge of mechanistically targeted therapies in pancreatic cancer, where multiple mechanisms of therapeutic resistance can emerge. In spite of these challenges, tumor-selective combination approaches that target cell cycle checkpoints can be identified and have broad acting activity across a number of disease models.
Supplementary Material
STATEMENT OF TRANSLATIONAL RELEVANCE.
Pancreatic adenocarcinoma (PDAC) is an aggressive disease with limited therapeutic options. Cell cycle checkpoints are perceived as an important target for cancer therapy due to oncogenic stress and deregulated proliferation in tumors. We investigated mechanisms of resistance to single agent CHK1 inhibition across a wide panel of PDAC cell lines. Most PDAC models were relatively resistant to CHK1 inhibition, although a FOXM1 gene expression signature was associated with response. Drug screening revealed potent cooperation between CHK1 and WEE1 inhibitors. In spite of this potential efficacy, PDX models could bypass this combination due to selection of a stable sub-clone. Perturbation of dNTP pools and replication block were effective in overcoming resistance. Subsequent triple combination therapy with CHK1 and WEE1 inhibitors in concert with gemcitabine was effective in inducing durable control of tumor growth in PDX models. Thus, our data reveal modes of single and double agent resistance and provide rationale for coordination of targeted therapies in PDAC.
ACKNOWLEDGEMENTS
The authors thank members of the Witkiewicz and Knudsen laboratories for technical assistance and discussion of study results. This study was supported by grants from National Institute of Health. Services were provided by the Flow and Image Cytometry Core facility, Pathology Network Shared Resource, and Translational Imaging Shared Resource which are supported by the Roswell Park Cancer Center (NCI P30CA16056).
FUNDING: This study was supported by grants from National Institute of Health
Footnotes
CONFLICT OF INTEREST: The authors declare no potential conflicts of interest.
REFERENCES
- 1.Vincent A, Herman J, Schulick R, Hruban RH, Goggins M. Pancreatic cancer. Lancet 2011;378(9791):607–20 doi 10.1016/S0140-6736(10)62307-0. [DOI] [PMC free article] [PubMed] [Google Scholar]
- 2.Paulson AS, Tran Cao HS, Tempero MA, Lowy AM. Therapeutic advances in pancreatic cancer. Gastroenterology 2013;144(6):1316–26 doi 10.1053/j.gastro.2013.01.078. [DOI] [PubMed] [Google Scholar]
- 3.Biankin AV, Piantadosi S, Hollingsworth SJ. Patient-centric trials for therapeutic development in precision oncology. Nature 2015;526(7573):361–70 doi 10.1038/nature15819. [DOI] [PubMed] [Google Scholar]
- 4.Ottaiano A, Capozzi M, De Divitiis C, De Stefano A, Botti G, Avallone A, et al. Gemcitabine mono-therapy versus gemcitabine plus targeted therapy in advanced pancreatic cancer: a meta-analysis of randomized phase III trials. Acta Oncol 2017;56(3):377–83 doi 10.1080/0284186X.2017.1288922. [DOI] [PubMed] [Google Scholar]
- 5.Conroy T, Desseigne F, Ychou M, Bouche O, Guimbaud R, Becouarn Y, et al. FOLFIRINOX versus gemcitabine for metastatic pancreatic cancer. N Engl J Med 2011;364(19):1817–25 doi 10.1056/NEJMoa1011923. [DOI] [PubMed] [Google Scholar]
- 6.Von Hoff DD, Ervin T, Arena FP, Chiorean EG, Infante J, Moore M, et al. Increased survival in pancreatic cancer with nab-paclitaxel plus gemcitabine. N Engl J Med 2013;369(18):1691–703 doi 10.1056/NEJMoa1304369. [DOI] [PMC free article] [PubMed] [Google Scholar]
- 7.Network T Integrated Genomic Characterization of Pancreatic Ductal Adenocarcinoma. Cancer Cell 2017;32(2):185–203 e13 doi 10.1016/j.ccell.2017.07.007. [DOI] [PMC free article] [PubMed] [Google Scholar]
- 8.Witkiewicz AK, McMillan EA, Balaji U, Baek G, Lin WC, Mansour J, et al. Whole-exome sequencing of pancreatic cancer defines genetic diversity and therapeutic targets. Nat Commun 2015;6:6744 doi 10.1038/ncomms7744. [DOI] [PMC free article] [PubMed] [Google Scholar]
- 9.Waddell N, Pajic M, Patch AM, Chang DK, Kassahn KS, Bailey P, et al. Whole genomes redefine the mutational landscape of pancreatic cancer. Nature 2015;518(7540):495–501 doi 10.1038/nature14169. [DOI] [PMC free article] [PubMed] [Google Scholar]
- 10.Weinberg F, Hamanaka R, Wheaton WW, Weinberg S, Joseph J, Lopez M, et al. Mitochondrial metabolism and ROS generation are essential for Kras-mediated tumorigenicity. Proc Natl Acad Sci U S A 2010;107(19):8788–93 doi 10.1073/pnas.1003428107. [DOI] [PMC free article] [PubMed] [Google Scholar]
- 11.Serrano M, Lin AW, McCurrach ME, Beach D, Lowe SW. Oncogenic ras provokes premature cell senescence associated with accumulation of p53 and p16INK4a. Cell 1997;88(5):593–602. [DOI] [PubMed] [Google Scholar]
- 12.Yang Y, Gao Y, Mutter-Rottmayer L, Zlatanou A, Durando M, Ding W, et al. DNA repair factor RAD18 and DNA polymerase Polkappa confer tolerance of oncogenic DNA replication stress. J Cell Biol 2017;216(10):3097–115 doi 10.1083/jcb.201702006. [DOI] [PMC free article] [PubMed] [Google Scholar]
- 13.Bartkova J, Rezaei N, Liontos M, Karakaidos P, Kletsas D, Issaeva N, et al. Oncogene-induced senescence is part of the tumorigenesis barrier imposed by DNA damage checkpoints. Nature 2006;444(7119):633–7 doi 10.1038/nature05268. [DOI] [PubMed] [Google Scholar]
- 14.Jones S, Zhang X, Parsons DW, Lin JC, Leary RJ, Angenendt P, et al. Core signaling pathways in human pancreatic cancers revealed by global genomic analyses. Science 2008;321(5897):1801–6 doi 10.1126/science.1164368. [DOI] [PMC free article] [PubMed] [Google Scholar]
- 15.Biankin AV, Waddell N, Kassahn KS, Gingras MC, Muthuswamy LB, Johns AL, et al. Pancreatic cancer genomes reveal aberrations in axon guidance pathway genes. Nature 2012;491(7424):399–405 doi 10.1038/nature11547. [DOI] [PMC free article] [PubMed] [Google Scholar]
- 16.Weinert TA, Hartwell LH. The RAD9 gene controls the cell cycle response to DNA damage in Saccharomyces cerevisiae. Science 1988;241(4863):317–22. [DOI] [PubMed] [Google Scholar]
- 17.Enoch T, Carr AM, Nurse P. Fission yeast genes involved in coupling mitosis to completion of DNA replication. Genes Dev 1992;6(11):2035–46. [DOI] [PubMed] [Google Scholar]
- 18.Eastman A Cell cycle checkpoints and their impact on anticancer therapeutic strategies. J Cell Biochem 2004;91(2):223–31 doi 10.1002/jcb.10699. [DOI] [PubMed] [Google Scholar]
- 19.Kastan MB, Bartek J. Cell-cycle checkpoints and cancer. Nature 2004;432(7015):316–23 doi 10.1038/nature03097. [DOI] [PubMed] [Google Scholar]
- 20.Shechter D, Costanzo V, Gautier J. ATR and ATM regulate the timing of DNA replication origin firing. Nat Cell Biol 2004;6(7):648–55 doi 10.1038/ncb1145. [DOI] [PubMed] [Google Scholar]
- 21.Bartek J, Lukas J. Chk1 and Chk2 kinases in checkpoint control and cancer. Cancer Cell 2003;3(5):421–9. [DOI] [PubMed] [Google Scholar]
- 22.Sorensen CS, Syljuasen RG, Falck J, Schroeder T, Ronnstrand L, Khanna KK, et al. Chk1 regulates the S phase checkpoint by coupling the physiological turnover and ionizing radiation-induced accelerated proteolysis of Cdc25A. Cancer Cell 2003;3(3):247–58. [DOI] [PubMed] [Google Scholar]
- 23.Sanchez Y, Wong C, Thoma RS, Richman R, Wu Z, Piwnica-Worms H, et al. Conservation of the Chk1 checkpoint pathway in mammals: linkage of DNA damage to Cdk regulation through Cdc25. Science 1997;277(5331):1497–501. [DOI] [PubMed] [Google Scholar]
- 24.Falck J, Petrini JH, Williams BR, Lukas J, Bartek J. The DNA damage-dependent intra-S phase checkpoint is regulated by parallel pathways. Nat Genet 2002;30(3):290–4 doi 10.1038/ng845. [DOI] [PubMed] [Google Scholar]
- 25.McGowan CH, Russell P. Cell cycle regulation of human WEE1. EMBO J 1995;14(10):2166–75. [DOI] [PMC free article] [PubMed] [Google Scholar]
- 26.Heald R, McLoughlin M, McKeon F. Human wee1 maintains mitotic timing by protecting the nucleus from cytoplasmically activated Cdc2 kinase. Cell 1993;74(3):463–74. [DOI] [PubMed] [Google Scholar]
- 27.Beck H, Nahse-Kumpf V, Larsen MS, O’Hanlon KA, Patzke S, Holmberg C, et al. Cyclin-dependent kinase suppression by WEE1 kinase protects the genome through control of replication initiation and nucleotide consumption. Mol Cell Biol 2012;32(20):4226–36 doi 10.1128/MCB.00412-12. [DOI] [PMC free article] [PubMed] [Google Scholar]
- 28.Aarts M, Sharpe R, Garcia-Murillas I, Gevensleben H, Hurd MS, Shumway SD, et al. Forced mitotic entry of S-phase cells as a therapeutic strategy induced by inhibition of WEE1. Cancer Discov 2012;2(6):524–39 doi 10.1158/2159-8290.CD-11-0320. [DOI] [PubMed] [Google Scholar]
- 29.Carrassa L, Chila R, Lupi M, Ricci F, Celenza C, Mazzoletti M, et al. Combined inhibition of Chk1 and Wee1: in vitro synergistic effect translates to tumor growth inhibition in vivo. Cell Cycle 2012;11(13):2507–17 doi 10.4161/cc.20899. [DOI] [PubMed] [Google Scholar]
- 30.Chila R, Basana A, Lupi M, Guffanti F, Gaudio E, Rinaldi A, et al. Combined inhibition of Chk1 and Wee1 as a new therapeutic strategy for mantle cell lymphoma. Oncotarget 2015;6(5):3394–408 doi 10.18632/oncotarget.2583. [DOI] [PMC free article] [PubMed] [Google Scholar]
- 31.Hauge S, Naucke C, Hasvold G, Joel M, Rodland GE, Juzenas P, et al. Combined inhibition of Wee1 and Chk1 gives synergistic DNA damage in S-phase due to distinct regulation of CDK activity and CDC45 loading. Oncotarget 2017;8(7):10966–79 doi 10.18632/oncotarget.14089. [DOI] [PMC free article] [PubMed] [Google Scholar]
- 32.Hanahan D, Weinberg RA. The hallmarks of cancer. Cell 2000;100(1):57–70. [DOI] [PubMed] [Google Scholar]
- 33.Bartek J, Bartkova J, Lukas J. DNA damage signalling guards against activated oncogenes and tumour progression. Oncogene 2007;26(56):7773–9 doi 10.1038/sj.onc.1210881. [DOI] [PubMed] [Google Scholar]
- 34.Lo A, Wang LS, Scholler J, Monslow J, Avery D, Newick K, et al. Tumor-Promoting Desmoplasia Is Disrupted by Depleting FAP-Expressing Stromal Cells. Cancer Res 2015;75(14):2800–10 doi 10.1158/0008-5472.CAN-14-3041. [DOI] [PMC free article] [PubMed] [Google Scholar]
- 35.Knudsen ES, Balaji U, Mannakee B, Vail P, Eslinger C, Moxom C, et al. Pancreatic cancer cell lines as patient-derived avatars: genetic characterisation and functional utility. Gut 2018;67(3):508–20 doi 10.1136/gutjnl-2016-313133. [DOI] [PMC free article] [PubMed] [Google Scholar]
- 36.Robinson MD, McCarthy DJ, Smyth GK. edgeR: a Bioconductor package for differential expression analysis of digital gene expression data. Bioinformatics 2010;26(1):139–40 doi 10.1093/bioinformatics/btp616. [DOI] [PMC free article] [PubMed] [Google Scholar]
- 37.McCarthy DJ, Chen Y, Smyth GK. Differential expression analysis of multifactor RNA-Seq experiments with respect to biological variation. Nucleic Acids Res 2012;40(10):4288–97 doi 10.1093/nar/gks042. [DOI] [PMC free article] [PubMed] [Google Scholar]
- 38.O’Connor MJ. Targeting the DNA Damage Response in Cancer. Mol Cell 2015;60(4):547–60 doi 10.1016/j.molcel.2015.10.040. [DOI] [PubMed] [Google Scholar]
- 39.Dobbelstein M, Sorensen CS. Exploiting replicative stress to treat cancer. Nat Rev Drug Discov 2015;14(6):405–23 doi 10.1038/nrd4553. [DOI] [PubMed] [Google Scholar]
- 40.Koo CY, Muir KW, Lam EW. FOXM1: From cancer initiation to progression and treatment. Biochim Biophys Acta 2012;1819(1):28–37 doi 10.1016/j.bbagrm.2011.09.004. [DOI] [PubMed] [Google Scholar]
- 41.Anders L, Ke N, Hydbring P, Choi YJ, Widlund HR, Chick JM, et al. A systematic screen for CDK4/6 substrates links FOXM1 phosphorylation to senescence suppression in cancer cells. Cancer Cell 2011;20(5):620–34 doi 10.1016/j.ccr.2011.10.001. [DOI] [PMC free article] [PubMed] [Google Scholar]
- 42.Sladitschek HL, Neveu PA. MXS-Chaining: A Highly Efficient Cloning Platform for Imaging and Flow Cytometry Approaches in Mammalian Systems. PLoS One 2015;10(4):e0124958 doi 10.1371/journal.pone.0124958. [DOI] [PMC free article] [PubMed] [Google Scholar]
- 43.Xie Y, Zhu S, Zhong M, Yang M, Sun X, Liu J, et al. Inhibition of Aurora Kinase A Induces Necroptosis in Pancreatic Carcinoma. Gastroenterology 2017;153(5):1429–43 e5 doi 10.1053/j.gastro.2017.07.036. [DOI] [PMC free article] [PubMed] [Google Scholar]
- 44.Knudsen ES, O’Reilly EM, Brody JR, Witkiewicz AK. Genetic Diversity of Pancreatic Ductal Adenocarcinoma and Opportunities for Precision Medicine. Gastroenterology 2016;150(1):48–63 doi 10.1053/j.gastro.2015.08.056. [DOI] [PMC free article] [PubMed] [Google Scholar]
- 45.Collisson EA, Sadanandam A, Olson P, Gibb WJ, Truitt M, Gu S, et al. Subtypes of pancreatic ductal adenocarcinoma and their differing responses to therapy. Nat Med 2011;17(4):500–3 doi 10.1038/nm.2344. [DOI] [PMC free article] [PubMed] [Google Scholar]
- 46.Bryant KL, Mancias JD, Kimmelman AC, Der CJ. KRAS: feeding pancreatic cancer proliferation. Trends Biochem Sci 2014;39(2):91–100 doi 10.1016/j.tibs.2013.12.004. [DOI] [PMC free article] [PubMed] [Google Scholar]
- 47.Manic G, Signore M, Sistigu A, Russo G, Corradi F, Siteni S, et al. CHK1-targeted therapy to deplete DNA replication-stressed, p53-deficient, hyperdiploid colorectal cancer stem cells. Gut 2018;67(5):903–17 doi 10.1136/gutjnl-2016-312623. [DOI] [PMC free article] [PubMed] [Google Scholar]
- 48.Ma CX, Cai S, Li S, Ryan CE, Guo Z, Schaiff WT, et al. Targeting Chk1 in p53-deficient triple-negative breast cancer is therapeutically beneficial in human-in-mouse tumor models. J Clin Invest 2012;122(4):1541–52 doi 10.1172/JCI58765. [DOI] [PMC free article] [PubMed] [Google Scholar]
- 49.Koniaras K, Cuddihy AR, Christopoulos H, Hogg A, O’Connell MJ. Inhibition of Chk1-dependent G2 DNA damage checkpoint radiosensitizes p53 mutant human cells. Oncogene 2001;20(51):7453–63 doi 10.1038/sj.onc.1204942. [DOI] [PubMed] [Google Scholar]
- 50.Chen Z, Xiao Z, Gu WZ, Xue J, Bui MH, Kovar P, et al. Selective Chk1 inhibitors differentially sensitize p53-deficient cancer cells to cancer therapeutics. Int J Cancer 2006;119(12):2784–94 doi 10.1002/ijc.22198. [DOI] [PubMed] [Google Scholar]
- 51.Walton MI, Eve PD, Hayes A, Valenti MR, De Haven Brandon AK, Box G, et al. CCT244747 is a novel potent and selective CHK1 inhibitor with oral efficacy alone and in combination with genotoxic anticancer drugs. Clin Cancer Res 2012;18(20):5650–61 doi 10.1158/1078-0432.CCR-12-1322. [DOI] [PMC free article] [PubMed] [Google Scholar]
- 52.Magnussen GI, Emilsen E, Giller Fleten K, Engesaeter B, Nahse-Kumpf V, Fjaer R, et al. Combined inhibition of the cell cycle related proteins Wee1 and Chk1/2 induces synergistic anti-cancer effect in melanoma. BMC Cancer 2015;15:462 doi 10.1186/s12885-015-1474-8. [DOI] [PMC free article] [PubMed] [Google Scholar]
- 53.Russell MR, Levin K, Rader J, Belcastro L, Li Y, Martinez D, et al. Combination therapy targeting the Chk1 and Wee1 kinases shows therapeutic efficacy in neuroblastoma. Cancer Res 2013;73(2):776–84 doi 10.1158/0008-5472.CAN-12-2669. [DOI] [PMC free article] [PubMed] [Google Scholar]
- 54.Koh SB, Wallez Y, Dunlop CR, Bernaldo de Quiros Fernandez S, Bapiro TE, Richards FM, et al. Mechanistic distinctions between CHK1 and WEE1 inhibition guide the scheduling of triple therapy with gemcitabine. Cancer Res 2018. doi 10.1158/0008-5472.CAN-17-3932. [DOI] [PMC free article] [PubMed] [Google Scholar]
- 55.Sorensen CS, Syljuasen RG. Safeguarding genome integrity: the checkpoint kinases ATR, CHK1 and WEE1 restrain CDK activity during normal DNA replication. Nucleic Acids Res 2012;40(2):477–86 doi 10.1093/nar/gkr697. [DOI] [PMC free article] [PubMed] [Google Scholar]
- 56.Feig C, Gopinathan A, Neesse A, Chan DS, Cook N, Tuveson DA. The pancreas cancer microenvironment. Clin Cancer Res 2012;18(16):4266–76 doi 10.1158/1078-0432.CCR-11-3114. [DOI] [PMC free article] [PubMed] [Google Scholar]
- 57.Neesse A, Michl P, Frese KK, Feig C, Cook N, Jacobetz MA, et al. Stromal biology and therapy in pancreatic cancer. Gut 2011;60(6):861–8 doi 10.1136/gut.2010.226092. [DOI] [PubMed] [Google Scholar]
Associated Data
This section collects any data citations, data availability statements, or supplementary materials included in this article.