

Abstract
The majority of non-small cell lung cancer (NSCLC) cases are diagnosed at advanced stages, primarily because earlier stages of the disease are either asymptomatic or may be attributed to other causes such as infection or long-term effects from smoking. Therefore, early detection of NSCLC would likely increase response and survival rates due to timely intervention. Here we utilize a novel approach based on whole genome-derived tiled peptide arrays to identify epitopes associated with autoantibody reactivity in NSCLC as a potential means for early detection. Arrays consisted of 2,781,902 tiled peptides representing 20,193 proteins encoded in the human genome. Analysis of 86 pre-diagnostic samples and 86 matched normal controls from a high-risk cohort revealed 48 proteins with three or more reactive epitopes in NSCLC samples relative to controls. Independent mass spectrometry analysis identified 40 of the 48 proteins in pre-diagnostic sera from NSCLC samples, of which 21 occurred in the immunoglobulin bound fraction. Additionally, 63 and 34 proteins encompassed three or more epitopes that were distinct for squamous cell lung cancer and lung adenocarcinoma, respectively. Collectively, these data show that tiled peptide arrays provide a means to delineate epitopes encoded across the genome that trigger an autoantibody response associated with tumor development.
Keywords: Pre-diagnostic plasma, Non-small cell lung cancer, autoantibody signature, peptide array
Introduction
Substantial evidence points to the occurrence of a humoral immune response to tumor antigens early during tumor development. For some cancers, this is manifest as paraneoplastic neurological symptoms occurring prior to diagnosis due to the production of autoantibodies to neural cell proteins (1,2). For most patients the autoantibody response occurs during tumor development without manifestation of symptoms. Harnessing the immune response to tumor antigens in the form of autoantibodies represents a promising approach for cancer early detection (3–5). Because of a limited immune response to any particular epitope among cancer subjects, strategies are needed to improve sensitivity and specificity for early detection applications through the identification of multiple antigenic epitopes. Such an effort requires comprehensive approaches capable of capturing among a vast number of potential epitopes, those that confer the greatest sensitivity and specificity.
Several strategies have been applied to the discovery of circulating autoantibody markers in cancer, mostly by relying on samples obtained at the time of diagnosis (6–8). Serological screening of cDNA expression libraries (SEREX) has been utilized to discover potential immunogenic markers (9). Tumor cell lysate-derived protein arrays have been utilized to define autoantibody signatures involving natural proteins (10–16). Tumor antigens have also been discovered through the use of recombinant arrays (17–19), phage-display libraries (20,21) and tumor homogenates (22).
Peptide arrays have been utilized to determine the optimal amino acid length for antibody binding, and to interrogate signaling pathways and kinase activity (23,24). Substrates for arraying proteins and peptides have included nitrocellulose, glass, silicon wafers and plastic (25). Chemical synthesis of peptides on the array surface allows incorporation of modifications, including phosphorylation, acetylation or methylation, on amino acids. In this study we have implemented an innovative strategy using tiled peptide arrays encompassing the entire coding sequences in the human genome representing 2,781,902 tiled peptides to determine the occurrence of peptide epitopes in lung cancer sera collected up to one year prior to diagnosis, and the extent of similarities and differences in peptide epitopes between squamous lung cancer and lung adenocarcinoma.
Materials and Methods
Serum samples.
Serum samples were collected as part of the Beta-Carotene and Retinol Efficacy Trial (CARET) study, which is a multicenter, randomized, double-blinded, placebo-controlled trial to evaluate the cancer prevention efficacy and safety of daily supplementation with 30 mg of beta-carotene and 25,000 IU of retinyl palmitate in 18,314 individuals at high risk of developing lung cancer (26). In this study, serum from 86 subjects collected up to a year prior to a diagnosis of non-small cell lung cancer (NSCLC) and from 86 healthy controls matched for age, gender, and smoking status were selected from the CARET cohort for peptide array analysis. Of the 86 subjects subsequently diagnosed with lung cancer, 32 patients had adenocarcinoma, 30 had squamous cell carcinoma, and 24 subjects were classified as non-squamous, non-adeno NSCLC. The characteristics of the subjects in the study are summarized in Supplementary Table 1. An independent set of 42 pre-diagnostic NSCLC samples was utilized to determine the occurrence in circulation of proteins exhibiting peptide reactivity among cases. All study participants gave written informed consent to participate in the study, and the research was approved by the institutional review boards of all of the participating institutions. All studies were conducted in accordance with the Declaration of Helsinki.
Array design and synthesis
Peptide arrays were designed based on protein sequences obtained from the Universal Protein Resource (UniProt) (Supplementary Figure 1). 2,781,902 16-mer peptides with 12 amino acids overlap representing the coding sequences in the genome and 4.547 scrambled peptides were randomly distributed on the array. Microarrays were synthesized with a Roche-NimbleGen Maskless Array Synthesizer (MAS) by light-directed solid-phase peptide synthesis using an amino-functionalized plastic support (Greiner Bio-One) coupled with a 6-aminohexanoic acid linker and amino acid derivatives carrying a photosensitive 2-(2-nitrophenyl) propyloxycarbonyl (NPPOC) protection group (Orgentis Chemicals). Amino acids (final concentration 20 mM) were pre-mixed for 10 min in N,N-Dimethylformamide (DMF, Sigma Aldrich) with N,N,N’,N’-Tetramethyl-O-(1H-benzotriazol-1-yl)uranium-hexafluorophosphate (HBTU, Protein Technologies, Inc.; final concentration 20 mM) as an activator, 6-Chloro-1-hydroxybenzotriazole (6-Cl-HOBt, Protein Technologies, Inc.; final concentration 20 mM) to suppress racemization, and N,N-Diisopropylethylamine (DIPEA, Sigma Aldrich; final concentration 31mM) as base. Activated amino acids were then coupled to the array surface for 3 min. Following each coupling step, the microarray was washed with N-methyl-2-pyrrolidone (NMP, VWR International), and site-specific cleavage of the NPPOC protection group was accomplished by irradiation of an image created by a Digital Micro-Mirror Device (Texas Instruments, SXGA+ resolution), projecting 365 nm wavelength light. Coupling cycles were repeated to synthesize the full in silico-generated peptide library. Prior to sample binding, final removal of side-chain protecting groups was performed in 95% trifluoroacetic acid (TFA, Sigma Aldrich), 0.5% Triispropylsilane (TIPS, TCI Chemicals) for 30 min.
Processing and analysis of peptide arrays
Arrays were incubated 2X in methanol for 30 s and rinsed 4X with reagent-grade water (Ricca Chemical Co.). Arrays were washed for 1 min in TBST (1× TBS, 0.05% Tween-20), washed 2X for 1 min in TBS, and exposed to a final wash for 30 s in reagent-grade water.
Samples were diluted 1:100 in binding buffer (0.01M Tris-Cl, pH 7.4, 1% alkali-soluble casein (Novagen, EMD chemicals, San Diego, CA), 0.05% Tween-20) and bound to arrays overnight at 4°C. After sample binding, the arrays were washed 3X in wash buffer (1X TBS, 0.05% Tween-20), 10 min per wash. Primary sample binding was detected via Alexa Fluor® 647-conjugated goat anti-human IgG secondary antibody (Jackson ImmunoResearch). The secondary antibody was diluted 1:10,000 (final concentration 0.1 ng/µl) in secondary binding buffer (1X TBS, 1% alkali-soluble casein, 0.05% Tween-20). Arrays were incubated with secondary antibody for 3 h at room temperature, then washed 3X in wash buffer (10 min per wash) and 30 sec in reagent-grade water. Fluorescent signal of the secondary antibody was detected by scanning at 635 nm at 2 µm resolution and 15% gain, using an MS200 microarray scanner (Roche NimbleGen).
R (version 3.2.0) and SAS 9.3 (SAS Institute) was used for statistical analysis of the data using high-throughput computing clusters. The intensity value of Ig binding to peptide was extracted from peptide arrays and a background correction was applied (27). 2-D Loess was used for the spatial correction. The extracted intensity levels were quantile normalized to remove variations between arrays. The data was log2 transformed to stabilize the variance.
Given the large number of peptides synthesized and randomly distributed on the array, false discovery was reduced by searching for concordant reactivity among peptides with overlapping sequences. Overlapping peptides that exhibited significant reactivity difference based on student’s T test between cases and controls were designated “hot spots”. The requirements for peptides to be included in a hot spot were a p value less than 0.05 and fold change having the same sign and its absolute value greater than 1.5 between cases and controls for each of the neighboring peptides.
Hot spots were further evaluated at the protein level. We focused primarily on proteins with at least three hot spots. In this study, protein expression level for each subject was represented by the total sum of the hot spot peptide expression levels within this protein.
TCGA data analysis
Level 3 RNAseq data as well as clinical information for Lung Adenocarcinoma (LUAD) and Lung Squamous Cell Carcinoma (LUSC) were downloaded from the TCGA data portal using TCGA2STAT package in R. Expression data was log2 transformed to stabilize the variance with addition of a value of 1 to avoid taking the log2 of zero. To remove potential batch effects, expression data was subjected to quantile normalization. The differential expression between tumor and adjacent normal tissue was done by means of Mann Whitney test.
Mass spectrometry analysis
Pre-diagnostic sera from an independent set of 42 pre-diagnostic NSCLC samples were combined into four pools for protein identification by mass spectrometry analysis. IgG bound proteins were extracted with Protein A/G Agarose (Thermo Scientific, #20421 20422 20423). The Ig bound and Ig free fractions were further fractionated at the protein level by reverse-phase chromatography followed by desalting for 5 min with 95% mobile-phase A (0.1% TFA in 95% H2O) at a flow rate of 3 mL/min. Proteins were eluted and collected into 12 fractions, at a flow rate of 2.1 mL/min with a gradient elution which included an increase from 5% to 70% mobile phase B (0.1% TFA in 95% ACN) over 25 min, 70% to 95% mobile phase B for 3 min, a wash step to hold at 95% mobile phase B for 2 min and a re-equilibration step at 95% mobile phase A for 5 min. The collected fractions were lyophilized and digested with trypsin prior to analysis by mass spectrometry using a SYNAPT G2-S instrument and Waters Masslynx (version 4.1, SCN 851). The mass spectrometer was operated in V-mode with a typical resolving power of at least 20,000. All analyses were performed using positive mode ESI using a NanoLockSpray source. The lock mass channel was sampled every 60 s. The mass spectrometer was calibrated with a fibrinopeptide solution (300 fmol/µL) delivered through the reference sprayer of the NanoLockSpray source. Accurate mass LC-HDMSE data was collected in an alternating, low energy (MS) and high energy (28) mode of acquisition with mass scan range from m/z 50 to 1800. The spectral acquisition time in each mode was 1.0 s with a 0.1-s inter-scan delay. In low energy HDMS mode, data was collected at constant collision energy of 2 eV in both Trap cell and Transfer cell. In high energy HDMSE mode, the collision energy was ramped from 25 to 55 eV in the Transfer cell only. The RF applied to the quadrupole mass analyzer was adjusted such that ions from m/z 300 to 2000 were efficiently transmitted, ensuring that any ions observed in the LC-HDMSE data less than m/z 300 were known to arise from dissociations in the Transfer collision cell. The acquired LC-HDMSE data was processed and searched against protein knowledge database (Uniprot) through ProteinLynx Global Server (PLGS, Waters Company) with False Discovery Rate 4%.
Results
Cumulative reactivity at the protein level
The schema for array analysis is presented in Figure 1. The tiled peptides synthesized, representing 20,193 proteins encoded in the human genome, were randomly distributed in the array. To assess the extent of non-specific reactivity among cases and controls and to optimize the design of data analysis, a total of 4,547 random peptides were synthesized on the array. Analysis of this cohort of cases and controls yielded a total of 212 (4.7%) random peptides that exhibited significant (p<0.05) differential reactivity between cases and controls. Receiver operator characteristic (ROC) analysis for reactivity among random peptides resulted in an Area Under the Curve (AUC) distribution centered at a median of 0.527 indicative of lack of appreciable differences in reactivity to random peptides between case and controls (Supplementary Figure 2)
Figure 1:

Workflow for processing and analysis of peptide arrays
Given that epitopes may be shorter than the full length of synthesized peptides and thus epitopes may occur in overlapping sequences, tiled consecutive peptides that exhibited significant reactivity differences based on student’s T test between cases and controls were designated “hot spots”. The requirements for consecutive peptides to be included in a hot spot were a p value of 0.05 or less and fold change having the same sign with absolute value greater than 1.5 between cases and controls for each peptide. Proteins that induce immunogenicity in cancer may encompass more than one antigenic epitope. Therefore to identify the most reactive proteins, we conducted an analysis based on occurrence of three or more hot spots of reactivity in proteins. We examined differences in overall IgG levels between cases and controls that may impact binding to arrayed peptides. Cases and controls did not exhibit significantly different levels of IgG. Albumin concentrations may also impact Ig deposition on arrayed peptides. Likewise there was no significant difference in albumin levels between cases and controls.
Analysis of the full set of samples revealed 48 proteins with three or more reactive hot spots among cases and no hot spots among controls (Table 1). In contrast only 14 proteins exhibited three or more reactive hot spots among controls and none among cases (Supplementary Table 2). To evaluate whether the number of reactive proteins among cases (n=48) differed from that among controls (n=14), we performed a binomial test. The null hypothesis of the binomial test assumed that the number of reactive proteins among cases vs among controls was the same. This test was conducted in R by binom.test function with number of successes, number of trials and hypothesized probability of success set at 48, 61(48+14) and 0.5 respectively. The p value of the difference was <0.0001 indicating that reactive proteins were significantly higher among cases. We also conducted a permutation test keeping the peptide intensity and the position for each protein intact, but randomly assigning the sample labels as case or control. The number of cases randomly assigned was equal to the number of cases we observed from real data. The hot spots were subsequently evaluated in this resampling dataset. A total of 500 repeats were performed and the distribution of hot spots with the sample reshuffling was created. A p value was calculated based on this empirical distribution and the hot spots we observed based on the original sample designation. A set of 62 proteins were found to occur under random chance, taking into account protein size which further confirmed the significance of the findings (Supplementary Table 3).
Table 1.
AUCs of proteins with three or more hot spots higher in cases and their occurrence in the Ig bound and Ig free fractions by mass spectrometry
| Protein | Full Name | Hot spots per protein | Protein AUC | MS Ig Bound | MS Ig Free |
|---|---|---|---|---|---|
| CEP350 | centrosomal protein 350 | 3 | 0.7246 | Neg | Pos |
| SH3KBP1 | SH3 domain containing kinase binding protein 1 | 4 | 0.722 | Neg | Pos |
| EPS15 | epidermal growth factor receptor pathway substrate 15 | 3 | 0.7219 | Neg | Pos |
| ARHGAP33 | Rho GTPase activating protein 33 | 3 | 0.7216 | Pos | Pos |
| MKI67 | marker of proliferation Ki-67 | 4 | 0.7158 | Neg | Pos |
| AHNAK | AHNAK nucleoprotein | 5 | 0.7152 | Pos | Pos |
| HIVEP1 | human immunodeficiency virus type I enhancer binding protein 1 | 3 | 0.7137 | Neg | Pos |
| MUC17 | mucin 17, cell surface associated | 3 | 0.713 | Pos | Neg |
| PCNXL3 | Pecanex-like protein 3 | 3 | 0.7097 | Neg | Pos |
| TPX2 | TPX2, microtubule nucleation factor | 3 | 0.6987 | Neg | Pos |
| FGD5 | FYVE, RhoGEF and PH domain containing 5 | 3 | 0.696 | Neg | Neg |
| EPPK1 | epiplakin 1 | 6 | 0.6954 | Neg | Pos |
| ZNF687 | zinc finger protein 687 | 3 | 0.6945 | Neg | Pos |
| TNXB | tenascin XB | 3 | 0.6942 | Pos | Pos |
| CAMSAP2 | calmodulin regulated spectrin associated protein family member 2 | 3 | 0.6936 | Pos | Neg |
| CTAG1A | cancer/testis antigen 1A | 3 | 0.6916 | Neg | Neg |
| KIFC1 | kinesin family member C1 | 3 | 0.6901 | Neg | Pos |
| SIPA1L3 | signal induced proliferation associated 1 like 3 | 4 | 0.6886 | Neg | Pos |
| FAM13A | family with sequence similarity 13 member A | 3 | 0.6883 | Neg | Neg |
| SOX4 | SRY-box 4 | 3 | 0.6867 | Pos | Pos |
| CTAG2 | cancer/testis antigen 2 | 3 | 0.6864 | Neg | Neg |
| KIF13B | kinesin family member 13B | 3 | 0.6864 | Pos | Neg |
| SMG1 | Serine/Threonine-Protein Kinase SMG1 | 4 | 0.6859 | Pos | Neg |
| BPTF | bromodomain PHD finger transcription factor | 4 | 0.6835 | Neg | Pos |
| ARFGEF3 | ARFGEF family member 3 | 4 | 0.6816 | Neg | Neg |
| SPTY2D1 | SPT2 chromatin protein domain containing 1 | 3 | 0.6814 | Neg | Pos |
| SNX18 | sorting nexin 18 | 3 | 0.6801 | Neg | Pos |
| ABCA13 | ATP binding cassette subfamily A member 13 | 3 | 0.6776 | Pos | Pos |
| GPATCH8 | G-patch domain containing 8 | 3 | 0.6748 | Pos | Pos |
| MED14 | mediator complex subunit 14 | 3 | 0.6742 | Pos | Neg |
| PLEKHH2 | pleckstrin homology, MyTH4 and FERM domain containing H2 | 3 | 0.6731 | Neg | Neg |
| EML3 | echinoderm microtubule associated protein like 3 | 3 | 0.6711 | Neg | Pos |
| MAPK8IP3 | mitogen-activated protein kinase 8 interacting protein 3 | 3 | 0.6691 | Neg | Pos |
| EIF5B | eukaryotic translation initiation factor 5B | 3 | 0.6672 | Neg | Neg |
| ALMS1 | ALMS1, centrosome and basal body associated protein | 3 | 0.6641 | Pos | Neg |
| GCC2 | GRIP and coiled-coil domain containing 2 | 3 | 0.662 | Pos | Neg |
| TIMELESS | timeless circadian regulator | 3 | 0.6615 | Pos | Pos |
| PDE4DIP | phosphodiesterase 4D interacting protein | 3 | 0.6612 | Neg | Pos |
| TNS1 | tensin 1 | 3 | 0.6529 | Pos | Neg |
| ATP1A4 | ATPase Na+/K+ transporting subunit alpha 4 | 3 | 0.6497 | Pos | Neg |
| RAD26L | DNA excision repair protein ERCC-6-like 2 | 3 | 0.6497 | Pos | Pos |
| COL12A1 | collagen type XII alpha 1 chain | 3 | 0.6493 | Pos | Pos |
| HRNR | hornerin | 5 | 0.6479 | Pos | Neg |
| DCHS2 | dachsous cadherin-related 2 | 3 | 0.6444 | Pos | Pos |
| CR1 | complement C3b/C4b receptor 1 (Knops blood group) | 5 | 0.6377 | Neg | Pos |
| PLCE1 | phospholipase C epsilon 1 | 3 | 0.636 | Neg | Neg |
| GOLGA6L4 | golgin A6 family-like 4 | 3 | 0.611 | Pos | Pos |
| FSCB | fibrous sheath CABYR binding protein | 6 | 0.6048 | Neg | Pos |
The statistical analysis based on hot spots alleviates the independency requirement for statistical significance of neighboring peptides. To be considered a hot spot neighboring peptides have to exhibit statistical significance as well as concordance in the direction of fold change in cases vs controls. We derived probabilities for proteins displaying three hot spots. For hot spots consisting of two tiling peptides, each with a p value less than 0.05 and having the same direction of fold change, the probability of random occurrence of a hot spot is 0.05 × 0.05 × 0.5 = 0.00125 (X 0.5 accounts for the same direction of fold change). Of 2,781,902 peptides on the array, there is an expectation of 3,478 (2,781,902 × 0.00125) hot spots on a random chance. In our study, we found a total of 5,556 hot spots. Given that the array consisted of 20,193 proteins, the average number of hot spots per protein would be 0.172 (3,478/20,193). We considered that the number of hot spots per protein follows a Poisson distribution with an average of 0.172. The probability that a protein would encompass two hot spots is P(X=2) = 0.01245 and for three hot spots P(X=3) = 0.00071. Under random chance, the number of proteins containing 3 hot spots is ~14 ( 20,193 × 0.00071 = 14.34). Our analysis revealed 48 proteins with three or more reactive hot spots among cases with no hot spots among controls which exceeds random expectations and only 14 proteins which exhibited three or more reactive hot spots among controls and none among cases which is consistent with random expectations.
We analyzed using mass spectrometry the occurrence in circulation of the set of 48 proteins with three or more hot spots among cases and of the 14 proteins with three or more hot spots among controls using a subset of 42 pre-diagnostic samples combined into four pools (Table 1). Sera were immuno-depleted of Ig and the Ig containing fraction and the Ig depleted fraction were analyzed separately. A total of 2,158 proteins were identified in one or both fractions that included 40 of the 48 proteins with three or more hot spots among cases. A total of 419 proteins were identified in the Ig fraction including 21 of the 48 proteins. Ten of the 21 proteins were identified exclusively in the Ig bound fraction (Table 1). Two of the 14 proteins with more than three hot spots in controls and none in cases (MUC5AC and RNF17) were found each in one Ig depleted fraction and none in an Ig bound fraction.
Nine of the 48 proteins with reactivity among cases yielded AUCs > 0.7, whereas only one of the 14 proteins which exhibited three or more reactive hot spots among controls yielded an AUC >0.7. We tested whether the nine proteins have complementary performance in the entire set of samples analyzed, which resulted in a combined AUC = 0.942 (CI 0.909-0.976) confirming complementary performance. (Figure 2). Interestingly, one protein MUC5AC exhibited 8 hot spots that were higher in controls compared to cases. The hot spots shared the same sequence motif. A protein sequence blast search revealed a high degree of homology with a sequence in Saccharomyces cerevisiae.
Figure 2:

Combined performance of top nine proteins with AUCs >0.7 in the entire dataset
We performed network analysis of proteins with three hot spots among cases and proteins with hot spots among controls using Ingenuity Pathway Analysis. We found that the top two networks among cases included major nodes of EGFR and ESR1, whereas no discernable networks with major nodes were observed among controls (Supplementary Figure 3). We also performed Gene set enrichment analysis (GSEA) for canonical pathways which encompassed 1,320 pathways. Since GSEA requires the whole genome as input for enrichment analysis, we calculated the log2(hot spot_ratio) for each protein. The log2(hot spot_ratio) was computed by log2 transformed of the ratio between the number of hot spots higher in cases vs the number of hot spots higher in controls. To avoid dividing zero by zero, values were increased by 0.5. Two canonical pathways reached statistical significance that were enriched in cases with FDR q-value less than 0.05 consisting of REACTOME_CHEMOKINE_RECEPTORS_BIND_CHEMOKINES” and “REACTOME_GABA_RECEPTOR_ACTIVATION”). Interstingly the “REACTOME_DEFENSINS” was enriched in controls (Supplementary Table 4).
Distinct autoantibody reactivity in adenocarcinoma and squamous cell lung cancer
Adenocarcinoma and squamous cell carcinoma are two dominant subtypes of lung cancer. We examined the occurrence of hot spots in these two major sub-types. A total of 29 proteins exhibited two or more hot spots in both adenocarcinoma and squamous lung cancer compared to controls eight of which were found bound to Ig in lung cancer sera (Table 2).
Table 2.
AUCs of proteins with two or more hot spots in common between adenocarcinoma and squamous carcinoma and their occurrence in the Ig bound and Ig free fractions by mass spectrometry
| Protein | Full Name | Hot spots (squamous) | Hot spots (adeno) | AUC (adeno) | AUC (squamous) | MS Ig bound | MS Ig free |
|---|---|---|---|---|---|---|---|
| ELMSAN1 | ELM2 and Myb/SANT domain containing 1 | 2 | 2 | 0.7879 | 0.8022 | Neg | Neg |
| RP1L1 | RP1 like 1 | 2 | 2 | 0.7396 | 0.7978 | Neg | Pos |
| AHNAK2 | AHNAK nucleoprotein 2 | 2 | 3 | 0.8570 | 0.7946 | Pos | Pos |
| DCHS1 | dachsous cadherin-related 1 | 2 | 2 | 0.7623 | 0.7935 | Pos | Pos |
| ANKRD6 | ankyrin repeat domain 6 | 2 | 2 | 0.7434 | 0.7935 | Neg | Pos |
| INO80D | INO80 complex subunit D | 2 | 2 | 0.7301 | 0.7774 | neg | Pos |
| CDH23 | cadherin related 23 | 2 | 2 | 0.7273 | 0.7753 | Pos | Pos |
| PCDHA1 | protocadherin alpha-1 | 2 | 2 | 0.7301 | 0.7688 | Neg | Pos |
| KIF24 | kinesin family member 24 | 2 | 2 | 0.7405 | 0.7667 | Neg | Pos |
| NCKAP5 | NCK associated protein 5 | 2 | 3 | 0.8059 | 0.7613 | Neg | Pos |
| DDX24 | DEAD-box helicase 24 | 2 | 2 | 0.7784 | 0.7570 | Neg | Neg |
| USP42 | ubiquitin specific peptidase 42 | 2 | 3 | 0.8343 | 0.7527 | Neg | Pos |
| MED13 | mediator complex subunit 13 | 2 | 2 | 0.7254 | 0.7473 | Neg | Pos |
| ZNF831 | zinc finger protein 831 | 2 | 2 | 0.7614 | 0.7452 | Neg | Neg |
| ZMYM4 | zinc finger MYM-type containing 4 | 3 | 2 | 0.7614 | 0.7441 | Neg | Pos |
| ABI3BP | ABI family member 3 binding protein | 2 | 2 | 0.7576 | 0.7430 | Neg | Pos |
| CREBBP | CREB binding protein | 2 | 3 | 0.7917 | 0.7419 | Neg | Pos |
| PTK2 | protein tyrosine kinase 2 | 2 | 2 | 0.8097 | 0.7376 | Pos | Pos |
| RAB11FIP1 | RAB11 family interacting protein 1 | 2 | 3 | 0.7765 | 0.7376 | Neg | Neg |
| MYH7B | myosin heavy chain 7B | 3 | 2 | 0.7017 | 0.7290 | Pos | Pos |
| CAPRIN1 | cell cycle associated protein 1 | 2 | 2 | 0.7699 | 0.7258 | Neg | Neg |
| MCM4 | minichromosome maintenance complex component 4 | 2 | 2 | 0.7273 | 0.7065 | Neg | Neg |
| HELZ2 | helicase with zinc finger 2 | 2 | 2 | 0.8068 | 0.7000 | Neg | Neg |
| KIF21A | kinesin family member 21A | 2 | 2 | 0.7803 | 0.6968 | Neg | Neg |
| CHD1 | chromodomain helicase DNA binding protein 1 | 2 | 2 | 0.7699 | 0.6968 | Pos | Pos |
| SIPA1 | signal-induced proliferation-associated 1 | 2 | 2 | 0.7443 | 0.6957 | Pos | Pos |
| SOGA2 | microtubule cross-linking factor 1 | 2 | 2 | 0.7718 | 0.6871 | Pos | Pos |
| TCHH | trichohyalin | 2 | 2 | 0.7008 | 0.6860 | Neg | Neg |
| CLIP2 | CAP-Gly domain containing linker protein 2 | 2 | 2 | 0.7112 | 0.6710 | Neg | Neg |
In contrast, a total of 63 proteins encompassed three or more epitopes that were distinct for squamous cell lung cancer and 34 proteins encompassed three or more epitopes that were distinct for lung adenocarcinoma (Supplementary Tables 5, 6). Mass spectrometry analysis resulted in the identification in circulation of 46 of the 63 proteins with three or more epitopes in squamous lung cancer cases, 23 of which were identified in the Ig bound serum fraction (Supplementary Table 5). 15 of the 34 proteins with three or more epitopes in adenocarcinoma cases were identified in the Ig bound fraction (Supplementary Table 6).
Autoantibodies to hornerin (HRNR) in squamous lung cancer
A striking finding was the occurrence in one protein, hornerin (HRNR), of 11 hot spots which were higher in squamous carcinoma, three of which were also higher in adenocarcinoma. HRNR yielded an AUC of 0.65 among all cases relative to controls and an AUC of 0.79 among squamous cases only relative to controls. These hot spots represented repeat sequences in the protein (Figure 3). To determine whether the increased performance of HRNR in squamous relative to non-squamous lung cancer was related to increased expression of HRNR in squamous lung cancer, we examined TCGA data to determine RNA based expression levels of HRNR in lung cancer. Increased expression in tumor tissue relative to non-tumor tissue was observed in squamous lung cancer in contrast to adenocarcinoma, concordant with increased autoantibody reactivity observed with the peptide array (Figure 4). A protein sequence blast search revealed a high degree of similarity between HRNR and filaggrin (FLG). Interestingly the peptide array data revealed the occurrence of 4 hot spots in FLG also in squamous cell carcinoma with an AUC of 0.75 for cases compared to controls (Supplementary Table 5).
Figure 3.

Hot spots representing repeat sequences in HRNR.
Figure 4.

RNA based expression levels of HRNR in the TCGA lung (A) squamous cell carcinoma and (B) adenocarcinoma dataset
Autoantibody reactivity to p53 and Annexin peptides
The criteria applied at the protein level to reduce false discovery, namely three or more hot spots, likely filtered out proteins with epitopes associated with autoantibodies but with fewer than three hot spots. An additional set of 314 proteins exhibited two hot spots among cases relative to controls (Supplementary table 7). We therefore explored among proteins with two hot spots the occurrence of p53 and annexins A1 and A2 have been associated with autoantibodies in lung cancer in multiple studies, with p53 autoantibodies occurring in lung cancer irrespective of subtype and annexin autoantibodies occurring predominantly in lung adenocarcinoma (29–31). Two p53 hot spots were found among lung cancer cases that resulted in an AUC for p53 of 0.63. Hot spots were also found in Annexins A1 and A2 in adenocarcinoma that yielded AUCs of 0.78 and 0.76 respectively (Figure 5).
Figure 5.
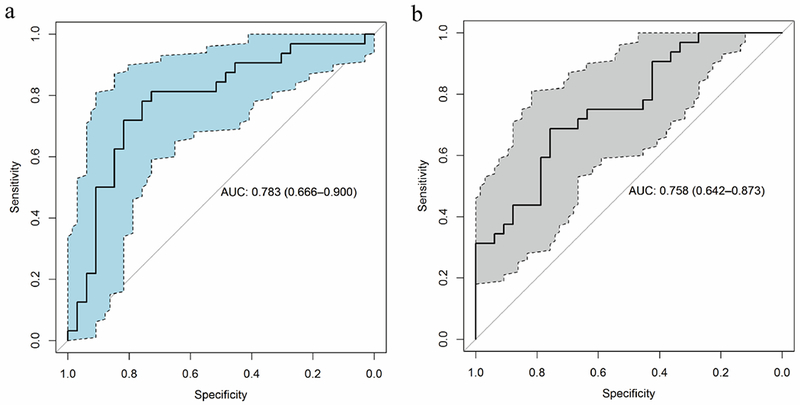
A. Annexin A1 peptide performance in lung adenocarcinomas vs controls B. Annexin A2 peptide performance in lung adenocarcinomas vs controls
Discussion
There are several novel features in our study. They include: 1- interrogation of tiled peptides derived from the entire coding sequences in the genome to search for epitopes that trigger an autoantibody response in lung cancer; 2- Reliance on samples collected before onset of symptoms and diagnosis by accessing samples from a cohort of subjects at increased risk for lung cancer; and 3- interrogation of lung cancer sera by mass spectrometry for the occurrence of autoantibodies to proteins that encompassed reactive peptides in lung cancer. Our findings suggest the occurrence of proteins with reactive peptides in common among the two major subtypes of lung cancer as well as occurrence of proteins with reactive peptides that were particularly associated with either squamous or adenocarcinoma.
Mass spectrometry analysis provided supportive evidence for immunoglobulin binding in circulation for some of the proteins associated with reactive peptide hot spots. However not all proteins with reactive hot spots were found to be bound to immunoglobulins in circulation. The lack of binding may be accounted for in part as a result of 1- specific binding to peptides and not to intact protein following protein processing thus limiting the ability to detect such binding by mass spectrometry as done in this study; 2- lack of antigen in circulation; and 3- the antigen bound to antibody in circulation is below the limit of detection.
A striking finding was the occurrence of 11 peptide hot spots in Hornerin in squamous lung cancer samples. The fact that these hot spots represent repeat sequences provides strong evidence for the analytical performance of the peptide array. The independent evidence based on TCGA data that Hornerin overexpression in lung cancer is particularly associated with the squamous cell subtype provides supportive evidence of the biological significance of the reactivity data observed using the whole genome derived peptide array. Further evidence of the biological significance of peptide reactivity stems from the concordant data for Hornerin and Filagrin, the latter also exhibiting four hot spots in squamous cell carcinoma.
Other evidence that supports the findings derived from the peptide array includes concordance of autoantibody reactivity between peptide array data and other data from the literature for previously investigated proteins. The latter notably include p53 and annexin proteins for which hot spots were observed in the peptide array data. Other proteins that exhibited peptide reactivity in cases have been associated with autoimmunity as in the case of AHNAK and KIF proteins (32,33) or with occurrence of autoantibodies in other cancer types as in the case of zinc finger proteins which have been associated with autoantibodies in colorectal cancer (34) and PDP4DIP which has been associated with autoantibodies in esophageal cancer (35). We examined the occurrence of the proteins with three or more reactive hot spots among NSCLC cases and the proteins that encompassed three or more epitopes in lung adenocarcinoma in previously analyzed proteomes of 45 lung adenocarcinoma cell lines (36,37). All proteins were identified among the cell lines. In contrast, of the 14 proteins with three hot spots among controls, only MUC5Ac and MUC5B were found to be expressed in lung adenocarcinoma cell lines. Interestingly MUC5Ac and MUC5B are associated with lung and airway inflammation and the occurrence of autoantibodies to these proteins among smokers may have biological relevance (38).
Peptide arrays provide the opportunity to capture epitopes that may not be readily captured in total protein recombinants if the epitopes are not accessible. Likewise recombinant proteins may display epitopes that may not be captured at the peptide level. We compared reactive proteins in our study with reactive proteins in a recombinant protein array study of lung cancer sera (39) which reported a panel of eight validated recombinants. Two of the proteins (CTAG1A and TP53) were associated with autoantibodies in our study. In contrast to our study which relied on samples collected prior to diagnosis as part of a population study, the lung cancer samples utilized in the recombinant protein study were from clinically diagnosed patients.
The nine proteins in our study with AUCs greater than 0.7 among all cases relative to controls yielded a combined AUC of 0.942. Given that the sample set was derived from subjects whose blood was collected up to a year prior to diagnosis, the observed performance supports the utility of the peptide array approach for early detection applications. Moreover the occurrence of additional peptides which exhibited reactivity that was specific to lung cancer subtypes suggests an approach in which a peptide panel is assembled that represents the best performing peptides including subtype specific peptides. A far reaching application of the peptide array approach would be elucidation of the repertoire of peptides that are associated with selective autoantibody reactivity for common cancers, thus providing a simple and effective tool for cancer screening.
Supplementary Material
State of Significance
This study provides a modality for early diagnosis of NSCLC for precision oncology that can be applied to other cancer types.
Acknowledgements
Funding support was provided by the National Cancer Institute’s Early Detection program; U01 CA63673 and UM1 CA167462, the Canary Foundation, S. Hanash recipient PI; the Lungevity Foundation, S. Hanash recipient PI; the Department of Defense (DOD) Congressionally Mandated Lung Cancer Research program, and the MD Anderson Moonshot program.
Footnotes
Conflict of interest: None.
References
- 1.Leypoldt F, Wandinger KP. Paraneoplastic neurological syndromes. Clin Exp Immunol 2014;175:336–48 [DOI] [PMC free article] [PubMed] [Google Scholar]
- 2.Tschernatsch M, Gross O, Kneifel N, Kaps M, Blaes F. SOX-1 autoantibodies in patients with paraneoplastic neurological syndromes. Autoimmun Rev 2009;8:549–51 [DOI] [PubMed] [Google Scholar]
- 3.Katayama H, Boldt C, Ladd JJ, Johnson MM, Chao T, Capello M, et al. An Autoimmune Response Signature Associated with the Development of Triple-Negative Breast Cancer Reflects Disease Pathogenesis. Cancer Res 2015;75:3246–54 [DOI] [PMC free article] [PubMed] [Google Scholar]
- 4.Ladd JJ, Chao T, Johnson MM, Qiu J, Chin A, Israel R, et al. Autoantibody signatures involving glycolysis and splicesome proteins precede a diagnosis of breast cancer among postmenopausal women. Cancer Res 2013;73:1502–13 [DOI] [PMC free article] [PubMed] [Google Scholar]
- 5.Macdonald IK, Parsy-Kowalska CB, Chapman CJ. Autoantibodies: Opportunities for Early Cancer Detection. Trends Cancer 2017;3:198–213 [DOI] [PubMed] [Google Scholar]
- 6.Chapman C, Murray A, Chakrabarti J, Thorpe A, Woolston C, Sahin U, et al. Autoantibodies in breast cancer: their use as an aid to early diagnosis. Ann Oncol 2007;18:868–73 [DOI] [PubMed] [Google Scholar]
- 7.Desmetz C, Bascoul-Mollevi C, Rochaix P, Lamy PJ, Kramar A, Rouanet P, et al. Identification of a new panel of serum autoantibodies associated with the presence of in situ carcinoma of the breast in younger women. Clin Cancer Res 2009;15:4733–41 [DOI] [PubMed] [Google Scholar]
- 8.Goodell V, Disis ML. Human tumor cell lysates as a protein source for the detection of cancer antigen-specific humoral immunity. J Immunol Methods 2005;299:129–38 [DOI] [PubMed] [Google Scholar]
- 9.Lu H, Goodell V, Disis ML. Humoral immunity directed against tumor-associated antigens as potential biomarkers for the early diagnosis of cancer. J Proteome Res 2008;7:1388–94 [DOI] [PubMed] [Google Scholar]
- 10.Bouwman K, Qiu J, Zhou H, Schotanus M, Mangold LA, Vogt R, et al. Microarrays of tumor cell derived proteins uncover a distinct pattern of prostate cancer serum immunoreactivity. Proteomics 2003;3:2200–7 [DOI] [PubMed] [Google Scholar]
- 11.Hong SH, Misek DE, Wang H, Puravs E, Giordano TJ, Greenson JK, et al. An autoantibody-mediated immune response to calreticulin isoforms in pancreatic cancer. Cancer Research 2004;64:5504–10 [DOI] [PubMed] [Google Scholar]
- 12.Madoz-Gurpide J, Kuick R, Wang H, Misek DE, Hanash SM. Integral protein microarrays for the identification of lung cancer antigens in sera that induce a humoral immune response. Mol Cell Proteomics 2008;7:268–81 [DOI] [PubMed] [Google Scholar]
- 13.Nam MJ, Kee MK, Kuick R, Hanash SM. Identification of defensin alpha6 as a potential biomarker in colon adenocarcinoma. J Biol Chem 2005;280:8260–5 [DOI] [PubMed] [Google Scholar]
- 14.Nam MJ, Madoz-Gurpide J, Wang H, Lescure P, Schmalbach CE, Zhao R, et al. Molecular profiling of the immune response in colon cancer using protein microarrays: occurrence of autoantibodies to ubiquitin C-terminal hydrolase L3. Proteomics 2003;3:2108–15 [DOI] [PubMed] [Google Scholar]
- 15.Pereira-Faca S, Qiu J, Krasnoselsky A, Newcomb L, Hanash S. Proteomic identification of tumor antigens in lung cancer. Molecular & Cellular Proteomics 2005;4:S125–S [Google Scholar]
- 16.Qiu J, Choi G, Li L, Wang H, Pitteri SJ, Pereira-Faca SR, et al. Occurrence of autoantibodies to annexin I, 14-3-3 theta and LAMR1 in prediagnostic lung cancer sera. J Clin Oncol 2008;26:5060–6 [DOI] [PMC free article] [PubMed] [Google Scholar]
- 17.Anderson KS, Sibani S, Wallstrom G, Qiu J, Mendoza EA, Raphael J, et al. Protein microarray signature of autoantibody biomarkers for the early detection of breast cancer. J Proteome Res 2011;10:85–96 [DOI] [PMC free article] [PubMed] [Google Scholar]
- 18.Babel I, Barderas R, Diaz-Uriarte R, Martinez-Torrecuadrada JL, Sanchez-Carbayo M, Casal JI. Identification of tumor-associated autoantigens for the diagnosis of colorectal cancer in serum using high density protein microarrays. Mol Cell Proteomics 2009;8:2382–95 [DOI] [PMC free article] [PubMed] [Google Scholar]
- 19.Massoner P, Lueking A, Goehler H, Hopfner A, Kowald A, Kugler KG, et al. Serum-autoantibodies for discovery of prostate cancer specific biomarkers. Prostate 2012;72:427–36 [DOI] [PubMed] [Google Scholar]
- 20.Babel I, Barderas R, Diaz-Uriarte R, Moreno V, Suarez A, Fernandez-Acenero MJ, et al. Identification of MST1/STK4 and SULF1 proteins as autoantibody targets for the diagnosis of colorectal cancer by using phage microarrays. Mol Cell Proteomics 2011;10:M110 001784 [DOI] [PMC free article] [PubMed] [Google Scholar]
- 21.Chang W, Wu L, Cao F, Liu Y, Ma L, Wang M, et al. Development of autoantibody signatures as biomarkers for early detection of colorectal carcinoma. Clin Cancer Res 2011;17:5715–24 [DOI] [PubMed] [Google Scholar]
- 22.Tamesa MS, Kuramitsu Y, Fujimoto M, Maeda N, Nagashima Y, Tanaka T, et al. Detection of autoantibodies against cyclophilin A and triosephosphate isomerase in sera from breast cancer patients by proteomic analysis. Electrophoresis 2009;30:2168–81 [DOI] [PubMed] [Google Scholar]
- 23.Houseman BT, Huh JH, Kron SJ, Mrksich M. Peptide chips for the quantitative evaluation of protein kinase activity. Nat Biotechnol 2002;20:270–4 [DOI] [PubMed] [Google Scholar]
- 24.Jarboe JS, Jaboin JJ, Anderson JC, Nowsheen S, Stanley JA, Naji F, et al. Kinomic profiling approach identifies Trk as a novel radiation modulator. Radiother Oncol 2012;103:380–7 [DOI] [PMC free article] [PubMed] [Google Scholar]
- 25.Geysen HM, Meloen RH, Barteling SJ. Use of peptide synthesis to probe viral antigens for epitopes to a resolution of a single amino acid. Proc Natl Acad Sci U S A 1984;81:3998–4002 [DOI] [PMC free article] [PubMed] [Google Scholar]
- 26.Goodman GE, Thornquist MD, Balmes J, Cullen MR, Meyskens FL Jr., Omenn GS, et al. The Beta-Carotene and Retinol Efficacy Trial: incidence of lung cancer and cardiovascular disease mortality during 6-year follow-up after stopping beta-carotene and retinol supplements. J Natl Cancer Inst 2004;96:1743–50 [DOI] [PubMed] [Google Scholar]
- 27.Bolstad B PhD Dissertation: Low Level Analysis of High-density Oligonucleotide Array Data: Background, Normalization and Summarization. Berkeley: University of California, Berkeley; 2004. [Google Scholar]
- 28.Fanidi A, Muller DC, Yuan JM, Stevens VL, Weinstein SJ, Albanes D, et al. Circulating Folate, Vitamin B6, and Methionine in Relation to Lung Cancer Risk in the Lung Cancer Cohort Consortium (LC3). J Natl Cancer Inst 2018;110 [DOI] [PMC free article] [PubMed] [Google Scholar]
- 29.Li Y, Karjalainen A, Koskinen H, Hemminki K, Vainio H, Shnaidman M, et al. p53 autoantibodies predict subsequent development of cancer. Int J Cancer 2005;114:157–60 [DOI] [PubMed] [Google Scholar]
- 30.Tang ZM, Ling ZG, Wang CM, Wu YB, Kong JL. Serum tumor-associated autoantibodies as diagnostic biomarkers for lung cancer: A systematic review and meta-analysis. PLoS One 2017;12:e0182117. [DOI] [PMC free article] [PubMed] [Google Scholar]
- 31.Wang W, Zhong W, Chen C, Meng Q, Wei J. Circulating Antibodies to Linear Peptide Antigens Derived from ANXA1 and FOXP3 in Lung Cancer. Anticancer Res 2017;37:3151–5 [DOI] [PubMed] [Google Scholar]
- 32.Matsudaira R, Takeuchi K, Takasaki Y, Yano T, Matsushita M, Hashimoto H. Relationships between autoantibody responses to deletion mutants of Ki antigen and clinical manifestations of lupus. J Rheumatol 2003;30:1208–14 [PubMed] [Google Scholar]
- 33.Skoldberg F, Ronnblom L, Thornemo M, Lindahl A, Bird PI, Rorsman F, et al. Identification of AHNAK as a novel autoantigen in systemic lupus erythematosus. Biochem Biophys Res Commun 2002;291:951–8 [DOI] [PubMed] [Google Scholar]
- 34.O’Reilly JA, Fitzgerald J, Fitzgerald S, Kenny D, Kay EW, O’Kennedy R, et al. Diagnostic potential of zinc finger protein-specific autoantibodies and associated linear B-cell epitopes in colorectal cancer. PLoS One 2015;10:e0123469. [DOI] [PMC free article] [PubMed] [Google Scholar]
- 35.Shimada H, Kuboshima M, Shiratori T, Nabeya Y, Takeuchi A, Takagi H, et al. Serum anti-myomegalin antibodies in patients with esophageal squamous cell carcinoma. Int J Oncol 2007;30:97–103 [PubMed] [Google Scholar]
- 36.Celiktas M, Tanaka I, Tripathi SC, Fahrmann JF, Aguilar-Bonavides C, Villalobos P, et al. Role of CPS1 in Cell Growth, Metabolism and Prognosis in LKB1-Inactivated Lung Adenocarcinoma. J Natl Cancer Inst 2017;109:1–9 [DOI] [PMC free article] [PubMed] [Google Scholar]
- 37.Chen Y, Guo H, Terajima M, Banerjee P, Liu X, Yu J, et al. Lysyl Hydroxylase 2 Is Secreted by Tumor Cells and Can Modify Collagen in the Extracellular Space. J Biol Chem 2016;291:25799–808 [DOI] [PMC free article] [PubMed] [Google Scholar]
- 38.Bonser LR, Erle DJ. Airway Mucus and Asthma: The Role of MUC5AC and MUC5B. J Clin Med 2017;6 [DOI] [PMC free article] [PubMed] [Google Scholar]
- 39.Pan J, Song G, Chen D, Li Y, Liu S, Hu S, et al. Identification of Serological Biomarkers for Early Diagnosis of Lung Cancer Using a Protein Array-Based Approach. Molecular & cellular proteomics : MCP 2017;16:2069–78 [DOI] [PMC free article] [PubMed] [Google Scholar]
Associated Data
This section collects any data citations, data availability statements, or supplementary materials included in this article.