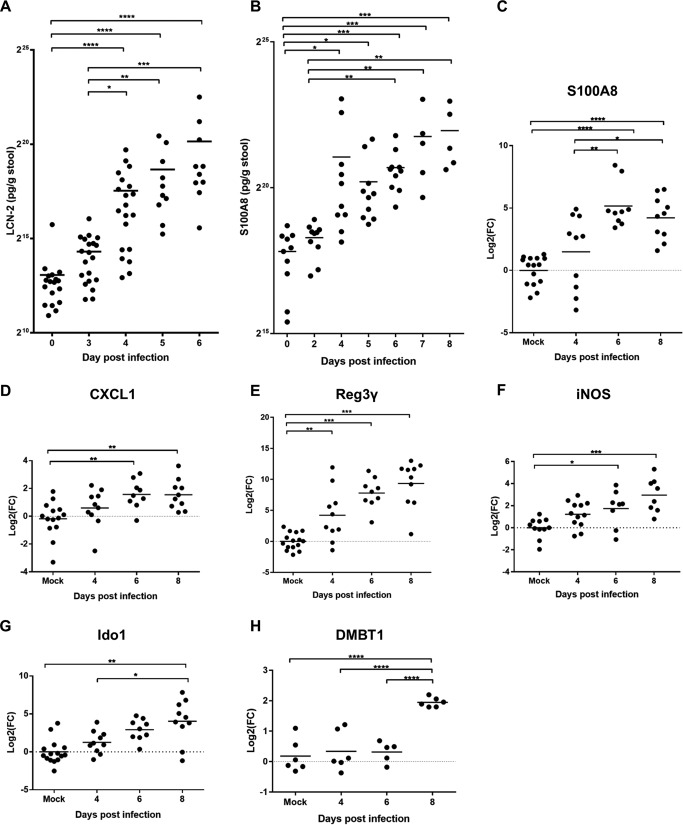
FIG 5.
Progression of IL-22 responses during the course of in vivo infection. LCN-2 (A) and S100A8 (B) measurements were determined by ELISA on homogenized stool samples collected at frequent intervals from the day of inoculation to a minimum of 6 DPI. Each dot represents a single mouse. Significance was determined using the Kruskal-Wallis multiple-comparison test. qRT-PCR analysis of S100A8 (C), CXCL-1 (D), Reg3γ (E), Ido1 (F), iNOS (G), and DMBT1 (H) expression levels in IECs enriched from mock-infected or infected colons at the time points indicated on the x axis. The data are shown as log2 fold changes from the average expression level in uninfected mice from the same biological experiment. Statistical significance was determined by Tukey’s multiple-comparison test. *, P < 0.05; **, P < 0.01; ***, P < 0.001; ****, P < 0.0001.

