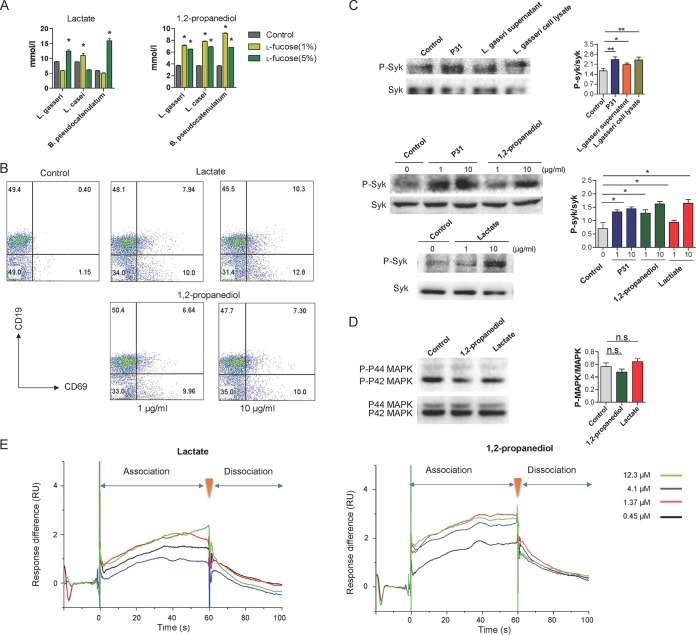
FIG 5.
Metabolites of l-fucose by Lactobacillus and Bifidobacterium evoke B cell activation in vitro. (A) The bacterial strains were first cultured in enrichment media (Table S3), and to observe the effects of l-fucose on their growth, they were inoculated in media without glucose and replaced by l-fucose at the indicated final concentrations. The strains cultured in sugar-free media were used as controls. The production of 1,2-propanediol and lactate in culture broth was measured by ELISA. Data are shown as mean ± SEM (n = 3). *, P < 0.05 compared with the control group. (B) Flow cytometry analysis of the proportion of B cells (CD19+ CD69+) activated by 1,2-propanediol and lactate in Peyer's patches (PPs) of mice. (C) The phosphorylation level of Syk in 3-83 B cells was assessed upon treatment of l-fucose metabolites. The blots were probed by anti-pSyk and anti-Syk Abs. Shown is densitometric analysis of the bands of pSyk normalized with Syk. Data are shown as mean ± SEM (n = 3). *, P < 0.05, and **, P < 0.01, compared with the control group. (D) The phosphorylation level of p42 and p44 isoforms of MAPK (Erk1 and Erk2, respectively) in 3-83 B cells was assessed. Shown is densitometric analysis of the bands of p42 and p44 MAPK normalized with MAPK. Data are shown as mean ± SEM (n = 3). n.s., not significant. (E) The interactions of BCR with 1,2-propanediol and lactate were analyzed by Biacore. Analytic concentrations (from top to bottom) are 12.3, 4.1, 1.37, and 0.45 μM.

