

Abstract
Determining the mechanisms that distinguish protective immunity from pathological chronic inflammation remains a fundamental challenge. miR‐132 has been shown to play largely immunoregulatory roles in immunity; however, its role in CD4+ T cell function is poorly understood. Here, we show that CD4+ T cells express high levels of miR‐132 and that T cell activation leads to miR‐132 up‐regulation. The transcriptomic hallmark of splenic CD4+ T cells lacking the miR‐132/212 cluster during chronic infection is an increase in mRNA levels of ribosomal protein (RP) genes. BTAF1, a co‐factor of B‐TFIID and novel miR‐132/212‐3p target, and p300 contribute towards miR‐132/212‐mediated regulation of RP transcription. Following infection with Leishmania donovani, miR‐132 −/− CD4+ T cells display enhanced expression of IL‐10 and decreased IFNγ. This is associated with reduced hepatosplenomegaly and enhanced pathogen load. The enhanced IL‐10 expression in miR‐132 −/− Th1 cells is recapitulated in vitro following treatment with phenylephrine, a drug reported to promote ribosome synthesis. Our results uncover that miR‐132/212‐mediated regulation of RP expression is critical for optimal CD4+ T cell activation and protective immunity against pathogens.
Keywords: Leishmania, microRNA, miR‐132, ribosomal proteins, Th cells
Subject Categories: Immunology; Microbiology, Virology & Host Pathogen Interaction; RNA Biology
Introduction
MicroRNAs (miRNAs) are endogenous small silencing RNAs with fundamental roles in the immune system 1. In this context, miR‐132‐3p (miR‐132) is derived from the miR‐212/132 cluster and has emerged as key regulator of immune cell development and function 1, 2. During innate immune activation, miR‐132 is induced upon and plays a crucial role in the transcriptional response to pathogenic challenge 3, 4, 5, 6. We have previously shown that miR‐132 is induced in a dose‐dependent manner upon viral infection and suppresses the innate antiviral immune response by down‐regulating expression of p300 (official symbol EP300), a necessary co‐activator for several key transcription factors 3. Furthermore, miR‐132 has been shown to be critical for normal haematopoiesis and B cell development and function through suppression of FOXO3 and SOX4, respectively 7, 8, whereas the miR‐212/132 cluster has also been implicated in Th17 responses 9. miR‐132 is also up‐regulated in a model of inflammation‐induced cellular transformation 10, plays a key role inflammation during wound healing 11, is induced in vivo following infection by Toxoplasma gondii 12 and regulates macrophage activation following Mycobacterium tuberculosis infection 13. Although the above studies have provided strong support for the role of miR‐132 in the immune system, they have predominantly focused on acute inflammation or infection models, whereas the role of miR‐132 in models of pathogen‐induced chronic inflammation remains poorly explored. For example, we have limited knowledge on whether miR‐132 is dispensable for T cell‐mediated immunity.
Here, we show that miR‐132 is induced upon activation of CD4+ T cells in vitro and in vivo during infection of mice with Leishmania donovani (L. donovani). Using fully miR‐212/132‐deficient mice 14 (hereafter referred to as miR‐132 −/− mice), we show that the transcriptomic hallmark of miR‐132 deficiency in CD4+ T cells isolated from chronically infected spleens is an increase in mRNAs levels of ribosomal protein (RP) genes. Similarly, miR‐132 controls RP gene mRNA levels during in vitro activation of CD4+ T cells. Enhanced ribosome biosynthesis during in vitro CD4+ T cell activation is thought to be necessary for accommodating the needs for cytokine production in activated cells 15. However, the in vivo relevance of this phenomenon and the molecular drivers underpinning it remain largely unexplored. Notably, miR‐132 over‐expression suppresses RP gene expression and protein synthesis rates in mouse embryonic fibroblasts (MEFs). Regulation of RP gene expression is mediated by miR‐132‐mediated silencing of proteins involved in transcription including p300 and BTAF1, which we identified here as a novel miR‐132 target. In vivo, miR‐132 −/− CD4+ T cells from chronically infected mice express higher levels of IL‐10 and lower levels of IFNγ when compared to WT cells. This functional impairment correlates with reduced immunopathology and increased pathogen burdens in L. donovani‐infected miR‐132−/− mice. In vitro, activated miR‐132 −/− CD4+ T cells treated with the hypertrophic factor phenylephrine (PE) also demonstrate enhanced IL‐10 expression. Overall, the above demonstrate that miR‐132 is a necessary and sufficient regulator of RP gene expression through targeting core transcriptional regulators and that this mechanism contributes towards optimal CD4+ T cell activation and protective immunity.
Results and Discussion
miR‐132 is up‐regulated during CD4+ T cell activation
We first determined whether miR‐212/132 levels were regulated following stimulation of naïve (CD62L+ CD44−) CD4 T cells with anti‐CD3 and anti‐CD28 antibodies, and found strong miR‐132‐3p and miR‐212‐3p up‐regulation that peaked at day 1 (18 h; Fig 1A; ~20‐ and ~30‐fold increase compared to unstimulated cells) and remained elevated for at least 3 days. Expression of the miR‐212/132 primary transcript is CREB‐dependent 16, and as expected 17, TCR stimulation induced strong CREB phosphorylation within 2–4 h, and this was sustained for 3 days (Fig EV1A). Whilst miR‐146‐5p showed little change following T cell activation, miR‐155‐5p was strongly up‐regulated for sustained periods, whereas miR‐16‐5p levels declined (Fig 1A). miR‐132‐3p and miR‐212‐3p up‐regulation appeared to be a common feature in activated CD4+ T cells and occurred regardless of T cell polarisation phenotype (Th0, Th1 and Th2; Fig EV1B).
Figure 1. The miR‐132/212 cluster regulates RP mRNA levels in CD4+ T cells from chronically infected spleens.
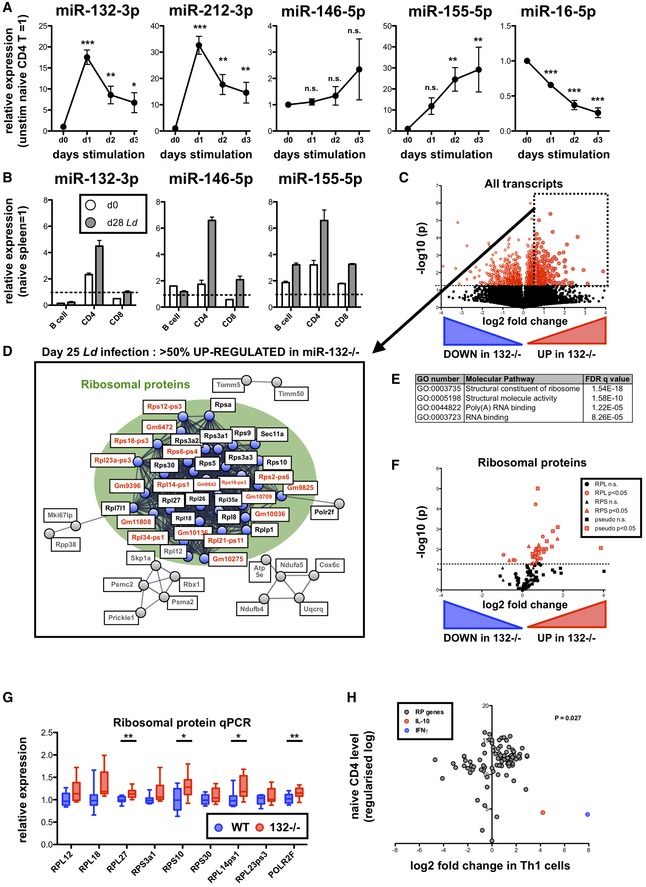
- Expression of indicated miRNAs in sorted naïve (CD62L+ CD44−) CD4+ T cells and following in vitro stimulation with anti‐CD3/anti‐CD28 (1–3 days), relative to levels in cells prior to stimulation. Data from three independent experiments each using T cells pooled from 4 WT mice. Significance determined by one‐way ANOVA.
- Expression of indicated miRNAs in purified spleen lymphocytes (B cells, CD4+ T cells and CD8+ T cells) from day (d) 0 naive (white) and d28 L. donovani‐infected (grey) mice. Expression of each miRNA normalised to levels in whole naïve spleen (dotted line). Data are mean + SEM of two experiments with cells purified from 3 to 5 pooled spleens.
- Volcano plot of RNA‐seq gene expression in splenic WT and miR‐132 −/− CD4+ T cells from d28 L. donovani‐infected mice. Fold change determined as log2 mean FPKM (miR‐132 −/−/WT) from 4 WT and 5 miR‐132 −/− mice. Transcripts significantly different between WT and miR‐132−/− (P < 0.05) are shown in red. Dotted box indicates transcripts significantly up‐regulated in miR‐132−/− CD4+ T cells by more than 50%.
- STRING network analysis of significantly up‐regulated transcripts in CD4+ T cells from spleen of d28 L. donovani‐infected miR‐132 −/− mice compared to WT cells. Cluster of ribosomal proteins shown in green circle, with coding RP transcripts (black) and pseudogenes (red) indicated. Secondary clusters are shown in grey.
- Top enriched molecular function Gene Ontology terms for genes significantly up‐regulated in CD4+ T cells from spleens of infected miR‐132 −/− mice compared to WT mice.
- Volcano plot of all RP genes in splenic WT and miR‐132 −/− CD4+ T cells from d28 L. donovani‐infected mice. RPL genes are shown as circles, RPS genes as triangles and pseudogenes as squares. Red symbols indicate significant difference between WT and miR‐132−/− cells (P < 0.05) whereas black symbols non‐significant.
- Expression of RP transcripts determined by qPCR from L. donovani‐infected d28 WT (blue) and miR‐132 −/− mice (red). N = 9 for each WT and miR‐132 −/− from two independent infection experiments. Box extends from 25th to 75th percentile, whiskers are minimum and maximum values, and horizontal lines indicate median. Significance determined by unpaired t‐test.
- Fold change of all RP transcripts (grey) in Th1 cells compared to naïve CD4+ T cells. Data taken from RNA sequencing experiments described in reference 24. Fold changes in IL‐10 (red) and IFNγ (blue) indicated for comparison. The statistical significance of the observed up‐regulation of RP transcripts in Th1 cells is determined by chi‐squared test.
Figure EV1. The miR‐132/212 cluster regulates RP mRNA levels in CD4+ T cells from chronically infected spleens.
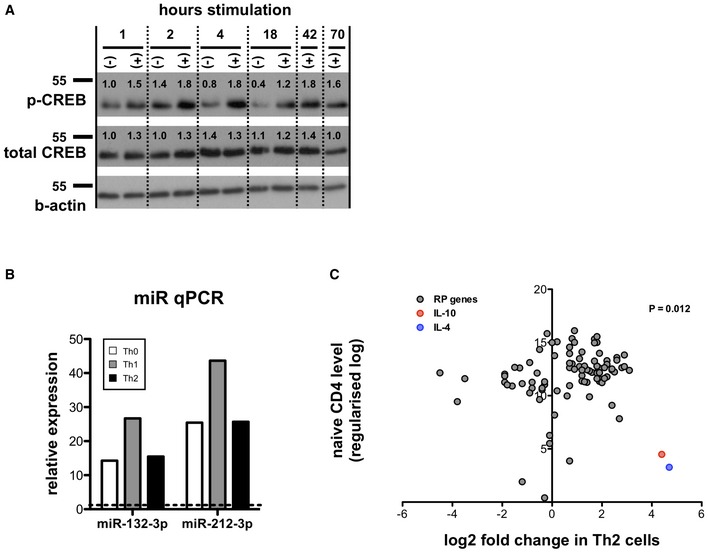
- Expression of phosphorylated CREB (Ser133), total CREB and β‐actin loading control in naïve CD4+ T cells cultured for indicated number of hours in presence (+) or absence (−) of anti‐CD3/anti‐CD28, as determined by Western blot. Numbers indicate intensity normalised to 1‐h unstimulated samples (lane 1) and corrected by β‐actin loading control. Representative of two independent experiments from 3 pooled mice each.
- Relative expression of miR‐132‐3p and miR‐212‐3p determined by qPCR in naïve mouse CD4+ T cells stimulated with anti‐CD3/anti‐CD28 for 18 h under Th0 (non‐polarising; white), Th1 (rIL‐12/anti‐IL‐4; grey) or Th2 conditions (rIL‐4/anti‐IFNγ; black) relative to level in naïve cells prior to stimulation.
- Fold change of all RP transcripts (grey) in Th2 cells compared to naïve CD4 T cells. Data taken from RNA sequencing experiments described in reference 24. Fold changes in IL‐10 (red) and IL‐4 (blue) indicated for comparison. The statistical significance of the observed up‐regulation of RP transcripts in Th1 cells is determined by chi‐squared test.
Source data are available online for this figure.
To investigate the role of miR‐212/132 in the development of inflammation and protective immune responses in vivo, we studied its expression in naïve and infected C57BL/6 WT mice with L. donovani amastigotes. This infection model allows the study of host–pathogen interactions 18, during which infection occurs in the liver, spleen and bone marrow. We sorted splenic lymphocytes and found that CD4+ T cells express higher miR‐132‐3p levels than CD8+ T cells or B cells (Fig 1B). Furthermore, L. donovani infection resulted in miR‐132‐3p up‐regulation in CD4+ T cells. The extent of this up‐regulation was similar to that observed for miRNAs previously reported to be involved in T cell responses such as 146‐5p and 155‐5p 19, 20. Combining these results with previous findings demonstrating miR‐132 induction downstream of TLR 3, 4, 5 and the B cell receptor 7 establishes miR‐132 induction as a hallmark of innate and adaptive immune activation. Of note, miR‐132 up‐regulation has also been observed in studies using human bulk CD4+ and CD8+ T cell populations where it was amongst the most prominent up‐regulated miRNAs 21.
miR‐212/132‐deficiency is associated with global up‐regulation of ribosomal protein genes in CD4+ T cells from chronically infected spleens
To gain a molecular understanding of the function of the miR‐132/212 cluster in CD4+ T cells in vivo, we performed RNA‐seq analysis on biological replicates of sorted splenic CD4+ T cells from L. donovani‐infected WT and miR‐132 −/− mice. Of the more than 14,000 genes that were detectable in CD4+ T cells, similar numbers showed up‐ or down‐regulation by > 50% in miR‐132 −/− compared to WT cells (Fig 1C; 10.3% up and 10.6% down). However, of the 1,290 significantly differently expressed genes (9% of total), approximately two‐thirds (850) were up‐regulated in miR‐132 −/− cells compared to WT and only one‐third (440) down‐regulated. Pathway analysis of genes significantly up‐regulated in miR‐132 −/− mice (P < 0.05, > 50% regulation) using the gene set enrichment analysis 22 and STRING tools 23 revealed that a cluster of RP genes was significantly over‐represented amongst genes up‐regulated in miR‐132 −/− CD4+ T cells (Fig 1D and E). This up‐regulation was evident for both small and large ribosomal protein (RPS and RPL, respectively) genes and even pseudogene transcripts (Fig 1F). These results were further validated by qPCR, showing an increase in all tested RP genes, reaching statistical significance for RPL27, RPS10 and RPL14‐ps1 (Fig 1G). To explore the significance of the observed increase in RP gene expression in miR‐132 −/− CD4+ T cells, we analysed published transcriptional profiles of in vitro‐generated Th1 and Th2 cells 24 and found that CD4+ T cell activation results in a statistically significant shift towards global up‐regulation of RP gene levels (Figs 1H and EV1C). Taken together with previous reports demonstrating that activation of ribosome biosynthesis is associated with activation of CD8+ T cells 25 and production of cytokines by CD4+ T cells in vitro 15, our findings suggested that the observed RP gene up‐regulation in miR‐132 −/− CD4+ T cells was a signature of enhanced activation.
The B‐TFIID cofactor BTAF1 is a direct miR‐132 target in CD4+ T cells
To identify direct targets of the miR‐132/212 cluster in CD4+ T cells, we performed RNA‐seq analysis of naïve CD4+ T cells from WT and miR‐132 −/− mice prior to and following 1 day (18 h) of in vitro TCR stimulation under Th1 conditions. We focussed on Th1 responses as these predominate in L. donovani infection and these cells displayed the highest levels of miR‐132 expression (Fig EV1B). Broadly, similar numbers of transcripts were detected in unstimulated and stimulated T cells (12,336 and 11,140, respectively), with 5.0% (day 0 = 615) and 3.9% (day 1 = 432) showing significant differences between WT and miR‐132 −/− mice (Fig 2A and B). A much larger number of genes (44% WT, 54% miR‐132 −/−) were differentially expressed when we compared naïve with activated T cells (Fig EV2A and B). Of the genes that were significantly different between WT and miR‐132 −/− mice (P < 0.05; 50% difference), 46% were up‐regulated in miR‐132 −/− at day 0, and this increased to 68% at day 1. At day 1, we observed that the majority of predicted miR‐132/212‐3p targets were up‐regulated (i.e. 51/75 = 68% displayed a positive log2 fold change) in miR‐132 −/− CD4+ T cells (Fig 2C and D). Of note, a single predicted miR‐132/212‐3p target, BTAF1, was up‐regulated in both unstimulated and activated miR‐132 −/− CD4+ T cells, as well as in CD4+ T cells from L. donovani‐infected miR‐132 −/− mice (Figs 2C–E and EV2C). Up‐regulation of BTAF1 was confirmed by qPCR (Fig 2F). BTAF1 protein expression was elevated in miR‐132 −/− CD4+ T cells compared to WT cells, both before and after TCR stimulation (Fig 2G). BTAF1 contains a single 7mer‐m8 site for miR‐132/212‐3p within its 3′UTR that is broadly conserved in mammals (Fig EV2D). To assess whether BTAF1 was a direct target of miR‐132/212‐3p, we transfected HeLa or 3T3 cells with luciferase reporter constructs preceded by ~1.5 kb of BTAF1 3′UTR (either WT or with miR‐132/212‐3p site mutated) in the presence of miR‐132‐3p or miR‐212‐3p mimics. This revealed that in the presence of miR‐132‐3p mimics, luciferase activity was significantly elevated following mutation of the miR‐132/212 site in the 3′UTR (Figs 2H and EV2E). A similar trend was observed in miR‐212‐3p‐transfected cells although this did not reach statistical significance. This demonstrated that miR‐132 can directly interact with the predicted miR‐132‐binding site in the BTAF1 3′ UTR. We also searched for potential miR‐132‐5p and miR‐212‐5p targets that were altered in miR‐132−/− mice. Unlike miR‐132‐3p and miR‐212‐3p, these two miRNAs differ in their seed sequence and so are predicted to have different mRNA targets (Fig EV2F). Whilst several potential targets were significantly dysregulated in miR‐132−/− CD4+ cells, there was little overlap between those altered in unstimulated T cells, d1‐activated T cells or those derived from d28 L. donovani infection (Fig EV2G). Only a single target, BACH2 (predicted 7mer‐A1 target for both miR‐212‐5p and miR‐132‐5p), was up‐regulated by > 50% in all three T cell datasets, but this was only significant for in vitro d1‐stimulated T cells and was highly variable in the other two conditions (Fig EV2H).
Figure 2. The B‐TFIID cofactor BTAF1 is a direct miR‐132 target in CD4+ T cells.
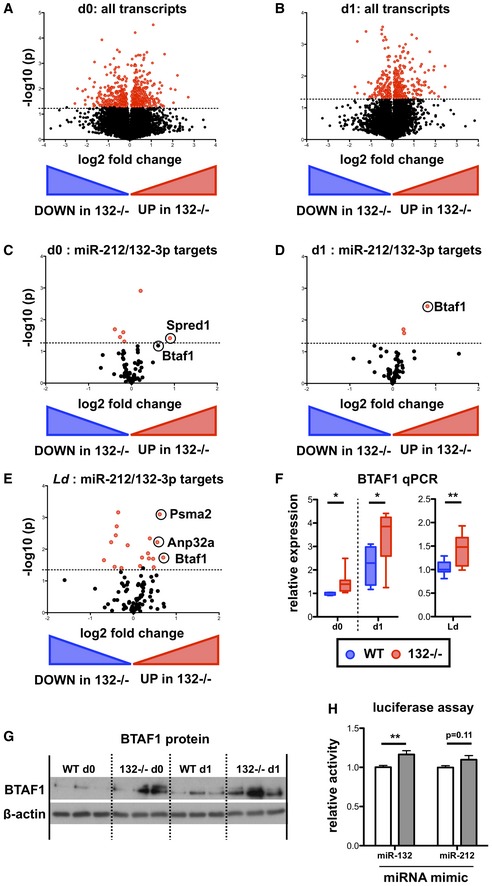
- Volcano plot (Log2(Fold Change) vs. −Log(P‐value)) of RNA gene expression in purified naïve CD62L+ CD44− WT and miR‐132 −/− CD4+ T cells. Fold change determined as log2 mean FPKM (miR‐132 −/−/WT) from 4 WT and 4 miR‐132 −/− mice. Transcripts significantly different between WT and miR‐132 −/− cells (P < 0.05) are shown in red.
- Volcano plot of RNA gene expression in purified naïve CD62L+ CD44− WT and miR‐132 −/− CD4+ T cells following 18 h in vitro stimulation with anti‐CD3/anti‐CD28 under Th1 conditions. Fold change determined as log2 mean FPKM (miR‐132 −/−/WT) from 4 WT and 4 miR‐132 −/− mice. Transcripts significantly different between WT and miR‐132 −/− cells (P < 0.05) are shown in red.
- Volcano plot of transcripts containing a conserved miR‐212/132‐3p target site in naïve CD4+ T cells from WT or miR‐132 −/− mice.
- Volcano plot of transcripts containing a conserved miR‐212/132‐3p target site in in vitro polarised (Th1 conditions, 18 h post‐stimulation) CD4+ T cells from WT or miR‐132 −/− mice.
- Volcano plot of transcripts containing a conserved miR‐212/132‐3p target site in spleen CD4+ T cells from day (d) 28 L. donovani‐infected WT or miR‐132 −/− mice.
- BTAF1 transcript levels determined by qRT‐PCR in WT (blue) or miR‐132 −/− (red) in naïve (d0) and Th1 polarised for 18 h (d1) CD4+ T cells, and CD4+ T cells from d28 L. donovani‐infected WT or miR‐132 −/− mice. N = 8–9 for each WT and miR‐132 −/−.
- Expression of BTAF1 protein in d0 naïve and d1 (18 h) Th1‐polarised WT and miR‐132 −/− CD4+ T cells, as determined by Western blot. Each lane from individual mouse, and representative of two independent experiments.
- Relative luciferase activity in HeLa transfected with plasmid containing WT BTAF1 3′UTR (white) or BTAF1 3′UTR on which the miR‐132 binding site is mutated (grey) downstream of Renilla luciferase, in the presence of miR‐132‐3p or miR‐212‐3p mimics. Error bars indicate SEM from eight replicate treatments.
Figure EV2. The B‐TFIID cofactor BTAF1 is a direct miR‐132 target in CD4+ T cells.
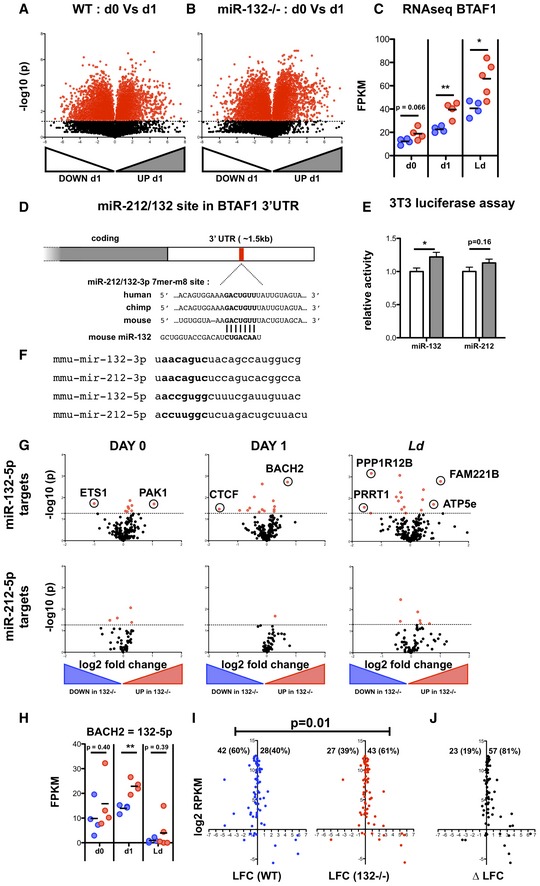
- Volcano plot of RNA‐seq gene expression in purified CD62L+ CD44− naïve WT cells before and after 1 day (18 h) stimulation with anti‐CD3/anti‐CD28. Fold change determined as log2 mean FPKM (stimulated/pre‐stimulation) from 4 WT mice. Transcripts significantly different (P < 0.05) are shown in red.
- Volcano plot of RNA‐seq gene expression in purified CD62L+ CD44− naïve miR‐132 −/− cells before and after 1 day (18 h) stimulation with anti‐CD3/anti‐CD28. Fold change determined as log2 mean FPKM (stimulated/pre‐stimulation) from 4 WT mice. Transcripts significantly different (P < 0.05) are shown in red.
- RNA‐seq gene expression levels of BTAF1 from pre‐stimulation (d0), 18 h anti‐CD3/anti‐CD28 (d1) and the spleen of d28 L. donovani infection (Ld), from WT (blue) and miR‐132 −/− (red) mice (n = 4–5 mice per group). Significance determined by unpaired t‐test as indicated.
- Schematic of miR‐212/132‐3p 7mer‐m8 site in the 3′UTR of BTAF1 transcript, showing conservation in human, mouse and chimp. The site is also conserved in, rhesus, squirrel, rabbit, pig, cow, cat, dog, brown bat, elephant, opossum, macaw and chicken, but not rat or lizard.
- Relative luciferase activity in mouse 3T3 cells transfected with plasmid containing WT (white) or miR‐212/132‐mutant (grey) BTAF1 3′UTR immediately downstream of Renilla luciferase, in the presence of miR‐132‐3p or miR‐212‐3p mimics. Error bars indicate SEM from eight replicate treatments. Significance determined by unpaired t‐test.
- Nucleotide sequences of mouse mature miRNA derived from miR‐212/132 cluster. Seed sequences indicated in bold.
- Volcano plots of RNA‐seq gene expression for transcripts containing a poorly conserved miR‐132‐5p site (upper panels) or a broadly evolutionary conserved miR‐212‐5p site (lower panels). Fold change determined as log2 mean FPKM miR‐132 −/−/WT) from 4 WT and miR‐132 −/− mice. Transcripts significantly different between WT and miR‐132−/− (P < 0.05) are shown in red. Data compare pre‐stimulation naïve CD4 T cells (d0, left panels); after 18 h in vitro stimulation with anti‐CD3/anti‐CD28 (d1, middle panels); and from the spleens of d28 L. donovani‐infected mice. Transcripts that are significantly different (P < 0.05) and show > 2 fold change in expression are indicated.
- RNA levels of BACH2 (based on RNA‐seq) from pre‐stimulation (d0), 18 h anti‐CD3/anti‐CD28 (d1) and the spleen of d28 L. donovani infection (Ld), from WT (blue) and miR‐132 −/− (red) mice. Significance determined by unpaired t‐test as indicated (n = 4–5 mice per group).
- Log2 fold change (LFC) in RP genes after 18 h in vitro stimulation of WT (blue) or miR‐132−/− naïve CD4+ T cells with anti‐CD3/anti‐CD28. Percentages of up‐regulated and down‐regulated transcripts in WT (40%) and miR‐132 −/− (61%) cells are shown. Statistical significance is determined with chi‐squared test.
- DeltaLFC (LFCmiR‐132−/− − LFCWT) after 18 h in vitro stimulation of WT (blue) or miR‐132 −/− naïve CD4+ T cells with anti‐CD3/anti‐CD28. Significance is determined with chi‐squared test. Data information: *P < 0.05, **P < 0.01.
Having observed an effect of miR‐132 deletion on RP gene mRNA levels after chronic CD4+ T cell activation in vivo (Fig 1), we tested whether we can observe a similar effect in our dataset from the early stages of in vitro CD4+ T cell activation. Following 24 h of in vitro activation of naïve CD4+ T cells, we observed that 40% of RP genes showed up‐regulation (positive log2 fold change or LFC) in WT mice. This proportion was significantly increased to 61% in miR‐132 −/− mice (P = 0.011; Fig EV2I). Furthermore, the vast majority of RP genes (81%) demonstrated a higher LFC (indicating stronger up‐regulation or weaker down‐regulation) upon activation of miR‐132 −/− CD4+ T cells compared to WT cells (Fig EV2J).
p300 and BTAF1 contribute to miR‐132‐mediated suppression of ribosomal protein expression
miR‐132 deficiency resulted in up‐regulation of several RP genes in CD4+ T cells from chronically infected mice with L. donovani (Fig 1). In addition, we found that miR‐132‐3p or miR‐212‐3p over‐expression in mouse embryonic fibroblasts (MEFs) resulted in widespread down‐regulation of RP gene mRNA levels (Figs 3A and EV3A). These effects were confirmed at the protein level using Rpl27 and Rps10 as two representative RPs (Fig EV3B). This allowed us to further probe the mechanism employed by miR‐132 to regulate ribosomal protein gene levels. The majority of RP transcripts up‐regulated in miR‐132 −/− mice (Fig 1D) lacked miR‐132/212‐3p sites (13/15 coding transcripts), with the remaining 2/15 (RPL7L1 and RPL18) displaying non‐conserved sites. Predicted miR‐132/212‐3p targets are statistically significantly enriched in proteins involved in transcription (Fig EV3C). Therefore, we reasoned that the effect of miR‐132 on RP gene expression was caused by miR‐132‐mediated suppression of transcriptional regulators. For example, p300, a previously validated miR‐132 target 3, is required for the activity of Sp1, YY1 and CREB, all of which have known roles in transcription of RP genes 26, 27, 28. Of note, although miR‐132 directly suppresses p300, its effects on p300 mRNA steady‐state levels are minimal 3. In parallel, BTAF1, a predominant miR‐132 target in CD4+ T cells (Fig 2), interacts with TATA‐binding protein (TBP) to form B‐TFIID, causing redistribution of TBP to new genomic sites 29, 30. Over‐expression of miR‐132 in MEFs resulted in suppression of p300 and BTAF1 (Fig 3B). Similarly, over‐expression of miR‐132‐3p or miR‐212‐3p in the EL4 T cell line also resulted in suppression of BTAF1 and p300 (Fig EV3D), suggesting that both miRNAs contribute to regulation of BTAF1 and p300. Knockdown of p300 resulted in significant down‐regulation of several miR‐132‐regulated RP transcript levels, including RPL27, RPSA, RPS3A, RPS9, RPS10 and RPL14‐ps1 (Fig 3C), whereas levels of RPL18 showed a trend towards down‐regulation (P = 0.06). In addition, knockdown of BTAF1 significantly reduced levels of RPL27 and RPL18, with RPL14‐ps1 showing a trend towards down‐regulation (P = 0.052; Fig 3D). Critically, suppression of RP expression by miR‐132 was dependent on both p300 and BTAF1 (Fig 3E). Although the majority of miR‐132‐mediated effects on RP expression were abolished upon knockdown of either p300 or BTAF1, we also identified RP mRNAs that were specifically dependent on p300 (e.g. miR‐132‐mediated suppression of Rps9) or BTAF1 (e.g. miR‐132‐mediated suppression of Rpl18; Fig 3E). To validate the functional relevance of these effects, we tested protein synthesis rates in MEFs over‐expressing miR‐132‐3p or miR‐212‐3p using a puromycin incorporation assay 31. Over‐expression of either of the two miRNAs resulted in suppression of protein synthesis, consistent with their effect on RP expression (Fig 3F). These findings demonstrate that p300 and BTAF1, two miR‐132 targets involved in transcription, contribute towards the widespread regulation of RP genes observed in miR‐132/212‐deficient or over‐expressing cells. Interestingly, Mot1, the yeast homologue of BTAF1, promotes expression of ribosomal proteins in yeast 32, as seen here for BTAF1 and RPL27 and RPL18 in mouse cells. We should note that given the number of potential miR‐132 targets involved in transcription (Fig EV3C) 33, we cannot exclude the contribution of additional miR‐132 targets towards RP gene regulation. Importantly, it is thought that the majority of RP genes are not regulated at the post‐transcriptional level by miRNAs due to their relatively short 3′UTRs 34. However, our work demonstrates that a miRNA can indirectly suppress a cluster of RP genes in CD4+ T cells and MEFs. This reveals a novel mechanism of RP regulation with miR‐132 acting as a molecular node mediating crosstalk between RP expression and post‐transcriptional gene silencing.
Figure 3. miR‐132 and its targets p300 and BTAF1 control RP expression.
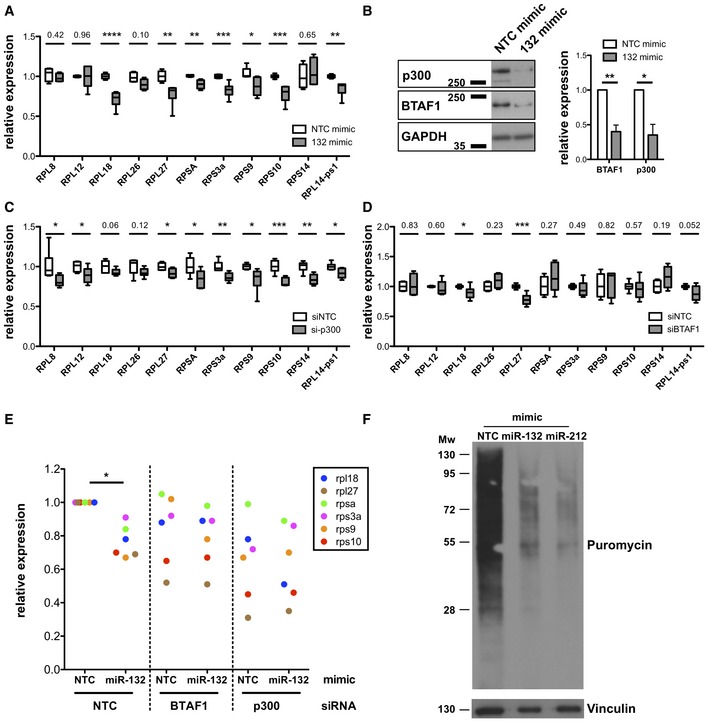
- mRNA levels of indicated RP transcripts determined by qRT–PCR in MEFs transfected with Non‐targeting control (NTC) mimics (white) or miR‐132‐3p mimics (grey).
- p300 and BTAF1 protein levels in MEF transfected with NTC mimics or miR‐132‐3p mimics determined by Western blot. GAPDH was used as a loading control. Right panel indicates mean + SEM of four experiments.
- mRNA levels of indicated RP transcripts determined by qRT–PCR in MEFs transfected with NTC siRNA (white) or p300 siRNA (grey).
- mRNA levels of indicated RP transcripts determined by qRT–PCR in MEFs transfected with NTC siRNA (white) or BTAF1 siRNA (grey).
- mRNA levels of indicated RP transcripts determined by qRT–PCR in MEFs transfected with NTC or miR‐132‐3p mimics and NTC siRNA or p300 or BTAF1 siRNAs for 48 h. Levels are normalised to cells transfected with NTC siRNA and NTC mimic.
- Puromycin incorporation (following 10‐min pulse and 50‐min chase) determined by Western blot in MEFs transfected with NTC or miR‐132‐3p or miR‐212‐3p mimics.
Figure EV3. miR‐132 and its targets p300 and BTAF1 control RP expression.
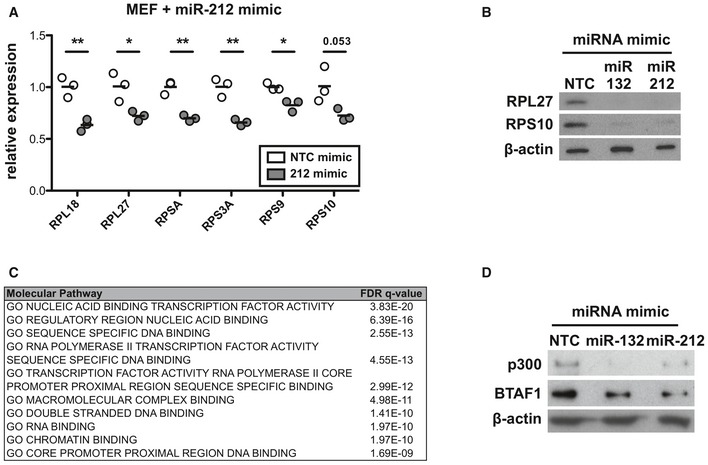
- mRNA levels of indicated RP transcripts determined by qRT–PCR in MEFs transfected with NTC mimics (white) or miR‐212‐3p mimics (grey). Cultures performed in triplicate. Statistical significance determined by t‐test.
- Protein levels determined by Western blot of RPL27 and RPS10 in MEFs transfected with NTC, miR‐132‐3p or miR‐212‐3p mimics for 48 h.
- Top enriched molecular function GO terms for miR‐132/212‐3p predicted target genes. Predictions retrieved from Targetscan, total context score < −0.1.
- Protein levels determined by Western blot of BTAF1 and p300 in EL4 cells transfected with NTC, miR‐132‐3p, or miR‐212‐3p mimics for 48 h.
The miR‐212/132 cluster controls the balance between IL‐10 and IFNγ production in CD4+ T cells
Having shown that miR‐132 deficiency results in similar transcriptomic effects in CD4+ cells in vitro and in vivo (e.g. RP gene regulation, BTAF1 suppression) and during L. donovani infection (Figs 1 and 2), we measured capacity for IFNγ and IL‐10 production by CD4+ T cells from infected mice by intracellular cytokine staining following ex vivo stimulation with PMA and ionomycin. We found a modest but significant reduction in the ability of miR‐132 −/− CD4+ T cells to produce IFNγ (Fig 4A). This was accompanied by a greater fold increase in production of IL‐10 by miR‐132 −/− IFNγ+ CD4+ T cells compared to wild‐type cells (Figs 4B and EV4A). Interestingly, IL‐10 mRNA levels were not statistically significantly different between WT and miR‐132 −/− cells (Fig 4C), indicating that miR‐132 affected IL‐10 expression at the post‐transcriptional/translational level. Increased IL‐10 production by miR‐132−/− CD4+ T cells was also evident following in vitro restimulation of splenic CD4+ T cells from infected mice with L. donovani antigen, demonstrating that the effect was occurring in antigen‐specific manner (Fig EV4B). The observed reduction in frequency of IFNγ+ CD4+ T cells and an increase in frequency of IFNγ+IL‐10+ CD4+ T cells are consistent with the concept that IL‐10+ Th1 cells develop after prolonged exposure to antigen and represent an endpoint of the Th1 response 35. In this respect, our results can be interpreted as miR‐132 −/− CD4+ T cells reaching this endpoint immunoregulatory status prematurely.
Figure 4. miR‐132 controls the balance between IL‐10 and IFNγ production in CD4+ T cells.
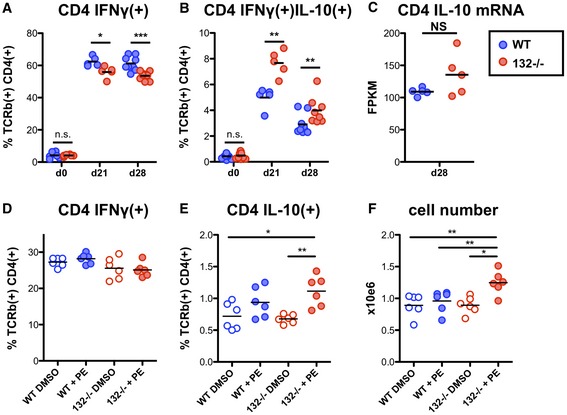
- Percentage of IFNγ+ live TCRβ+ CD4+ cells from L. donovani‐infected WT (blue) or miR‐132 −/− (red) mice, determined by intracellular cytokine staining. Data representative of three independent experiments with 3–5 mice per group.
- Percentage of IFNγ+/IL‐10+ live TCRβ+ CD4+ cells from L. donovani‐infected WT (blue) or miR‐132 −/− (red) mice, determined by intracellular cytokine staining. Data representative of three independent experiments with 3–5 mice per group.
- IL‐10 mRNA levels, determined by RNA sequencing, in TCRβ+ CD4+ cells purified from spleens of L. donovani‐infected WT (blue) or miR‐132 −/− (red) mice (n = 5 per group).
- Percentage of IFNγ+ WT (blue) or miR‐132 −/− (red) in vitro polarised Th1 cells (6 days) in the presence or absence of phenylephrine (PE), determined by intracellular cytokine staining.
- Percentage of IL10+ WT (blue) or miR‐132 −/− (red) in vitro polarised Th1 cells (6 days) in the presence or absence of phenylephrine (PE), determined by intracellular cytokine staining.
- Total cell counts following in vitro Th1 polarisation (6 days) in the presence or absence of phenylephrine (PE). For (D and E), cells were purified from 3 mice per group and six replicates performed.
Figure EV4. miR‐132 controls the balance between IL‐10 and IFNγ production in CD4+ T cells.
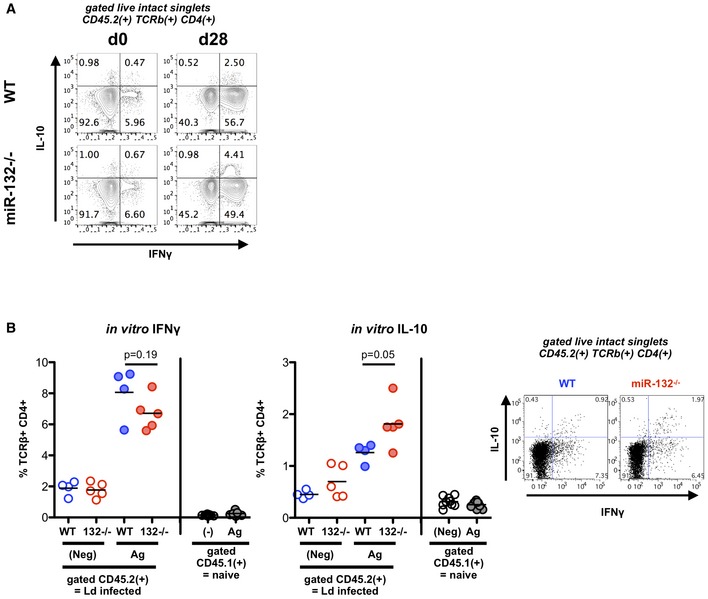
- Intracellular cytokine staining of WT or miR‐132 −/− splenic live CD45.2+ TCRβ+ CD4+ cells for IFNγ and IL‐10 from day(d) 0 naïve and d28 L. donovani‐infected mice following ex vivo stimulation (4 h) with PMA and ionomycin.
- Antigen‐specific IFNγ and IL‐10 production by splenic CD4+ T cells from CD45.2+ L. donovani‐infected WT (blue) or miR‐132 −/− (red) mice was assessed as described in Materials and Methods. Cells were cultured for 3 days in the absence of exogenous stimulation (“Neg”, open circles) or with parasite antigen (“Ag”, closed circles), after which cytokine production by CD4+ T cells from infected (“CD45.2”) or naïve mice (“CD45.1”) was determined. Representative FACS plots for antigen‐stimulated CD45.2+ cells are shown. Significance determined by unpaired t‐test, purified CD4+ T cells from 4 to 5 mice per group.
At the molecular level, the increase in IFNγ+IL‐10+ CD4+ T cells in vivo was associated with a transcriptomic signature characterised by an up‐regulation of a cluster of RP genes in miR‐132 −/− CD4+ T cells (Fig 1D and E). To further explore this finding, we compared in vitro Th1 differentiation of WT and miR‐132 −/− CD4+ T cells in presence or absence of phenylephrine (PE), which has been shown to enhance ribosome biosynthesis 36. Remarkably, although there were no statistically significant differences between miR‐132 −/− and WT cells, nor between WT DMSO‐treated and PE‐treated cells, treating miR‐132 −/− CD4+ T cells with PE resulted in statistically significantly enhanced IL‐10 expression and increased number of cells compared to WT cells. An increase in IL‐10 levels was observed in PE‐treated WT cells compared to DMSO‐treated WT cells, but this did not reach statistical significance. IFNγ levels were not affected by PE and were lower in miR‐132 −/− Th1 cells although this did not reach significance after multiple testing correction (Fig 4D–F). In agreement with our in vivo observations, the enhanced cell number and IL‐10 expression under these in vitro conditions recapitulated enhanced activation and premature acquisition of an immunoregulatory state in miR132 −/− CD4+ T cells. Overall, these results demonstrated that miR‐132 connects RP expression, IL‐10 expression and CD4+ T cell activation in Th1 cells. Our results infer that the observed deregulation of selected RPs in miR‐132 −/− CD4+ T cells in vivo likely alters the composition and function of ribosomes in a manner that specifically promotes IL‐10 expression. This could be potentially explained by formation of specialised ribosomes in activated CD4+ T cells 37, 38.
The miR‐212/132 cluster promotes protective immunity to L. donovani
Having observed that loss of miR‐132 favours an immunoregulatory (higher IL‐10 expression) phenotype in Th1 cells, we tested the response of miR‐132−/− mice to L. donovani infection. Indeed, IFNγ+IL‐10+ CD4+ T cells have been associated with immune dysregulation and infection susceptibility in a variety of human and experimental systems 39, 40, 41, 42, 43. Furthermore, the role of IL‐10 in preventing L. donovani clearance had been previously demonstrated 44, 45, 46. However, this support comes from the study of fully IL‐10‐deficient mice and use of blocking antibodies against IL‐10 or its receptor. To determine whether modest changes in IL‐10 levels could alter infection outcomes, we infected IL‐10 +/+, IL‐10 +/− and IL‐10 −/− mice. Infected IL‐10 +/− mice produced intermediate levels of IL‐10 compared to their IL‐10 +/+ and IL‐10 −/− counterparts (Fig EV5A), without any change in IFNγ production (Fig EV5B). Notably, as with WT mice treated with IL‐10R‐blocking antibody or IL‐10 −/− mice, IL‐10 +/− mice were able to clear liver parasites albeit with slower kinetics (Fig 5A). These experiments suggested that modifying the relative abundance of IL‐10 and IFNγ by reducing IL‐10 by 50% can affect susceptibility to L. donovani infection. Consistently with these findings and the observed IL‐10 levels in miR‐132 −/− mice, L. donovani infection resulted in significantly elevated splenic parasite burdens in miR‐132 −/− mice (Fig 5B). Although we observed variation in parasite load between different experiments (Fig 5C), miR‐132 −/− spleens consistently harboured approximately twofold more parasites at day 28 compared to WT controls (Fig 5C and D). In addition to parasite loads, miR‐132 deficiency affected CD11b+ cell populations, here called MφΑ (CD11b+ F4/80+ CD11c−), MφB (CD11bhi F4/80hi CD11c+) and MφC (CD11bhi F4/80lo CD11c+) present in infected spleens (gated as Fig EV5C). The numbers of MφA and MφB cells decreased in infected miR‐132 −/− mice characterised by higher IL‐10 expression in CD4+ T cells (Fig EV5D). Conversely, numbers of these populations increased in an IL‐10 dose‐dependent manner, in infected IL‐10 −/− and to a lesser extent in IL‐10 +/− mice (Fig EV5E), demonstrating that the number of these cells is inversely correlated with IL‐10 expression. Of note, IL‐10 expression did not differ between WT and miR‐132 −/− myeloid subpopulations (Fig EV5F). This demonstrated that the effect of miR‐132 on IL‐10 expression does not occur in all IL‐10‐producing cell types, showing specificity for Th1 cells. Our findings do not exclude that miR‐132‐mediated suppression of IL‐10 might occur in other cell types (e.g. B cells, innate lymphoid cells) contributing to the overall function of miR‐132 in immunity.
Figure EV5. miR‐132 promotes protective immunity to L. donovani .
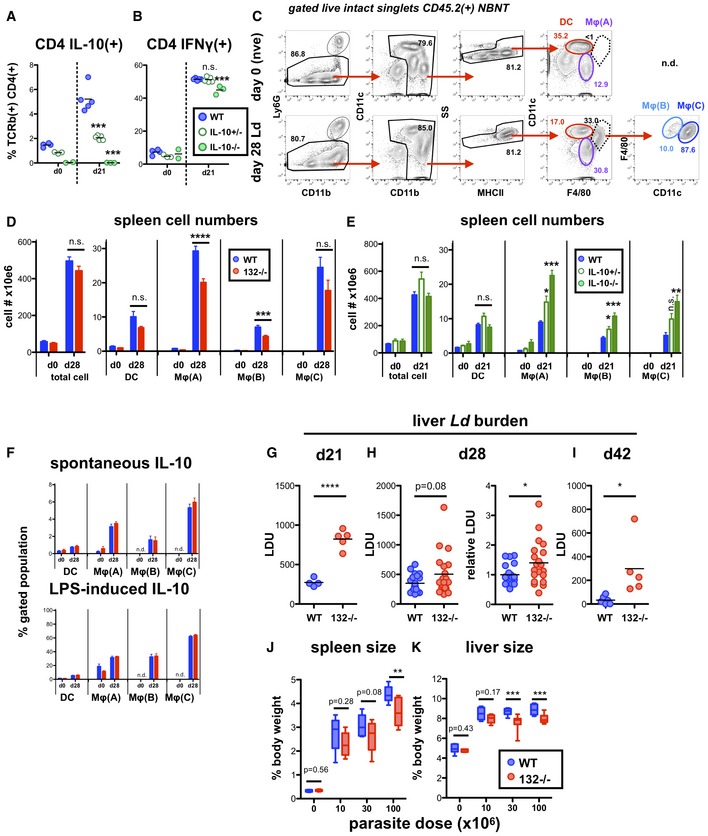
- Percentage of IL10+ splenic live CD45.2+ TCRβ+ CD4+ cells for IL‐10 in day (d)0 naïve and d21 in L. donovani‐infected WT (blue), IL‐10 +/− (open green) and IL‐10 −/− (filled green) mice. d21 used due to accelerated parasite clearance and immune resolution in IL‐10 −/− mice. Significance determined by ANOVA compared to WT group (n = 3–5 per group).
- Percentage of IFNγ+ splenic live CD45.2+ TCRβ+ CD4+ cells for IL‐10 in d0 naïve and d21 in L. donovani‐infected WT (blue), IL‐10 +/− (open green) and IL‐10 −/− (filled green) mice. d21 used due to accelerated parasite clearance and immune resolution in IL‐10 −/− mice. Significance determined by ANOVA compared to WT group.
- Gating strategy for defining distinct myeloid populations in infected mice shown in C. NBNT = non‐B non‐T, i.e. B220− CD3− in d0 naïve and d28 Ld‐infected WT mice.
- Total spleen cell numbers or of indicated myeloid populations in d0 naïve and d28 Ld‐infected WT (blue) or miR‐132 −/− (red) mice. Myeloid cells gated as live CD45.2+ CD3− B220− Ly6G− SSlo singlets then; DC (CD11c+ F4/80− MHCII+); MφA (CD11b+ F4/80+ CD11c−); MφB (CD11c+ F4/80+ CD11blo); and MφC (CD11c+ F4/80+ CD11bhi). Bars show mean + SEM. Data pooled from two independent experiments (n = 4–5 per group for each experiment). Significance determined by unpaired t‐test as indicated.
- Total spleen cell numbers or of indicated myeloid populations in d0 naïve and d21 Ld‐infected WT (blue), IL‐10 +/− (open green) and IL‐10 −/− (filled green) mice (n = 3–5 per group). Myeloid cells gated as in (D). Bars show SEM. Significance determined by one‐way ANOVA and is shown compared to WT group.
- Spontaneous and LPS‐induced IL‐10 production by indicated spleen myeloid populations (as in D) from N (naive) and Ld‐infected mice (d28), determined by intracellular cytokine staining. n.d., not detected, i.e. cell type absent in naïve mice. Significance determined by unpaired t‐test as indicated, and data pooled from two independent experiments each with 3–5 mice per group. Bars show mean + SEM.
- Day 21 liver parasite burdens expressed as LDU (Leishman‐Donovan units) in WT (blue) and miR‐132 −/− (red) mice. Each data point represents an individual mouse. Significance determined by unpaired t‐test.
- Left‐hand panel: Day 28 liver parasite burdens expressed as LDU (Leishman‐Donovan units) in WT (blue) and miR‐132 −/− (red) mice. Right‐hand panel shows same data expressed relative to WT levels (WT mean = 1). Data from four independent infection experiments with 4–5 mice per group per experiment. Significance determined by unpaired t‐test.
- Day 42 liver parasite burdens expressed as LDU (Leishman‐Donovan units) in WT (blue) and miR‐132 −/− (red) mice. Each data point represents an individual mouse. Significance determined by unpaired t‐test.
- Spleen size expressed as % body weight for naïve (= 0 parasite dose) or d28 L. donovani‐infected WT (blue) and miR‐132 −/− (red) mice. Mice were infected with 10, 30 or 100 × 106 L. donovani amastigotes. Data pooled from two independent experiments with 3–5 mice per group. Significance determined by unpaired t‐test.
- Liver size expressed as % body weight for naïve (=0 parasite dose) or d28 L. donovani‐infected WT (blue) and miR‐132 −/− (red) mice. Mice were infected with 10, 30 or 100 × 106 L. donovani amastigotes. Data pooled from two independent experiments with 3–5 mice per group. Significance determined by unpaired t‐test. Boxes for (J and K) extend from 25th to 75th percentile, whiskers are minimum and maximum values, and horizontal lines indicate median.
Figure 5. miR‐132 promotes protective immunity to L. donovani .
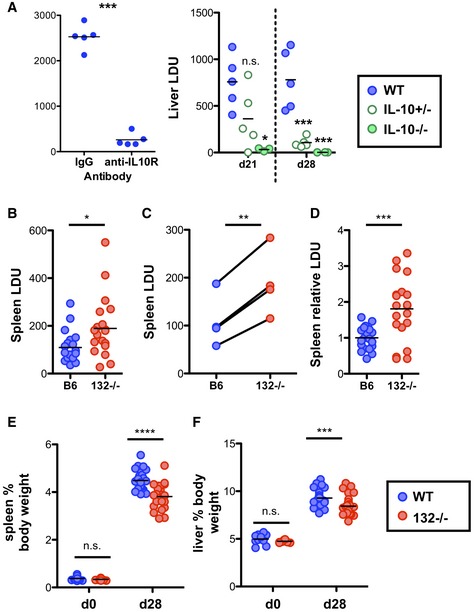
- Liver LDU (Leishman‐Donovan units) at day (d) 28 in infected WT mice treated with anti‐IL‐10R antibody or isotype control antibody (left panel, n = 5 mice per group), or at d21 and d28 from WT (blue), IL‐10 +/− (open green circles) and IL‐10 −/− (filled green circles) mice (right panel n = 3–6 mice per group).
- Day 28 splenic parasite burdens expressed as LDU with each data point representing an individual mouse in WT (blue) and miR‐132 −/− (miR‐132−/−; red) mice. Data from four independent infection experiments.
- Mean WT and miR‐132 −/− spleen parasite burdens from the four independent experiments shown in (B). Lines link individual experiments.
- Splenic parasite burdens relative to WT group (WT mean = 1) for each of the four experiments shown in (B), with each data point representing individual mouse.
- Spleen size expressed as % body weight for d0 (naïve) or d28 L. donovani‐infected WT (blue) and miR‐132 −/− (miR‐132−/−; red) mice.
- Liver size expressed as % body weight for d0 (naïve) or d28 L. donovani‐infected WT (blue) and miR‐132 −/− (red) mice.
Liver parasite burdens peaked around day 21, and we noted increased levels in miR‐132 −/− mice at this time point (Fig EV5G). Whilst miR‐132 −/− liver burdens were only significantly elevated at day 28 when we corrected for inter‐experiment variations in infection intensity (Fig EV5H), miR‐132 −/− mice continued to harbour a significantly elevated parasite burden at day 42 (Fig EV5I), a time point when parasites are being cleared from this organ in WT C57BL/6 mice 18. Notably, the enhanced pathogen burdens coincided with significantly smaller spleen and liver size in miR‐132 −/− mice compared to their WT counterparts (Fig 5E and F). The impact of miR‐132 deficiency on hepatosplenomegaly was most pronounced at higher infection levels, with a similar trend also evident after infection with lower parasite doses (Fig EV5J and K).
In sum, we propose that our findings support a model according to which enhanced ribosomal protein expression upon activation of miR‐132−/− CD4+ T cells in vivo contributes towards accelerated activation of these cells and the premature switch to the IFNγ+IL‐10+ phenotype. Although we cannot exclude that other cell types or mechanisms contribute to the observed increase in parasite loads in miR‐132 −/− mice, we propose that the effects of miR‐132 deficiency on IL‐10 expression in IFNγ+ CD4+ T cells significantly contribute to reduced protective inflammation and enhanced susceptibility of miR‐132 −/− mice to infection. This is consistent with previous publications that highlight that IL‐10 produced by Th1 cells (rather than regulatory T cells or myeloid cells) is a critical determinant of L. donovani infection outcomes 40, 47. Of note, due to the impossibility of concurrent physiological knockdown or over‐expression of RPs, the functional relevance of this family of proteins to Th1 responses in vivo has remained elusive. Our results provide a novel conceptual framework for the in vivo relevance of RP expression in CD4+ T cells indicating that exaggerated RP expression can be associated with impaired T cell responses. We propose that miR‐132‐driven coordination of the machineries that control RNA metabolism is essential for optimal Th1 cell activation and protective immunity.
Materials and Methods
Ethics
Animal care and experimental procedures were regulated under the Animals (Scientific Procedures) Act 1986 (revised under European Directive 2010/63/EU) and were performed under UK Home Office License (project licence number PPL 60/4377 with approval from the University of York Animal Welfare and Ethical Review Body). Animal experiments conformed to ARRIVE guidelines.
Mice and L. donovani infection
Female C57BL/6 CD45.1, CD45.2 and RAG2−/− mice were obtained from Charles River (UK). MiR‐132/212 −/− mice (complete knockouts) were provided by Dr Richard Goodman (Vollum Institute, Oregon Health & Science University, USA). IL‐10−/− mice were provided by Dr Anne O'Garra (Francis Crick Institute, UK) and were crossed with WT CD45.2 C57BL/6 mice to generate IL‐10+/− heterozygotes. All mice were bred in‐house, maintained under specific pathogen‐free conditions and used at 6–12 weeks of age. The Ethiopian strain of L. donovani (LV9) was maintained by passage in RAG‐2−/− mice. Mice were infected i.v. with 100 × 106 amastigotes via the tail vein. Parasite doses of 10 and 30 × 106 were also used where indicated. Parasite burden was expressed as Leishman‐Donovan units (LDU; the number of parasites per 1,000 host cell nuclei × organ weight in mg) 48. To allow comparison between these experiments, we normalised LDU to the levels observed in WT mice (relative LDU). For IL‐10R neutralisation experiments, mice were infected with L. donovani and received anti‐IL10R (Clone: 1B1.3A from Bio X Cell) or IgG isotype control (SIGMA) injections at day 0, day 14 and day 21 p.i. at 0.5 mg mAb/injection.
FACS analysis and cell sorting
For FACS analysis, spleens were first digested with 0.4 U/ml Liberase TL (Roche) and 80 U/ml DNase I type IV in Hank's Balanced Salt Solution (both from Sigma) for 15 min at 37°C. Enzyme activity was inhibited with 10 mM EDTA pH 7.5 and single‐cell suspensions created with 70‐μm nylon filters (BD Biosciences) in complete RPMI 1640 (ThermoFisher) supplemented with 10% heat‐inactivated FCS (HyClone), 100 U/ml penicillin, 100 μg/ml streptomycin and 2 mM L‐glutamine (all from ThermoFisher). Red blood cells were lysed with red blood cell lysing buffer (Sigma), For live/dead discrimination, cells were washed twice in PBS, then stained with Zombie Aqua (BioLegend) before resuspension in FACS buffer (PBS containing 0.5% BSA and 0.05% azide). Fc receptors were blocked with 100 μg/ml rat IgG (Sigma) for 10 min at 4°C, before surface staining for 30 min at 4°C. Combinations of the following anti‐mouse antibodies were used: CD45.1 APC (clone A20); CD45.2 BV786 (104); CD3 FITC (145‐2C11); B220 FITC (RA3‐6B2); TCRβ PE‐Cy7 (H57‐597); MHCII alexa700 (M5/114.15.2); Ly6G PE‐Cy7 (1A8); CD11b PB and APC (M1/70); CD11c PerCP/Cy5.5 (N418); F4/80 FITC and alexa647 (BM8); CD44 FITC (IM7); CD62L PE (MEL‐14); CD8α APC (53‐6.7); CD4 PE and PerCP/Cy5.5 (RM4‐5); IFNγ FITC (XMG1.2); IL‐10 PE (JES5‐16E3). All antibodies were from BioLegend. To measure intracellular cytokines in T cells following ex vivo stimulation, cells were first stimulated in complete RPMI for 4 h at 37°C with 500 ng/ml PMA, 1 μg/ml ionomycin and 10 μg/ml brefeldin A (all from Sigma). For myeloid cells, cells were cultured as above either in the absence of exogenous stimulation (brefeldin A alone) or with Escherichia coli O55:B5 LPS (1 μg/ml with brefeldin A; Sigma). To measure antigen‐specific cytokine production, CD4+ cells were purified by magnetic separation (Miltenyi Biotec) from the spleens of day 28 L. donovani‐infected CD45.2 WT and miR‐132−/− mice and cultured for 3 days with naïve splenocytes (CD45.1 WT mice) as a source of antigen‐presenting cells (0.5 × 10⁶ CD45.2+ Ld CD4+, 1 × 10⁶ CD45.1+ naïve splenocytes). Cells were cultured either alone or with 1.5 × 10⁷ whole‐killed (freeze‐thawed) L. donovani amastigotes as a source of parasite antigen. Brefeldin A was added as above for the final 4 h of culture to permit accumulation of intracellular cytokines. CD45.2 and CD45.1 staining was used to assess cytokine production by CD4 T cells from L. donovani‐infected and naïve mice, respectively. For all intracellular cytokine staining, surface‐stained cells were fixed and permeabilised (20 min at 4°C) using fixation/permeabilisation solution before washes in Perm/Wash buffer (both from BD Biosciences). Cells were then stained with intracellular antibodies as above except in Perm/Wash buffer. Appropriate isotype controls were included. For FACS analysis, events were acquired on a LSRFortessa (BD Biosciences) before analysis with FlowJo (FlowJo, LLC). For cell sorting of splenic lymphocytes from naïve and Ld‐infected spleens, B cells were gated as B220+ CD3−; CD4 T cells as B220− CD3+ CD4+ CD8a−; and CD8 T cells as B220− CD3+ CD4− CD8α+. For purification of naïve and activated CD4 T cells from uninfected mice, single‐cell suspensions were prepared from pooled spleens and peripheral LN (axillary, brachial and inguinal). CD4+ cells were enriched using CD4 microbeads and LS columns (both from Miltenyi Biotec) before cell sorting of naïve CD4 T cells (CD4+ CD62L+ CD44− CD11b− CD8a− MHCII−). For cell sorting of splenic myeloid cell populations, cells were gated as Fig EV5C. Cell sorting was performed with a MoFlo Astrios (Beckman Coulter), and sorted cells were typically > 98% positive.
In vitro activation of CD4 T cells
Purified CD4 T cells were stimulated with 10 μg/ml plate‐bound anti‐CD3ε (clone 145‐2C11) and 2 μg/ml soluble anti‐CD28 (37.51) in RPMI 1640 as before in flat‐bottom 96‐well plates. For Th1 polarisation, cells were also treated with 15 ng/ml recombinant mouse IL‐12 and 5 μg/ml anti‐IL‐4 (11B11), or for Th2 polarisation, 30 ng/ml recombinant mouse IL‐4 and 5 μg/ml anti‐IFNγ (XMG1.2). Phenylephrine hydrochloride (Sigma) was used at 10 μM and added during both anti‐CD3 dependent activation (4 days) and also during rest in 10 U/ml recombinant human IL‐2 (2 days). All antibodies were from BioLegend and were low endotoxin/azide free, and recombinant cytokines were from Peprotech.
MEF cell culture, siRNA and miRNA mimic treatment
C57BL/6 MEFs were provided by Dr. D. Coverley (University of York, UK) and were cultured in DMEM (high glucose and pyruvate; ThermoFisher) supplemented with 10% FCS, Pen‐Strep and L‐glutamine as RPMI. For transfections, 5 × 10⁴ cells per well were seeded in 6‐well plates and transfected the next day with ON‐TARGETplus SMARTpool siRNA (100 nM), miRIDIAN miRNA mimics (50 nM), or appropriate controls (all from Dharmacon, GE Healthcare) using TransIT‐siQUEST transfection reagent (Mirus) and Opti‐MEM (ThermoFisher) for 6 h before being replaced with complete DMEM. EL4 cells were grown in RPMI supplemented with 10% FCS and were transfected with miRNA mimics using Neon Nucleofection as per manufacturer's instructions. Non‐targeting control (NTC) siRNAs or mimics were used as controls. Cells were harvested 48 h after transfection.
Quantitative reverse transcription PCR (qRT–PCR)
RNA was extracted from tissue samples or purified cell populations using QIAzol and miRNeasy RNA extraction kits (QIAGEN) according to manufacturer's instructions. Tissue samples were first dissociated in QIAzol using a TissueLyser LT with stainless steel beads (all from QIAGEN, UK). For detection of mature miRNA, cDNA was synthesised using TaqMan miRNA reverse transcription kits, and levels determined with TaqMan miRNA assays and TaqMan Universal PCR Master Mix (all from ThermoFisher). For mRNA transcripts, reverse transcriptions were carried out with Superscript III (ThermoFisher) and random hexamer primers (Promega), and measured with Fast SYBR Green Master Mix (ThermoFisher). PCR was performed using a StepOnePlus Real‐Time PCR System (ThermoFisher) and relative transcript levels determined using the ∆∆C t method. Mature miRNA levels were normalised to U6. RNA transcript levels in T cells from L. donovani‐infected mice, and MEFs were normalised to HPRT. As in vitro CD4 T cell activation changes HPRT, GAPDH and β‐actin expression levels, U6 was also used to normalise mRNA expression in day 0 and 1 naïve T cells. The following primer sequences were used:
BTAF1: Forward: 5′GCCTTTGGAAAGCTTTTGTG3′, Reverse: 5′CCAGTACCTGCCCCATGT3′. HPRT: Forward: 5′GCGTCGTGATTAGCGATGATGAAC3′, Reverse: 5′ATCTCCTTCATGACATCTCGAGCAAGTC3′. POLR2F: Forward: 5′GAGGAGGACGAAGGACTTGA3′, Reverse: 5′CCAGATGGGAGAATCTCGAC3′.
RPL12: Forward: 5′CGAAGATCGGTCCTCTGG3′, Reverse: 5′AATTCTGAGACCCTTCCAGTCA3′. RPL18: Forward: 5′CGCATGATCCGAAAGATGA3′, Reverse: 5′AACTTCCAGAATCCGCACAT3′. RPL26: Forward: 5′AGAAGGCTAATGGCACAACC3′, Reverse: 5′TCCAGCTTTAGCCTGGTGAT3′. RPL27: Forward: 5′TGAAAGGTTAGCGGAAGTGC3′, Reverse: 5′CATGAACTTGCCCATCTCG3′. RPL8: Forward: 5′CAACAGAGCCGTTGTTGGT3′, Reverse: 5′CAGCCTTTAAGATAGGCTTGTCA3′. RPS10: Forward: 5′GTGAGCGACCTGCAAGATTC3′, Reverse: 5′CAGCCTCAGCTTTCTTGTCA3′. RPS14: Forward: 5′AGTCTGGAGACGACGATCAGA3′, Reverse: 5′CAGACACCAAACACATTCTCTCC3′. RPS30: Forward: 5′GGTCGCCCAGATCAAAGAT3′, Reverse: 5′TGCCAGAAGCACGACTTG3′. RPS3A: Forward: 5′TGGCAAGAAGGGAGCTAAGA3′, Reverse: 5′GTGTCTTCCCGATGTTCCTAAT3′. RPS9: Forward: 5′ATCCGCCAACGTCACATTA3′, Reverse: 5′TCTTCACTCGGCCTGGAC3′. RPSA: Forward: 5′GGTCCATACGGCGTTGTT3′, Reverse: 5′GCAGCAAGGAATTTGAGGAC3′. RPL14‐ps1: Forward: 5′TGCTGCTGCTGCTAAAGCTA3′, Reverse: 5′CAGCCTTCTTGCCTGGTC3′. RPL23‐ps3: Forward: 5′ATAAGGCCCGACGGAGAG3′, Reverse: 5′GAATTAGCCATCTGGACTCAGTTT3′.
SDS–PAGE, Western blotting and protein synthesis assays
Cells were washed twice in PBS and protein extracts prepared in RIPA buffer (150 mM NaCl, 10 mM Tris pH 7.2, 5 mM EDTA, 0.1% SDS, 0.1% Triton X‐100, 1% sodium deoxycholate, 1 mM PMSF, 1% Protease Inhibitor cocktail P8340, 1% Phosphate Inhibitors cocktails 2 and 3; all from Sigma). Equal total amounts of protein were resolved on SDS–PAGE gels and transferred to PVDF membranes (Millipore) using a Bio‐Rad SD Semi‐Dry Transfer Cell, blocked for 2 h at room temperature in 2% BSA (ThermoFisher) or 5% milk powder (Sigma) in TBST (150 mM NaCl, 7.7 mM Tris–HCl pH 8, 0.1% Tween‐20; all Sigma) before overnight probing with primary antibodies at 4°C. Antibodies were as follows: total CREB (clone 48H2), p‐CREB S133 (87G3), BTAF1 (rabbit pAb #2637; all Cell Signaling Technology), p300 (clone NM11), Rpl27 (14980‐1‐AP; Proteintech), Rps9 (14894‐1‐AP; Proteintech), β‐actin (AC‐15), GAPDH (9484; all from Abcam). Following extensive washing in TBST, blots were incubated with secondary antibodies (goat anti‐rabbit or mouse HRP; DAKO) for 1 h at room temp, washed as before, and developed with ECL Western Blotting Detection Reagent and Hyperfilm ECL (both from GE Healthcare). Densitometry was performed using Fiji/ImageJ.
Protein synthesis rates were measured by puromycin incorporation 31. Cells were pulsed for 10 min with 10 μg/ml puromycin (Sigma) and then washed and incubated for an extra 50 min before lysed and used for Western blotting analysis. Puromycin was detected with the monoclonal antibody clone 12D10 (Merck Millipore).
RNA sequencing analysis
Sequence reads were trimmed to remove adaptor sequences with Cutadapt and mapped to mouse genome GRCm38 with HISAT2 49 including “rna‐strandness FR” option. Data available at GEO, accession number GSE125268. Transcriptome assembly and quantification were performed using the Tuxedo pipeline (version 2.2.1) 50. Cufflinks was used to assemble transcriptomes for each sample using the GTF annotation file for the GRCm38 mouse genome. This was followed by running Cuffmerge to merge individual sample transcriptomes into full transcriptomes. Quantification and normalisation were carried out for each experiment using Cuffquant and Cuffnorm. Differential expression on gene FPKM values was performed by conducting paired and independent t‐tests with Benjamini–Hochberg false discovery rate correction. GSEA (http://software.broadinstitute.org/gsea) and STRING analysis (http://string-db.org/) were performed where indicated. For analysis of genes differentially expressed between WT and miR‐132−/− CD4 T cells from Ld‐infected spleens, transcripts were required to be significantly dysregulated (> 50% change from WT levels, P < 0.05) with FPKM values > 1, and STRING settings were highest confidence interactions only excluding text mining. Targetscan (http://www.targetscan.org/vert_71/) was used to predict targets of miRNA from the miR‐212/132 cluster (cumulative weighted context score++ < −0.1).
Luciferase assays
BTAF1 3′UTR was amplified from mouse spleen cDNA (reverse transcribed with Superscript II and oligo‐dT primers; both from ThermoFisher) using the following primers: forward 5′CTCGAGTGCAACTGCTGCTAGCTCAGTTA3′ (which introduces 5′ Xho I site) and reverse 5′GCGGCCGCTTATGAAAGCAGACAAGTA3′ (which introduces 3′ Not I site). The 1.5‐kb amplicon, which encompasses most of the 3′ UTR of BTAF1 minus a 25‐nt 5′ GC‐rich stretch, was cloned into pGEM‐T vector (Promega) and sequence verified. We also performed site‐directed mutagenesis to remove the miR‐212/132 seed sequence using QuikChange Site‐Directed Mutagenesis (Agilent) with the following primer pairs:
5′CTGAACCCTGTGGTAAAGACTAAATACTGTAGCAGGGCCTGAAGC3′ and 5′GCTTCAGGCCCTGCTACAGTATTTAGTCTTTACCACAGGGTTCAG3′, resulting in mutation of WT sequence (5′AACCCUGUGGUAAAGACUGUUU3′) to mutant (5′AACCCUGUGGUAAAGACUAAAU3′). Inserts were excised with XhoI and NotI (NEB) and ligated into psiCHECK‐2 (Promega). Luciferase assays were performed in HeLa and 3T3 cells 24 h after transfection as previously described 3.
Statistical analysis
Statistical analyses were carried out as indicated with Prism 5 (GraphPad Software Inc). Two‐way comparisons used paired or unpaired t‐tests as indicated and multiple comparisons used one‐way ANOVA, followed by Bonferroni correction for multiple testing. P‐values of < 0.05 were considered significant. *P < 0.05, **P < 0.01, ***P < 0.001, ****P < 0.0001. Statistical significance in enrichment of RP genes (as in Fig 2I) was determined using chi‐square test.
Author contributions
DL conceived, designed and supervised the project. DL and JPH designed experiments. PMK and TVS contributed to experimental design. JPH, KMS, NB, PG, SH and DL performed experiments. JPH, KN, KMS and DL analysed experiments. JPH and DL wrote the manuscript. All authors critiqued and edited the manuscript.
Conflict of interest
The authors declare that they have no conflict of interest.
Supporting information
Expanded View Figures PDF
Source Data for Expanded View
Review Process File
Source Data for Figure 2G
Source Data for Figure 3
Acknowledgements
The study was funded by the UK Medical Research Council through a New Investigator Research Grant (MR/L008505/1) awarded to D.L., a Programme Grant awarded to P.M.K. (G1000230), and a project Grant awarded to T.V.S. (MR/N009185/1). We would like to thank Dr R. Goodman and Dr G. Zhang for providing the miR‐132‐/miR‐212‐knockout mice, Dr A. O'Garra for the IL‐10‐knockout mice and Dr M. Kullberg for helpful discussions. We thank staff at the Imaging and Cytometry Lab in the University of York Bioscience Technology Facility for cell sorting and imaging support and advice.
EMBO Reports (2019) 20: e46620
References
- 1. Mehta A, Baltimore D (2016) MicroRNAs as regulatory elements in immune system logic. Nat Rev Immunol 16: 279–294 [DOI] [PubMed] [Google Scholar]
- 2. Wanet A, Tacheny A, Arnould T, Renard P (2012) miR‐212/132 expression and functions: within and beyond the neuronal compartment. Nucleic Acids Res 40: 4742–4753 [DOI] [PMC free article] [PubMed] [Google Scholar]
- 3. Lagos D, Pollara G, Henderson S, Gratrix F, Fabani M, Milne RS, Gotch F, Boshoff C (2010) miR‐132 regulates antiviral innate immunity through suppression of the p300 transcriptional co‐activator. Nat Cell Biol 12: 513–519 [DOI] [PubMed] [Google Scholar]
- 4. Nahid MA, Yao B, Dominguez‐Gutierrez PR, Kesavalu L, Satoh M, Chan EK (2013) Regulation of TLR2‐mediated tolerance and cross‐tolerance through IRAK4 modulation by miR‐132 and miR‐212. J Immunol 190: 1250–1263 [DOI] [PMC free article] [PubMed] [Google Scholar]
- 5. Shaked I, Meerson A, Wolf Y, Avni R, Greenberg D, Gilboa‐Geffen A, Soreq H (2009) MicroRNA‐132 potentiates cholinergic anti‐inflammatory signaling by targeting acetylcholinesterase. Immunity 31: 965–973 [DOI] [PubMed] [Google Scholar]
- 6. Taganov KD, Boldin MP, Chang KJ, Baltimore D (2006) NF‐kappaB‐dependent induction of microRNA miR‐146, an inhibitor targeted to signaling proteins of innate immune responses. Proc Natl Acad Sci USA 103: 12481–12486 [DOI] [PMC free article] [PubMed] [Google Scholar]
- 7. Mehta A, Mann M, Zhao JL, Marinov GK, Majumdar D, Garcia‐Flores Y, Du X, Erikci E, Chowdhury K, Baltimore D (2015) The microRNA‐212/132 cluster regulates B cell development by targeting Sox4. J Exp Med 212: 1679–1692 [DOI] [PMC free article] [PubMed] [Google Scholar]
- 8. Mehta A, Zhao JL, Sinha N, Marinov GK, Mann M, Kowalczyk MS, Galimidi RP, Du X, Erikci E, Regev A et al (2015) The MicroRNA‐132 and MicroRNA‐212 cluster regulates hematopoietic stem cell maintenance and survival with age by buffering FOXO3 expression. Immunity 42: 1021–1032 [DOI] [PMC free article] [PubMed] [Google Scholar]
- 9. Hanieh H, Alzahrani A (2013) MicroRNA‐132 suppresses autoimmune encephalomyelitis by inducing cholinergic anti‐inflammation: a new Ahr‐based exploration. Eur J Immunol 43: 2771–2782 [DOI] [PubMed] [Google Scholar]
- 10. Iliopoulos D, Jaeger SA, Hirsch HA, Bulyk ML, Struhl K (2010) STAT3 activation of miR‐21 and miR‐181b‐1 via PTEN and CYLD are part of the epigenetic switch linking inflammation to cancer. Mol Cell 39: 493–506 [DOI] [PMC free article] [PubMed] [Google Scholar]
- 11. Li D, Wang A, Liu X, Meisgen F, Grunler J, Botusan IR, Narayanan S, Erikci E, Li X, Blomqvist L et al (2015) MicroRNA‐132 enhances transition from inflammation to proliferation during wound healing. J Clin Invest 125: 3008–3026 [DOI] [PMC free article] [PubMed] [Google Scholar]
- 12. Xiao J, Li Y, Prandovszky E, Karuppagounder SS, Talbot CC Jr, Dawson VL, Dawson TM, Yolken RH (2014) MicroRNA‐132 dysregulation in Toxoplasma gondii infection has implications for dopamine signaling pathway. Neuroscience 268: 128–138 [DOI] [PMC free article] [PubMed] [Google Scholar]
- 13. Ni B, Rajaram MV, Lafuse WP, Landes MB, Schlesinger LS (2014) Mycobacterium tuberculosis decreases human macrophage IFN‐gamma responsiveness through miR‐132 and miR‐26a. J Immunol 193: 4537–4547 [DOI] [PubMed] [Google Scholar]
- 14. Magill ST, Cambronne XA, Luikart BW, Lioy DT, Leighton BH, Westbrook GL, Mandel G, Goodman RH (2010) microRNA‐132 regulates dendritic growth and arborization of newborn neurons in the adult hippocampus. Proc Natl Acad Sci USA 107: 20382–20387 [DOI] [PMC free article] [PubMed] [Google Scholar]
- 15. Asmal M, Colgan J, Naef F, Yu B, Lee Y, Magnasco M, Luban J (2003) Production of ribosome components in effector CD4+ T cells is accelerated by TCR stimulation and coordinated by ERK‐MAPK. Immunity 19: 535–548 [DOI] [PubMed] [Google Scholar]
- 16. Vo N, Klein ME, Varlamova O, Keller DM, Yamamoto T, Goodman RH, Impey S (2005) A cAMP‐response element binding protein‐induced microRNA regulates neuronal morphogenesis. Proc Natl Acad Sci USA 102: 16426–16431 [DOI] [PMC free article] [PubMed] [Google Scholar]
- 17. Kaiser M, Wiggin GR, Lightfoot K, Arthur JS, Macdonald A (2007) MSK regulate TCR‐induced CREB phosphorylation but not immediate early gene transcription. Eur J Immunol 37: 2583–2595 [DOI] [PubMed] [Google Scholar]
- 18. Kaye P, Scott P (2011) Leishmaniasis: complexity at the host‐pathogen interface. Nat Rev Microbiol 9: 604–615 [DOI] [PubMed] [Google Scholar]
- 19. Rodriguez A, Vigorito E, Clare S, Warren MV, Couttet P, Soond DR, van Dongen S, Grocock RJ, Das PP, Miska EA et al (2007) Requirement of bic/microRNA‐155 for normal immune function. Science 316: 608–611 [DOI] [PMC free article] [PubMed] [Google Scholar]
- 20. Yang L, Boldin MP, Yu Y, Liu CS, Ea CK, Ramakrishnan P, Taganov KD, Zhao JL, Baltimore D (2012) miR‐146a controls the resolution of T cell responses in mice. J Exp Med 209: 1655–1670 [DOI] [PMC free article] [PubMed] [Google Scholar]
- 21. Grigoryev YA, Kurian SM, Hart T, Nakorchevsky AA, Chen C, Campbell D, Head SR, Yates JR III, Salomon DR (2011) MicroRNA regulation of molecular networks mapped by global microRNA, mRNA, and protein expression in activated T lymphocytes. J Immunol 187: 2233–2243 [DOI] [PMC free article] [PubMed] [Google Scholar]
- 22. Subramanian A, Tamayo P, Mootha VK, Mukherjee S, Ebert BL, Gillette MA, Paulovich A, Pomeroy SL, Golub TR, Lander ES et al (2005) Gene set enrichment analysis: a knowledge‐based approach for interpreting genome‐wide expression profiles. Proc Natl Acad Sci USA 102: 15545–15550 [DOI] [PMC free article] [PubMed] [Google Scholar]
- 23. Szklarczyk D, Franceschini A, Wyder S, Forslund K, Heller D, Huerta‐Cepas J, Simonovic M, Roth A, Santos A, Tsafou KP et al (2015) STRING v10: protein‐protein interaction networks, integrated over the tree of life. Nucleic Acids Res 43: D447–D452 [DOI] [PMC free article] [PubMed] [Google Scholar]
- 24. Stubbington MJ, Mahata B, Svensson V, Deonarine A, Nissen JK, Betz AG, Teichmann SA (2015) An atlas of mouse CD4(+) T cell transcriptomes. Biol Direct 10: 14 [DOI] [PMC free article] [PubMed] [Google Scholar]
- 25. Tan TCJ, Knight J, Sbarrato T, Dudek K, Willis AE, Zamoyska R (2017) Suboptimal T‐cell receptor signaling compromises protein translation, ribosome biogenesis, and proliferation of mouse CD8 T cells. Proc Natl Acad Sci USA 114: E6117–E6126 [DOI] [PMC free article] [PubMed] [Google Scholar]
- 26. Nosrati N, Kapoor NR, Kumar V (2014) Combinatorial action of transcription factors orchestrates cell cycle‐dependent expression of the ribosomal protein genes and ribosome biogenesis. FEBS J 281: 2339–2352 [DOI] [PubMed] [Google Scholar]
- 27. Perry RP (2005) The architecture of mammalian ribosomal protein promoters. BMC Evol Biol 5: 15 [DOI] [PMC free article] [PubMed] [Google Scholar]
- 28. Thomas MJ, Seto E (1999) Unlocking the mechanisms of transcription factor YY1: are chromatin modifying enzymes the key? Gene 236: 197–208 [DOI] [PubMed] [Google Scholar]
- 29. Auble DT, Wang D, Post KW, Hahn S (1997) Molecular analysis of the SNF2/SWI2 protein family member MOT1, an ATP‐driven enzyme that dissociates TATA‐binding protein from DNA. Mol Cell Biol 17: 4842–4851 [DOI] [PMC free article] [PubMed] [Google Scholar]
- 30. Choukrallah MA, Kobi D, Martianov I, Pijnappel WW, Mischerikow N, Ye T, Heck AJ, Timmers HT, Davidson I (2012) Interconversion between active and inactive TATA‐binding protein transcription complexes in the mouse genome. Nucleic Acids Res 40: 1446–1459 [DOI] [PMC free article] [PubMed] [Google Scholar]
- 31. Schmidt EK, Clavarino G, Ceppi M, Pierre P (2009) SUnSET, a nonradioactive method to monitor protein synthesis. Nat Methods 6: 275–277 [DOI] [PubMed] [Google Scholar]
- 32. Venters BJ, Irvin JD, Gramlich P, Pugh BF (2011) Genome‐wide transcriptional dependence on conserved regions of Mot1. Mol Cell Biol 31: 2253–2261 [DOI] [PMC free article] [PubMed] [Google Scholar]
- 33. Alvarez‐Saavedra M, Antoun G, Yanagiya A, Oliva‐Hernandez R, Cornejo‐Palma D, Perez‐Iratxeta C, Sonenberg N, Cheng HY (2011) miRNA‐132 orchestrates chromatin remodeling and translational control of the circadian clock. Hum Mol Genet 20: 731–751 [DOI] [PMC free article] [PubMed] [Google Scholar]
- 34. Ledda M, Di Croce M, Bedini B, Wannenes F, Corvaro M, Boyl PP, Caldarola S, Loreni F, Amaldi F (2005) Effect of 3′UTR length on the translational regulation of 5′‐terminal oligopyrimidine mRNAs. Gene 344: 213–220 [DOI] [PubMed] [Google Scholar]
- 35. Cope A, Le Friec G, Cardone J, Kemper C (2011) The Th1 life cycle: molecular control of IFN‐gamma to IL‐10 switching. Trends Immunol 32: 278–286 [DOI] [PubMed] [Google Scholar]
- 36. Zhang Z, Liu R, Townsend PA, Proud CG (2013) p90(RSK)s mediate the activation of ribosomal RNA synthesis by the hypertrophic agonist phenylephrine in adult cardiomyocytes. J Mol Cell Cardiol 59: 139–147 [DOI] [PubMed] [Google Scholar]
- 37. Segev N, Gerst JE (2018) Specialized ribosomes and specific ribosomal protein paralogs control translation of mitochondrial proteins. J Cell Biol 217: 117–126 [DOI] [PMC free article] [PubMed] [Google Scholar]
- 38. Xue S, Barna M (2012) Specialized ribosomes: a new frontier in gene regulation and organismal biology. Nat Rev Mol Cell Biol 13: 355–369 [DOI] [PMC free article] [PubMed] [Google Scholar]
- 39. Anderson CF, Oukka M, Kuchroo VJ, Sacks D (2007) CD4(+)CD25(‐)Foxp3(‐) Th1 cells are the source of IL‐10‐mediated immune suppression in chronic cutaneous leishmaniasis. J Exp Med 204: 285–297 [DOI] [PMC free article] [PubMed] [Google Scholar]
- 40. Jankovic D, Kullberg MC, Feng CG, Goldszmid RS, Collazo CM, Wilson M, Wynn TA, Kamanaka M, Flavell RA, Sher A (2007) Conventional T‐bet(+)Foxp3(‐) Th1 cells are the major source of host‐protective regulatory IL‐10 during intracellular protozoan infection. J Exp Med 204: 273–283 [DOI] [PMC free article] [PubMed] [Google Scholar]
- 41. Nylen S, Maurya R, Eidsmo L, Manandhar KD, Sundar S, Sacks D (2007) Splenic accumulation of IL‐10 mRNA in T cells distinct from CD4+CD25+(Foxp3) regulatory T cells in human visceral leishmaniasis. J Exp Med 204: 805–817 [DOI] [PMC free article] [PubMed] [Google Scholar]
- 42. Owens BM, Beattie L, Moore JW, Brown N, Mann JL, Dalton JE, Maroof A, Kaye PM (2012) IL‐10‐producing Th1 cells and disease progression are regulated by distinct CD11c(+) cell populations during visceral leishmaniasis. PLoS Pathog 8: e1002827 [DOI] [PMC free article] [PubMed] [Google Scholar]
- 43. Saraiva M, Christensen JR, Veldhoen M, Murphy TL, Murphy KM, O'Garra A (2009) Interleukin‐10 production by Th1 cells requires interleukin‐12‐induced STAT4 transcription factor and ERK MAP kinase activation by high antigen dose. Immunity 31: 209–219 [DOI] [PMC free article] [PubMed] [Google Scholar]
- 44. Gautam S, Kumar R, Maurya R, Nylen S, Ansari N, Rai M, Sundar S, Sacks D (2011) IL‐10 neutralization promotes parasite clearance in splenic aspirate cells from patients with visceral leishmaniasis. J Infect Dis 204: 1134–1137 [DOI] [PMC free article] [PubMed] [Google Scholar]
- 45. Murphy ML, Wille U, Villegas EN, Hunter CA, Farrell JP (2001) IL‐10 mediates susceptibility to Leishmania donovani infection. Eur J Immunol 31: 2848–2856 [DOI] [PubMed] [Google Scholar]
- 46. Murray HW, Moreira AL, Lu CM, DeVecchio JL, Matsuhashi M, Ma X, Heinzel FP (2003) Determinants of response to interleukin‐10 receptor blockade immunotherapy in experimental visceral leishmaniasis. J Infect Dis 188: 458–464 [DOI] [PubMed] [Google Scholar]
- 47. Ranatunga D, Hedrich CM, Wang F, McVicar DW, Nowak N, Joshi T, Feigenbaum L, Grant LR, Stager S, Bream JH (2009) A human IL10 BAC transgene reveals tissue‐specific control of IL‐10 expression and alters disease outcome. Proc Natl Acad Sci USA 106: 17123–17128 [DOI] [PMC free article] [PubMed] [Google Scholar]
- 48. Dalton JE, Maroof A, Owens BM, Narang P, Johnson K, Brown N, Rosenquist L, Beattie L, Coles M, Kaye PM (2010) Inhibition of receptor tyrosine kinases restores immunocompetence and improves immune‐dependent chemotherapy against experimental leishmaniasis in mice. J Clin Invest 120: 1204–1216 [DOI] [PMC free article] [PubMed] [Google Scholar]
- 49. Kim D, Langmead B, Salzberg SL (2015) HISAT: a fast spliced aligner with low memory requirements. Nat Methods 12: 357–360 [DOI] [PMC free article] [PubMed] [Google Scholar]
- 50. Trapnell C, Roberts A, Goff L, Pertea G, Kim D, Kelley DR, Pimentel H, Salzberg SL, Rinn JL, Pachter L (2012) Differential gene and transcript expression analysis of RNA‐seq experiments with TopHat and Cufflinks. Nat Protoc 7: 562–578 [DOI] [PMC free article] [PubMed] [Google Scholar]
Associated Data
This section collects any data citations, data availability statements, or supplementary materials included in this article.
Supplementary Materials
Expanded View Figures PDF
Source Data for Expanded View
Review Process File
Source Data for Figure 2G
Source Data for Figure 3