

Abstract
Our work has focused on defining the utility of fluorine (19F)-labeled bile acid analogues and magnetic resonance imaging (MRI) to identify altered bile acid transport in vivo. In the current study, we explored the ability of this approach to differentiate fibroblast growth factor-15 (FGF15)- deficient from wild-type (WT) mice, a potential diagnostic test for bile acid diarrhea, a commonly misdiagnosed disorder. FGF15 is the murine homologue of human FGF19, an intestinal hormone whose deficiency is an underappreciated cause of bile acid diarrhea. In a pilot and three subsequent pharmacokinetic studies, we treated mice with two 19F-labeled bile acid analogues, CA-lys-TFA and CA-sar-TFMA. After oral dosing, we quantified 9F-labeled bile acid analogue levels in the gallbladder, liver, small and large intestine, and plasma using liquid chromatography mass spectrometry (LC-MS/MS). Both 19F bile acid analogues concentrated in the gallbladders of FGF15-deficient and WT mice, attaining peak concentrations at approximately 8.5 h after oral dosing. However, analogue levels in gallbladders of FGF15-deficient mice were several-fold less compared to those in WT mice. Live-animal 19F MRI provided agreement with our LC-MS/MS-based measures; we detected robust CA-lys-TFA 19F signals in gallbladders of WT mice but no signals in FGF15-deficient mice. Our finding that 19F MRI differentiates FGF15-deficient from WT mice provides additional proof-of-concept for the development of 19F bile acid analogues and 19F MRI as a clinical test to diagnose bile acid diarrhea due to FGF19 deficiency and other disorders.
Keywords: bile acid synthesis, fluorine MRI, enterohepatic circulation, FGF1S/19, bile acid diarrhea, imaging methods
Graphical Abstract
INTRODUCTION
The past 20 years have witnessed a great expansion in our understanding of the role bile acids play in both normal physiology and disease as well as the complex processes that maintain bile acid homeostasis.1 Despite these advances, there remains a paucity of tools to examine bile acid transport in vivo. To address this limitation, we investigated the potential of using bile acid analogues labeled with naturally occurring fluorine, 19F, and in vivo magnetic resonance imaging (MRI) to visualize bile acids in anatomical compartments, primarily the gallbladder.2–4 The work described herein focuses on the potential utility of 19F bile acid MRI to diagnose bile acid diarrhea, a condition frequently misdiagnosed as diarrhea-predominant irritable bowel syndrome (IBS-D).5
In humans, a gut hormone, fibroblast growth factor-19 (FGF19), governs intestinal feedback regulation of hepatic bile acid synthesis. FGF15 is the murine homologue of FGF19; the designation FGF19/15 refers to processes common to both the human and murine hormones. Bile acids actively absorbed by ileal enterocytes via the apical sodium-dependent bile acid transporter (ASBT, encoded by SLC10A2) bind and activate the nuclear farnesoid X receptor (FXR), which, among many actions, regulates the production and release of FGF19/15. FGF19/15 circulates to the liver where its interaction with the FGF receptor-4 complex on hepatocytes results in inhibition of hepatocyte 7-alpha-hydroxylase (CYP7A1), the rate-limiting enzyme that catalyzes cholesterol hydrolysis and the formation of primary bile acids.
In FGF19/15 deficiency, the absence of feedback regulation of bile acid synthesis results in excess production of bile acids, reduced gallbladder filling, and increased levels of bile acids in the distal small intestinal that may overwhelm ASBT transport capacity, thereby increasing bile acid spillage into the colon. Increased fecal bile acid levels in the colon are associated with several harmful effects, including inflammation, altered water and electrolyte secretion, and stimulated motility that may result in diarrhea. Estimates suggest as many as one-third of individuals diagnosed with IBS-D, a common disorder, actually have bile acid diarrhea due to FGF19 deficiency.5
For more than 30 years, the most common approach available to diagnose bile acid diarrhea in Europe and Canada has been 75selenium homotaurocholic acid retention testing (SeHCAT). Although relatively easy to perform, this test requires ingestion of a radiolabeled compound, a nuclear medicine laboratory, and is neither FDA-approved nor available for use in the United States.6 Another method, direct measurement of fecal bile acids, is expensive, unavailable in most hospitals and clinics, requires a research laboratory, and is performed rarely. The recently developed plasma 7α-hydroxy-4-cholestene-3-one (C4) assay is less sensitive and specific than SeHCAT testing and is not widely available. Measuring serum FGF19 levels is possible but requires additional validation before clinical use.7 In the United States, the most common approach to diagnosing bile acid diarrhea remains the exclusion of other causes of diarrhea and a therapeutic trial of a bile acid binder such as cholestyramine or colesevalam. Although decreased diarrhea following treatment with these agents is considered indirect evidence of bile acid diarrhea, this approach is nonspecific.8
The initial concept driving the current line of investigation was to use MRI, a technique that does not expose individuals to ionizing radiation, to “see” the transport of 19F-labeled bile acid analogues that mimic native bile acid transport in both in vitro and in vivo studies.2–4,9 We chose to image the gallbladder, an organ that concentrates bile acids into the millimolar range, orders of magnitude greater than bile acid concentrations observed in any other organ. In mice gavaged with these fluorinated bile acid probes, we consistently detected a strong 19F MRI signal in gallbladders of wild-type (WT) mice; 19F MRI signals were not detected in gallbladders of ASBT-deficient mice.2,3 With regard to the present work, we reasoned that FGF15-deficient mice would also have a diminished 19F MRI signal in the gallbladder. We anticipated that overproduction of native bile acids and their spillage into the gut would dilute 19F- labeled bile acid analogues and increase competition for transport by ASBT. These factors were likely to reduce intestinal uptake, enterohepatic circulation, and gallbladder accumulation of 19F-labeled bile acid probes.
In the present study, we investigated the potential utility of 19F-labeled bile acids as tools to diagnose bile acid diarrhea resulting from FGF19/15 deficiency. We used biochemical quantification and in vivo 19F MRI imaging to compare the accumulation of two previously characterized 19F bile acid analogue probes, trifluoroacetyl l-lysine and trifluoro-N-methyl- acetamide conjugates of the native human primary bile acid cholic acid (i.e., CA-lys-TFA and CA-sar-TFMA), in gallbladders from WT and FGF15-deficient mice.
EXPERIMENTAL SECTION
Materials.
Cholic acid, Dulbecco’s phosphate-buffered saline (DPBS), and poly(ethylene glycol) (PEG) 400 were purchased from Sigma-Aldrich (St. Louis, Missouri). Compounds 1, 3, and 5 were commercially available. We obtained all chemicals from commercial suppliers and used them without further purification.
Synthesis of CA-lys-TFA (Compound 4).
We synthesized CA-lys-TFA, as well as CA-sar-TFMA (below), using an approach modified from that described previously (Supporting Information: Synthesis of CA-lys-TFA and CA-sar-TFMA).2,4 Briefly, we synthesized target compound 4 as depicted in Figure 1. Activation of cholic acid 1 using HATU yielded the intermediate ester 2. Coupling of compound 2 with trifluoroacetyl l-lysine 3 provided the final product 4, CA-lys-TFA, in good yield.
Figure 1.

Synthesis of Compound 4 (CA-lys-TFA). Reagents and conditions: (a) HATU, Et3N, DMF, RT, 4 h; (b) DMF, RT, 12 h, 80% for two steps.
Synthesis of CA-sar-TFMA (Compound 10).
The synthesis of compound 10 began with N-Boc-ethylenediamine 5 (Figure 2). Compound 5 was allowed to react with benzyl bromoacetate to yield compound 6 in high yield. Next, we removed the Boc-protecting group of compound 6 using TFA to generate amine 7, which was treated with trifluoroacetic anhydride (TFAA) to give compound 8 in high yield. Compound 8 was coupled to compound 2 to obtain the benzyl ester 9 in high yield. Finally, the benzyl-protecting group was removed by catalytic hydrogenation to yield product 10, CA-sar-TFMA, in good yield.
Figure 2.

Synthesis of Compound 10 (CA-sar-TFMA). Reagents and conditions: (a) benzyl bromoacetate, NaOH, DMF, RT, 12 h, 78%; (b) TFA, DCM, RT, 1 h; (c) trifluoroacetic anhydride, DCM, RT, 12 h, 83% for two steps; (d) 2, DMF, RT, 12 h; (e) Pd/C, H2, EtOH, RT, 12 h, 81% for two steps.
Chemical Analysis.
We visualized analytical thin layer chromatography by ultraviolet light at 254 nM. We recorded XH NMR and 19F NMR spectra on a Varian (400 MHz) spectrometer. Mass spectra were recorded using electrospray as the ionization technique. Per NMR, the purities of the final products 4 and 10 were >95% (Supporting Information: Figures S1–S8).
Animals.
All animal studies were approved by the Institutional Animal Care and Use Committee of the University of Maryland School of Medicine and the Research and Development Committee at the VA Maryland Health Care System. We conducted animal studies in accordance with the Guide for the Care and Use of Laboratory Animals prepared by the U.S. National Academy of Sciences. Male FGF15-deficient and WT mice (on the same 25% C57BL/6J; 75% 129SvJ mixed genetic background) were kindly provided by Dr. Grace Guo (Rutgers University, Ernest Mario School of Pharmacy, Piscataway, NJ).10 We housed mice with free access to water and standard mouse chow in a pathogen-free environment with a 12:12 h light/dark cycle for 1 week prior to experiments. After a fast of at least 6 h, mice underwent oral gavage with CA-sar-TFMA and/or CA-lys- TFA in vehicle (60% PEG 400 and 40% DPBS, 8.33 μL per g mouse body weight) and were subsequently anesthetized with ketamine/xylazine at different time points. Doses of imaging agents reflect their slight difference in molecular weight and provide the same molar dose in micromol/kg mouse body weight (1.24 mmol/kg for 75 mg/kg CA-sar-TFMA and 78.5 mg/kg CA-lys-TFA; 2.48 mmol/kg for 150 mg/kg CA-lys-TFA).
Oral Disposition Characterization.
We characterized the oral disposition of the two bile acid analogues via destructive sampling in Fgf15−/− and WT mice through a series of experiments. In a pilot study, four Fgf15−/− and four WT mice were concomitantly gavaged with 75 mg/kg CA-sar-TFMA and mg/kg CA-lys-TFA. At 7, 10, 24, and 72 h postdosing, we euthanized mice and harvested the gallbladder, liver, and blood. We collected blood into heparinized tubes that we then centrifuged at 12 000g for 10 min. We analyzed supernatants using LC-MS/MS. The liver and gallbladder were homogenized on ice with a glass tissue homogenizer (Duall size-21; Kimble Chase Life Science, Vineland, New Jersey). We extracted CA-sar-TFMA and CA-lys-TFA with 75% ACN in water (800 μL for liver and 300 μL for gallbladder). We centrifuged extracts at 12 000g for 10 min before analysis by LC/MS/MS.
Favorable gallbladder results from the pilot study led to pharmacokinetic study 1, wherein five Fgf15−/− and five WT mice were concomitantly gavaged with 7.5 mg/kg CA-sar-TFMA and 7.85 mg/kg CA-lys-TFA. At 7, 8.5, 10, 16, and 24 h postgavage, we euthanized mice and harvested and processed gallbladders as above. In pharmacokinetic study 2, nine Fgf15−/− and nine wild-type mice were concomitantly gavaged with 7.5, 22.5, or 75 mg/kg CA-sar-TFMA and 7.85, 23.5, or 78.5 mg/kg CA-lys-TFA, respectively. We euthanized mice 8.5 h postgavage and harvested and processed gallbladders as above. In pharmacokinetic study 3, nine Fgf15−/− and nine WT mice were concomitantly gavaged in triplicate with 75 mg/kg CA-sar-TFMA and 78.5 mg/kg CA-lys-TFA. We euthanized mice at 7, 8.5, and 10 h postdosing and harvested the gallbladder, small intestine, cut into three equal segments, cecum, and colon. We extracted CA-sar-TFMA and CA-lys-TFA with 75% ACN in water (300 μL for gallbladder, 450 μL for small intestine segments, 650μL for cecum, and 600 μL for colon). We centrifuged extracts at 12 000g for 10 min before LC-MS/MS analysis.
In Vitro Stability of CA-lys-TFA and CA-sar-TFMA in Mouse Stool.
We evaluated the ability of mouse stool to hydrolyze CA-lys-TFA and CA-sar-TFMA in vitro. We collected and pooled stool pellets from multiple Fgf15−/− and WT mice maintained in metabolic cages to prevent coprophagia. We removed debris and then lyophilized stool for 2 h using a Thermo Scientific Savant SpeedVac concentrator (Thermo Fisher Scientific, Waltham, MA). Then, we ground stool into a fine powder using a mortar and pestle. We incubated 50 mg aliquots of stool with CA-sar-TFMA or CA-lys-TFA in a water bath maintained at 37 °C for 0, 2, 4, 8, and 24 h. We quenched samples with ACN, centrifuged them at 10 000g for 10 min, and stored them at −80 °C until analysis by LC-MS/MS.
In Vitro Stability of CA-sar-TFMA and CA-lys-TFA in Gallbladder Homogenate.
To prepare gallbladder homogenates, we collected, pooled, and homogenized in DPBS the gallbladders of four WT mice that had not been gavaged with probes. Aliquots of gallbladder homogenate were prepared in triplicate with CA-sar-TFMA and CA-lys-TFA and incubated in a water bath maintained at 37 °C for 0, 20, 40, 60, 90, 120, 240, 480, and 1440 min. Samples were quenched with ACN, centrifuged at 12 000g for 10 min, and stored at −80 °C until analysis by LC-MS/MS.
Murine Gallbladder Imaging.
After fasting and gavage as described above, we anesthetized mice with ketamine/xylazine injected through an intraperitoneal (i.p.) catheter and imaged them by 1H MRI and 19F MRI ~8.5 h after CA-lys-TFA dosing (1.5 h total 19F acquisition time). Approximately every 30 min throughout imaging, we infused maintenance doses of ketamine/xylazine through the i.p. catheter. The mice remained in the MRI machine for 2 h, for system calibration and 1H and 19F MRI acquisition time. On each occasion, we imaged a 30 mM phantom of CA-lys-TFA dissolved in methanol in a short glass NMR tube (5 mm diameter) alongside mice.
Magnetic Resonance Imaging.
All in vivo MRI data were acquired using identical parameters, as described previously3 (i.e., phantom and animal experiments used identical 19F and 1H parameters). Briefly, we performed MRI experiments using a Bruker BioSpec 70/30USR Avance III 7T horizontal bore MR scanner (Bruker Biospin MRI GmbH, Ettlingen, Germany) with a BGA12S gradient system and used Bruker ParaVision 5.1 software for acquisition and processing. The coil was a Bruker 40 mm 19F/1H dual-tuned linear volume coil that transmitted and received radio frequency signals at 300.28 MHz for 1H and 282.55 MHz for 19F nuclei. Multislice 1H MR images used an acquisition time of 6 min and 10 s using a RARE (rapid acquisition with relaxation enhancement) sequence in the cross view of the phantom or animal body. 1H MRI employed a repetition time of 1850 ms, a RARE factor of 8, a field of view of 4 × 4 cm2, an echo time of 8.58 ms, a slice thickness of 1.0 mm, a matrix size of 200 × 200, a number of averages of 8, and an in-plane resolution of 200 × 200 μm2 with 20 slices. 19F images were acquired with a FLASH (fast low angle shot) sequence in an identical region to 1H MRI. The 19F acquisition time was 1 h and 30 min. The parameters were the same as those of 1H MRI but with a repetition time of 220 ms, an echo time of 3.078 ms, an in-plane resolution of 1.25 × 1.25 mm2, a matrix size of 32 × 32, a slice thickness of 4.0 mm, a number of averages of768, and a flip angle = 30°. We optimized the flip angle using the T1 relaxation time of the phantom. The phantom was a 5 mm diameter shortened glass NMR tube containing 30 mM CA-lys-TFA dissolved in methanol.
We calculated CA-lys-TFA concentrations in the mouse gallbladder by comparing the mean signal intensity in the region of interest (ROI) identified in the gallbladder to the mean signal intensity in the phantom ROI imaged next to the mouse body. In each case, we drew the ROI to exclude the edges of the phantom and gallbladder so that the signal intensity calculation did not suffer from a partial volume edge effect due to the image resolution. The mean signal intensity was calculated with Bruker ParaVision 5.1. The limit of quantification of 19F signal for this method was previously determined to be 6.82 mM, which corresponds to the noise magnitude of an ROI on the image periphery plus 2.5 times its standard deviation.3 Using this method, there is greater than 99% confidence that voxels with concentrations above this limit represent real 19F signal and not noise.11
We used Medical Image Processing, Analysis and Visualization software (MIPAV v7.0.1; CIT, NIH, Bethesda, Maryland) to generate a color 19F MR image of the mice and adjacent phantom. The image threshold used was 0.7 on a scale where the strongest signal (in red) was 1.0.
LC-MS/MS Analysis.
We determined concentrations of CA-sar-TFMA, CA-lys-TFA, and cholic acid by LC/MS/MS using a Waters Acquity UPLC system with a triple quadrupole detector (Waters Corporation, Milford, Massachusetts, USA). We used a Waters Acquity UPLC ethylene bridged hybrid C8 1.7 μm, 2.1 × 50 mm column with a flow rate of 0.4 mL/min. The gradient was as follows (expressed as % ACN in water, all mobile phases include 0.1% formic acid): 50% from 0 to 0.5 min, then increased to 95% until 3 min, then decreased to 50% at 3.01 min and held at 50% until 4 min. The injection volume was 10 μL. For CA-lys-TFA, the cone voltage was 65 V, the dwell time was 0.100 s, and the collision energy was 43 V. We used negative electrospray ionization with a multiple reaction monitoring method for the transition of 631.15 to 240.92 Da. The method was linear over a range of 5 to 2000 nM (r2 ≥ 0.97). For CA-sar-TFMA, the cone voltage was 65 V, the dwell time was 0.100 s, and the collision energy was 36 V. We used negative electrospray ionization with a multiple reaction monitoring method for the transition of 603.53 to 213.12 Da. The method was linear over a range of 5 to 2000 nM (r2 ≥ 0.99). For cholic acid, the cone voltage was 66 V, the dwell time was 0.025 s, and the collision energy was 5 V. We used negative electrospray ionization with a single-reaction monitoring method at 407.50 Da. The method was linear over a range of 0.5 to 10 000 μM (r2 ≥ 0.96).
Statistical Analysis.
Error shown in the text and figures is standard error of the mean. We used Student’s paired t-test to evaluate stability data. We used Student’s unpaired t-test to evaluate concentration differences of CA-sar-TFMA and CA-lys-TFA in FGF15-deficient versus WT mouse. We considered a p-value ≤0.05 significant.
RESULTS
Oral Disposition Characterization.
We calculated the concentrations of CA-lys-TFA and CA-sar-TFMA in the gallbladder and liver by assuming an organ density of 1 g/mL. Gallbladder concentrations of 19F at 10 h were above the 19F MRI limit of detection, as previously defined, and liver and plasma concentrations were below the limit of detection.3 The gavage concentrations of 75 mg/kg CA-sar-TFMA and mg/kg CA-lys-TFA showed high accumulation in the WT mouse gallbladder at 10 h after oral dosing with a >20-fold difference compared to the gallbladder of the FGF15-deficient mouse (Figure 3). In contrast, CA-sar-TFMA and CA-lys-TFA concentrations in the liver and plasma were at least 1000-fold lower on average than in the gallbladder; note the μM scales for liver and plasma vs mM scale for gallbladder. The dose- response curves showed a linear relationship for both CA-lys- TFA and CA-sar-TFMA (Figure 4).
Figure 3.

Concentration versus time for CA-lys-TFA (circles) and CA-sar-TFMA (squares) in the gallbladder (A), liver (B), and plasma (C) harvested from WT (closed symbols) and FGF15-deficient (open symbols) mice after concomitant oral administration of 75 mg/kg CA-sar-TFMA and 78.5 mg/kg CA-lys-TFA. 19F-labeled bile acid analogues were simultaneously coadministered to the same animal. Gavage with the two 19F-labeled bile acid analogues resulted in much higher concentrations in the gallbladder than the liver or plasma. In gallbladder and liver, bile acid analogue exposure was greater in WT mice than FGF15-deficient mice. Each data point reflects n =1 mouse from destructive sampling.
Figure 4.

Dose-response curve in the gallbladder of WT (closed) and FGF15-deficient (open symbols) mice after concomitant oral administration of CA-lys-TFA (circles) and CA-sar-TFMA (squares). Larger doses resulted in higher gallbladder concentrations of 19F-labeled bile acid analogues. Each data point reflects n = 3 mice.
Given the results from the pilot study, 8.5 h was included as an additional time point to better elucidate the peak concentration. Peak concentration occurred in gallbladders of mice at 8.5 h for both compounds at the higher gavage concentration of 75 mg/kg CA-sar-TFMA and 78.5 mg/kg CA-lys-TFA when tested in triplicate (Figure 5A,B). Differences at the 8.5 h time point were statistically significant and showed a >2-fold difference when comparing WT to Fgf15−/− mice (p = 0.04 and p = 0.03, CA-sar-TFMA and CA-lys-TFA, respectively). Gallbladder concentrations in WT mice at 8.5 h were above the 19F MRI limit of detection, whereas all concentrations in the small intestines, cecum, and colon were below the limit of detection (Figure 5C–G). Concentrations of CA-sar-TFMA and CA-lys-TFA between WT and Fgf15−/− mice in the small intestines, cecum, and colon were not statistically different.
Figure 5.

Concentration versus time of CA-lys-TFA (circles) and CA-sar-TFMA (squares) in the gallbladder (A,B), small intestine (C–E), cecum (F), and colon (G) ofWT (closed symbols) and FGF15-deficient (open symbols) mice after concomitant oral administration of 75 mg/kg CA-sar-TFMA and 78.5 mg/kg CA-lys-TFA. All panels use the same symbols. The only statistical difference in 19F-labeled bile acid analogue concentration between FGF15-deficient and WT mice was in the gallbladder at 8.5 h (A, p = 0.04 and B, p = 0.03). Each data point reflects n = 3 mice.
In Vitro Stability of CA-sar-TFMA and CA-lys-TFA in Mouse Stool.
Incubation of CA-sar-TFMA and CA-lys-TFA in stool showed no significant degradation at the longest time tested (p > 0.05, Figure 6).
Figure 6.

Percent remaining versus time of CA-lys-TFA (circles) and CA-sar-TFMA (squares) in stool samples of WT (closed symbols) and FGF15-deficient (open symbols) mice performed in triplicate. Each 19F-labeled bile acid analogue exhibited favorable stability over 24 h in stool. There was about a 15% loss of each 19F-labeled bile acid analogue over 24 h.
In Vitro Stability of CA-sar-TFMA and CA-lys-TFA in Gallbladder Homogenate.
Incubation of CA-sar-TFMA and CA-lys-TFA in gallbladder homogenates showed statistically significant degradation at the longest duration tested (p < 0.01). Cholic acid also showed statistically significant degradation (p < 0.01). However, degradation of CA-sar-TFMA and CA- lys-TFA was slightly more than that of cholic acid, which exhibited about a 12% loss at the longest duration tested (Figure 7).
Figure 7.

Percent remaining versus time of CA-lys-TFA (circles), CA-sar-TFMA (squares), and cholic acid (triangles) in pooled gallbladder homogenate prepared in triplicate from four WT mice. The two 19F-labeled bile acid analogues exhibited favorable stability over 24 h in WT gallbladder homogenate. There was about a 25% decrease in each bile acid analogue over 24 h. For reference, there was a 12% loss of cholic acid over 24 h.
Murine Gallbladder Imaging.
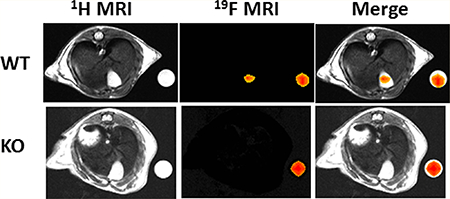
Based on LC–MS/MS results of the peak accumulation occurring at 8.5 h, mice underwent MRI at 8.5 h after oral gavage of 150 mg/kg CA-lys- TFA—we imaged mice once followed by euthanasia. We visualized strong 19F MRI signals emanating from the gallbladders of all WT mice tested (Figure 8A). Overlay of images obtained by 1H and 19F MRI signal acquisition confirmed that 19F signals emanated from the gallbladder (Figure 8A). CA-lys-TFA concentration in the gallbladder, calculated by normalizing the average intensity of the gallbladder ROI to that within the ROI to that within the phantom, was determined to be 27 mM.
Figure 8.

19F MRI in WT and FGF15-deficient mice gavaged with 150 mg/kg CA-lys-TFA. We detected a 19F signal only in gallbladders from WT mice. Arrowheads (blue) and arrows (yellow) indicate 19F signals emanating from phantoms and gallbladder, respectively. This imaging result, representative of findings in three separate WT and FGF15-deficient mice, is consistent with the LC/MS/MS-based observations.
As predicted from our LC–MS/MS data, MRI of three consecutive Fgf15−/− mice revealed no detectable signal (Figure 8B); as a control, we observed a robust 19FMRI signal emanating from phantoms placed next to these mice.
DISCUSSION
Performance of Bile Acid Analogues.
To address the unmet need for a safe and accurate method of diagnosing bile acid diarrhea due to FGF19 deficiency in countries like the United States where clinicians do not have access to SeHCAT testing, we evaluated a novel noninvasive approach using in vivo 19F MRI. We tested the ability of gavage with a 19F bile acid analogue, CA-lys-TFA, to detect abnormal bile acid transport in FGF15-deficient mice, an animal model of human FGF19 deficiency. We, and others, have shown that, like humans with FGF19 deficiency, FGF15-deficient mice have increased fecal bile acid excretion.12–15 We detected low quantities of intact CA-lys-TFA and CA-sar-TFMA in the stool, with more in stool from FGF15-deficient mice than from wild-type mice (Supporting Information: Figure S9).
In the present communication, our LC–MS/MS data show that, in both WT and Fgf15−/− mice, each 19F bile acid analogue accumulated in the gallbladder and, at much lower concentrations, in the liver, plasma, small intestine, and colon (Figures 3 and 5). Notably, across three doses, we observed that FGF15 deficiency reduced the concentrations of 19F-labeled bile acid analogues in gallbladder bile (Figure 4). In WT mice, average gallbladder bile CA-lys-TFA and CA-sar-TFMA concentrations exceeded our 19F MRI limit of detection (i.e., above 2.27 mM, as there are three equivalent fluorine atoms in each structure).3In contrast, the concentrations of these molecules measured by LC–MS/MS in tissues from FGF15-deficient mice were generally below the 19F MRI limit of detection (Figures 3–5). The lack of 19F MRI signals from gallbladders of FGF15- deficient mice 8.5 h after gavage with 150 mg/kg CA-lys-TFA substantiated this finding; gallbladders of comparably treated WT mice provided strong imaging signals (see representative examples in Figure 8).
Interestingly, CA-lys-TFA and CA-sar-TFMA provided similar in vivo pharmacokinetic distribution profiles, although prior in vitro studies suggested greater stability against cholylglycine hydrolase for CA-sar-TFMA compared to CA-lys-TFA.2,4 To address the similar in vivo stabilities of CA-lys-TFA and CA-sar-TFMA observed here, we assessed the stability of these molecules in murine stool and gallbladder homogenates. Our finding of similar stability of CA-lys-TFA and CA-sar-TFMA in stool (Figure 6) and gallbladder homogenates (Figure 7) is consistent with the compounds’ similar in vivo stability. In mice, cholylglycine hydrolase does not appear to be a large determinant of CA-sar-TFMA or CA-lys-TFA stability in vivo. Overall, neither CA-sar-TFMA nor CA-lys-TFA is preferred over the other. These observations highlight the importance of confirming in vitro observations using in vivo models.
Potential Use of Fluorinated Bile Acid Analogues.
Previously, we synthesized CA-lys-TFA and CA-sar-TFMA and evaluated the in vitro stability and affinity of these molecules for ASBT and Na+/taurocholate cotransporting polypeptide (NTCP, SLC10A1 ).2,4 In addition, to assess their ability to concentrate in the gallbladder, the 19F bile acid analogues’ 19F MRI signals were measured in the gallbladders of WT and ASBT-deficient mice in vivo.2–4 In the present study, we evaluated CA-lys-TFA and CA-sar-TFMA in FGF15-deficient mice.
In humans, reduced levels of FGF19 impair bile acid homeostasis within the enterohepatic circulation. Specifically, the liver continues to synthesize bile acids despite the presence of abundant bile acids in the terminal ileum. The loss of feedback repression of bile acid synthesis by FGF19 results in excess spillage of bile acids into the colon, which simulates electrolyte and water secretion, inflammation, and motility, thus leading to diarrhea. Bile acid uptake from the distal small intestine by ASBT is unimpaired, but the excess bile acids in the ileum overwhelm ASBT transport capacity, causing diarrhea.16 Approximately one of three individuals diagnosed with IBS-D may actually have bile acid diarrhea.5 Distinguishing these conditions is important; incorrectly attributing bile acid diarrhea to IBS may result in prolonged treatment with costly, ineffective drugs that may have substantial side effects. The resulting therapeutic failure may have a negative impact on the quality of life.
Conceptually, the clinical use of 19F bile acid analogue MRI to diagnose bile acid diarrhea is attractive; the test would not require phlebotomy or exposure to ionizing radiation. Nonetheless, there are limitations to our work and to the translational potential of this test. We employed FGF15-deficient mice, which excrete excess bile acids, but do not exhibit diarrhea.12,15 Thus, although these mice mimic the physiology of FGF19 deficiency, the clinical phenotype is different; this difference may reflect differences between murine and human colon physiology, diet, and other factors. Additionally, we needed high doses to detect analogues in mouse gallbladder via MRI, employing a 1.5 h acquisition time. The necessary dose and acquisition time for use in humans would require clinical testing. Since 19F bile acid analogue MRI requires the presence of a functional gallbladder, this test would not work in experimental animals lacking a gallbladder (e.g., rats) or in humans after cholecystectomy. Finally, a major obstacle to such a diagnostic approach is the current paucity of clinical MRI facilities equipped with the appropriate hardware (coil) and software needed to detect fluorine signals.
Overall, our findings support the concept that increased fecal bile acids in FGF15/19 deficiency result from a reduction in the fraction of intestinal bile acids transported by ASBT. Moreover, 19F bile acid MRI shows potential as a novel test for diagnosing bile acid diarrhea resulting from FGF19 deficiency. Nonetheless, we must address and overcome several limitations and obstacles before 19F bile acid MRI can transition to clinical practice.
Supplementary Material
ACKNOWLEDGMENTS
We thank Dr. Grace Guo, Ernest Mario School of Pharmacy, Rutgers University, for providing FGF15-deficient and WT control mice. We also thank Drs. Alan F. Hofmann, Paul A. Dawson, and Michael Camilleri for their helpful discussions and guidance. This work was supported by the Food and Drug Administration [U01FD005946], National Institutes of Health, National Institute of Diabetes and Digestive and Kidney Diseases [Grants R21 DK093406 and T32 DK067872], and a Merit Review Award [Grant BX002129] from the United States Department of Veterans Affairs Biomedical Laboratory Research and Development Program. The contents do not represent the views of the U.S. Department of Veterans Affairs or the United States Government.
ABBREVIATIONS USED
- ASBT
apical sodium-dependent bile acid transporter
- C4
7α- hydroxy-4-cholestene-3-one
- CA
cholic acid
- DPBS
Dulbecco’s phosphate-buffered saline
- EtOAc
ethyl acetate
- FGF/Fgf
fibroblast growth factor
- FLASH
fast low angle shot
- IBS-D
diarrhea-predominant irritable bowel syndrome
- IP
intraperitonea
- LC–MS/MS
liquid chromatography/tandem mass spectrometry
- MRI
magnetic resonance imaging
- NTCP
Na +/taurocholate cotransporting polypeptide
- PEG
polyethylene glycol
- RARE
rapid acquisition with relaxation enhancement
- rf
radio frequency
- ROI
region of interest
- SeHCAT
75selenium homotaurocholic acid retention test
- TFAA
trifluoroacetic anhydride
- WT
wild-type
Footnotes
The authors declare no competing financial interest.
ASSOCIATED CONTENT
Supporting Information
The Supporting Information is available free of charge on the ACS Publications website at DOI: 10.1021/acs.molpharma-ceut.8b00454.
Synthesis of CA-lys-TFA and CA-sar-TFMA, 1H NMR of compound 4, 19F NMR of compound 4, HRMS of compound 4, 1H NMR of compound 6, 1H NMR of compound 8, 1H NMR of compound 10, 19F NMR of compound 10, HRMS of compound 10, and mass of CA-lys-TFA and CA-sar-TFMA in stool samples per 24 h stool collection (PDF)
REFERENCES
- (1).Dawson PA Bile Formation and the Enterohepatic Circulation In Physiology of the Gastrointestinal Tract, 5th ed.; Johnson LR, Ed.; Academic Press: Oxford, UK, 2012; Vol. 2, pp 1461–1484. [Google Scholar]
- (2).Vivian D; Cheng K; Khurana S; Xu S; Kriel EH; Dawson PA; Raufman JP; Polli JE In vivo performance of a novel fluorinated magnetic resonance imaging agent for functional analysis of bile acid transport. Mol. Pharmaceutics 2014, 11, 1575–82. [DOI] [PMC free article] [PubMed] [Google Scholar]
- (3).Vivian D; Cheng K; Khurana S; Xu S; Dawson PA; Raufman JP; Polli JE Design and evaluation of a novel trifluorinated imaging agent for assessment of bile acid transport using fluorine magnetic resonance imaging. J. Pharm. Sci 2014, 103, 3782–92. [DOI] [PMC free article] [PubMed] [Google Scholar]
- (4).Vivian D; Cheng K; Khurana S; Xu S; Whiterock V; Witter D; Lentz KA; Santone KS; Raufman JP; Polli JE Design and characterization of a novel fluorinated magnetic resonance imaging agent for functional analysis ofbile Acid transporter activity. Pharm. Res 2013, 30, 1240–51. [DOI] [PMC free article] [PubMed] [Google Scholar]
- (5).Pattni S; Walters JRF Recent advances in the understanding of bile acid malabsorption. Br. Med. Bull 2009, 92, 79–93. [DOI] [PubMed] [Google Scholar]
- (6).Wedlake L; Andreyev J Bile Acid Malabsorption In Textbook of Clinical Gastroenterology and Hepatology, 2nd ed.; Hawkey CJ, Bosch J, Richter JE, Garcia-Tsao G, Chan FKL, Eds.; Wiley-Blackwell, Oxford, UK; 2012. [Google Scholar]
- (7).Pattni SS; Brydon WG; Dew T; Walters JRF Fibroblast Growth Factor 19 and 7a-Hydroxy-4-Cholesten-3-one in the Diagnosis of Patients With Possible Bile Acid Diarrhea. Clin. Transl. Gastroenterol 2012, 3, e18. [DOI] [PMC free article] [PubMed] [Google Scholar]
- (8).Westergaard H Bile Acid malabsorption. Current treatment options in gastroenterology 2007, 10, 28–33. [DOI] [PubMed] [Google Scholar]
- (9).Felton J; Cheng K; Said A; Shang AC; Xu S; Vivian D; Metry M; Polli JE; Raufman J-P Using Multi-fluorinated Bile Acids and In Vivo Magnetic Resonance Imaging to Measure Bile Acid Transport. J. Visualized Exp 2016, e54597. [DOI] [PMC free article] [PubMed] [Google Scholar]
- (10).Kong B; Huang J; Zhu Y; Li G; Williams J; Shen S; Aleksunes LM; Richardson JR; Apte U; Rudnick DA; Guo GL Fibroblast growth factor 15 deficiency impairs liver regeneration in mice. American journal of physiology Gastrointestinal and liver physiology 2014, 306, G893–902. [DOI] [PMC free article] [PubMed] [Google Scholar]
- (11).Srinivas M; Morel PA; Ernst LA; Laidlaw DH; Ahrens ET Fluorine-19 MRI for visualization and quantification of cell migration in a diabetes model. Magn. Reson. Med 2007, 58, 725–34. [DOI] [PubMed] [Google Scholar]
- (12).Inagaki T; Choi M; Moschetta A; Peng L; Cummins CL; McDonald JG; Luo G; Jones SA; Goodwin B; Richardson JA; Gerard RD; Repa JJ; Mangelsdorf DJ; Kliewer SA Fibroblast growth factor 15 functions as an enterohepatic signal to regulate bile acid homeostasis. Cell Metab. 2005, 2, 217–25. [DOI] [PubMed] [Google Scholar]
- (13).Walters JR; Tasleem AM; Omer OS; Brydon WG; Dew T; le Roux CW A new mechanism for bile acid diarrhea: defective feedback inhibition of bile acid biosynthesis. Clin. Gastroenterol. Hepatol 2009, 7, 1189–94. [DOI] [PubMed] [Google Scholar]
- (14).Hofmann AF; Mangelsdorf DJ; Kliewer SA Chronic diarrhea due to excessive bile acid synthesis and not defective ileal transport: a new syndrome of defective fibroblast growth factor 19 release. Clin. Gastroenterol. Hepatol 2009, 7, 1151–4. [DOI] [PMC free article] [PubMed] [Google Scholar]
- (15).Cheng K; Metry M; Felton J; Shang AC; Drachenberg CB; Xu S; Zhan M; Schumacher J; Guo GL; Polli JE; Raufman JP Diminished gallbladder filling, increased fecal bile acids, and promotion of colon epithelial cell proliferation and neoplasia in fibroblast growth factor 15-deficient mice. Oncotarget 2018, 9, 25572–25585. [DOI] [PMC free article] [PubMed] [Google Scholar]
- (16).Camilleri M Bile Acid Diarrhea: Prevalence, Pathogenesis, and Therapy. Gut Liver 2015, 9, 332–339. [DOI] [PMC free article] [PubMed] [Google Scholar]
Associated Data
This section collects any data citations, data availability statements, or supplementary materials included in this article.