Abstract
In obesity and diabetes, intramuscular fat (IMF) content correlates markedly with insulin sensitivity, which makes IMF manipulation an area of therapeutic interest. Melatonin, an important circadian rhythm-regulating hormone, reportedly regulates fat deposition, but its effects on different types of adipose vary. Little is known about the role of melatonin in IMF deposition. Here, using intramuscular preadipocytes in pigs, we investigated to determine whether melatonin affects or regulates IMF deposition. We found that melatonin greatly inhibited porcine intramuscular preadipocyte proliferation. Although melatonin administration significantly upregulated the expression of adipogenic genes, smaller lipid droplets were formed in intramuscular adipocytes. Additional investigation demonstrated that melatonin promoted lipolysis of IMF by activating protein kinase A and the signaling of ERK1/2. Moreover, melatonin increased thermogenesis in intramuscular adipocytes by enhancing mitochondrial biogenesis and mitochondrial respiration. A mouse model, in which untreated controls were compared with mice that received 3 weeks of melatonin treatment, verified the effect of melatonin on IMF deposition. In conclusion, melatonin reduces IMF deposition by upregulating lipolysis and mitochondrial bioactivities. These data establish a link between melatonin signaling and lipid metabolism in mammalian models and suggest the potential for melatonin administration to treat or prevent obesity and related diseases.
Keywords: cell proliferation, mitochondrial biogenesis, protein kinase A, extracellular signal-regulated kinase 1
Intramuscular fat (IMF) refers to adipose tissue located between skeletal muscle fibers (1). IMF is an important economic trait in farm animals (2), reducing IMF levels to increase the lean meat percentage of pork or increasing the IMF content to improve the meat flavor is the most important part of the breeding work (3, 4). However, in humans, IMF content has a significant correlation with insulin resistance and type 2 diabetes (5). The reduction of IMF significantly improves the insulin sensitivity of muscle tissue (6). Therefore, finding a mechanism to regulate the proliferation and differentiation of IMF cells has important economic and medical value.
Melatonin, a derivative of tryptophan, is synthesized and secreted by the pineal gland in mammals (7) and mainly mediates circadian rhythms and reproductive cycles (8, 9). Recent researchers found that melatonin significantly regulated fat metabolism (10). In vitro experiments show that melatonin significantly promotes the adipogenic differentiation of 3T3-L1 precursor adipocytes by increasing the expression of both CCAAT/enhancer binding protein (C/EBP)α and PPARγ (11). Alonso-Vale et al. (12) reported that melatonin inhibited adipocyte differentiation through regulated C/EBPβ transcriptional activity. This inconsistency in findings may be due to the differences in the timing of melatonin treatment of 3T3-L1 cells.
Other studies reported that melatonin reduces fat content by promoting lipid metabolism in porcine oocytes (13). Although recent findings indicate that melatonin promotes the differentiation of bovine intramuscular preadipocytes into adipocytes by increasing the expression levels of PPARγ, C/EBPβ, and C/EBPα via melatonin receptor 1B (MT2) (14), laboratory experiments demonstrate that chronic supplementation with melatonin leads to the suppression of body weight gain and a reduction of adiposity in laboratory animals by modifying gut microbiota in mice (15). However, in postpubertal heifers, melatonin promotes fat deposition in the rib and longissimus muscle (16). In vitro and in vivo findings indicate that melatonin plays an important regulatory role in the deposition of fat, yet the effect of melatonin on adipose tissue varies by report, and the study of melatonin on IMF is limited.
We describe a potential signaling pathway for melatonin-affected IMF deposition at the cellular level. Melatonin has a dual role in the deposition of IMF, promoting both fat differentiation and lipolysis. Long-term melatonin treatment significantly increases the catabolism of IMF cells and reduces IMF deposition.
MATERIALS AND METHODS
Ethics statement
All experiments were performed in accordance with the guidelines of the regional Animal Ethics Committee and were approved by the Institutional Animal Care and Use Committee of Nanjing Agricultural University.
Porcine intramuscular preadipocyte isolation and in vitro differentiation
Three male Erhualian pigs (age, 5 days) were euthanized for porcine intramuscular preadipocyte isolation and culture (17). Briefly, longissimus dorsi muscles were harvested from piglets, minced, and digested with 2 mg/ml collagenase type I (Sigma-Aldrich) in DMEM/F12 (HyClone, Thermo Fisher Scientific) containing 1% fatty acid-free BSA (Sigma-Aldrich) in a shaking water bath at 40 rpm speeds for 2 h at 37°C. The digest samples were collected with a cell strainer (70 and 200 μm diameter) and rinsed three times with serum-free DMEM/F12 medium, then spun twice in a centrifuge at 1,500 g for 10 min. Finally, cells were transferred to plates, grown in growth medium (GM) [DMEM/F12 (HyClone) supplemented with 10% FBS (Sigma-Aldrich) and 1% penicillin-streptomycin] at 37°C with 5% CO2. After 2 h, the nonadherent cells were washed and replaced with fresh medium to continue culturing.
After reaching 90% confluence, the intramuscular preadipocytes were induced to differentiate with the adipogenic agent, DMI (0.25 mM dexamethasone, 1 mM 3-isobutyl-1-methylxanthine, and 5 μg/ml insulin), for 4 days. The medium was replaced with maintenance medium containing 5 μg/ml insulin and 10% FBS-DMEM until day 8, and fresh medium was changed every 2 days.
Cell proliferation assay
Preadipocytes were seeded into a 96-well plate and cultured with 10% FBS-DMEM medium. Twenty-four hours later, the medium was replaced with 10% serum medium containing melatonin (Sigma-Alrich) at 0, 0.01, 0.1, 0.5, 1, and 2 mM doses for 12, 24, 36, or 48 h. After exposure of the cells to melatonin, culture medium was changed for serum-free culture medium; we added 10 μl of Cell Counting Kit-8 reagent dissolved in GM, and then continued culturing at 37°C for 2 h. The absorbance of each well was measured at 450 nm wavelength using an automated microplate reader (Bio-Rad, Japan).
EdU stain
Preadipocytes were treated with or without 1 mM of melatonin for 24 h, and cells were cultured with fresh GM containing 5-ethynyl-2′-deoxyuridine (EdU) (final concentration, 10 mM) for 2h. EdU staining was conducted using Cell-Light™ EdU Apollo®488 in vitro imaging kit (RiboBio, Guangzhou, China) according to the manufacturer’s protocol. The EdU-labeled cells were reviewed with a confocal microscope.
Apoptosis analysis
Preadipocytes were treated with or without 1 mM of melatonin for 24 h. Cells were digested using 0.25% trypsin without EDTA, washed twice with PBS, fixed in 500 μl of binding buffer [100 mM HEPES, 140 mM NaCl, 25 mM CaCl2 (pH = 7.4)], and stained with 100 μg/ml annexin V-FITC/100 μg/ml propidium iodide (PI) at room temperature for 15 min. The apoptosis percentage of porcine intramuscular preadipocytes was measured using an apoptosis detection kit (Vazyme Biotech, Nanjing, China) according to the manufacturer’s protocol. We sorted 1 × 10⁵ cells by flow cytometry [fluorescence-activated cell sorting (FACS); Becton-Dickinson]. The apoptosis rate was calculated using the following equation: (number of cells in the right upper quadrant + number of cells in the right lower quadrant)/total number of cells.
Cycle analysis
After treatment with or without 1 mM of melatonin for 24 h, the cells were harvested by trypsinization, washed twice with ice-cold PBS, and fixed in 75% ethanol for 24 h at 4°C. We added 100 μl of RNase A and incubated the cells for 30 min at 37°C, and then added 400 μl of PI staining mix and stored them away from light for 30 min at 4°C. The wavelength of red fluorescence used for excitation on the machine test was 488 nm. For each sample, 10,000 events were acquired with a FACS, and the percentage of cells in G0/G1, S, and G2/M phases of the cell cycle were determined by FlowJo analytical software version 9.3.2 (BD FACS Calibur).
Oil Red O staining
To induce porcine intramuscular preadipocyte differentiation into mature lipid droplets in DMI with or without melatonin, cells were washed three times with PBS, and then fixed with 10% formalin for 15 min. After fixation, the cells were washed three times with PBS and stained with Oil Red O (0.5% Oil Red O in isopropanol, diluted 3:2 in water, and filtered with a 0.2 μm filter; Sigma-Aldrich). After 20 min, the cells were washed with 60% isopropanol for 20 s and photographed using a microscope. To measure triglyceride contents, stained adipocytes were eluted with isopropanol for 20 min. The optical density values were detected with a spectrophotometer at a wavelength of 510 nm, as described previously (18).
LipiD-QuanT analysis
Mature adipocytes were treated with maintenance medium containing 1 mM of melatonin or not treated. Lipid droplet images were taken 2 days later. A total of 803 lipid droplets were used to assess lipid droplet size by the LipiD-QuanT method (19).
Lipolysis analysis
Intramuscular preadipocytes were induced to differentiate at 6 days with or without melatonin. Samples were collected on days 0, 2, 4, and 6 to extract total RNA. The expression of lipolysis-related genes was analyzed by quantitative RT-PCR (RT-qPCR). To further demonstrate the occurrence of lipolysis in the melatonin treatment process, intramuscular preadipocytes were induced to differentiate into mature adipocytes, and then incubated for 48 h in fresh GM with or without 1 mM of melatonin. At the end of the incubation, supernatants were collected and analyzed for free glycerol according to the protocol for the adipolysis assay kit (Abcam, Shanghai). Total protein samples were also collected and analyzed by Western blot analysis for the expression of lipolytic proteins.
Bioenergetics profiling
Porcine intramuscular preadipocytes (approximately 2.5 × 10⁵ cells/well) were seeded into gelatin-coated XF24 culture microplates and grown in GM for 12 h at 37°C in an atmosphere of 5% CO2. The cells were treated with DMI, DMI + melatonin (1 mM), and DMI + melatonin (1 mM) + 4-phenyl-2-propionamidotetralin (4-P-PDOT; 10 μM) for an additional 24 h. The O2 consumption was measured with a Seahorse Bioscience XF24-3 extracellular flux analyzer. We added 1 μM of oligomycin to the cells to measure the oxygen consumption rate (OCR) independent of oxidative phosphorylation. Subsequently, 0.5 μM of carbonyl cyanide-p-trifluoromethoxy-phenylhydrazone and 2 μM of the respiratory chain inhibitor, rotenone, were added to measure the maximal respiration and basal non-mitochondrial respiration rates. Statistical comparisons were made using Student’s t-test.
Intracellular ATP assay
The intracellular ATP concentration was measured using an ATP assay kit (Beyotime Biotechnology, Jiangsu, China) following the manufacturer’s protocol. Briefly, the cells were cultured in DMI, as well as DMI + melatonin (1 mM), or DMI + melatonin (1 mM) + 4-P-PDOT (10 μM). After 24 h, the treated cells were lysed in the lysis buffer and spun in a centrifuge at 4°C, 14,400 g for 5 min. The supernatants were used to detect ATP, and the protein concentrations were determined by BCA assay kit (Beyotime Biotechnology). We then added 20 μl of supernatant into 100 μl of ATP detection solution that had been incubated at room temperature for 5 min, mixed it immediately, and determined the luminescence using the Dual-Luciferase Reporter assay system (Promega, Madison, WI). The concentration of ATP was calculated according to a standard curve and converted into nanomoles per microgram of protein.
Mitochondrial content
After 24 h of intramuscular preadipocyte treatment with or without 1 mM of melatonin, samples were collected, and the total DNA was extracted from cells using a DNA extraction kit (Jiancheng Bioengineering Institute, Nanjing, China). To quantify mitochondrial cytochrome c oxidase subunit 2 (Cox2) and the nuclear gene, β-globin, copy number, a reference curve was established using serially diluted standard DNA through RT-qPCR. The copy number ratio of mtDNA:nDNA was used to evaluate the relative number of mitochondria as previously described (20). The primers of mtDNA and nDNA are shown in Table 1.
TABLE 1.
Primers used in this study
| Gene | Primer Sequences | Product Size (bp) | Temperature (°C) |
| C/EBPα | 5′ ACACGGTGCGTCTAAGATGAG | 238 | 59.1 |
| 5′ TCGGAGCGGTGAGTTTGC | |||
| FABP4 | 5′ GGTGTCACGGCTACCAGAA | 203 | 60.3 |
| 5′ AAATCATTACATCGCCTTAT | |||
| FASN | 5′ GCCAGCATCGTGAGGGTC | 196 | 58.6 |
| 5′ CCAGTGCAGGTACGGGAAT | |||
| PPARγ | 5′ GCCATTCGCATCTTTCAGGG | 213 | 59.3 |
| 5′ CGTGGACGCCATACTTTAGGA | |||
| HSL | 5′ TGTCTTTGCGGGTATTCGG | 241 | 59.1 |
| 5′ GCCTGTTTCATTGCGTTTGTA | |||
| ATGL | 5′ TGGATAAAGGAGCAGACAGG | 216 | 60 |
| 5′ TCGGACGGGAAGGCAGT | |||
| PLIN1 | 5′ TGAAATGCCACGACAA | 187 | 60.5 |
| 5′ CTACGGCTAAACTTACTACAC | |||
| UCP3 | 5′ TCGGAAATAGGAGGAGGAAA | 270 | 58.8 |
| 5′ TCGGCTGATTTCCAAGTGT | |||
| Tfam | 5′ CCTAGGAAGCGACTACTGCG | 126 | 59.7 |
| 5′ GCAACTCTTCAGACCTCGCT | |||
| CPT-1β | 5′ TGGGGCTGGTCAATCACATC | 188 | 59.1 |
| 5′ GCCGTGCATCTCAAACATCC | |||
| CPT-1α | 5′ GTCCTGCAACTTTGTGCTGG | 97 | 60 |
| 5′ CAGGTGCTGGTGCTTTTCAC | |||
| Pgc1a | 5′ GGACTGACATCGAGTGTGCT | 246 | 60.3 |
| 5′ GCGTCTCTGTGAGAACTGCT | |||
| Cidea | 5′ GGCTCACAAGTGGATAGGGG | 250 | 60.1 |
| 5′ AGATGAAGAGGAAGCATGGAAGT | |||
| Prdm16 | 5′ CCACAAGTCCTACACGCAGT | 160 | 60.3 |
| 5′ CGGGTAATGGTTCTTGCCCT | |||
| Cox2 | 5′ CATACTAACAACAAAACTGACA | 346 | 59.3 |
| 5′ TGTCAGTTTTGTTGTTAGTATG | |||
| β-globin | 5′ CAACCTCAAGGGCACCTTTGCTA | 150 | 60 |
| 5′ GGCCCTCTCTTCATGACACG | |||
| RPLP0 | 5′ GTGCTGATGGGCAAGAAC | 225 | 59.6 |
| 5′ CTCCAGGAAGCGAGAATG |
RT-qPCR
After porcine intramuscular preadipocytes were treated with 1 mM of melatonin for 24 h, total RNA was extracted using a TRIzol reagent (Invitrogen) according to the manufacturer’s instructions. We used a Godenstar™ RT6 cDNA synthesis kit (TsingKe Biotech, Nanjing, China) to reverse transcribe 1.0 μg of each sample to first-strand cDNA. The RT-qPCR was performed using SYBR Green Master Mix (Vazyme Biotech), and relative expression levels were analyzed using the 2-ΔΔCt method. The primers used are listed in Table 1. RPLP0 was used as the endogenous control.
Western blotting
Total protein was extracted from intramuscular preadipocytes using RIPA lysis buffer (Beyotime Biotechnology), and protein quantities were measured by the BCA protein assay kit (Beyotime Biotechnology). We prepared 12% SDS-PAGE gel and loaded 20 μg of protein. After 1 h of electrophoresis, the total protein was transferred to a PVDF membrane (Millipore, Billerica, MA). The membrane was blocked in 5% BSA and then incubated with primary antibodies overnight at 4°C. After washing, the appropriate secondary antibodies were used, and chemiluminescence was detected. Images were captured with the VersaDoc 4000 MP system (Bio-Rad). The antibodies used herein mainly include: melatonin receptor 1A (MT1) (1:1,000; Thermo Fisher, #PA5-19109), MT2 (1:1,000; Affinity, #DF4994), protein kinase A (PKA) (1:800; Affinity, #AF7746), phospho-PKA (Thr197, 1:500; Affinity, #AF7246), ERK1/2 (1:500; Thermo Fisher, #82380); phospho-ERK1/2 (Thr202/Tyr204, 1:500; Thermo Fisher, #PA5-37828), hormone-sensitive lipase (HSL) (1:1,000; Affinity, #AF6403), phospho-HSL (Ser660, 1:500; Affinity, #AF8026), perilipin 1 (PLIN1) (1:1,000; Affinity, #DF7602), phospho-PLIN1 (Ser522, 1:500; Vala Sciences, #4856), α-tubulin (1:1,000; Affinity, #AF7010), and GAPDH (1:1,000; Affinity, #AF7021).
Mouse experiment to verify the effect of melatonin on IMF deposition
We conducted an in vivo experiment to investigate the effect of melatonin on fat deposition using 3-week-old healthy male Institute of Cancer Research mice (n = 8, initial body weight 19 ± 0.5 g; Qing Long Shan Co., Animal Breeding Center, Nanjing, China) randomly divided into two groups. Melatonin (20 mg/kg) was administered via intravenous injection to the tail every other day for 4 weeks. Meanwhile, the minimum volume of alcohol used to dilute melatonin (20 mg/kg) was injected into another group as a control group. All mice had free access to standard high-fat diet and water. All mice were housed in a temperature-controlled (22 ± 2°C) room with a 12:12 h light:dark cycle (lights on from 7:00 AM to 7:00 PM). During the experimental period, body weights were recorded every 3 days. On day 27, all mice were bled, weighed, and euthanized. The fat tissues were peeled off, weighed, photographed, and then quick-frozen for the subsequent experiment.
Histology and imaging
The vastus lateralis (VL) was released from the mouse hind limb to detect neutral lipid accumulation in muscle tissue. Frozen VL samples were sectioned with a cryostat (thickness, 7 μm). All sections were washed with deionized water, quickly dipped in 60% isopropanol, and then stained for 20 min in the Oil Red O working solution. They were then rinsed with isopropanol followed by deionized water and cover-slipped with glycerol jelly. Images were captured using a microscope.
Statistical analysis
Data were analyzed using the IBM SPSS Statistics for Windows, version 20.0 (IBM Corp., Armonk, NY) and GraphPad Prism (GraphPad Software, Inc., La Jolla, CA). The statistical significance was calculated using the Student’s t-test and one-way ANOVA (*P < 0.05, **P < 0.01, ***P < 0.001). All data are presented as mean ± SEM.
RESULTS
Melatonin inhibits the proliferation of porcine intramuscular preadipocytes
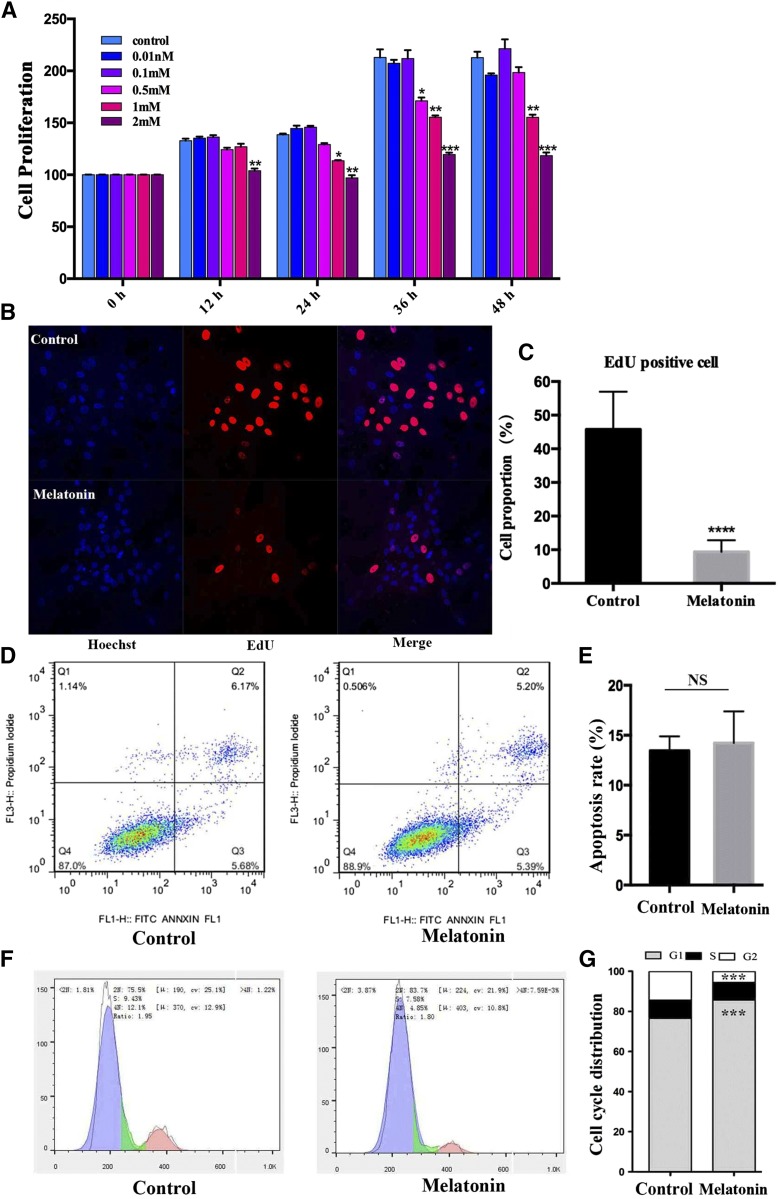
To understand the effect of melatonin on IMF deposition better, different concentrations of melatonin were administered to porcine intramuscular preadipocytes (Fig. 1A). The result shows that melatonin was both dose- and time-dependent on cell proliferation. Melatonin (1 mM) significantly inhibited preadipocyte proliferation from 24 to 48 h (24 h, P < 0.001; 36 h, P < 0.001; 48 h, P < 0.001). Melatonin (2 mM) inhibited cell proliferation and caused death from 12 to 48 h (all P < 0.001).
Fig. 1.
Effect of melatonin on cell proliferation in porcine intramuscular preadipocytes. A: The cells were treated with various melatonin concentrations (0, 0.01, 0.1, 0.5, 1, and 2 mM) at various times 0, 12, 24, 36, or 48 h. After treatment, cell proliferation was estimated by Cell Counting Kit-8 assay. Results are shown as a relative percentage of untreated cells at 0 h (n = 4 per group). B: Detection of intramuscular preadipocyte cellular activity by EdU staining after treatment with or without 1 mM of melatonin for 24 h. The proliferating nuclei were stained red with EdU, while the nuclei of all cells were stained blue with Hoechst for 30 min (scale bar = 100 μm). C: Quantification of the proportion of EdU-positive cells. D: The effect of melatonin on the cell cycles and apoptosis of preadipocytes. Cells were stained with PI and annexin V, and then the apoptosis rate was evaluated by flow cytometry and displayed as column charts after quantification (E). F: Cell cycle analysis. Cells were stained with PI, and then detected by flow cytometry and displayed as column charts after quantification (G). Data are represented as the mean ± SEM (*P < 0.05; **P < 0.01; ***P < 0.001; n ≥ 3).
The EdU staining assay verified the inhibited proliferation of intramuscular preadipocytes related to the 1 mM melatonin dose. After treating intramuscular preadipocytes with 1 mM of melatonin for 24 h, we found that the proportion of EdU-positive cells decreased by 80% (Fig. 1B, C), and no significant apoptotic cells were found by flow cytometry tests (Fig. 1D, E). Cell cycle analysis revealed that 1 mM of melatonin significantly increased the fraction of cells in the G0/G1 phase of the cell cycle, while simultaneously reducing the proportion in the G2/M phase, but not the S phase, after treatment for 24 h (Fig. 1F, G). These results suggest that melatonin could suppress preadipocyte proliferation by arresting the cell cycle process.
Melatonin significantly reduces fat deposition in intramuscular preadipocytes
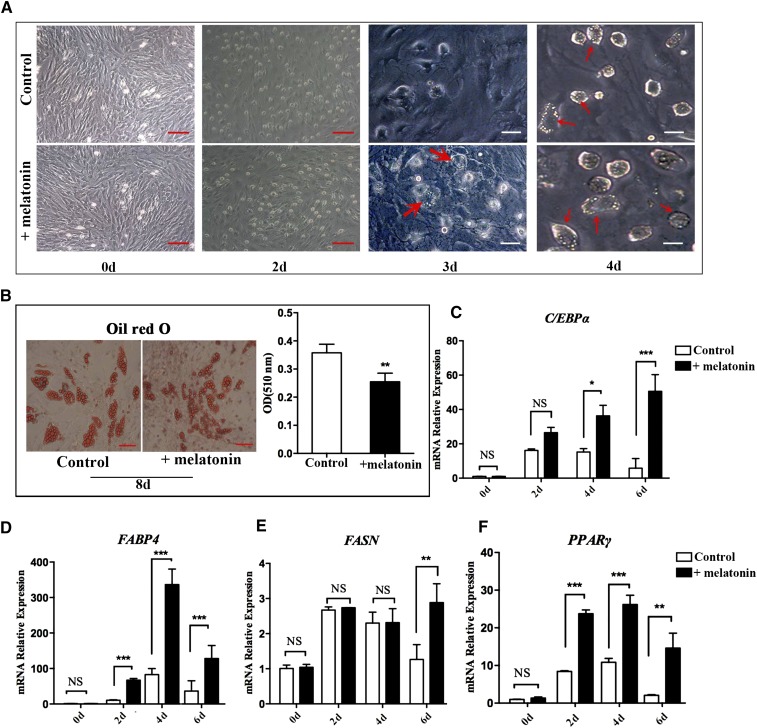
After adipogenic differentiation, the lipid droplets appeared on the third day using a medium with DMI + melatonin, while the lipid droplets developed on the fourth day using the normal medium (Fig. 2A). The medium was replaced with maintenance medium on the fifth day, but the treatment group contained 1 mM of melatonin and continued to culture for 3 days. Oil Red O staining and triglyceride levels showed that preadipocytes treated with melatonin have smaller lipid droplets and less triglyceride accumulation than those not treated with melatonin (Fig. 2B). However, the expression levels of the adipogenic genes, C/EBPα, adipocyte fatty acid-binding protein 4 (FABP4), FASN, and PPARγ, were significantly upregulated (P < 0.05) in the melatonin-treated samples compared with the control group at the 2, 4, and 6 day time points (Fig. 2C–F). These results indicate that melatonin treatment, given time, could promote fat cell differentiation earlier, but long-term melatonin treatment decreases lipid accumulation.
Fig. 2.
Effect of melatonin on adipogenesis of porcine intramuscular preadipocytes. A: The intramuscular preadipocytes were induced by DMI with or without melatonin and photographed by inverted microscopy on days 0, 2, 3, and 4 (red scale bar = 100 μm, white scale bar = 200 μm). B: Oil Red O staining for neutral lipids and quantification of Oil Red O-analyzed lipid accumulation of intramuscular preadipocytes on day 8 of differentiation (n = 3 per group) (red scale bar = 100 μm). C–F: Intramuscular preadipocytes were cultured in adipogenic medium with or without melatonin and samples were collected on days 0, 2, 4, and 6. The expression levels of the related genes [CEBPα (C), FABP4 (D), FASN (E), and PPARγ (F)] were detected by RT-qPCR. Data are represented as the mean ± SEM (*P < 0.05; **P < 0.01; ***P < 0.001; n = 3).
Melatonin promotes lipolysis of intramuscular preadipocytes
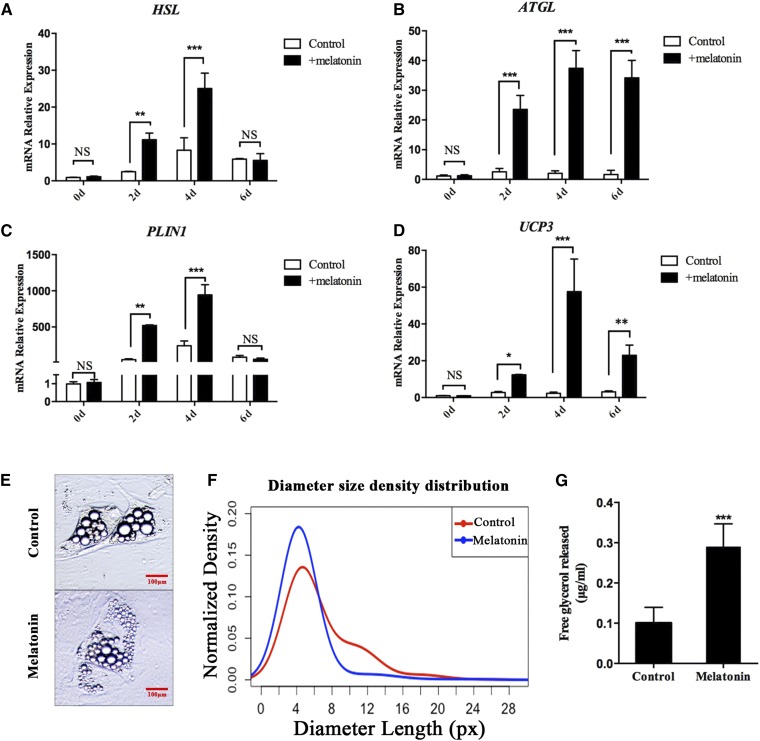
To determine whether melatonin is also involved in regulating other lipid metabolism activities, we investigated the expression of genes related to lipolysis and thermogenesis, including HSL, adipose triglyceride lipase (ATGL), PLIN1, and uncoupling protein 3 (UCP3). The expression levels of these genes in the melatonin-treated group were significantly higher than those in the control groups at 2 and 4 days. On the sixth day, although the difference of HSL and PLIN1 expression levels between these two groups was slight, the expression of ATGL and UCP3 was still significantly higher in the melatonin-treated group than the control group. (Fig. 3A–D). These results indicate that melatonin may promote the hydrolysis of porcine intramuscular preadipocytes. The lipid droplets’ diameters are mainly distributed between 0 and 8 px after 2 days of melatonin-treated porcine mature adipocytes. In the control group, the mean of the lipid droplets diameters’ size distributions shifted toward larger lipid droplets, and part of them are distributed in the 8–16 px region (Fig. 3E, F). Furthermore, melatonin significantly increases the amount of free glycerol in the medium (Fig. 3G). These data suggested that melatonin promotes lipolysis of porcine intramuscular preadipocytes.
Fig. 3.
Melatonin promotes IMF lipolysis. A–D: Intramuscular preadipocytes were cultured in DMI with or without 1 mM of melatonin and samples were collected on days 0, 2, 4, and 6. The expression levels of the related genes [HSL (A), ATGL (B), PLIN1 (C), and UCP3 (D)] were detected by RT-qPCR. E: After 2 days of melatonin treatment, porcine mature adipocytes showed smaller lipid droplets (image for viewing) (red scale bar = 100 μm). F: Smoothed distribution of lipid droplets’ diameter sizes obtained using the LipiD-QuanT software during adipogenesis (n = 803 lipid droplets). G: Free glycerol release was assessed by glycerol assay kit. Data are represented as the mean ± SEM (*P < 0.05; **P < 0.01; ***P < 0.001; n = 3).
Melatonin promotes the lipolysis of porcine adipocytes through MT2
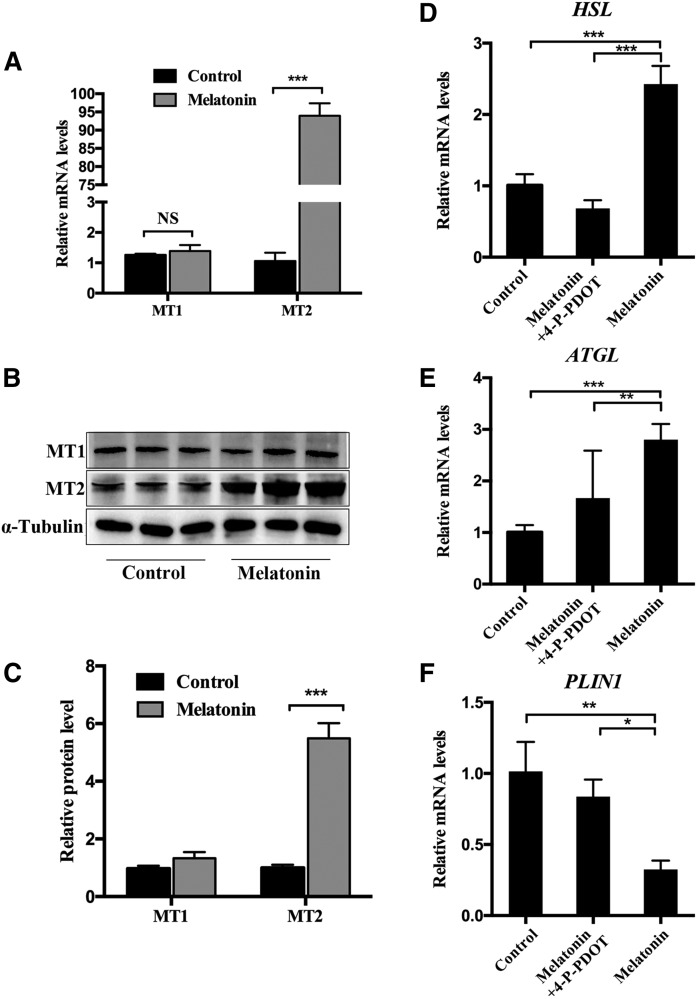
To examine the mechanism of melatonin promoting lipolysis of IMF, mature adipocytes were exposed to 1 mM of melatonin for 24 h. RT-qPCR and Western blot analyses showed that melatonin significantly promoted the expression of MT2 in IMF cells. However, it does not change the expression of MT1 (Fig. 4A–C). This suggests that MT2 may play an important role in melatonin-mediated lipolysis of intramuscular adipocytes. As expected, 4-P-PDOT, a selective antagonist of MT2 (21), can significantly inhibit the upregulation of lipolysis-related genes (HSL and ATGL) caused by melatonin (Fig. 4D, E). Moreover, it rescued the downregulation of PLIN1 caused by melatonin in mature adipocytes. These results indicate that the effect of melatonin on lipolysis in porcine intramuscular adipocytes may be mainly mediated by MT2.
Fig. 4.
Melatonin receptor (MT2) participates in lipolysis in precursor adipocytes. A: The mRNA levels of MT1 and MT2 mRNA were measured in melatonin-treated mature adipocytes by RT-qPCR. B, C: Western blot analyses were performed to detect the changes of MT1 and MT2. D–F: RT-qPCR analysis of genes involved in lipolysis in mature adipocytes cultivated in GM, GM + melatonin, and GM + melatonin + 4-P-PDOT medium for 48 h. Data are represented as the mean ± SEM (*P < 0.05; **P < 0.01; ***P < 0.001; n = 3).
Melatonin promotes intramuscular adipocyte lipolysis by activating ERK1/2 and PKA signaling pathways
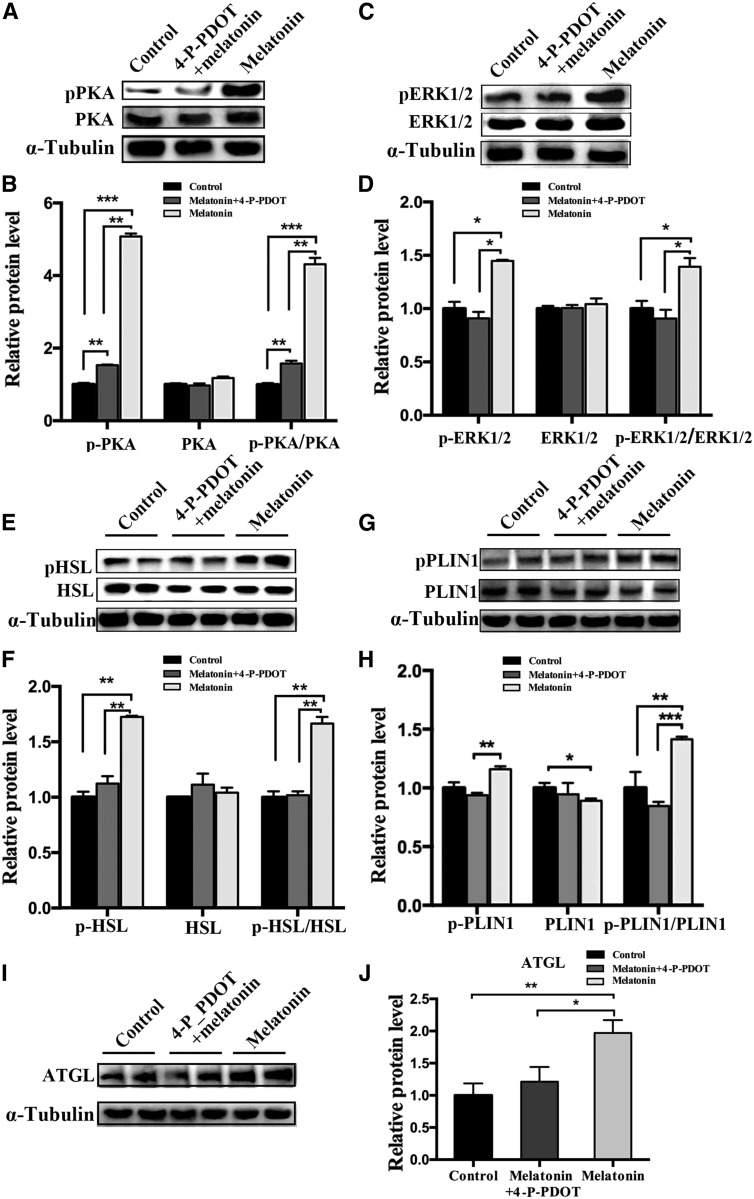
The PKA and ERK1/2 pathways are two classic pathways for lipolysis signaling, and they can be activated by melatonin. Therefore, we explored whether these pathways are involved in mediating melatonin-induced IMF lipolysis. The PKA (Thr197) and ERK1/2 (Thr202/Tyr204) phosphorylation levels in mature intramuscular adipocytes treated for 24 h with 1 mM of melatonin were detected by Western blots, and the protein levels of phosphorylated PKA and ERK1/2 were significantly increased in the melatonin-treated samples compared with the control. However, after blocking the melatonin signal through the MT2 inhibitor, 4-P-PDOT, the effect of melatonin was offset (Fig. 5A–D). As downstream lipolysis-associated genes of PKA and ERK1/2 signaling pathway, the phosphorylation levels of HSL (Ser660) and PLIN1 (Ser522) and the protein expression of ATGL were increased (Fig. 5I, J). However, the expression of PLIN1 was significantly decreased compared with the control group (Fig. 5G, H). Meanwhile, blocking the melatonin signal by 4-P-PDOT reduced the protein expression related to lipolysis, including HSL, PLIN1, and ATGL (Fig. 5E–J). These findings indicate that ERK1/2 and PKA might play a role in melatonin-mediated lipolysis.
Fig. 5.
Melatonin-activated PKA and ERK1/2 mediate lipolysis in porcine intramuscular preadipocytes. A–J: Fully differentiated adipocytes were treated with control, 1 mM of melatonin, and 1 mM of melatonin plus 10 μM of 4-P-PDOT for 24 h. The expression levels of PKA (A, B), ERK1/2 (C, D), HSL (E, F), PLIN1 (G, H), and ATGL (I, J) and the phosphorylation levels of PKA (p-PKA Thr197) (A, B), ERK1/2 (p-ERK1/2 Thr202/Tyr204) (C, D), HSL (pHSL Ser660) (E, F), PLIN1 (p-PLIN1 Ser522) (G, H), and α-tubulin (I, J) were evaluated by Western blotting. The results are represented as the mean ± SEM (*P < 0.05; **P < 0.01; ***P < 0.001; n = 3).
The role of PKA and ERK1/2 signaling in melatonin-induced lipolysis
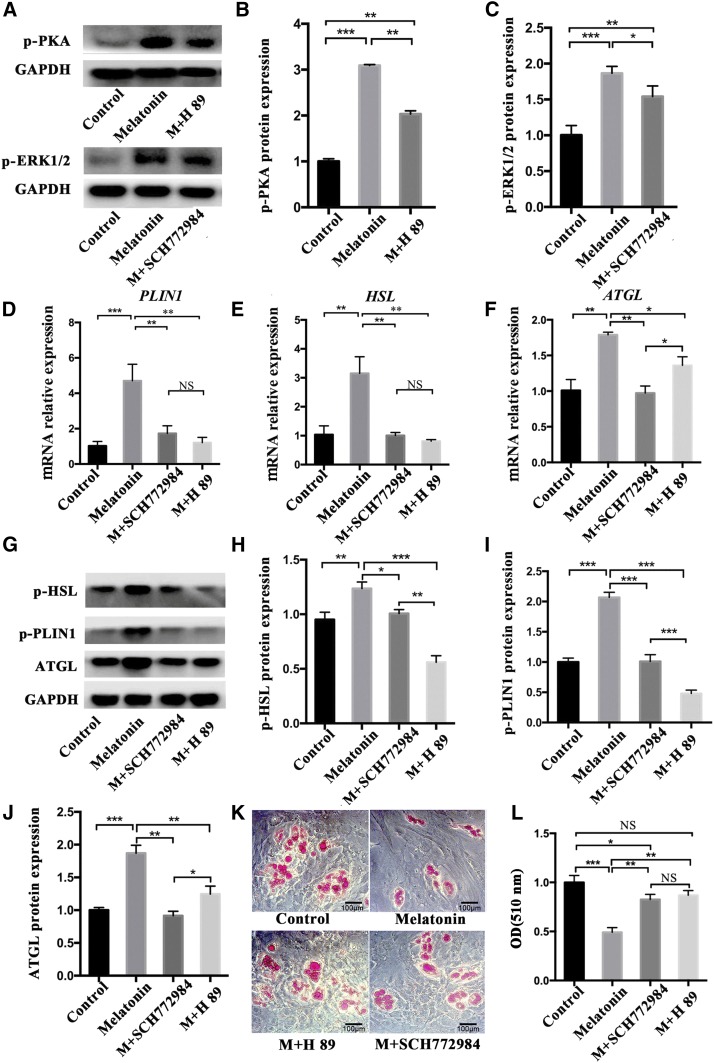
To further explore the contribution of PKA or ERK1/2 in melatonin-induced lipolysis, preadipocytes were treated with 1 mM of melatonin, 1 mM of melatonin + 10 μM of H89 (inhibitor of PKA, #HY-15979), and 1 mM of melatonin + 1 μM of SCH772984 (inhibitor of ERK1/2, #HY50846), respectively, for 24 h. Western blot showed that p-PKA and p-ERK1/2 significantly increased in the melatonin group, while p-PKA expression significantly decreased in the melatonin + H89 group, and p-ERK expression significantly decreased in the SCH772984 group (Fig. 6A–C). The presence of H89 or SCH772984 significantly reduced mRNA expression of PLIN1, HSL, and ATGL compared with the melatonin-treated groups (Fig. 6D–F). Similarly, phosphorylated PLIN1 and HSL also decreased significantly under the influence of H89 or SCH772984 (Fig. 6G–I). More reduction of ATGL appeared after the ERK1/2 signal was suppressed (Fig. 6G, J). This indicated that melatonin, through PKA signal, plays a major role in the regulation of PLIN1 and HSL, while ERK1/2 has a more significant effect on ATGL. Oil Red O staining showed that H89 could be more effective on blocking melatonin to induce lipid droplet lipolysis, resulting in a larger area of Oil Red O in the H89 + melatonin group (Fig. 6K, L). Although SCH772984 can also inhibit melatonin-induced lipolysis, the effect is slightly weaker than H89.
Fig. 6.
The role of PKA and ERK1/2 signaling in melatonin-induced lipolysis. A–C: Intramuscular preadipocytes were treated with 1 mM of melatonin, 1 mM of melatonin + 10 μM of H89, and 1 mM of melatonin + 1 μM of SCH772984, respectively, for 24 h. The phosphorylation levels of PKA (p-PKA Thr197) and ERK1/2 (p-ERK1/2 Thr202/Tyr204) were evaluated by Western blotting. D–F: The expression levels of PLIN1 (D), HSL (E), and ATGL (F) were measured by RT-qPCR. G–J: Western blots (G) detected protein expression levels of HSL (pHSL Ser660) (H), PLIN1 (p-PLIN1 Ser522) (I), and ATGL (J). K, L: Oil Red O staining for neutral lipids (K) and quantification of Oil Red O analyzed lipid accumulation of intramuscular preadipocytes (L) (black scale bar = 100 μm). The results are represented as the mean ± SEM (*P < 0.05; **P < 0.01; ***P < 0.001; n = 3).
Melatonin increases mitochondrial content and function in intramuscular preadipocytes
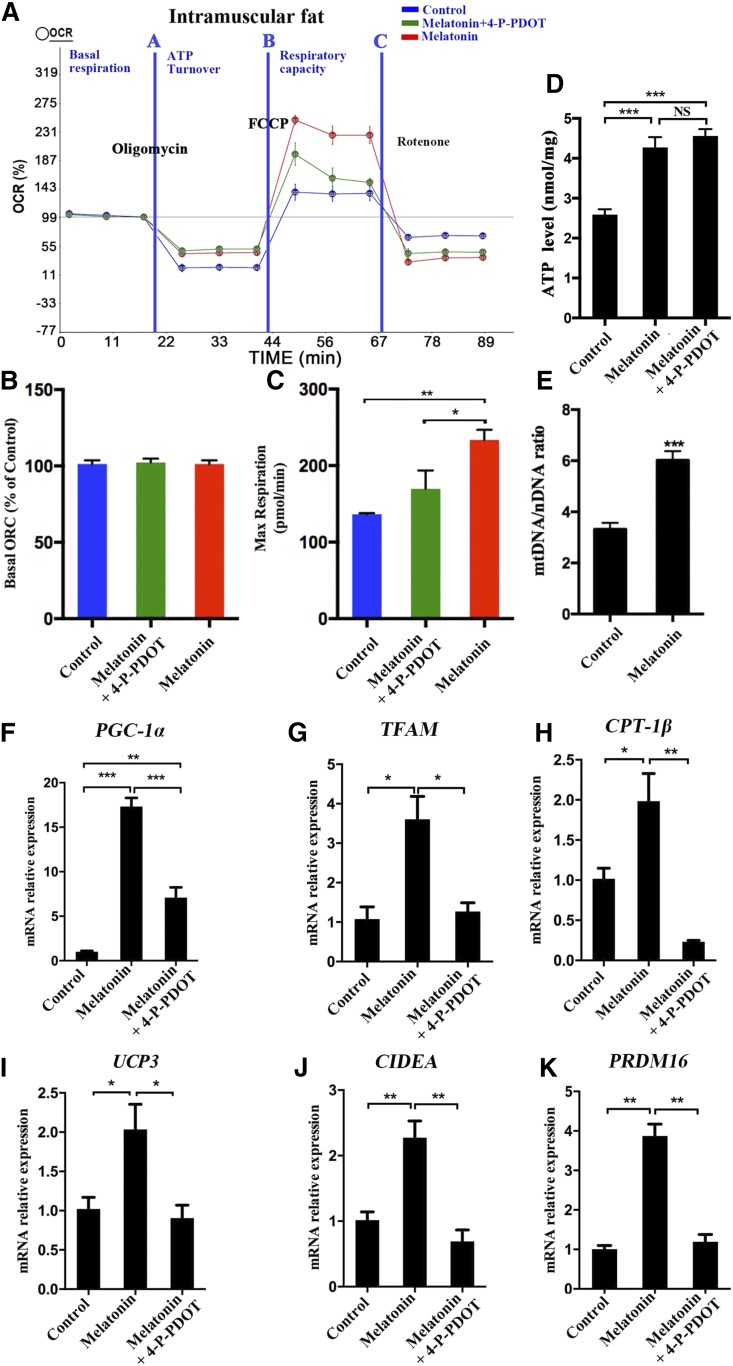
To understand the effect of melatonin on the metabolism of intramuscular preadipocytes, we examined the level of cellular oxygen consumption in different treatment groups. Our data showed a similar basal OCR in the three treatments (Fig. 7A, B). However, the addition of the exogenous uncoupler, carbonyl cyanide-4-(trifluoromethoxy) phenyl-hydrazone, increased the maximum respiratory rate to a higher level in the melatonin group cells compared with the control group cells. The addition of a melatonin antagonist (4-P-PDOT) can partly reduce the OCR (Fig. 7A, C). Meanwhile, melatonin significantly increased the intracellular ATP generation in porcine intramuscular adipocytes (Fig. 7D).
Fig. 7.
Melatonin may accelerate the expenditure of porcine intramuscular preadipocytes by increasing mitochondrial biogenesis. Measurement of the OCRs of intramuscular preadipocytes in control, 1 mM of melatonin, and 1 mM of melatonin + 10 μM of 4-P-PDOT [Quantitative (A), basal OCR (B), and maximum respiratory rate (C)]. D: Relative ATP level in porcine intramuscular preadipocytes treated with 1 mM of melatonin and 1 mM of melatonin + 10 μM of 4-P-PDOT. E: Mitochondrial contents were evaluated by measuring the ratio of mtDNA:nDNA (n = 3 per treatment). F–K: The expression levels of mitochondrial biogenesis (PGC-1α, TFAM, CPT-1β), thermogenesis genes (UCP3), and browning genes (CIDEA, PRDM16) were measured by RT-qPCR. The results are represented as the mean ± SEM (*P < 0.05; **P < 0.01; ***P < 0.001; n = 3).
Melatonin treatment significantly increased the mitochondrial copy number compared with the control (Fig. 7E). Furthermore, melatonin significantly upregulated the expression of mitochondrial-related genes, including PPARγ coactivator 1α (PGC-1α), transcription factor A mitochondrial (TFAM), and carnitine palmitoyltransferase (CPT)-1β, thermogenesis gene UCP3, and white adipose browning genes, including cell death-inducing DFFA-like effector A (CIDEA) and PR domain containing 16 (PRDM16), compared with the controls. However, this effect was weakened by the addition of 4-P-PDOT (Fig. 7F–K). Therefore, melatonin increases mitochondrial content and respiratory function, and thereby enhances fatty acid oxidation or thermogenesis in intramuscular preadipocytes.
Effects of PKA and ERK1/2 signaling on mitochondrial function during melatonin treatment of intramuscular preadipocytes
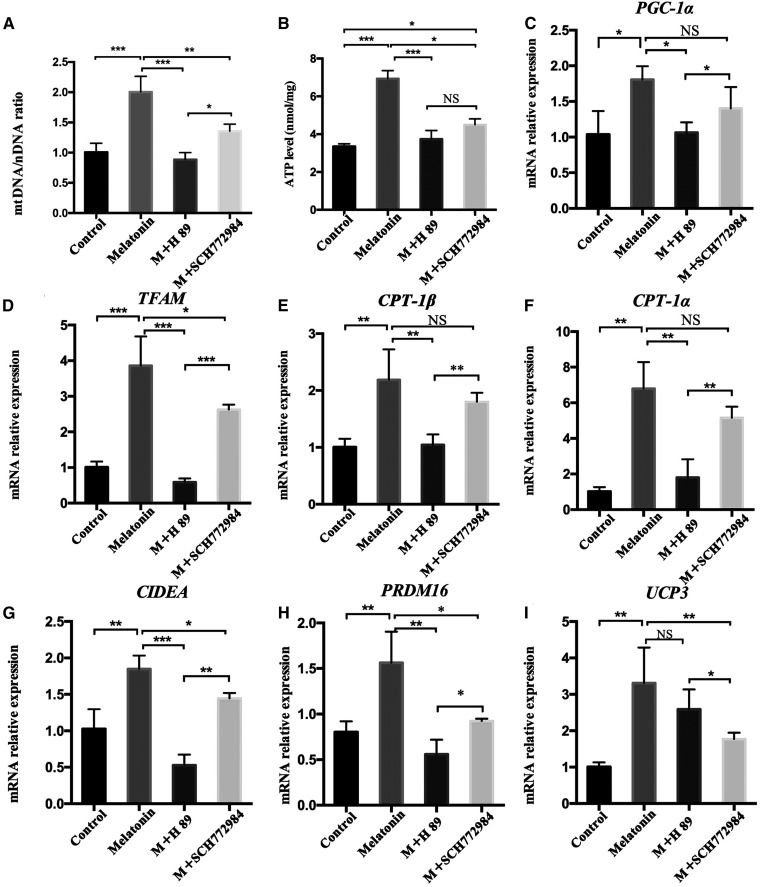
To study the effects of PKA and ERK1/2 signaling pathways on the mitochondrial function of melatonin-treated intramuscular preadipocytes, preadipocytes were treated with 1 mM of melatonin, 1 mM of melatonin + 10 μM of H89, and 1 mM of melatonin + 1 μM of SCH772984, respectively, for 24 h. Both the melatonin + H89 treatment and the melatonin + SCH772984 treatment significantly inhibited the increase of mitochondrial copy number compared with the melatonin group (Fig. 8A). The total ATP levels also showed the same trend (Fig. 8B). Moreover, H89 significantly inhibited the effect of melatonin in upregulating the mitochondrial biogenesis-related genes, PGC-1α, TFAM, CPT-1β, and CPT-1α, as well as the browning genes, CIDEA and PRDM16 (Fig. 8C–H). SCH772984 also significantly inhibited the upregulation of TFAM, CIDEA, and PRDM16 by melatonin, but the effects on PGC-1α, CPT-1α, and CPT-1β were not significant (Fig. 8C, E, F). In addition, the expression of the thermogenic gene, UCP3, is significantly reduced in the melatonin + SCH772984 group compared with melatonin + h89 group (Fig. 8I). These data indicate that melatonin affects the expression of UCP3 mainly through the ERK1/2 signal, and affects mitochondrial biogenesis as well as intramuscular preadipocyte browning through the PKA signal.
Fig. 8.
Effects of PKA and ERK1/2 signaling on mitochondrial function during melatonin treatment of intramuscular preadipocytes. Intramuscular preadipocytes were treated with 1 mM of melatonin, 1 mM of melatonin + 10 μM of H89, and 1 mM of melatonin + 1 μM of SCH772984, respectively, for 24 h. A: The ratio of mtDNA:nDNA was used to evaluate mitochondrial contents (n = 3 per treatment). B: Relative ATP levels were measured in the different treatments of intramuscular preadipocytes. C–I: The expression levels of mitochondrial biogenesis genes [PGC-1α (C), TFAM (D), CPT-1β (E), and CPT-1α (F)], browning genes [CIDEA (G) and PRDM16 (H)], and thermogenesis genes [UCP3 (I)] were measured by RT-qPCR. The results are represented as the mean ± SEM (*P < 0.05; **P < 0.01; ***P < 0.001; n = 3).
Melatonin leads to a decrease in body weight and IMF deposition
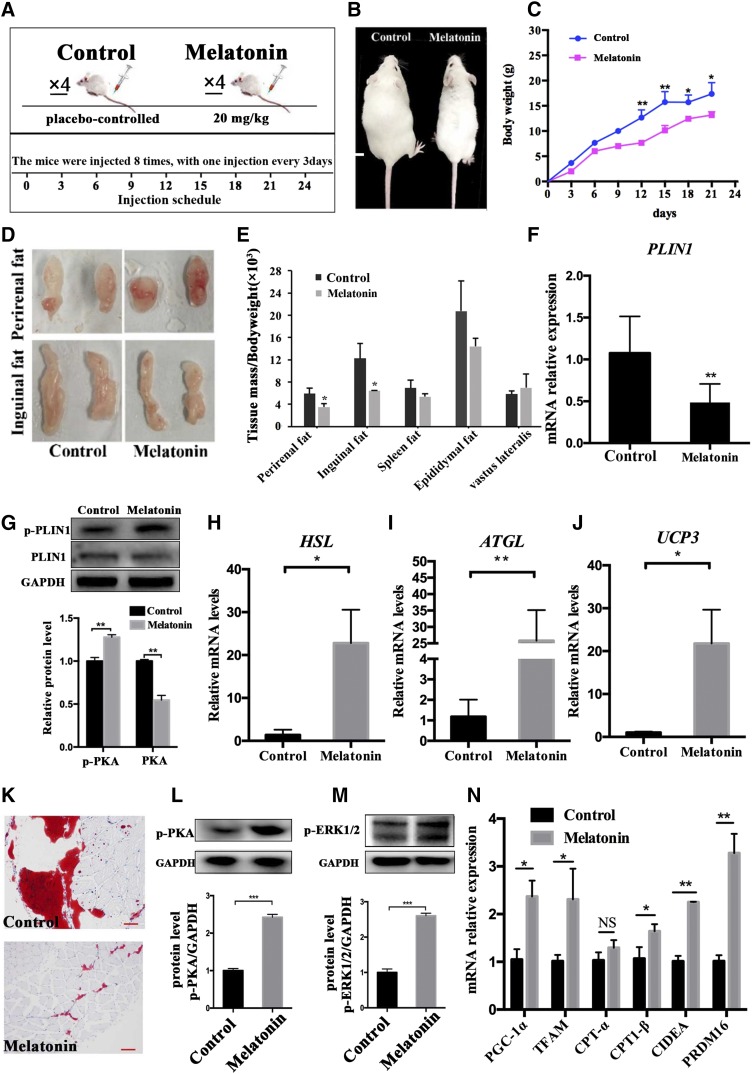
Furthermore, our study in vivo found that injection of melatonin through the tail vein of Institute of Cancer Research mice for 3 weeks was associated with significantly decreased body weight compared with the control group animals (Fig. 9A–C). Meanwhile, melatonin significantly reduced perineal fat and inguinal fat (Fig. 9D, E). PLIN1, an ideal marker gene for adipose tissue in muscle, and its mRNA protein levels were significantly reduced in the VL muscle tissue of mice treated with melatonin, but the phosphorylation level was significantly increased (Fig. 9F, G). The expression of other lipolysis-related genes, such as HSL, ATGL, and UCP3, was also significantly upregulated in the melatonin-treated group (Fig. 9H–J). The area of Oil Red O staining in VL muscle was significantly reduced in mice treated with melatonin, (Fig. 9K). Moreover, phosphorylation levels of both PKA and ERK1/2 were significantly elevated (Fig. 9L, M). The expression of critical genes of mitochondrial biogenesis and browning genes were significantly increased in the VL muscle of the melatonin-treated group (Fig. 9N). The above data indicated that melatonin can reduce IMF deposition by promoting lipolysis and fat metabolism in vivo.
Fig. 9.
Melatonin reduced IMF deposition in the mouse bodies. A: The dosage and frequency of melatonin administration in the mouse model. B: Morphological appearance of mice injected with or without melatonin 24 days later. C: Mouse weight gain curve during injection. D: Morphological appearance of significantly reduced adipose tissue of inguinal and perirenal fat. E: Different adipose tissue/body weight ratio. F, G: The mRNA and protein expression of PLIN1 or p-PLIN1 was tested by RT-qPCR and Western blots in VL muscle. H–J: The mRNA expression levels of HSL (H), ATGL (I), and UCP3 (J) were detected by RT-qPCR in the VL muscle. K: Oil Red O staining of VL muscle adipose tissue sections. L, M: Western blots evaluated the expression p-PKA (L) and p-ERK1/2 (M) in VL muscle. N: RT-qPCR was used to test the expression of mitochondrial biogenesis in PGC-1α, TFAM, CPT-1α, and CPT-1β and browning genes (CIDEA and PRDM16). The results are represented as the mean ± SEM (*P < 0.05; **P < 0.01; ***P < 0.001; n = 4 per group).
DISCUSSION
Diabetes and obesity are becoming the leading cause of cancer and death worldwide. Cancers caused by diabetes and high body mass index (>25 kg/m2) accounted for 5.6% of the world’s new cancer cases in 2012 (22). Therefore, how to effectively regulate IMF deposition has become an area of great concern. Melatonin (N-acetyl-5-methoxytryptamine) regulates a variety of important central and peripheral actions related to circadian rhythms, reproduction, and neuroendocrine signaling in mammals (23–25). Melatonin also plays a crucial role in the regulation of adipocyte metabolism by promoting adipocyte proliferation (26), differentiation (11), and white fat browning (27, 28). Our study confirmed that melatonin doses of 0.5 mM and 1 mM (especially 1 mM) inhibited intramuscular preadipocyte proliferation. This finding aligns with the previously published report regarding the human osteoblastic cell line (29). However, Linsen Zan and colleagues reported that 1 mM of melatonin did not affect the proliferation of bovine intramuscular preadipocytes (14). This inconsistency may be due to the different contributions of melatonin to different animal-derived cells. Moreover, the G1 and S phases of the cell cycle are an important regulatory period of the metabolic process. In the G0/G1 phase, the key gene for fat synthesis (PPARγ) is activated to promote adipogenesis by phosphorylation (30, 31). We found that melatonin arrested intramuscular preadipocytes in the G0/G1 phase and upregulated C/EBPα, FABP4, FASN, and PPARγ mRNA levels. Moreover, melatonin can promote the early adipogenic differentiation of intramuscular preadipocytes, but long-term melatonin treatment reduces the accumulation of triglycerides.
Adipocyte lipolysis is mediated by a complicated process that depends on lipases and proteins associated with lipid droplets, including HSL, ATGL, and PLIN1 (32), and lipolysis is closely related to thermogenesis (33). Our results showed that lipolysis and thermogenic-related genes were significantly elevated by melatonin treatment. With melatonin treatment, lipid droplets became smaller and glycerol levels increased. This result is consistent with studies in the 3T3-L1 cell line (34). Our data indicated that melatonin reduces lipid deposition by increasing lipolysis and thermogenesis in intramuscular preadipocytes.
In mammals, activated MT1 and MT2 are important mediators of the physiological function of melatonin. The reactivity of different types of cells to melatonin depends on the expression level of its receptor (35, 36). Melatonin modulates glucose homeostasis and energy balance through the direct activation of MT1 receptors on adipocytes (37). However, in bovine intramuscular preadipocytes, melatonin directly activates MT2, promoting triacylglycerol accumulation (14). Interestingly, our data revealed that melatonin significantly promotes lipolysis by increasing the level of MT2 in mature adipocytes.
Melatonin may be closely related to the PKA and ERK1/2 pathways (38–40), which play a key role in lipolysis (41). Melatonin can trigger PKA activation in the rodent malaria parasite, Plasmodium chabaudi (42). Melatonin can also activate ERK1/2 in osteoblasts (43). However, no studies indicate whether melatonin can activate PKA or ERK1/2 in porcine intramuscular preadipocytes. Our current data suggest that melatonin activates PKA and ERK1/2, leading to reduced PLIN1 expression and increased phosphorylation of PLIN1, which is the main cause of melatonin-induced lipolysis of adipocytes. PLIN1 serves as a lipid droplet-protective protein to prevent hydrolysis of triacylglycerol by HSL, while the reduction in PLIN1 and/or the increase in its phosphorylation would impair the barrier function of the protein (41, 44). HSL is mainly located in the cytoplasm. After phosphorylation, it will translocate from the cytosol to the surface of lipid droplets and synergize with p-PLIN1 and ATGL to further increase the lipolysis reaction (45). More and more HSL is phosphorylated and translocated to the surface of lipid droplets, which are involved in the lipolysis reaction. Part of the HSL enters the small lipid droplets produced by lipolysis (46). This may result in a decrease in intracellular HSL protein, and then lead to a compensatory increase in HSL mRNA. In addition, our study also showed that melatonin promoted the phosphorylation of HSL and PLIN1 more efficiently through the PKA signaling pathway. ERK1/2 had a more significant effect on the expression of ATGL.
Lipolysis produces glycerol and fatty acids, where fatty acids are catalyzed by fatty acyl-CoA synthetases located in the endoplasmic reticulum and mitochondrial outer membranes to form acyl-CoA, which enters the mitochondria to participate in β-oxidation and release heat (47). This is the main route of fatty acid degradation and is closely linked to mitochondrial content and respiration capability (48). A previous study showed that an increase of PGC-1α promotes the expression of TFAM, an important regulator in mitochondrial biogenesis (40). TFAM translocates into the mitochondria to stimulate DNA replication and gene expression (49, 50), thereby promoting mitochondrial biogenesis and function. Our data show that melatonin treatments significantly increased cellular respiratory capacity, upregulated the expression of PGC-1α and TFAM, and increased mitochondrial copy number. The addition of melatonin also induced the robust expression of thermogenic genes in intramuscular preadipocytes, including CPT-1β and UCP3, and triggered differentiation toward beige phenotype genes, CIDEA and Prdm16. However, when the melatonin signal was switched off via the MT2 antagonist, 4-P-PDOT, the melatonin-promoting effect diminished or disappeared. Further study showed that blocking PKA and ERK1/2 signaling reduced the promotion of melatonin on downstream lipolysis. We found that melatonin-activated PKA signaling is more likely to upregulate mitochondrial and browning-related genes, whereas activated ERK1/2 signaling primarily affects ATGL and UCP3 expression. These findings suggest that melatonin accelerates intramuscular preadipocyte expenditures in vitro by enhancing mitochondrial biogenesis and energy metabolism, thereby reducing porcine intramuscular preadipocyte deposition.
The body of data suggesting that melatonin reduces porcine IMF deposition in vitro is growing. An in vivo test was performed on mice to determine whether melatonin can reduce IMF deposition. By injecting exogenous melatonin, tissue sections with Oil Red O staining indicated that melatonin indeed reduces IMF deposition in VL muscle. Melatonin also promotes the expression of lipolytic genes, mitochondria-associated genes, and thermogenic genes in vivo. These results are consistent with the results of in vitro studies. Therefore, melatonin, at least partially, reduces IMF deposition by promoting lipolysis and heat production.
In conclusion, melatonin can inhibit proliferation, promote differentiation, and enhance the mitochondrial function of porcine intramuscular preadipocytes, and the promotion of intramuscular adipocyte lipolysis was mediated by MT2 activating ERK1/2 and PKA signaling. Our data establish a correlation between melatonin signaling and lipid metabolism in mammalian intramuscular preadipocytes. These findings further deepened our understanding of the mechanism of melatonin in regulating IMF deposition. Additional work is needed to determine whether melatonin reduces IMF deposition in pigs and to confirm the physiological consequences of melatonin-regulated IMF deposition to systemic energy balance and metabolism in vivo.
Footnotes
Abbreviations:
- ATGL
- adipose triglyceride lipase
- C/EBP
- CCAAT/enhancer binding protein
- CIDEA
- cell death-inducing DFFA-like effector A
- Cox2
- cytochrome c oxidase subunit 2
- CPT
- carnitine palmitoyltransferase
- DMI
- 0.25 mM dexamethasone, 1 mM 3-isobutyl-1-methylxanthine, and 5 μg/ml insulin
- EdU
- 5-ethynyl-2′-deoxyuridine
- FABP4
- fatty acid-binding protein 4
- FACS
- fluorescence-activated cell sorting
- GM
- growth medium
- HSL
- hormone-sensitive lipase
- IMF
- intramuscular fat
- MT1
- melatonin receptor 1A
- MT2
- melatonin receptor 1B
- OCR
- oxygen consumption rate
- PGC-1α
- PPARγ coactivator 1α
- PI
- propidium iodide
- PKA
- protein kinase A
- PLIN1
- perilipin 1
- PRDM16
- PR domain containing 16
- 4-P-PDOT
- 4-phenyl-2-propionamidotetralin
- RT-qPCR
- quantitative RT-PCR
- TFAM
- transcription factor A mitochondrial
- UCP3
- uncoupling protein 3
- VL
- vastus lateralis
This work was supported by National Natural Science Foundation of China Grant 31872334, Natural Science Foundation of Jiangsu Province Grant BK20160727, and Fundamental Research Funds for the Central Universities Grant KYZ201639.
REFERENCES
- 1.Hocquette J. F., Gondret F., Baeza E., Medale F., Jurie C., and Pethick D. W.. 2010. Intramuscular fat content in meat-producing animals: development, genetic and nutritional control, and identification of putative markers. Animal. 4: 303–319. [DOI] [PubMed] [Google Scholar]
- 2.Malek M., Dekkers J. C. M., Lee H. K., Baas T. J., Prusa K., Huff-Lonergan E., and Rothschild M. F.. 2001. A molecular genome scan analysis to identify chromosomal regions influencing economic traits in the pig. II. Meat and muscle composition. Mamm. Genome. 12: 637–645. [DOI] [PubMed] [Google Scholar]
- 3.Wood J. D., Nute G. R., Richardson R. I., Whittington F. M., Southwood O., Plastow G., Mansbridge R., da Costa N., and Chang K. C.. 2004. Effects of breed, diet and muscle on fat deposition and eating quality in pigs. Meat Sci. 67: 651–667. [DOI] [PubMed] [Google Scholar]
- 4.Chen G., and Sui Y.. 2018. Production, performance, slaughter characteristics, and meat quality of Ziwuling wild crossbred pigs. Trop. Anim. Health Prod. 50: 365–372. [DOI] [PubMed] [Google Scholar]
- 5.Goodpaster B. H., Thaete F. L., and Kelley D. E.. 2000. Thigh adipose tissue distribution is associated with insulin resistance in obesity and in type 2 diabetes mellitus. Am. J. Clin. Nutr. 71: 885–892. [DOI] [PubMed] [Google Scholar]
- 6.Prior S. J., Joseph L. J., Brandauer J., Katzel L. I., Hagberg J. M., and Ryan A. S.. 2007. Reduction in midthigh low-density muscle with aerobic exercise training and weight loss impacts glucose tolerance in older men. J. Clin. Endocrinol. Metab. 92: 880–886. [DOI] [PubMed] [Google Scholar]
- 7.Reiter R. J. 1991. Pineal melatonin: cell biology of its synthesis and of its physiological interactions. Endocr. Rev. 12: 151–180. [DOI] [PubMed] [Google Scholar]
- 8.Mura M. C., Luridiana S., Farci F., Di Stefano M. V., Daga C., Pulinas L., Staric J., and Carcangiu V.. 2017. Melatonin treatment in winter and spring and reproductive recovery in Sarda breed sheep. Anim. Reprod. Sci. 185: 104–108. [DOI] [PubMed] [Google Scholar]
- 9.Cassone V. M. 1990. Effects of melatonin on vertebrate circadian systems. Trends Neurosci. 13: 457–464. [DOI] [PubMed] [Google Scholar]
- 10.Amstrup A. K., Sikjaer T., Pedersen S. B., Heickendorff L., Mosekilde L., and Rejnmark L.. 2016. Reduced fat mass and increased lean mass in response to 1 year of melatonin treatment in postmenopausal women: a randomized placebo-controlled trial. Clin. Endocrinol. (Oxf.). 84: 342–347. [DOI] [PubMed] [Google Scholar]
- 11.González A., Alvarez-García V., Martínez-Campa C., Alonso-González C., and Cos S.. 2012. Melatonin promotes differentiation of 3T3-L1 fibroblasts. J. Pineal Res. 52: 12–20. [DOI] [PubMed] [Google Scholar]
- 12.Alonso-Vale M. I. C., Peres S. B., Vernochet C., Farmer S. R., and Lima F. B.. 2009. Adipocyte differentiation is inhibited by melatonin through the regulation of C/EBP beta transcriptional activity. J. Pineal Res. 47: 221–227. [DOI] [PubMed] [Google Scholar]
- 13.Jin J. X., Lee S., Taweechaipaisankul A., Kim G. A., and Lee B. C.. 2017. Melatonin regulates lipid metabolism in porcine oocytes. J. Pineal Res. 62: doi:10.1111/jpi.12388. [DOI] [PubMed] [Google Scholar]
- 14.Yang W., Tang K., Wang Y., Zhang Y., and Zan L.. 2017. Melatonin promotes triacylglycerol accumulation via MT2 receptor during differentiation in bovine intramuscular preadipocytes. Sci. Rep. 7: 15080. [DOI] [PMC free article] [PubMed] [Google Scholar]
- 15.Xu P. F., Wang J. L., Hong F., Wang S., Jin X., Xue T. T., Jia L., and Zhai Y. G.. 2017. Melatonin prevents obesity through modulation of gut microbiota in mice. J. Pineal Res. 62: doi:10.1111/jpi.12399. [DOI] [PubMed] [Google Scholar]
- 16.Zinn S. A., Chapin L. T., Enright W. J., Schroeder A. L., Stanisiewski E. P., and Tucker H. A.. 1988. Growth, carcass composition and plasma melatonin in postpubertal beef heifers fed melatonin. J. Anim. Sci. 66: 21–27. [DOI] [PubMed] [Google Scholar]
- 17.Han H., Wei W., Chu W., Liu K., Tian Y., Jiang Z., and Chen J.. 2017. Muscle conditional medium reduces intramuscular adipocyte differentiation and lipid accumulation through regulating insulin signaling. Int. J. Mol. Sci. 18: E1799. [DOI] [PMC free article] [PubMed] [Google Scholar]
- 18.Che Y., Wang Q., Xiao R., Zhang J., Zhang Y., Gu W., Rao G., Wang C., and Kuang H.. 2018. Kudinoside-D, a triterpenoid saponin derived from Ilex kudingcha suppresses adipogenesis through modulation of the AMPK pathway in 3T3-L1 adipocytes. Fitoterapia. 125: 208–216. [DOI] [PubMed] [Google Scholar]
- 19.Varinli H., Osmond-McLeod M. J., Molloy P. L., and Vallotton P.. 2015. LipiD-QuanT: a novel method to quantify lipid accumulation in live cells. J. Lipid Res. 56: 2206–2216. [DOI] [PMC free article] [PubMed] [Google Scholar]
- 20.Fernández-Galilea M., Pérez-Matute P., Prieto-Hontoria P. L., Houssier M., Burrell M. A., Langin D., Martínez J. A., and Moreno-Aliaga M. J.. 2015. α-Lipoic acid treatment increases mitochondrial biogenesis and promotes beige adipose features in subcutaneous adipocytes from overweight/obese subjects. Biochim. Biophys. Acta. 1851: 273–281. [DOI] [PubMed] [Google Scholar]
- 21.Rhee S. W., and Tanga M. J.. 2000. Synthesis of tritium labelled 4P-PDOT, a selective melatonin receptor antagonist. J. Labelled Comp. Radiopharm. 43: 925–932. [Google Scholar]
- 22.Pearson-Stuttard J., Zhou B., Kontis V., Bentham J., Gunter M. J., and Ezzati M.. 2018. Worldwide burden of cancer attributable to diabetes and high body-mass index: a comparative risk assessment. Lancet Diabetes Endocrinol. 6: 95–104. [DOI] [PMC free article] [PubMed] [Google Scholar]
- 23.Söderquist F., Janson E. T., Rasmusson A. J., Alit A., Stridsberg M., and Cunningham J. L.. 2016. Melatonin immunoreactivity in malignant small intestinal neuroendocrine tumours. PLoS One. 11: e0164354. [DOI] [PMC free article] [PubMed] [Google Scholar]
- 24.Yu K., Deng S. L., Sun T. C., Li Y. Y., and Liu Y. X.. 2018. Melatonin regulates the synthesis of steroid hormones on male reproduction: a review. Molecules. 23: E447. [DOI] [PMC free article] [PubMed] [Google Scholar]
- 25.Pfeffer M., Korf H. W., and Wicht H.. 2018. Synchronizing effects of melatonin on diurnal and circadian rhythms. Gen. Comp. Endocrinol. 258: 215–221. [DOI] [PubMed] [Google Scholar]
- 26.Liu Z., Gan L., Luo D., and Sun C.. 2017. Melatonin promotes circadian rhythm-induced proliferation through Clock/histone deacetylase 3/c-Myc interaction in mouse adipose tissue. J. Pineal Res. 62: doi:10.1111/jpi.12383. [DOI] [PubMed] [Google Scholar]
- 27.Jiménez-Aranda A., Fernández-Vázquez G., Campos D., Tassi M., Velasco-Perez L., Tan D. X., Reiter R. J., and Agil A.. 2013. Melatonin induces browning of inguinal white adipose tissue in Zucker diabetic fatty rats. J. Pineal Res. 55: 416–423. [DOI] [PubMed] [Google Scholar]
- 28.Seron-Ferre M., Reynolds H., Mendez N. A., Mondaca M., Valenzuela F., Ebensperger R., Valenzuela G. J., Herrera E. A., Llanos A. J., and Torres-Farfan C.. 2015. Impact of maternal melatonin suppression on amount and functionality of brown adipose tissue (BAT) in the newborn sheep. Front. Endocrinol. (Lausanne). 5: 232. [DOI] [PMC free article] [PubMed] [Google Scholar]
- 29.Liu L., Zhu Y., Xu Y., and Reiter R. J.. 2012. Prevention of ERK activation involves melatonin-induced G1 and G2/M phase arrest in the human osteoblastic cell line hFOB 1.19. J. Pineal Res. 53: 60–66. [DOI] [PubMed] [Google Scholar]
- 30.Sarruf D. A., Iankova I., Abella A., Assou S., Miard S., and Fajas L.. 2005. Cyclin D3 promotes adipogenesis through activation of peroxisome proliferator-activated receptor gamma. Mol. Cell. Biol. 25: 9985–9995. [DOI] [PMC free article] [PubMed] [Google Scholar]
- 31.Lopez-Mejia I. C., Castillo-Armengol J., Lagarrigue S., and Fajas L.. 2018. Role of cell cycle regulators in adipose tissue and whole body energy homeostasis. Cell. Mol. Life Sci. 75: 975–987. [DOI] [PMC free article] [PubMed] [Google Scholar]
- 32.Carmen G. Y., and Victor S. M.. 2006. Signalling mechanisms regulating lipolysis. Cell. Signal. 18: 401–408. [DOI] [PubMed] [Google Scholar]
- 33.Dalbo V. J., Roberts M. D., Stout J. R., and Kerksick C. M.. 2008. Acute effects of ingesting a commercial thermogenic drink on changes in energy expenditure and markers of lipolysis. J. Int. Soc. Sports Nutr. 5: 6. [DOI] [PMC free article] [PubMed] [Google Scholar]
- 34.Kato H., Tanaka G., Masuda S., Ogasawara J., Sakurai T., Kizaki T., Ohno H., and Izawa T.. 2015. Melatonin promotes adipogenesis and mitochondrial biogenesis in 3T3-L1 preadipocytes. J. Pineal Res. 59: 267–275. [DOI] [PubMed] [Google Scholar]
- 35.Reppert S. M., Godson C., Mahle C. D., Weaver D. R., Slaugenhaupt S. A., and Gusella J. F.. 1995. Molecular characterization of a second melatonin receptor expressed in human retina and brain: the Mel1b melatonin receptor. Proc. Natl. Acad. Sci. USA. 92: 8734–8738. [DOI] [PMC free article] [PubMed] [Google Scholar]
- 36.Pandi-Perumal S. R., Trakht I., Srinivasan V., Spence D. W., Maestroni G. J., Zisapel N., and Cardinali D. P.. 2008. Physiological effects of melatonin: role of melatonin receptors and signal transduction pathways. Prog. Neurobiol. 85: 335–353. [DOI] [PubMed] [Google Scholar]
- 37.Alonso-Vale M. I., Andreotti S., Peres S. B., Anhe G. F., das Neves Borges-Silva C., Neto J. C., and Lima F. B.. 2005. Melatonin enhances leptin expression by rat adipocytes in the presence of insulin. Am. J. Physiol. Endocrinol. Metab. 288: E805–E812. [DOI] [PubMed] [Google Scholar]
- 38.Picinato M. C., Haber E. P., Cipolla-Neto J., Curi R., Carvalho C. R. D., and Carpinelli A. R.. 2002. Melatonin inhibits insulin secretion and decreases PKA levels without interfering with glucose metabolism in rat pancreatic islets. J. Pineal Res. 33: 156–160. [DOI] [PubMed] [Google Scholar]
- 39.Tao L., and Zhu Y.. 2018. Melatonin regulates CRE-dependent gene transcription underlying osteoblast proliferation by activating Src and PKA in parallel. Am. J. Transl. Res. 10: 86–100. [PMC free article] [PubMed] [Google Scholar]
- 40.Lan L., Guo M., Ai Y., Chen F., Zhang Y., Xia L., Huang D., Niu L., Zheng Y., Suzuki C. K., et al. . 2017. Tetramethylpyrazine blocks TFAM degradation and up-regulates mitochondrial DNA copy number by interacting with TFAM. Biosci. Rep. 37: doi:10.1042/BSR20170319. [DOI] [PMC free article] [PubMed] [Google Scholar]
- 41.Liu L. R., Lin S. P., Chen C. C., Chen Y. J., Tai C. C., Chang S. C., Juang R. H., Tseng Y. W., Liu B. H., Mersmann H. J., et al. . 2011. Serum amyloid A induces lipolysis by downregulating perilipin through ERK1/2 and PKA signaling pathways. Obesity (Silver Spring). 19: 2301–2309. [DOI] [PubMed] [Google Scholar]
- 42.Gazarini M. L., Beraldo F. H., Almeida F. M., Bootman M., da Silva A. M., and Garcia C. R. S.. 2011. Melatonin triggers PKA activation in the rodent malaria parasite Plasmodium chabaudi. J. Pineal Res. 50: 64–70. [DOI] [PubMed] [Google Scholar]
- 43.Liu L., Xu Y., Reiter R. J., Pan Y., Chen D., Liu Y., Pu X., Jiang L., and Li Z.. 2016. Inhibition of ERK1/2 signaling pathway is in melatonin’s antiproliferative effect on human MG-63 osteosarcoma cells. Cell. Physiol. Biochem. 39: 2297–2307. [DOI] [PubMed] [Google Scholar]
- 44.Karbowska J., and Kochan Z.. 2012. Fat-reducing effects of dehydroepiandrosterone involve upregulation of ATGL and HSL expression, and stimulation of lipolysis in adipose tissue. Steroids. 77: 1359–1365. [DOI] [PubMed] [Google Scholar]
- 45.Sztalyrd C., Xu G. H., Dorward H., Tansey J. T., Contreras J. A., Kimmel A. R., and Londos C.. 2003. Perilipin A is essential for the translocation of hormone-sensitive lipase during lipolytic activation. J. Cell Biol. 161: 1093–1103. [Erratum. 2003. J. Cell Biol. 162: 353.] [DOI] [PMC free article] [PubMed] [Google Scholar]
- 46.Yeaman S. J. 2004. Hormone-sensitive lipase–new roles for an old enzyme. Biochem. J. 379: 11–22. [DOI] [PMC free article] [PubMed] [Google Scholar]
- 47.Kunau W. H., Dommes V., and Schulz H.. 1995. beta-Oxidation of fatty acids in mitochondria, peroxisomes, and bacteria: A century of continued progress. Prog. Lipid Res. 34: 267–342. [DOI] [PubMed] [Google Scholar]
- 48.Bargut T. C. L., Souza-Mello V., Aguila M. B., and Mandarim-de-Lacerda C. A.. 2017. Browning of white adipose tissue: lessons from experimental models. Horm. Mol. Biol. Clin. Investig. 31: doi:10.1515/hmbci-2016-0051. [DOI] [PubMed] [Google Scholar]
- 49.Liang H., and Ward W. F.. 2006. PGC-1 alpha: a key regulator of energy metabolism. Adv. Physiol. Educ. 30: 145–151. [DOI] [PubMed] [Google Scholar]
- 50.Huang C., Chen D., Xie Q., Yang Y., and Shen W.. 2013. Nebivolol stimulates mitochondrial biogenesis in 3T3–L1 adipocytes. Biochem. Biophys. Res. Commun. 438: 211–217. [DOI] [PubMed] [Google Scholar]


