

Summary
Evidence indicates that screen advertising for unhealthy food results in significant increases in dietary intake among children. This review was undertaken with the main aim of estimating the quantitative effect of screen advertising in experimental and nonexperimental conditions on children's dietary intake.
Systematic searches were undertaken of interdisciplinary databases. Studies from 1980 to April 2018, all geography and languages, were included; participants were children and adolescents aged between 2 and 18 years; the intervention was screen advertising; and the outcome was dietary intake. Meta‐analyses were conducted for measured and nonmeasured outcomes.
Food advertising was found to increase dietary intake among children (age range 2‐14, mean 8.8 years) in experimental conditions for television (TV) advertising and advergames. Meta‐analysis revealed that children exposed to food advertising on TV (11 studies) and advergames (five studies) respectively consumed an average 60.0 kcal (95% confidence interval [CI], 3.1‐116.9) and 53.2 kcal (95% CI, 31.5‐74.9) more than children exposed to nonfood advertising. There was also an effect by body mass index (BMI). Findings from nonexperimental studies revealed that exposure to TV food advertising was positively associated with and predictive of dietary intake in children.
Short‐term exposure to unhealthy food advertising on TV and advergames increases immediate calorie consumption in children.
Keywords: child and adolescent health, food advertising, obesity, policy
1. INTRODUCTION
There is a substantial burden of illness and disease resulting from poor diet, which is estimated to account for 40.0% of noncommunicable diseases across Europe.1 Rates of childhood obesity have been rapidly increasing, and in 2016, there were an estimated 340 million children aged 5 to 19 in the world living with overweight or obesity.2 Food and drink marketing is a vast global industry, and evidence indicates disproportionate marketing of products with high sugar, fat, and salt content.3 Children are exposed to a high volume of marketing and advertising, a substantial proportion of which is for unhealthy foods.4
Television (TV) viewing among children has been found to predict obesity even when levels of physical activity are controlled for,5 which suggests it is not just the effect of a sedentary lifestyle that increases the risk factors for weight gain. Research has shown that exposure to unhealthy food advertising, at least under experimental conditions, results in significant increases in food consumption, particularly energy‐dense, low‐nutrient foods, and that increases are greatest among children with obesity.6, 7, 8, 9
This review sought to establish the effect size of screen advertising on children and adolescents' dietary intake, body mass index (BMI), or body composition by systemically reviewing the evidence in the available literature. We aimed to extend previous work by including data sources from business and economics databases and including nonexperimental studies. Meta‐analyses were conducted, primarily on experimental studies between exposure to unhealthy food and nonfood advertising, where outcomes for dietary intake were provided in kcals or a convertible alternative.
2. METHODOLOGY
We conducted a high‐quality systematic review, adopting a rapid review methodology in collaboration with the Evidence for Policy and Practice Information Centre (EPPI‐Centre) at the Social Science Research Unit of the UCL Institute of Education. EPPI‐Reviewer 4 software was used to manage data and the review process, which facilitated a machine learning approach and has the potential to substantially reduce screening time.10 This study was registered with PROSPERO (registration number CRD42018089228), and systematic review and meta‐analyses were conducted and reported according to the PRISMA checklist.11
The practice and use of rapid systematic reviews are increasing because of limitations in terms of size and practicality of full reviews.12 Some suggested methodological modifications include highly specific research questions, use of search tools/software, and use of only one reviewer.13 While some studies suggest rapid reviews do not apply the same rigour as full systematic reviews,14 rapid reviews are generally accepted to be useful and valid,15 and that, despite measures to save time, compared with full reviews, incur no discernible impacts on derived conclusions.13
2.1. Eligibility criteria, information sources, and search strategy
Quantitative studies (experimental or nonexperimental “real world”) were eligible for inclusion; population criteria were children and adolescents (aged between 2 and 18 years); all geography, languages, and studies between 1980 and April 2018 were included; intervention criteria were screen advertising (including TV, cinema, and internet/advergames); and outcomes were dietary intake, BMI, and body composition. Studies before 1980 were excluded as they were likely to have limited relevance to the current relationship between advertising exposure and obesity‐related behaviours. Published reports and dissertations were not eligible as the peer review status of these publications is unclear.
In January 2018 and April 2018, systematic searches were undertaken of the following medicine, psychology, science, business, and economics electronic databases: PubMed/MEDLINE, Cochrane Library Web, CINAHL, SCOPUS, PsycINFO, JSTOR, Web of Science, ProQuest, Google Scholar, Emerald, EconBiz (including RePec), EconLit, Business Source Complete, and the World Advertising Research Centre (WARC). Relevant search terms were used for electronic databases, and combinations of key search words were used for Google scholar (provided as Supporting Information).
As part of the rapid review methodology, the primary reviewer (S.R.) conducted the initial searches (January 2018), imported records into reference manager software and EPPI‐Reviewer 4, and removed duplicates; a secondary reviewer (H.C.) replicated the searches at a later time to check the total records found from each data source. Reference searches were also conducted on eligible articles and relevant systematic reviews. Supplementary searches (April 2018) were conducted by the primary reviewer. Articles were imported into EPPI‐Reviewer 4 for screening, data extraction, and analysis.
2.2. Study selection
Exclusion criteria were date (pre‐1980), participant age group (adults), intervention (nonscreen forms of advertising or marketing), study type (reports, systematic reviews, or dissertations), and outcome measure (food choice, preference, pester power, food advertisement recall, etc). Articles were included if all other criteria were met and if studies gave a quantitative measure or estimate of the outcome variable (dietary intake, body composition, or BMI).
Two reviewers (S.R. and R.I.) independently screened on title and/or abstract for three days; discrepancies were jointly reconciled by reviewers. Predictive algorithms built into EPPI‐Reviewer 4 software learned and applied reviewer decisions; the resulting model was applied to unscreened records throughout screening. Articles were intermittently refreshed to allow machine learning to prioritise unscreened items based on relevance denoted from include/exclude codes. After the allocated screening period, a model classifier was built within the software using include codes distinguished from exclude codes and applied to all unscreened items. Scores based on relevance (0‐100) were generated for all unscreened articles.
Articles were retrieved via web and library services and via direct contact with authors; a total of seven papers could not be found and were excluded. Full‐text screening was conducted by the primary reviewer only. Two papers were translated into English.
Experimental studies with measured outcomes were deemed suitable for meta‐analysis if dietary intake in kcals was reported as an outcome (or kJ/g where conversion was possible), and groups of children exposed to food screen adverts (various low‐nutrient/unhealthy foods or soft drinks) were compared with nonfood/neutral screen adverts (eg, toys). Nonexperimental/real‐world studies were deemed suitable for meta‐analyses if a quantitative relationship between food screen advert exposure and dietary intake was explored.
2.3. Data extraction and items
Data were extracted by the primary reviewer (S.R.) using customised EPPI‐Reviewer 4 extraction tools; data extraction was later replicated (H.C.). Meta‐analyses were conducted using R software EPPI‐Reviewer 4 and with STATA v15 for presentation purposes.16 Corresponding authors were contacted where additional data were required; nine authors were contacted for additional information, of which eight responded and provided data.
Data extracted included study identification (authors, country, and year of publication), target group (children and/or adolescents), sample description (sample size, participants mean age and range), study description (design), process evaluation (number of participants recruited to study conditions, how participants were allocated to groups), risk of bias within study, intervention data (TV or advergame), outcome type (measured or estimated dietary intake, BMI, or body composition), comparison type (food advertising vs nonfood advertising), and measures for dietary intake (kcal, kJ, grams, proportion consumed, correlation coefficient, regression coefficient).
2.4. Assessment of quality
Experimental studies were required to have a nonfood advert control group; studies that used neutral TV (no adverts) or no TV as control conditions were not included, or subgroups were omitted from analyses. Within study, quality was generally assessed, but direct comparisons could not be drawn because study designs varied. Allocation method of participants was recorded for all between‐subject studies. General assessments of quality were undertaken between studies; however, rigorous appraisal was not possible owing to the variety of research objectives between studies. While data may have been appropriate for meta‐analysis, the primary focus of the study may not have been in relation to the effect of food advert exposure on dietary intake.
Risk of bias at study level for experimental papers was assessed by the primary reviewer using Cochrane methods.17 Sources of bias were assessed in terms of selection bias, performance bias, attrition bias, reporting bias, and other sources of bias, including study design. To detect publication bias, the regression test of Egger et al18 for funnel plot asymmetry was used with trim and fill method.19 Both tests were run using R software within EPPI‐Reviewer 4.
2.5. Measures and data synthesis
2.5.1. Experimental studies
To be included in meta‐analyses, studies were required to compare the effect of food screen advert exposure with nonfood screen advert exposure, as measured by mean difference (kcals or convertible outcome) with 95% confidence intervals (CIs). Heterogeneity was determined using the I 2 statistic. Owing to study design and measure inconsistency, the DerSimonian‐Laird random‐effects model was used for meta‐analysis for experimental studies. Separate meta‐analyses were conducted for TV and advergame interventions. Within‐ and between‐subject studies were combined, and sensitivity analyses were conducted to assess the impact on overall effect size.
For the main analyses and where possible, groups were combined to give an overall comparison for each study; age, sex, BMI groups, and groups by child characteristics (eg, level of inhibition) were combined. Data from substudies were not included where interventions/preloads were administered (eg, “protective messages”/glucose drinks). Outcome food groups were also combined to give total dietary intake. Within‐ and between‐subject studies were also combined in meta‐analyses. Where required and appropriate, the Satterthwaite approximation was used to combine standard error values for two groups. Studies with more than two relevant groups were included as separate data points (two studies).
Screen advertisements were considered to be a consistent intervention. All adverts were for low‐nutrient/energy‐dense products; however, brands and products advertised varied, as did the advert break and total advert duration. Data for a “light” food (low energy) advert condition were excluded;20 data for branded and unbranded food adverts were combined; data from a control condition where a celebrity endorser was shown in a nonfood context were excluded;7 and data for healthy food adverts were excluded.21 Data from healthy food adverts and no advergame control data were excluded;22, 23 data for advergames with food adverts/nonfood adverts with a protective message intervention were excluded.24 Data for combined media (the effect of TV adverts with advergame) were excluded since the effect was inconsistent for TV or advergame analyses.25
In terms of the outcome, total intake of food groups were combined in analyses to give an overall measure of dietary intake. All studies appropriate for meta‐analysis (n = 16) provided one or more unhealthy food product for participants to consume ad libitum. Five studies also provided healthy food products, including fruit22, 23 or fruit and wholegrain snacks;8, 9, 26 intake of such products was included in the analyses as the outcome was considered at a caloric rather than a nutrient level. Branded and nonbranded food groups were combined.27 Studies were conducted with various levels of participant satiety; all such data were pooled providing conditions were consistent within studies.
In terms of participants, where overall totals were not reported, groups were combined where it was reasonable to do so in order to give overall effect sizes for each study. Sex groups were combined,28 BMI groups were combined,25 perceived high‐ and low‐maternal encouragement groups were combined,20 and high‐ and low‐inhibition groups were combined. Where it was not reasonable or statistically possible to combine groups, subgroups within studies were included as separate data points.24, 28, 29
2.5.2. Nonexperimental studies
Secondary meta‐analysis for nonexperimental studies was conducted for correlation coefficients for food advert exposure and nonmeasured outcomes of dietary intake. Intake of low‐nutrient high‐calorie foods was pooled, including self‐reported measures or estimates of energy‐dense food products,30, 31 unhealthy advertised foods,32 fast food and soft drink consumption,33 and unhealthy snacks.34 There were insufficient data and lack of homogeneity for meta‐analyses to be conducted for regression coefficients.
2.6. Additional analyses
The association between the effect size of dietary intake following TV advert exposure and the exposure duration was plotted and tested using Spearman's rank correlation coefficient. Exposure time was not calculated for advergames as, in many studies, the playing time was specified, but the playing speed varied between participants; therefore, children would not have been exposed to the same amount of food cues over the given time. Also, food cues were not always embedded into the game (peripheral to the child's attention); therefore, an exposure duration/effect size relationship was not explored. Subgroup analyses of experimental data were undertaken to analyse the impact of TV food advert exposure on dietary intake by BMI. Children with overweight/obesity were grouped and compared with children with healthy weight; significance was tested using chi‐square test. Data were analysed using R software within EPPI‐Reviewer 4 and STATA v15.
3. RESULTS
3.1. Study selection
Figure 1 shows the flow chart of the review process. Searches yielded a total of 5545 articles (5378 from initial searches and 167 from supplementary searches in April 2018); 379 articles were included for full‐text screening of a total of 1460 articles manually screened; 3703 were excluded by the machine learnt predictive algorithm. Application of the classifier provided articles with scores ranging from 1 to 72 which were sorted descending and screened; three articles were included as a result of this process (study scores were 72, 67, and 61), and all studies with scores of 60 and below were excluded. A total of 382 articles were screened on full text; 25 articles were included with measured outcomes for dietary intake (11 studies suitable for meta‐analysis for TV advertising and five studies suitable for meta‐analysis for advergames); and 14 articles were included with nonmeasured (ie, estimated or self/parent‐reported) outcomes for dietary intake (five studies were suitable for correlation meta‐analysis and five for regression meta‐analysis; however, the required data for meta‐analysis of regression coefficients could not be retrieved).
Figure 1.

Flow chart of searches, screening, and study inclusion process
3.2. Study description and results
A summary of experimental and nonexperimental study information is provided in Tables 1 and 2.
Table 1.
Summary of experimental studies with measured outcomes
| Author, Country | Participants | Design | Advertising Intervention | Comparison | Outcome | Relevant Results | Risk of Bias |
|---|---|---|---|---|---|---|---|
| Anderson et al28 Canada |
N = 50 Age range = 9‐14 Mean age = not stated |
Experimental (laboratory), within subject, random assignment, four sessions 1 week between each | 30‐minute cartoon with 4 × 2‐minute unhealthy food adverts | 4 × 2 minute nonfood adverts | Post‐intervention, ad libitum consumption of pizza (kcal), 30 minutes | TV food adverts significantly increased intake of food for girls with overweight/obesity only | Low |
| Anschutz et al36 Netherlands |
N = 120 Age range = 8‐12 Mean age = 9.8 |
Experimental (school), between subject, random assignment | 20‐minute nature film with three food adverts +2 nonfood adverts | Five nonfood adverts | During‐intervention, ad libitum consumption of peanut M&Ms (grams), 20 minutes | TV food adverts significantly increased intake of food in boys | Low |
| Anschutz et al20 Netherlands |
N = 121 Age range = 8‐12 Mean age = 10.4 |
Experimental (school), between subject, random assignment | 20‐minute nature film with four food adverts +1 nonfood advert (total 5 minutes) |
Five nonfood adverts (total 5 minute), Four “light” calorie food +1 nonfood advert (total 5 minutes) |
During‐intervention, ad libitum consumption of chocolate coated peanut (grams), 20 minutes | TV food adverts had no significant main effect on intake of food | Low |
| Boyland et al27 United Kingdom |
N = 181 Age range = 8‐11 Mean age = 10.0 |
Experimental (school), between subject, random assignment | 20‐minute cartoon with 45 seconds branded food advert or savoury food advert | 45‐second celebrity endorser in nonfood context, 45 second nonfood advert | Post‐intervention, ad libitum consumption of potato crisps, labelled branded and non‐branded (grams) | TV food adverts significantly increased intake of branded food only | Low |
| Dawson et al37 United States |
N = 80 Age range = not stated Mean age = 6.2 |
Experimental (research trailer), between subject, random assignment | 2 × 30‐second adverts low‐nutrition food | 2 × 30‐second adverts for pronutrition food, or nonfood advert | Post‐intervention, stimulus food which children were forbidden to eat, 20 minutes | TV food adverts had no significant effect on intake of food | High |
| Dovey et al21 United Kingdom |
N = 120 Age range = 5‐7 Mean age = 6.0 |
Experimental (school), within subject, two sessions 1‐month washout | 14‐minute cartoon with five unhealthy food adverts (total 2 minutes) | Four nonfood adverts, three healthy food adverts (total 2 minutes) | Post‐intervention, ad libitum consumption of crackers, jelly sweets, chocolate, crisps, grapes and carrots (kcal), 15 minutes | TV food adverts significantly increased intake of food | Low |
| Emond et al38 United States |
N = 60 Age range = 2‐5 Mean age = 4.1 |
Experimental (behavioural laboratory), between subject, random assignment | 14‐minute children's TV show with nine food adverts (total 3 minutes) | Six nonfood adverts (total 3 minutes) | During‐intervention, ad libitum consumption of crackers and corn snacks (kcal), 14 minutes | TV food adverts significantly increased intake of food | Low |
| Folkvord et al22 Netherlands |
N = 270 Age range = 8‐10 Mean age = 8.9 |
Experimental (school), between subject, random assignment | 5‐minute advergame with food cues | Advergame with nonfood cues, healthy food cues, no game control | Post‐intervention, ad libitum consumption of jelly candy, chocolate, bananas and apples (kcal), 5 minutes | Advergames with food adverts significantly increased intake of food | Low |
| Folkvord et al29 Netherlands |
N = 261 Age range = 7‐10 Mean age = 7.8 |
Experimental (school), between subject, random assignment | 5‐minute advergame with food cues | Advergame with nonfood cues | During‐intervention, ad libitum consumption of jelly candy and chocolate (kcal), 6 minutes | Advergames with food adverts significantly increased intake of food | Low |
| Folkvord et al39 Netherlands |
N = 92 Age range = 8‐9 Mean age = 8.4 |
Experimental (school), between subject, random assignment | 5‐minute advergame with food cues | Advergame with nonfood cues | Post‐intervention, ad libitum consumption of jelly candy and chocolate (kcal), 5 minutes | Advergames with food adverts significantly increased intake of food | Low |
| Folkvord et al23 Netherlands |
N = 218 Age range = 7‐10 Mean age = 8.9 |
Experimental (school), between subject, random assignment | Advergame with food cues | Advergame with non‐food cues, healthy food cues, no game control | Post‐intervention, ad libitum consumption of jelly candy, chocolate, bananas and apples (kcal), 5 minutes | Intake of energy‐dense snacks after playing advergames with food adverts was not associated with BMI two years later | Low |
| Folkvord et al24 Netherlands and Spain |
N = 597 Age range = 6‐12 Mean age = 8.9 |
Experimental (school), between subject, random assignment | 5‐minute advergame with food cues | Advergame with food cues with protective message, advergame with non‐food cues with, and without protective message | During‐intervention, ad libitum consumption of jelly candy and chocolate (kcal), 5 minutes | Advergames with food adverts significantly increased intake of food in both the Netherlands and Spain | Low |
| Gilbert‐Diamond et al40 United States |
N = 200 Age range = 9‐10 Mean age = 9.9 |
Experimental (laboratory), between subject, random assignment | 34 minute TV show with 7.7 minute of food adverts, 3.1 minutes of neutral adverts | TV with 7.7‐minute toy advertising and 3.1‐minute neutral adverts | During‐intervention, ad libitum consumption of 4 snack foods, 34 minutes | TV food adverts significantly increased intake of advertised foods | Low |
| Gorn and Goldberg41 Canada |
N = 151 Age range = 8‐10 Mean age = not stated |
Experimental (community setting), between subject, random assignment | Cartoon with various number (1‐6) of 30‐second food (ice cream) adverts | TV without advertising | Post‐intervention, selection and consumption of ice cream, 15 minutes | Consumption behaviour was not reported to vary greatly between the conditions | High |
| Gregori et al42 Mexico |
N = 120 Age range = 3‐6 and 7‐10 Mean age = not stated |
Experimental (schools), between subject, random assignment | 22‐minute cartoon with one, two, or three adverts (duration not specified) | TV without advertising and no TV. | During‐intervention, ad libitum consumption of commonly commercialised chocolate product | There was no significant differences between advertising conditions and intake of food | High |
| Halford et al8 United Kingdom |
N = 93 Age range = 5‐7 Mean age = 6.3 |
Experimental (school), within subject, random assignment, two sessions 2‐week washout | 10‐minute cartoon with a 10 food‐related adverts | 10 nonfood‐related adverts | Post‐intervention, ad libitum consumption of jelly sweets, snack‐a‐jacks, crisps, chocolate and grapes (kcal), no time constraint | TV food adverts significantly increased total intake of food | Low |
| Halford et al9 United Kingdom |
N = 59 Age range = 9‐11 Mean age = 10.2 |
Experimental (school), within subject, random assignment, two sessions 2‐week washout | 10‐minute cartoon with a 10 food‐related adverts (5 minutes total) | 10 nonfood‐related adverts (5 minutes) | Post‐intervention, ad libitum consumption of jelly sweets, snack‐a‐jacks, crisps, chocolate and grapes (grams), no time constraint | TV food adverts significantly increased total intake of food | Low |
| Halford et al26 United Kingdom |
N = 42 Age range = 9‐11 Mean age = 10.4 |
Experimental (school), within subject, random assignment, two sessions 2‐week washout | A cartoon containing various food adverts | Nonfood adverts | Post‐intervention, ad libitum consumption of a selection of foods (low‐fat savoury, low‐fat sweet, high‐fat sweet and high‐fat savoury; grams), no time constraint | TV food adverts increased intake of all food types except low‐fat savoury | Low |
| Harris et al43 United States |
N = 118 Age range = 7‐11 Mean age = 8.8 |
Experimental (school or camp), between subject, random assignment | 14‐minute cartoon with 4 × 30‐second food adverts | 4 × 30‐second nonfood adverts | During‐intervention, ad libitum consumption of “goldfish” crackers (grams), 14 minutes | TV food adverts significantly increased intake of food | Low |
| Jeffrey et al44 United States |
N = 47 Age range = 4‐5 Mean age = not stated |
Experimental (laboratory), unclear assignment | 12 minutes with six adverts for low nutrition foods | Six high‐nutrition foods or six nonfood adverts | Post‐intervention, ad libitum consumption from 12 different foods (grams converted to kcal) | Low nutrition adverts increased intake of low nutrition foods | High |
| Lorenzoni et al45 Georgia |
N = 60 Age range = 3‐11 Mean age = 6.0 |
Experimental (school), between subject, random assignment | 22 minutes of cartoon with one, two, or three adverts | No TV, TV with no adverts | During‐intervention, ad libitum consumption of a chocolate‐based snack (kcal), 22 minutes | There was no significant difference in intake of food between the advert conditions | High |
| Norman et al25 Australia |
N = 160 Age range = 7‐12 Mean age = 9.3 |
Experimental (holiday camp), within subject, random assignment | Cartoon with food adverts (10 × 30‐second) and 5‐minute advergame | Nonfood adverts/advergames |
Post‐intervention, ad libitum consumption of high‐fat savoury, low fat savoury, high fat sweet, Low fat sweet foods, fruit and vegetables (kJ), 15 minutes |
Multiple‐media advertising (TV and advergame) increased intake of food to a greater extent than either medium alone | Low |
| Norman et al46 Australia |
N = 160 Age range = 7‐12 Mean age = 9.3 |
Experimental (holiday camp), within subject, random assignment | 6 × 10‐minute cartoon with food adverts (10 × 30‐second) and 5‐minute advergame | Nonfood adverts/advergames | Post‐intervention, ad libitum consumption of high‐fat savoury, low fat savoury, high fat sweet, low fat sweet foods, fruit and vegetables (kJ), 15 minutes |
TV food adverts significantly increased intake of food in all children in the multiple media condition; an increased effect was reported Among children whose parents reported pressuring children to eat |
Low |
| Putnam et al47 United States |
N = −132 Age range = 4‐5 Mean age = 4.8 |
Experimental (childcare facility), between subject, random assignment | Advergame with food adverts | Advergame with nonfood adverts | Post‐intervention, selection and consumption of healthy or unhealthy snacks, no time constraint but limited food items | There were no significant differences in intake of food by advert condition | Low |
| Warren et al35 United States |
N = 91 Age range = U.S. high school grades 11 and 12 Mean age = not stated |
Experimental (school), between subject, random assignment | 39‐minute “sad” movie with four diet food adverts (90 seconds total) | Four nonfood adverts (90 seconds total) | During‐intervention, ad libitum consumption of peanut M&Ms, 39 minutes | Diet food adverts increased dietary intake among high restraint participants | High |
Table 2.
Summary of nonexperimental studies with nonmeasured outcomes
| Author, Country | Participants | Design | Advertising Intervention | Outcome | Main Results | Risk of Bias |
|---|---|---|---|---|---|---|
| Andreyeva et al48 United States |
N = 9760 Age range = 5‐14 Mean age = 11.2 |
Early Childhood Longitudinal Survey–Kindergarten Cohort (ECLS‐K), the Nielsen Company data |
Television advertising of cereals, fast food restaurants and soft drinks | Soft drink consumption | Exposure to incremental TV adverts for sugar‐sweetened carbonated soft drinks was associated with a rise in children's consumption of soft drinks | Low |
| Bolton49 United States |
N = 262 Age range = 2‐11 Mean age = not stated |
Cross‐sectional household survey supplying demographic data, 16‐day television diary, 7‐day food diary, and attitudinal measures | Television advertising exposure calculated from self‐report television viewing figures and television station broadcast data | Snacking frequency, caloric intake, nutrient efficiency, nutrient balance | Effects of television food advertising were found but the impact was small in comparison with that of other factors | High |
| Bora et al50 South Korea |
N = 2419 Age range = 11‐13 Mean age = not stated |
Cross‐sectional self‐report questionnaire with height, weight, television viewing times, food preferences and food intake; television network food advertising data | Television food advertisements, energy‐dense and nonenergy‐dense food categories | Overweight/obesity |
Energy‐dense food advertising may be associated with an increased risk of obesity And energy‐dense food preference and intake |
Low |
| Buijzen31 Netherlands |
N = 234 (parents) Age range = 4‐12 Mean age = 7.8 |
Cross‐sectional household diary‐survey, self‐report TV viewing preferences, parental communication measures, food diary | Television advertising exposure calculated from broadcast data | Consumption of advertised energy‐dense food products | Parental restrictions of advertising exposure are effective in countering the impact of food advertising among younger children | Low |
| Buijzen et al30 Netherlands |
N = 234 Age range = 4‐12 Mean age = 7.9 |
Cross‐sectional household diary‐survey, self‐report TV viewing preferences, food diary | Television advertising exposure calculated from broadcast data | Consumption of advertised brands, consumption of energy‐dense products, consumption overall | Advertising exposure was related to overall food consumption in lower income families | Low |
| Chou et al51 United States |
N = 6034 and 7069 Age range = 3‐18 Mean age = not stated |
Longitudinal survey data, BMI | Fast‐food restaurant TV advertising, data from competitive media reporting | BMI | An advertising ban for unhealthy foods would reduce the number of children with overweight by an estimated 18% for 3‐11 seconds and 14% for 12‐18 seconds | Low |
| Díaz‐Ramírez et al32 Mexico |
N = 365 (mothers) Age range = 8‐5 m Mean age = not stated |
Interview and questionnaire parent self‐report measures for food frequency consumption | Exposure to mainstream TV programming and associated advertising | Food frequency consumption of advertised foods | Advertising frequency was significantly positively associated with consumption of advertised foods | High |
| Giese et al33 Finland, Germany, Romania |
N = 825, 1055, and 971 Age range = 8‐21 (n = 13 were 18+) Mean age = 12.8, 12.7, and 14.2 |
Cross‐national survey, self‐report questionnaire, weekly food intake, height and weight, self‐control and social affluence | Self‐report exposure to TV adverts for healthy and unhealthy foods | Healthy and unhealthy food consumption | Advertisements exposure was associated with higher intake of fast foods, snacks and soft drinks | Low |
| Hennessy et al52 United States |
N = 371 Age range = 3‐16 Mean age = 9.4 |
Cross‐sectional representative telephone survey, sugar‐sweetened beverage consumption | Exposure to TV adverts sugar‐sweetened beverage | Sugar‐sweetened beverage intake | Exposure to sugar‐sweetened beverages in adults was associated with sugar‐sweetened beverage intake in children | Low |
| Klepp et al53 EU |
N = 13 305 Age range = 8.8‐13.8 Mean age = 11.4 |
Cross‐sectional self‐report questionnaire, fruit and vegetable intake, attitudes towards and liking of fruits and vegetables, exposure to TV viewing | Self‐report questionnaire exposure to TV commercials | Healthy food consumption | Healthy food advertisements were associated with higher intake of fruits and vegetables | Low |
| Lwin et al54 Indonesia |
N = 394 Age range = 8‐10 Mean age = 9.4 |
Guided in‐class survey (children), paper questionnaire (mothers), self‐report measures for fast food consumption and parental mediation | Advertising exposure estimated from self‐report TV, online/phone games, print media, and social media time | Fast food consumption | Fast food consumption was positively associated with exposure to TV advertising among metropolitan children, and with online advertising among suburban children | Low |
| Mi‐Hsiu and Chien‐Hung34 China |
N = 1043 Age range = 9‐12 Mean age = 10.1 |
Cross‐sectional, self‐report questionnaire for food frequency and preference | Self‐report questionnaire advertising exposure. | Unhealthy snack consumption | Advert exposure was associated with unhealthy snack preference and consumption | Unknown |
| Scully et al55 Australia |
N = 12 188 Age range = 12‐17 Mean age = not stated |
Web‐based, cross‐sectional, self‐report questionnaire eating behaviour, food choices, commercial TV viewing, print and other marketing sources | Self‐report exposure to digital food marketing | Unhealthy food intake frequency (fast food, sugary drinks, sweet snacks, salty snacks) | Cumulative food advertising exposure was positively associated with adolescent food choices and intake | Low |
| Veerman et al56 United States |
N = not stated Age range = 6‐12 Mean age = not stated |
Secondary data sources, including body measurements from National Health and Nutrition Examination Survey |
Literature relating to advertising exposure | BMI and food consumption | Model estimates that reducing advertising exposure to zero would decrease the prevalence of obesity for boys and girls by 2.6% and 2.4% | Low |
3.3. Experimental studies
3.3.1. Participants
Across all studies, participants were aged 2 to 14 years, with the exception of one study35 (adolescent females aged 16‐18). For TV meta‐analyses, the age range for the 11 included studies was 2 to 14 years (seven studies reported age ranges of between 7 and 12), the mean age was 9.2 years. For advergame meta‐analysis, the age range for the five included studies was 6 to 12 years and the mean age was 8.7 years.
3.3.2. Interventions
TV food adverts were embedded in cartoons (n = 12), nature shows (n = 2), children's TV shows (n = 2), and a movie (n = 1); three studies did not state the programme used. Total TV time ranged from 10 to 39 minutes, the mean time was 20.1 minutes. For studies included in meta‐analysis, where stated (n = 8), advert duration ranged from 45 seconds to 8 minutes, the mean advert duration was 4.4 minutes. Screen food advert interventions were for low‐nutrient, high‐energy foods, including fast food products, savoury/potato snacks, cheese, sweets/candies/chocolate, cookies/muffins, ice cream/desserts, breakfast cereals, or high sugar drinks. Specifically, branded food products were used in adverts if integral to the research objectives for the particular study.27
3.3.3. Outcomes
Food items for ad libitum consumption varied between experimental studies; 13 studies offered only low‐nutrient, high‐energy foods (five peanut M&Ms or chocolate, three candy and chocolate, three potato/corn/wheat snacks, one pizza, one ice cream), nine studies offered a selection of healthy and unhealthy snacks,21 and three studies did not specify but reported a selection of foods. Ad libitum consumption of food was during the intervention in 10 studies and after the intervention in 15 studies. Where consumption took place during the intervention, duration of snacking ranged between six and 39 minutes (mean 21.1 minutes); two studies did not state the duration of the intervention/ad libitum snacking. Where consumption took place after the intervention, duration of snacking was five minutes (n = 3), 15 minutes (n = 4), 20 minutes (n = 1), 30 minutes (n = 1), or an unlimited time (n = 4); two studies did not state the duration of ad libitum snacking.
3.3.4. Comparisons
Unhealthy food advertisements were compared with nonfood advertisements in all studies included in television meta‐analysis (n = 11), of which one study also included a comparison with an advert “light” condition.20 Advergames with integrated food cues were compared with games with nonfood cues in meta‐analysis (n = 5), of which three studies also included comparisons with healthy food cues (n = 2), no game controls (n = 2), and food and nonfood cues combined with protective messages (n = 1). Of studies not included in television or advergame meta‐analyses, three compared food adverts with healthy/pro/high‐nutrition foods, three to television with no adverts and one to a no television condition.
3.3.5. Settings
Of the experimental studies, 18 used a between‐subject design and seven used a within‐subject design; all studies allocated participants randomly, except for one study where the experimental procedure was unclear.44 Of those using within‐subject designs, number of experimental sessions varied between two and six, and washout periods ranged between one day and one month. Experimental studies were conducted in schools (n = 12), laboratories or research trailers (n = 9), holiday camps (n = 2), childcare facilities (n = 1), or community settings (n = 1). Experiments were conducted in the United States (n = 7), the Netherlands (n = 7), the United Kingdom (n = 5), Australia (n = 2), Canada (n = 2), Spain (n = 1), Georgia (n = 1), and Mexico (n = 1); one study contained separate samples in Spain and Netherlands, which were included as separate studies in meta‐analysis.24
3.4. Meta‐analysis
Meta‐analysis revealed that for television and advergames combined, food advertising, compared with nonfood advertising increased dietary intake among children/adolescents in experimental conditions (Figure 2); mean difference 57.7 kcal (P < 0.01; 95% CI, 36.61‐78.75; I 2 = 99.7). The effect size point estimate for television food advertising was 60.0 kcal (P < 0.05; 95% CI, 3.06‐116.94; I 2 = 99.76). Funnel plots showed some evidence of asymmetry and trim and fill analysis showed evidence of one missing study. Eggers regression analysis revealed low risk of publication bias (P = 0.696). The average time children were exposed to television advertising (data available in n = 8 studies) was 4.4 minutes (range 45 seconds to 8 minutes; however, there was no association between length of advert exposure and effect size (n = 9, r = 0.056, P ≥ 0.05). The effect size point estimate for advergames was 53.2 kcal (P < 0.001; 95% CI, 31.49‐74.85; I 2 = 99.71); the mean duration of advergames was five minutes, but it was not considered reasonable to calculate an exposure duration/effect size relationship. Funnel plots showed no evidence of asymmetry and trim and fill analysis showed evidence of no missing studies. Eggers regression analysis revealed low risk of publication bias (P = 0.511).
Figure 2.
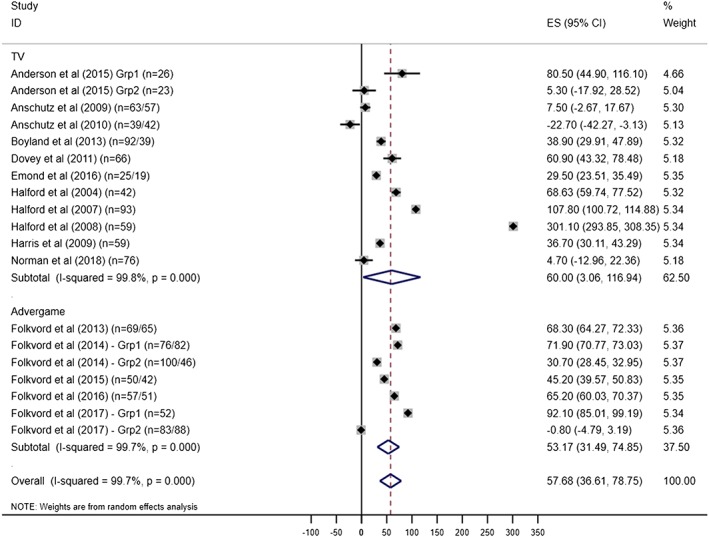
Forest plot showing mean difference (kcals) in dietary intake between television (TV) and advergame food advertising and nonfood advertising; 95% CIs and study weights are indicated. The overall effect size was generated by a random effects model [Colour figure can be viewed at wileyonlinelibrary.com]
Regression analyses were conducted to explore whether within‐ or between‐subject study design and ad libitum eating duration had a significant effect on the variability of the effect size between studies. Study design was not found to be a significant predictor and there was no significant difference in dietary intake for within‐ or between‐subject studies (P > 0.05). Eating duration period was found to be a significant predictor of effect size; studies that gave children 15 minutes or less to eat during and/or post advertising exposure reported significantly lower effect sizes (N = 19, coef = 1.50, SE = 0.69, CI, 0.04‐2.97, I 2 = 99.69, R 2 = 17.17%).
3.4.1. Effects of BMI
Planned subgroup analyses were conducted on the effect size by BMI; four studies provided appropriate data. Analyses revealed that the effect size of television food advert exposure on dietary intake was greater for children with overweight or obesity (mean difference 125.5 kcal, 95% CI, 18.80‐232.25), compared with children with healthy weight (mean difference 79.9 kcal, 95% CI, 19.89‐179.66), independent of experimental condition (Figure 3). Compared with nonfood adverts, children with overweight or obesity consumed an average 45.6 kcal more than children with healthy weight following exposure to food adverts. Subgroup analysis revealed the difference between children with healthy weight and children with overweight/obesity to be statistically significant (I 2 = 98.6%, P < 0.01).
Figure 3.
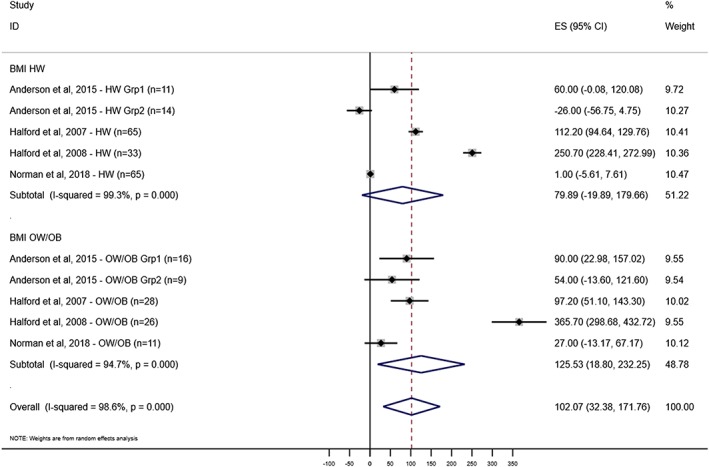
Forest plot showing mean difference (kcals) in dietary intake between television food advertising and nonfood advertising by BMI group (HW = healthy weight, OW/OB = overweight/obese); 95% CIs and study weights are indicated. The overall effect size was generated by a random effects model [Colour figure can be viewed at wileyonlinelibrary.com]
3.4.2. Other findings
The effect of advertising was reported by some studies to vary by sex; however, the nature of the effect was inconsistent with some research finding the effect size to be greater among girls,28 while others reported the effect size to be greater among boys.36 The effect size was reported to be greater for children with low neophobia compared with high,21 highly impulsive compared with less impulsive children,29 and children with a relatively higher gaze duration or “attentional bias”.39 Combined media (eg, a combination of exposure to television food advertising and advergames) was reported to have a stronger effect on children's dietary intake than television advertising alone;25 the same study reported that the increase in dietary intake following advertising exposure was not compensated for at subsequent meals. Food adverts for particular foods were reported to increase consumption of those foods,40 when given the option, children were more likely to consume low nutrient foods following television advertising,22, 37 and consumption of food type was found to vary by BMI group.8 Children were reported to quickly recognise brand names and recall the content of food advertisements41 and were found to be responsive to characters and make healthier choices if popular characters were associated with healthier products.47 Celebrity endorsers were found to be effective at increasing consumption of endorsed food, and the effect was found to extend into nonfood contexts.27 Healthy food adverts were not found to increase children's consumption of fruit or vegetables.21 Parental behaviour, such as perceived encouragement to be thin or controlling feeding practices, was reported to affect susceptibility to the effects of television advertising on dietary intake.20, 46 Two studies conducted in Georgia and Mexico found no association between television advertising and energy intake.42, 45
3.5. Nonexperimental studies
3.5.1. Participants
Across all studies, participants were aged between 8 months and 18 years; mean age where stated (11 studies) was 10.4.
3.5.2. Interventions
All studies considered the effect of television food advertising, except one study that considered exposure to digital food marketing. Intervention data were estimated from self‐reported surveys/questionnaires of television time or advert exposure (n = 9), from a combination of self‐report and secondary data (eg, advertising broadcast data; n = 2), or from secondary data sources only (eg, company/media data; n = 3).
3.5.3. Outcomes
Reported outcomes included dietary intake (n = 12), BMI, or overweight/obesity (n = 3). Of those reporting dietary intake, seven studies reported unhealthy food consumption, four studies reported healthy and unhealthy food consumption, and one study reported healthy food consumption.
3.5.4. Settings
Study settings varied, some collected primary data, using parent or child self‐report questionnaires (n = 11), others used longitudinal survey data (n = 2), one study used secondary data, and one was experimental with nonmeasured outcomes (within‐subject design with random allocation, supplemented with self‐report data).
3.5.5. Meta‐analysis—nonexperimental findings
Secondary meta‐analysis was conducted for the nonexperimental studies reporting an association between television food advert exposure and dietary intake (n = 5); there was a significant positive association where the pooled mean correlation coefficient was r = 0.30 (95% CI, 0.16‐0.45).
3.5.6. Other findings
Various studies found television food advertising to be associated with dietary intake32, 33, 34, 48, 50, 54 but not necessarily body weight.48 In one study, the association between advertising exposure and dietary intake was only found for lower income families.30 Consistent with experimental findings, cumulative media, including television and other sources, was positively linked to adolescent food intake.55 Various studies also found television food or soft drink advertising exposure to be a significant positive predictor of dietary intake in children after controlling for other factors.30, 33, 34, 48 Contrary to experimental findings, two studies reported exposure to healthy food adverts was associated with fruit and vegetable consumption;33, 53 the latter study also reported self‐control to be independently associated with dietary intake. Two studies reported parental mediation, relating to guidance of food consumption or explaining the purpose of advertising could be effective in mediating the influence of television food advertising and associated dietary intake.31, 54
4. DISCUSSION
In this rapid systematic review utilising machine learning including 25 experimental studies and 14 studies with nonmeasured outcomes, we found that food advertising increased dietary intake in children under experimental conditions when compared with exposure to nonfood advertising. Exposure to 4.4 minutes of food advertising would on average increase a child's food consumption by 60.0 kcal, whilst playing an advergame with food cues for 5 minutes would increase consumption by 53.4 kcal on average. The similarity of the estimate across both subcategories suggests that this estimate is meaningful, despite high heterogeneity which is likely to have arisen from the variation in study designs, setting, total intervention time, and period allowed for food intake. We were unable to identify a “dose” relationship between unit of advertising exposure and resulting excess calorie consumption. However, we note that advertising exposure in countries such as the United Kingdom is in excess of the experimental exposures in our included studies; commercial television in the United Kingdom currently shows up to 12 minutes of advertising per hour57 and median television‐watching during weekdays for U.K. children aged 7 to 15 years is 2 to 3 hours per day. Concerningly, children with overweight or obesity appeared to be more vulnerable to the influence of advertising, consuming an average of 45.6 kcal more than children with healthy weight when exposed to food advertising.
The point estimates for the effect size of television compared with advergame advertising were highly similar, suggesting similar effects, despite television watching being passive and with interspersed advertising whilst playing advergames is active with advertising embedded throughout. Findings from the experimental studies relate to the immediate effects of acute advertising, whereas children in ‘normal life’ are exposed to various media in combination and over longer periods of time. However, findings from the nonexperimental studies similarly showed that exposure to television food advertising was predictive of greater calorie intake in children.
4.1. Comparison with the literature
Our review is consistent with a previous review by Boyland et al;7 however, findings in that meta‐analysis were presented as standardised mean difference, and this review included data from a number of additional studies. A broader review that included any form of marketing by Sadeghirad et al58 found that 3.8 minutes of food marketing was associated with an additional consumption of 30.4 kcals in children. These analyses included a range of marketing (including games, packaging, and sponsorship), and the effect size was calculated from fewer studies, six compared with 16 in this review. The current review also analysed the impact of screen advertising in “real world” studies' with nonmeasured outcomes, thereby increasing the breadth and reliability of evidence of the effect of screen advertising on dietary intake.
4.2. TV and advergames
Despite these differences, research has found no differences in the persuasive effect of adverts on television or advergames.59 There was evidence from experimental data that combined media of television and advergames induces a greater effect on dietary intake.25
4.3. Mechanisms of food advertising
The mechanisms by which advertising affects eating behaviour in children are unclear and are likely to vary by contextual and individual factors. However, recent research using functional magnetic resonance imaging (fMRI) has revealed that the ventromedial prefrontal cortices (vmPFC) in children's brains, functions of which include decision making, reward valuation and self‐control, are activated significantly more after watching television food advertisements.60 The same research reported that following food advert exposure, food decisions by children were made faster and tended to favour taste over health.60 In addition to situational factors, eating behaviour in adults and children is directed by impulsive and reflective decision making,61 and these findings suggest that food advertisements may reduce the extent to which children utilise reflective/inhibitory control systems, which are negatively associated with risky eating behaviours, and promote impulsive decision making, which is positively associated with risky eating behaviours.62, 63
4.4. Public health implications
There is a substantial burden of illness and disease resulting from childhood overweight or obesity and a clear need for policy makers to address this public health problem. There is clear evidence that acute exposure to television food advertising increases immediate dietary intake, particularly of unhealthy foods. While there is a scarcity of evidence relating to the long‐term effects of food advertising, reducing exposure both on television and via advergames is likely to improve children's food choices, reduce intake of unhealthy foods, and improve long‐term health outcomes.
4.5. Limitations
There may have been limitations in the rapid review methodology adopted for this work; potential bias was reduced by utilising independent reviewers for screening on title and abstract but machine learning was used to exclude a large number of articles without screening on title and abstract. Only one reviewer was used for full‐text screening, but stringent criteria were thought to assist in reducing potential bias. While justifiable in the context of this review, findings may also have been limited by excluding studies from before 1980 and report publications.
The number of studies included for meta‐analyses was relatively small, variability was high and effects due to error cannot be discounted. There were also small sample sizes for subgroup analyses by BMI (subgroup samples ranged from 11 to 28 for groups of children with overweight or obesity). Study heterogeneity was high and CIs were large for television advertising meta‐analysis, indicating that caution should be taken with these results overall. There was also a limitation with advergame meta‐analysis since studies were all by the same primary author.
5. CONCLUSIONS
The evidence from this research shows that television and advergame screen advertising for unhealthy foods increases immediate dietary intake in children. There appears to be an effect by BMI where dietary intake of children with overweight or obesity increased to a greater extent than children with healthy weight. Given children and adolescents' changing use of media and unknown levels of advert exposure, the longer‐term impacts of these reported effects in the real world are difficult to determine. More research on the effect of advertising duration and dose of exposure would be particularly useful, as would longitudinal work which considers the longer‐term outcomes of advertising exposure. While the extrapolation of these findings to real world population is limited, this research is likely to have notable implications for policy and practice.
CONFLICT OF INTEREST
There were no conflicts of interest for this work.
FUNDING
This report is independent research commissioned and funded by the National Institute for Health Research Policy Research Programme. The views expressed in this publication are those of the authors and not necessarily those of the NHS, the National Institute for Health Research, the Department of Health and Social Care or its arm's length bodies, and other Government Departments.
Supporting information
Data S1. Supporting Information
ACKNOWLEDGEMENTS
The authors would like to thank the UCL Institute of Education, in particular, Prof James Thomas and Jeff Brunton, for their provision and assistance with EPPI‐Reviewer 4 software.
Thanks also to Dr Rosita Ibrahim for her assistance in screening and collecting articles.
Russell SJ, Croker H, Viner RM. The effect of screen advertising on children's dietary intake: A systematic review and meta‐analysis. Obesity Reviews. 2019;20:554–568. 10.1111/obr.12812
REFERENCES
- 1. Lloyd‐Williams F, Bromley H, Orton L, et al. Smorgasbord or symphony? Assessing public health nutrition policies across 30 European countries using a novel framework. BMC Public Health. 2014;14(1):1195. [DOI] [PMC free article] [PubMed] [Google Scholar]
- 2. WHO . Taking action on childhood obesity 2018. [WWW document] URL http://apps.who.int/iris/bitstream/handle/10665/274792/WHO‐NMH‐PND‐ECHO‐18.1‐eng.pdf?ua=1
- 3. Galbraith‐Emami S, Lobstein T. The impact of initiatives to limit the advertising of food and beverage products to children: a systematic review. Obesity Reviews. 2013;12:960‐974. [DOI] [PubMed] [Google Scholar]
- 4. Linn S, Novosat CL. Calories for sale: food marketing to children in the twenty‐first century. Ann Am Acad Pol Soc Sci. 2008;615(1):133‐155. [Google Scholar]
- 5. Epstein LH, Roemmich JN, Robinson JL, et al. A randomized trial of the effects of reducing television viewing and computer use on body mass index in young children. Arch Pediatr Adolesc Med. 2008;162(3):239‐245. [DOI] [PMC free article] [PubMed] [Google Scholar]
- 6. Boyland EJ, Whalen R. Food advertising to children and its effects on diet: review of recent prevalence and impact data. Pediatr Diabetes. 2015;16(5):331‐337. [DOI] [PubMed] [Google Scholar]
- 7. Boyland EJ, Nolan S, Kelly B, et al. Advertising as a cue to consume: a systematic review and meta‐analysis of the effects of acute exposure to unhealthy food and nonalcoholic beverage advertising on intake in children and adults. Am J Clin Nutr. 2016;103(2):519‐533. [DOI] [PubMed] [Google Scholar]
- 8. Halford JC, Boyland EJ, Hughes G, Oliveira LP, Dovey TM. Beyond‐brand effect of television (TV) food advertisements/commercials on caloric intake and food choice of 5‐7‐year‐old children. Appetite. 2007;49(1):263‐267. [DOI] [PubMed] [Google Scholar]
- 9. Halford JC, Boyland EJ, Hughes G, Stacey L, McKean S, Dovey TM. Beyond‐brand effect of television food advertisements on food choice in children: the effects of weight status. Public Health Nutr. 2008;11(9):897‐904. [DOI] [PubMed] [Google Scholar]
- 10. Hempel S, Shetty KD, Shekelle PG, et al. Research white paper: machine learning methods in systematic reviews: identifying quality improvement intervention evaluations 2012; Agency for Healthcare Research and Quality. [PubMed]
- 11. Moher D, Liberati A, Tetzlaff J, Altman DG. Preferred reporting items for systematic reviews and meta‐analyses: the PRISMA statement. Ann Intern Med. 2009;151(4):264‐269. [DOI] [PubMed] [Google Scholar]
- 12. Harker J, Kleijnen J. What is a rapid review? A methodological exploration of rapid reviews in health technology assessments. Int J Evid Based Healthc. 2012;10(4):397‐410. [DOI] [PubMed] [Google Scholar]
- 13. Haby MM, Chapman E, Clark R, Barreto J, Reveiz L, Lavis JN. What are the best methodologies for rapid reviews of the research evidence for evidence‐informed decision making in health policy and practice: a rapid review. Health Res Policy Syst. 2016;14:83 10.1186/s12961-016-0155-7 [DOI] [PMC free article] [PubMed] [Google Scholar]
- 14. Khangura S, Konnyu K, Cushman R, Grimshaw J, Moher D. Evidence summaries: the evolution of a rapid review approach. Syst Rev. 2012;1:10 10.1186/2046-4053-1-10 [DOI] [PMC free article] [PubMed] [Google Scholar]
- 15. Watt A, Cameron A, Sturm L, et al. Rapid versus full systematic reviews: validity in clinical practice? ANZ J Surg. 2008;78(11):1037‐1040. [DOI] [PubMed] [Google Scholar]
- 16. Viechtbauer W. Conducting meta‐analyses in R with the metafor package. J Stat Softw. 2010;36(3):1‐48. [Google Scholar]
- 17. Cochrane Methods . Assessing risk of bias in included studies: the Cochrane risk of bias tool. 2018. [WWW document]. URL http://methods.cochrane.org/bias/assessing‐risk‐bias‐included‐studies
- 18. Egger M, Smith GD, Schneider M, Minder C. Bias in meta‐analysis detected by a simple, graphical test. Br Med J. 1997;315(7109):629‐634. [DOI] [PMC free article] [PubMed] [Google Scholar]
- 19. Duval S, Tweedie R. Trim and fill: a simple funnel‐plot–based method of testing and adjusting for publication bias in meta‐analysis. Biometrics. 2000;56(2):455‐463. [DOI] [PubMed] [Google Scholar]
- 20. Anschutz DJ, Engels RCME, Van Strien T. Maternal encouragement to be thin moderates the effect of commercials on children's snack food intake. Appetite. 2010;55(1):117‐123. [DOI] [PubMed] [Google Scholar]
- 21. Dovey TM, Taylor L, Stow R, Boyland EJ, Halford JC. Responsiveness to healthy television (TV) food advertisements/commercials is only evident in children under the age of seven with low food neophobia. Appetite. 2011;56(2):440‐446. [DOI] [PubMed] [Google Scholar]
- 22. Folkvord F, Anschutz DJ, Buijzen M, Valkenburg PM. The effect of playing advergames that promote energy‐dense snacks or fruit on actual food intake among children. Am J Clin Nutr. 2013;97(2):239‐245. [DOI] [PubMed] [Google Scholar]
- 23. Folkvord F, Anschütz DJ, Buijzen M. The association between BMI development among young children and (un) healthy food choices in response to food advertisements: a longitudinal study. Int J Behav Nutr Phys Act. 2016;13(16):1‐7. [DOI] [PMC free article] [PubMed] [Google Scholar]
- 24. Folkvord F, Lupiáñez‐Villanueva F, Codagnone C, Bogliacino F, Veltri G, Gaskell G. Does a ‘protective’ message reduce the impact of an advergame promoting unhealthy foods to children? An experimental study in Spain and the Netherlands. Appetite. 2017;112:117‐123. [DOI] [PubMed] [Google Scholar]
- 25. Norman J, Kelly B, McMahon AT, et al. Sustained impact of energy‐dense TV and online food advertising on children's dietary intake: a within‐subject, randomised, crossover, counter‐balanced trial. Int J Behav Nutr Phys Act. 2018a;15(37):1‐11. [DOI] [PMC free article] [PubMed] [Google Scholar]
- 26. Halford JC, Gillespie J, Brown V, Pontin EE, Dovey TM. Effect of television advertisements for foods on food consumption in children. Appetite. 2004;42(2):221‐225. [DOI] [PubMed] [Google Scholar]
- 27. Boyland EJ, Harrold JA, Dovey TM, et al. Food choice and overconsumption: effect of a premium sports celebrity endorser. J Pediatr. 2013;163(2):339‐343. [DOI] [PubMed] [Google Scholar]
- 28. Anderson GH, Khodabandeh S, Patel B, Luhovyy BL, Bellissimo N, Mollard RC. Mealtime exposure to food advertisements while watching television increases food intake in overweight and obese girls but has a paradoxical effect in boys. Appl Physiol Nutr Metab. 2015;40(2):162‐167. [DOI] [PubMed] [Google Scholar]
- 29. Folkvord F, Anschütz DJ, Nederkoorn C, Westerik H, Buijzen M. Impulsivity, “advergames,” and food intake. Pediatrics. 2014;133(6):1007‐1012. [DOI] [PubMed] [Google Scholar]
- 30. Buijzen M, Schuurman J, Bomhof E. Associations between children's television advertising exposure and their food consumption patterns: a household diary‐survey study. Appetite. 2008;50(2&3):231‐239. [DOI] [PubMed] [Google Scholar]
- 31. Buijzen M. The effectiveness of parental communication in modifying the relation between food advertising and children's consumption behaviour. Br J Dev Psychol. 2009;27(1):105‐121. [DOI] [PubMed] [Google Scholar]
- 32. Díaz‐Ramírez G, Jiménez‐Cruz A, de las Cruces Souto‐Gallardos M, Bacardí‐Gascon M. Effect of the exposure to TV food advertisements on the consumption of foods by mothers and children. J Pediatr Gastroenterol Nutr. 2013;56(1):86‐88. [DOI] [PubMed] [Google Scholar]
- 33. Giese H, Konig LM, Taut D, et al. Exploring the association between television advertising of healthy and unhealthy foods, self‐control, and food intake in three European countries. Appl Psychol Health Well Being. 2015;7(1):41‐62. [DOI] [PubMed] [Google Scholar]
- 34. Mi‐Hsiu W, Chien‐Hung C. The influence of television food advertising exposure on eating‐related behaviors among elementary school children. Taiwan J Public Health. 2017;36(1):64‐76. [Google Scholar]
- 35. Warren CS, Strauss J, Taska JL, Sullivan SJ. Inspiring or dispiriting? The effect of diet commercials on snack food consumption in high school and college‐aged women. Int J Eat Disord. 2005;37(3):266‐270. [DOI] [PubMed] [Google Scholar]
- 36. Anschutz DJ, Engels RC, Van Strien T. Side effects of television food commercials on concurrent non‐advertised sweet snack food intakes in young children. Am J Clin Nutr. 2009;89(5):1328‐1333. [DOI] [PubMed] [Google Scholar]
- 37. Dawson BL, Jeffrey DB, Walsh A. Television food commercials' effect on children's resistance to temptation. J Appl Phycol. 1988;18:1353‐1360. [Google Scholar]
- 38. Emond JA, Lansigan RK, Ramanujam A, Gilbert‐Diamond D. Randomized exposure to food advertisements and eating in the absence of hunger among pre‐schoolers. Pediatrics. 2016;138(6). 10.1542/peds.2016-2361 [DOI] [PMC free article] [PubMed] [Google Scholar]
- 39. Folkvord F, Anschutz DJ, Wiers RW, Buijzen M. The role of attentional bias in the effect of food advertising on actual food intake among children. Appetite. 2015;84:251‐258. [DOI] [PubMed] [Google Scholar]
- 40. Gilbert‐Diamond D, Emond J, Lansigan RK, et al. Television food advertisement exposure and FTO rs9939609 genotype in relation to excess consumption in children. Int J Obes (Lond). 2017;41(1):23‐29. [DOI] [PMC free article] [PubMed] [Google Scholar]
- 41. Gorn GJ, Goldberg ME. Children's responses to repetitive television commercials. J Consum Res. 1980;6(4):421‐424. [Google Scholar]
- 42. Gregori D, Hochdorn A, de Hoyos R, et al. Food advertising on TV and energy intake in children: results from the OBEY‐AD Mexico. 2017. [WWW document]. URL https://www.alanrevista.org/ediciones/2017/suplemento‐1/art‐3/
- 43. Harris JL, Bargh JA, Brownell KD. Priming effects of television food advertising on eating behaviour. Health Psychol. 2009;28(4):404‐413. [DOI] [PMC free article] [PubMed] [Google Scholar]
- 44. Jeffrey D, McLellarn RW, Fox DJ. The development of children's eating habits: the role of television commercials. Health Educ Q. 1982;9(2&3):174‐189. [PubMed] [Google Scholar]
- 45. Lorenzoni G, Rtskhladze IL, Vecchio MG, et al. Effect of TV advertising on energy intake of Georgian children: results of an experimental study. Mediterr J Nutr Metab. 2017;10(3):183‐192. [Google Scholar]
- 46. Norman J, Kelly B, McMahon AT, et al. Children's self‐regulation of eating provides no defense against television and online food marketing. Appetite. 2018b;125:438‐444. [DOI] [PubMed] [Google Scholar]
- 47. Putnam MM, Cotto CE, Calvert SL. Character apps for children's snacks: effects of character awareness on snack selection and consumption patterns. Games Health J. 2018;7(2):116‐120. [DOI] [PMC free article] [PubMed] [Google Scholar]
- 48. Andreyeva T, Kelly IR, Harris JL. Exposure to food advertising on television: associations with children's fast food and soft drink consumption and obesity. Econ Hum Biol. 2011;9(3):221‐233. [DOI] [PubMed] [Google Scholar]
- 49. Bolton R. Modeling the impact of television food advertising on children's diets. J Curr Issues Res Advert. 1983;6(1):173‐199. [Google Scholar]
- 50. Bora L, Hyogyoo K, Soo‐Kyung L, Yoon J, Chung SJ. Effects of exposure to television advertising for energy‐dense/nutrient‐poor food on children's food intake and obesity in South Korea. Appetite. 2014;81:305‐311. [DOI] [PubMed] [Google Scholar]
- 51. Chou SY, Rashad I, Grossman M. Fast‐food restaurant advertising on television and its influence on childhood obesity. J Law Econ. 2008;51(4):599‐618. [Google Scholar]
- 52. Hennessy M, Bleakley A, Piotrowski JT, et al. Sugar‐sweetened beverage consumption by adult caregivers and their children: the role of drink features and advertising exposure. Health Educ Behav. 2015;42(5):677‐686. [DOI] [PubMed] [Google Scholar]
- 53. Klepp KI, Wind M, de Bourdeaudhuij I, et al. Television viewing and exposure to food‐related commercials among European school children, associations with fruit and vegetable intake: a cross sectional study. Int J Behav Nutr Phys Act. 2007;4(1):1‐46. [DOI] [PMC free article] [PubMed] [Google Scholar]
- 54. Lwin MO, Malik S, Ridwan H, Au CSS. Media exposure and parental mediation on fast‐food consumption among children in metropolitan and suburban Indonesian. Asia Pac J Clin Nutr. 2017;26(5):899‐905. [DOI] [PubMed] [Google Scholar]
- 55. Scully M, Wakefield M, Niven P, et al. Association between food marketing exposure and adolescents' food choices and eating behaviors. Appetite. 2012;58(1):1‐5. [DOI] [PubMed] [Google Scholar]
- 56. Veerman JL, Van Beeck EF, Barendregt JJ, et al. By how much would limiting TV food advertising reduce childhood obesity? Eur J Public Health. 2009;19(4):365‐369. [DOI] [PMC free article] [PubMed] [Google Scholar]
- 57. Ofcom . Children and parents: media use and attitudes report. 2017. Ofcom [WWW Document] URL https://www.ofcom.org.uk/__data/assets/pdf_file/0020/108182/children‐parents‐media‐use‐attitudes‐2017.pdf
- 58. Sadeghirad B, Duhaney T, Motaghipisheh S, Campbell NR, Johnston BC. Influence of unhealthy food and beverage marketing on children's dietary intake and preference: a systematic review and meta‐analysis of randomized trials. Obesity Reviews. 2016;17(10):945‐959. [DOI] [PubMed] [Google Scholar]
- 59. Bellman S, Kemp A, Haddad H, Varan D. The effectiveness of advergames compared to television commercials and interactive commercials featuring advergames. Comput Human Behav. 2014;32:276‐283. [Google Scholar]
- 60. Bruce AS, Pruitt SW, Ha OH, et al. The influence of televised food commercials on children's food choices: evidence from ventromedial prefrontal cortex activations. J Pediatr. 2016;177:27‐32. 10.1016/j.jpeds.2016.06.067 [DOI] [PMC free article] [PubMed] [Google Scholar]
- 61. Hofmann W, Friese M, Wiers R. Impulsive versus reflective influences on health behavior: a theoretical framework and empirical review. Health Psychol Rev. 2009;2(2):111‐137. [Google Scholar]
- 62. Chen R, Li DP, Turel O, et al. Decision making deficits in relation to food cues influence obesity: a triadic neural model of problematic eating. Front Psych. 2018;9 10.3389/fpsyt.2018.00264 [DOI] [PMC free article] [PubMed] [Google Scholar]
- 63. Waxman SE. A systematic review of impulsivity in eating disorders. Eur Eat Disord Rev. 2009;17(6):408‐425. [DOI] [PubMed] [Google Scholar]
Associated Data
This section collects any data citations, data availability statements, or supplementary materials included in this article.
Supplementary Materials
Data S1. Supporting Information