

A structure-based interactome for Arabidopsis and new community tools for accessing it and ∼2.8 million other interactions provides researchers with new opportunities for hypothesis generation.
Abstract
Determining the complete Arabidopsis (Arabidopsis thaliana) protein-protein interaction network is essential for understanding the functional organization of the proteome. Numerous small-scale studies and a couple of large-scale ones have elucidated a fraction of the estimated 300,000 binary protein-protein interactions in Arabidopsis. In this study, we provide evidence that a docking algorithm has the ability to identify real interactions using both experimentally determined and predicted protein structures. We ranked 0.91 million interactions generated by all possible pairwise combinations of 1,346 predicted structure models from an Arabidopsis predicted “structure-ome” and found a significant enrichment of real interactions for the top-ranking predicted interactions, as shown by cosubcellular enrichment analysis and yeast two-hybrid validation. Our success rate for computationally predicted, structure-based interactions was 63% of the success rate for published interactions naively tested using the yeast two-hybrid system and 2.7 times better than for randomly picked pairs of proteins. This study provides another perspective in interactome exploration and biological network reconstruction using protein structural information. We have made these interactions freely accessible through an improved Arabidopsis Interactions Viewer and have created community tools for accessing these and ∼2.8 million other protein-protein and protein-DNA interactions for hypothesis generation by researchers worldwide. The Arabidopsis Interactions Viewer is freely available at http://bar.utoronto.ca/interactions2/.
Proteins rarely work alone, and most of the time they function in concert with other proteins or macromolecules. In Arabidopsis (Arabidopsis thaliana), the total number of binary interactions is estimated to be around 300,000 (Arabidopsis Interactome Mapping Consortium, 2011), but so far, only a small fraction of those interactions have been studied. Currently, there are 36,329 experimentally confirmed and 70,944 interolog-predicted protein-protein interactions (PPIs) in the Bio-Analytic Resource (BAR) interactions database (Geisler-Lee et al., 2007) that can be queried through the Arabidopsis Interactions Viewer (AIV). This huge gap indicates there is still a long way to go in elucidating the Arabidopsis interactome, both experimentally and computationally.
With the arguable exception of the yeast two-hybrid method (Arabidopsis Interactome Mapping Consortium, 2011) or split ubiquitin method (Chen et al., 2012), traditional experimental methods for determining PPIs, such as mass spectrometry (Van Leene et al., 2007), protein microarrays (Popescu et al., 2007), and others (Zhang et al., 2010; Fukao, 2012), cannot readily be extended to determine the whole Arabidopsis interactome. Interolog-based computational PPI prediction methods (Geisler-Lee et al., 2007) can have a large-scale predictive ability but cannot be used to predict the whole Arabidopsis interactome, as they are limited to genes in Arabidopsis with homologs in other species whose gene products are known to interact (Zhang et al., 2010). Structure-based PPI determination using docking algorithms may be a solution to this problem because it is the tertiary structure that determines whether two proteins can bind to each other or not.
To predict the Arabidopsis interactome using a structure-based PPI (S-PPI) prediction method, there are two requirements: a high-throughput docking algorithm that can distinguish true interactions from noninteractors and a collection of Arabidopsis proteome-wide protein structures. Most of the docking algorithms are designed to restore the native complexes given the structures of two known interactors, and there have been few attempts to use docking algorithms to infer PPIs. Mosca et al. (2009) undertook the first high-throughput docking analysis to explore the yeast interactome. Wass et al. (2011) showed that a docking algorithm can be used to distinguish true interactions from “background” noninteracting protein pairs. The issue of Arabidopsis proteome-wide protein structures is more challenging because there are currently only 1,152 experimentally determined Arabidopsis protein structures for 587 Arabidopsis gene identifiers deposited in the Protein Data Bank (PDB; www.rcsb.org; as available in Ensembl Plant Genes 40), a considerable shortfall given that there are 27,655 Arabidopsis protein-coding genes in Araport11 (www.araport.org; Cheng et al., 2017).
In this study, we addressed these two issues by showing that a widely used docking algorithm has the ability to separate true interactions from randomly selected protein pairs and that this discriminative ability can be applied to interactions using proteome-wide predicted structure models to generate S-PPIs. We show that there is an enrichment for true interactions for top-ranked S-PPI pairs using both experimentally determined and predicted structures. Our predicted structure-based interactions using homology-based structure models were further validated by cosubcellular localization analysis and yeast two-hybrid assays. Our success rate for S-PPI predicted interactors is 63% of the success rate for naively retested protein interaction pairs that were determined using the yeast two-hybrid method. As part of this prediction effort, we also present new tools for viewing and working with these and our extensive database of PPIs, first described by Geisler-Lee et al. (2007) more than a decade ago, including web services and a new initiative to integrate interaction data from another well-curated repository, BioGRID (Chatr-Aryamontri et al., 2017).
RESULTS
Characterization of the Arabidopsis Proteome-wide Predicted Structure-ome
To fill the gap between the number of Arabidopsis protein-coding genes and experimentally determined structures (1,152 models for 587 Arabidopsis genes in the PDB), we determined predicted structure models for the entire Arabidopsis proteome using the Phyre2 (Protein Homology/analogY Recognition Engine) protein fold recognition server (Kelley et al., 2015). This predicted “structure-ome” contains 29,180 models covering ∼84% of Arabidopsis proteome. The identity score of the sequences (calculated by aligning the sequence of the predicted model with the sequence of its template) versus the sequence completeness score (calculated by comparing the length of predicted structure sequence to the length of the sequence) is shown in Figure 1A, while the length distribution of the predicted models is shown in Figure 1B. The sequence completeness score is fairly evenly distributed, with two small peaks at ∼0.3 and ∼0.9. The distribution of the identity scores has one peak at ∼0.3 (30% identity). Predicted models with amino acid sequence completeness scores over 0.8, and identity scores over 0.5 were considered to be of high quality (for rationale, see “Discussion”; these are highlighted by a rectangle in Fig. 1A); the summarized information for these 1,346 “reliable” predicted models is shown in Figure 1, C and D and listed in Supplemental Table S1.
Figure 1.

Arabidopsis predicted structure-ome. A, A scatter plot showing the identity score versus sequence completeness score of the 27,416 Phyre2-predicted structure models. B, A bar graph showing the length distribution of these 27,416 predicted structure models. C, A scatter plot showing 1,346 “reliable” predicted models with identity score over 0.5 and sequence completeness score over 0.8, from highlighted area in A. D, A bar graph showing the length distributions of these 1,346 high-quality predicted models.
To further evaluate the accuracy of the predicted models, we aligned the predicted structures with their corresponding experimentally determined structures (real structures) and calculated the root mean square deviation (RMSD) value between them. The alignment process is divided into two groups: one where real structures were published before our structure prediction (231 structures) and one where the structures were published after our prediction (91 structures). As expected, we found a very small average RMSD of 1.03 Å between predicted models and the structures published before the prediction, with 84.4% (195/231) of the pairs having an RMSD smaller than 2 Å. This is not surprising, as Phyre2 used those 231 structures to model the predicted structures. The average RMSD is 2.59 Å between predicted models and the structures published after the prediction, with 59.3% (54/91) of the pairs having an RMSD smaller than 2 Å (Fig. 2A). Four predicted structures (blue) aligned with their corresponding real structures (red and published after the Phyre2 prediction) with increasing RMSDs are shown in Figure 2B. Considering that during PPI, 71% of the complexes will have an RMSD < 2 Å between unbound and bound states due to conformation change (Vakser, 2014), we considered the accuracy of our predicted models to be sufficient for docking analyses.
Figure 2.

Comparison between real and predicted structures. A, A plot showing the RMSD difference between two groups: predicted structures aligned with real structures published before our Phyre2 prediction (black) and after our Phyre2 prediction (gray). B, Four predicted models (blue) aligned with their corresponding real structures (red) with differing RMSD values. The aligned residues (residue distance < 4 Å between real structure and predicted model) are colored in purple.
Evaluation of Docking Performance Using Real Structures
To evaluate the ability of a docking algorithm to separate real interactions from noninteractors, we used the HEX program (Ritchie and Kemp, 2000) on 174 known interactions from Benchmark 4.0 (Hwang et al., 2010; listed in Supplemental Table S2) and 50,000 random pairs of proteins using structures from SCOP (Murzin et al., 1995). We also included 1,629 protein pairs from Negatome 2.0 (Blohm et al., 2014). Negatome is a collection of protein and domain pairs that are unlikely to interact physically, and these 1,629 pairs were used as a negative set. HEX is a computational docking method to search for candidate low-energy conformations of input protein pairs (or other ligands) using a hydrophobic-excluded volume model calculated by electrostatic complementarity. A spherical polar Fourier correlation is used in this method to accelerate the search process. Effectively, HEX rotates each protein in 3D space in 15 degree increments (24 rotations for the x, y, and z axes for a total of 13,824 positions per protein) and then measures the docking energy with the second protein, again for all 15 degree increment positions for the second protein. It thus computes the docking energy for 191.1 million conformations per pair of proteins. The top 500 scores of each interaction together with their interacting poses (totaling 25.9 million models in PDB format) were retained. The score distribution of each benchmark interaction and Negatome protein pair was plotted with the score distributions of 50,000 random pairs. In Figure 3A, a benchmark complex erythropoietin/EPO receptor has a lower (better) docking score distribution using both bound forms (red distribution) and unbound forms (blue distribution) than the distributions of most of the background pairs (gray distributions). A statistical comparison between the distributions of benchmark interactions (and Negatome protein pairs) and background pairs was done using Wilcoxon rank-sum test (Wilcoxon, 1946), and the percentage of the background pairs for each benchmark interaction (or Negatome protein pair) was significantly less than was recorded. In Figure 3B, 38% (66 out of 174) of the benchmark interactions using bound structures and 24% (42 out of 174) of the benchmark interactions using unbound structures have significantly lower (better) scores than 90% of the background pairs, which indicates an enrichment of real interactions toward the lower (better) end of the scoring spectrum. Regarding the negative set, 0.25% of the Negatome pairs have significantly lower (better) scores than 90% of the background pairs, which indicates a huge depletion of noninteracting pairs toward the lower (better) end of the scoring spectrum. The ability of HEX to separate the 174 benchmark interactions and Negatome protein pairs from the 50,000 background pairs was also assessed using receiver operating characteristic (ROC) analysis. The area under curve (AUC) score is 0.75 for benchmark complexes using bound structures and 0.69 for the ones using unbound structures (Fig. 3C). Both of these AUC scores are higher than the random value of 0.5, indicating a better than random chance of discriminating true interactions from random background pairs using HEX. Regarding the negative set, the AUC score is 0.22 for Negatome pairs, which indicates a better-than-random chance of discriminating noninteracting pairs from random background pairs; most of the Negatome noninteracting pairs are ranked toward the right side of the graph. The benchmark interactions using bound structures behaved better than the ones using unbound structures in our docking analysis, and all the benchmark interactions and random pairs behaved better than the Negatome noninteracting pairs.
Figure 3.

Performance of HEX using real and predicted structures. A, The docking score distribution of a benchmark interaction Erythropoietin/Epo receptor using bound structures (red lines) and unbound structures (blue lines) and 50,000 random pairs of interactions (gray lines). B, A plot showing the percentage of the background pairs that the percentage of the benchmark interaction and Negatome protein pairs is significantly less than. C, ROC curve showing the performance of the HEX docking method in discriminating the benchmark interactions using bound (red) or unbound (blue) structures and the Negatome protein pairs (black) from 50,000 background sets. D, HEX performance comparison between using real structures and predicted structures and the plot represents the percentage of the background pairs that the percentage of the test interactions is significantly less than.
To further evaluate the performance of the docking algorithm on benchmark interactions using unbound structures, we compared residues at the actual benchmark interface of a given PPI in the in the Benchmark 4.0 set with the ones predicted to be at the interface in the top 500 HEX-docked models for that same interaction. The predicted binding sites (the frequency of each residue showing up in the interface among the 500 predicted complex models) were aligned with the real binding sites (Supplemental Table S1, D, E, I, and J). Similar peak patterns between real and predicted interfaces (i.e. overlap between red and blue lines in the graphs) indicated that HEX was able to identify the real binding interface. The predicted interface sites were also mapped onto the real structures for a visual comparison (Supplemental Table S1, B, C, G, and H). We observed that most of the benchmark interactions with good score distributions have at least one interacting partner with similar peak patterns. We further calculated the residue propensities of 20 amino acids in five different structural environments: real interface, predicted interface, exposed area, core area, and all environment (Supplemental Table S2A). The residue propensities at the real interface are similar to those at the predicted interface, and both of them are similar to the exposed area, with a slightly higher frequency in hydrophobic residues, which is further supported by high Pearson correlation coefficient scores (>0.86) between residue propensities at the real interface and predicted interface/exposed environments (Supplemental Table S2B). These results are consistent with previous findings that binding (interface) surfaces are similar to general surfaces (Levy, 2010). The higher frequency of the hydrophobic residues in the interface can be explained by the fact that hydrophobic residues tend to show up in the interface core area (Bickerton et al., 2011).
Evaluation of Docking Performance Using Predicted Structures
To evaluate the performance of the HEX docking algorithm with experimentally verified interactions and Phyre2-predicted structures, we used the HEX program to dock pairs of predicted structures for 128 experimentally verified interactions in the BAR’s AIV database (listed in Supplemental Table S4), 1,724 AIV interolog-predicted interactions (listed in Supplemental Table S5), and 50,000 random protein pairs generated from 1,346 high-quality predicted models. The docking score distribution for each AIV interaction was compared with docking distributions for 50,000 random pairs using the Wilcoxon rank-sum test. These results were compared to Benchmark 4.0 interactions using unbound structures (Fig. 3D). We found that the HEX docking algorithm performed better using experimentally determined structures (interactions from the Benchmark 4.0 set) compared to using predicted structures (interactions from the AIV database set of experimentally confirmed interactions). Furthermore, the HEX algorithm performed better when docking predicted structures for AIV experimentally confirmed interactions compared to docking predicted structures for interolog-predicted interactions, relative to docking scores for random pairs. Nevertheless, we found similar curve patterns for all three categories toward the lower docking score section (i.e. in the region of the graph where scores are better than 80% to 100% of the background interactions); thus, HEX-predicted interactions in this region were used to distinguish the potentially true interactions from random pairs of interactions based on predicted models.
Arabidopsis Predicted Structure-Based Interactome
There are 906,531 possible binary interactions (including self-interactions) that can be formed from 1,346 high-quality predicted models. We used the HEX docking algorithm on all ∼0.91 million interactions and ranked their top 500 docking score distributions with each other using the Wilcoxon rank-sum test. We generated an interaction network using the top 1% of ranked interactions (9,065 interactions listed in Supplemental Table S6; these comprise our S-PPIs) using Cytoscape (Shannon et al., 2003), as shown in Figure 4. Currently, there are 663 experimentally determined interactions in the public PPI databases (AIV, BioGRID, and IntAct) among the 1,346 proteins, and 150 of them (22.6%) were recovered in our top 1% ranked S-PPIs. There are also 2,440 high-confidence interactions (score > 0.7, determined both experimentally and using interolog information) in the STRING database between the 1,346 proteins, with 198 of them (14.7%) recovered in our top 1% ranked S-PPIs.
Figure 4.

A network created by the top 1% ranked S-PPIs (9,065 interactions) in which proteins (nodes) are colored according to their subcellular location based on SUBA3 data. The interactions where both of the interactors locate in the same cellular compartment are colored in black, and the interactions where the interactors locate in different cellular compartments are colored in gray.
Proteins that bind to one another should be located in the same subcellular compartment, at least some of the time. To further evaluate our top-ranked S-PPIs, we performed a cosubcellular localization enrichment analysis for these 9,065 interactions (Fig. 5A). The subcellular localization information of the predicted models was retrieved from the SUBcellular localization database for Arabidopsis proteins (SUBA3; Tanz et al., 2013; Hooper et al., 2014), and the observed and expected number of interactions for each subcellular localization combination were calculated using the method described by Geisler-Lee et al. (2007). There is a significant enrichment of the interactions colocalizing in the endoplasmic reticulum, Golgi, nucleus, peroxisome, and plasma membrane, especially in the nucleus, where we observed a large enrichment (87 expected interactions by chance and 330 observed interactions). These results indicate that the interaction partners from the top 1% ranked S-PPIs tend to be located in the same subcellular compartment.
Figure 5.

Subcellular localization analysis of the top 1% ranked S-PPIs. A, Colocalization enrichment analysis on the top 1% ranked S-PPIs (9,065 interactions). For each cellular compartment pair, the number represents the observed number of the interactions. B, A network created by 330 top 1% ranked S-PPIs (gray dotted lines) where both of the interactors locate in the nucleus. Top 1% ranked S-PPIs overlapped with experimentally confirmed interactions from AIV/Biogrid/Intact databases are colored in red. Top 1% ranked S-PPIs overlapped with STRING high confidence interactions (score > 0.7) are colored in pink.
We further analyzed the 330 interactions colocalized in the nucleus, with full details shown in Figure 5B, where the S-PPIs confirmed by experiments are colored red and S-PPIs confirmed by STRING high-confidence interactions (experimental and interolog combined evidence; Szklarczyk et al., 2015) are colored pink. There are four major interaction types among those 330 interactions. The first type is the interactions between histone H2A and H2B variants. Histones are abundant in the nucleus of the eukaryotic cells, and dimers of H2A, H2B, H3, and H4 histones assemble a protein octamer (Luger et al., 1997). The interaction of these histone subunits was successfully recovered in our top 1% ranked S-PPIs. The second type is the interaction between RNA polymerase II subunits (NRPB). RNA polymerase II in eukaryotes contains 12 subunits (Liu et al., 2013), and the interaction of some subunits was successfully predicted. The third type is the interactions between nuclear export proteins and importin alpha, which are nuclear transport receptors. Certain exportins have importin alpha-binding ability to be able to transfer importin alpha from nucleus to cytoplasm (yeast Cse1; Kutay et al., 1997; Cook et al., 2007). The fourth type is the interactions between subunits of the 20S proteasome (PBB, PAE, and PAF), and our top 1% ranked S-PPIs successfully recovered the binding of some subunits (Fu et al., 1998).
The other location combinations with an enrichment of interactions compared to random combinations are cytosol/mitochondrion, cytosol/plastid, plasma membrane/endoplasmic reticulum, plastid/extracellular, and Golgi/plasma membrane. The enrichment of interactions for protein pairs locating in cytosol/mitochondrion, cytosol/plastid, and plasma membrane/endoplasmic reticulum can be explained by the direct contact between these organelles. For some of the proteins, there is more than one subcellular localization, and this can explain the enrichment of the interactions for protein pairs locating in plastid/extracellular and Golgi/plasma membrane combinations where the alternative localization was used in the analysis. In contrast to enrichment, there is also a significant depletion in the location combination of the nucleus and other organelles, such as extracellular, Golgi, peroxisome, plasma membrane, plastid, and vacuole, where proteins located in these compartment pairs are unlikely to interact, which further supports our results.
We undertook two more in silico validations of our 9,605 S-PPIs, namely, a comolecular function analysis and cobiological process enrichment analysis, based on GO annotations. We found a strong enrichment of interactions where both proteins are involved in transport, signal transduction, cell organization, and biogenesis, DNA or RNA metabolism, and protein metabolism processes (Supplemental Fig. S3A) and for those where both proteins have kinase activity, DNA or RNA binding activity, protein binding activity, and transporter activity (Supplemental Fig. S3B). These enrichment results corroborate our colocalization enrichment results and suggest that our set of S-PPIs contains true interactions. Note that the enrichment analyses are contingent on the proteins actually having been annotated as belonging to a particular category. In addition, if proteins were annotated as being in multiple subcellular compartments, we used the top-ranked compartment as provided by SUBA.
Yeast Two-Hybrid Validation of S-PPIs
As a final validation step, we performed yeast two-hybrid (Y2H) experiments to verify the reliability of the top ranked S-PPIs and to compare the accuracy of the structural-based PPI predictions with interolog-based PPI predictions from Geisler-Lee et al. (2007). A total of 183 interactions (listed in Supplemental Table S7) were tested by Y2H using the DupLEX-A Y2H system. These include 38 binary interactions from the top-ranked S-PPI interactions (Top_1), 47 randomly chosen binary interactions from the top 1% ranked S-PPI interactions, 48 randomly chosen interaction pairs from the entire 0.9 million ranked S-PPI interaction set (as a random “background”), 20 randomly chosen interactions from the BAR’s AIV database flagged as “experimentally confirmed” interactions (AIV_confirmed), and 30 randomly chosen interactions from the AIV database flagged as interolog-predicted interactions (AIV_predicted; Geisler-Lee et al., 2007). We cloned all coding sequences of the interactors without their stop codons into both bait and prey plasmids and tested each interaction in both bait-prey directions in three experimenter-blinded replicates (Fig. 6A). The number of confirmed interactions from each category in each repeat was counted separately, and the results are shown in Figure 6B. Around 26% of the Top_1 interactions and around 30% of the Top_2 interactions were confirmed in Y2H experiments, levels which are significantly higher than the 10% of the interactions from the background set of randomly picked protein pairs. This indicates that there is an enrichment of true interactions toward the top-ranked interactions predicted based on their structural features. Forty-five percent of the interactions from AIV_confirmed category and 30% of the interactions from AIV_predicted category were confirmed in the Y2H tests. These Y2H results show that not all experimentally determined PPIs generate a positive signal in Y2H, in spite of all of the retested pairs of experimentally determined PPIs having originally been determined using the Y2H system. It should be pointed out that the clones in these cases may not have been full length, etc. For instance, several of the interactions we retested were from Klopffleisch et al. (2011), where a complementary DNA (cDNA) library of average insert size of 1.2 kb was one of the inputs used to screen for G-protein interactors. In our retests, we used “naive” full-length clones, as one might initially do in a Y2H study. Furthermore, it has been documented that there is a high false negative rate in Y2H experiments (Ito et al., 2001); thus, the value of around 30% we are seeing for our “top” sets is likely an underestimate, again because not all interactions that happen in the cell can be detected by Y2H. There is little difference between the “top” categories and the AIV_predicted category, which indicates that structural-based prediction has a comparable accuracy with interolog-based predictions in the Y2H tests we conducted.
Figure 6.

Yeast two-hybrid validation. A Yeast strains were distributed over 384-well plates with three different medium types: YNB(gal)-his-ura-trp+leu as a growth control, YNB(gal)-his-ura-trp-leu for the LEU activation test (growth is indicative of a protein-protein interaction), and YNB(gal)-his-ura-trp-leu+Xgal for the reporter gene activation test (blue staining is indicative of a protein-protein interaction). This process was replicated three times, and the interaction was counted as positive only if the blue staining was observed at least two times. B, A bar graph showing the percentage of test interactions having a positive result from each category.
Integrating S-PPIs with Experimentally Determined PPIs
To explore whether the top-ranked interactions can extend our knowledge of the known PPI networks in Arabidopsis, we combined the network generated from those 9,065 interactions (top 1% ranked S-PPIs) with AIV-confirmed interactions. Using the S-PPIs, additional proteins were identified that can potentially bind known complexes. For example, known interactions among protein kinase, rotamase, and calmodulin proteins formed a small network (Fig. 7A), and this network was extended based on our top 1% ranked S-PPIs; further calmodulin, kinase, and chaperonin members could be added to the network. Chloroplast GroES chaperonin was previously reported to have calmodulin binding ability (Yang and Poovaiah, 2000), and this interaction was successfully predicted by our S-PPI method. Aside from extending known networks, new connections between known complexes were also identified. For example, potential interactions between a T-complex protein 1/cpn60 chaperonin family protein and plasma membrane intrinsic proteins connect the chaperone complex with this plasma membrane protein complex (Fig. 7B). The involvement of chaperone with plasma membrane protein in Arabidopsis has been reported in previous studies. Yang et al. (2010) showed that the Arabidopsis chaperon J3 regulates H+-ATPase in the plasma membrane by suppressing the protein kinase SOS2-like 5 kinase. The existence of other chaperonin proteins interacting with plasma membrane proteins is possible, and these S-PPIs can be used to generate list of candidates for experimental verification for their involvement in protein complex assembly.
Figure 7.

Experimentally determined PPI network expanded by the top 1% ranked S-PPIs. Experimentally determined interactions (red solid line) are experimentally confirmed interactions from AIV/BioGRID/Intact databases and predicted interactions (gray dotted line) are from the top 1% ranked S-PPIs. A, Calmodulin network expanded by top 1% ranked S-PPIs. B, Two experimentally determined complexes (chaperonin family proteins and plasma membrane intrinsic proteins) connected by top 1% ranked S-PPIs (gray dotted lines) between members from both complexes.
Exploring S-PPIs and Other Interaction Data Sets with a New AIV
We added the 9,605 predicted S-PPIs to the BAR’s AIV database, originally developed to view interolog predictions from Geisler-Lee et al. (2007). When an interaction based on an S-PPI is shown in the AIV, which is powered by cytoscape.js (Franz et al., 2016), clicking on the edge between the two predicted interacting proteins will open a new view showing the two protein models (as predicted by Phyre2), with their surfaces colored to denote where on each protein the other protein docks based on the 500 top docking solutions for the S-PPI pair: the surface residues are colored according to the frequency a given residue is in the contact area between the two proteins of those 500 docking solutions, as shown in Figure 8.
Figure 8.

Example outputs from the updated Arabidopsis Interactions Viewer. A, “Stacked” layout from outside the cell (“extracellular”) to nucleus. Circular nodes represent proteins, and the numbers in each node represent MapMan terms, while colored “doughnuts” around the nodes represent subcellular localizations (predicted localizations have been turned off in this example) from SUBA. Clicking on the square chromosomal containers (chromosome 5 in this example) calls up the protein-DNA interactions (PDIs) associated with that chromosome (here 234 PDIs are associated with At1g19040). Dashed red line shows connection from a Pseudomonas syringae effector, AvrC, through yellow highlighted proteins to a transcription factor, At1g19040. B, Clicking on interaction edges between proteins that have been predicted as part of our S-PPI study (mouse pointer in A) calls a page where the docking frequency for 500 runs of the HEX docking algorithm with the other protein is mapped onto the surface of that protein as a heatmap (red, high frequency of docking at that location), and vice versa (the view for At4g16760 and At5g53160, ranked #8519 of 9065 S-PPIs presented in this paper, is shown here).
In order to increase the utility of the AIV for hypothesis generation, we introduced several other data sets, in addition to the 70,944 interolog-predicted PPIs from Geisler-Lee et al. (2007) and 39,505 experimentally determined interactions from the literature. We added 2,967 protein-DNA interactions (PDIs) from eight yeast one-hybrid publications (Brady et al., 2011; Gaudinier et al., 2011; Li et al., 2014; Taylor-Teeples et al., 2015; de Lucas et al., 2016; Murphy et al., 2016; Porco et al., 2016; Sparks et al., 2016), 2.7 million DNA affinity purification sequencing PDIs from O’Malley et al. (2016), and 355 Arabidopsis-pathogen effector interactions from Mukhtar et al. (2011). Outputs of the AIV were modified such that the promoters of genes are denoted by squares and organized by chromosome number, according to Shneiderman’s “overview first, zoom and filter, then details-on-demand” data visualization mantra (Shneiderman, 1996). Similarly, pathogen effectors are denoted by octagons to provide a visual distinction from round nodes denoting Arabidopsis proteins.
As the Provart lab does not have sufficient resources to curate every literature instance of Arabidopsis interactions, we further improved the AIV framework to be PSICQUIC compliant. PSICQUIC stands for proteomics standard initiative common query interface (Aranda et al., 2011) and permits interaction databases that are PSICQUIC enabled to be searched with a standardized query so that users do not need to learn each database’s user interface. We added the option to use the AIV to query interactions not only from the AIV database but also from the BioGRID (Chatr-Aryamontri et al., 2017) and IntAct (Kerrien et al., 2012) interaction databases. Such queries can provide a more complete representation of a given protein’s interactors, as unfortunately no “canonical” Arabidopsis interaction database exists. Interaction viewers such as Cytoscape (Christmas et al., 2005) also contain built-in adapters that permit interactions from PSICQUIC-compatible databases to be retrieved with a few clicks. Hitting “Alt” (Windows) or “Option” (Mac) plus the “L” key will open the “Import Network from Public Databases” dialogue box, and simply entering an AGI ID into the search box and clicking “Search” will retrieve interactions from the AIV database (denoted as “BAR”) and other connected databases for exploration in Cytoscape. We also worked with BioGRID to share our extensive database of experimentally determined interactions with BioGRID and to import their ∼40,000 Arabidopsis PPIs into our database to create an even simpler way to access well-curated interactions.
Finally, in order to better understand interaction networks within the AIV, we developed modules that permit nodes to be “decorated” with MapMan (Thimm et al., 2004) annotations or gene expression levels from the BAR’s comprehensive database of around 35 million expression measurements that are also accessible via its eFP browser (Winter et al., 2007). Nodes may also be grouped according to subcellular localization or layered to provide a “gene regulatory network-like layout.” For S-PPIs, the docking results are represented as heat maps on the two respective structures. See Figure 8, for some of these features.
DISCUSSION
We provide evidence that a structure-based docking algorithm can be used to identify true PPIs, even using predicted structures. We found a significant enrichment of true interactions toward the top-ranked S-PPIs, which was supported by colocalization enrichment analysis and Y2H validation. This study evaluated the possibility of PPI prediction using only structural information, which provides another perspective in PPI exploration and biological network reconstruction. In light of ever-increasing structure prediction accuracy (the critical assessment of structure prediction competition has been running since 1994 and is now in its 12th competition) along with increasing number of crystal structures in the PDB to act as templates that lead to better predictions, we suggest that predicting a complete interactome (as opposed to partial interactome in our case) via docking will become increasingly tenable.
A docking algorithm may not accurately predict the correct binding interface between two binding partners, but it can still distinguish true interactors from noninteractors because protein binding is a multistep process that is initiated by the formation of nonspecific complexes, followed by rearrangements to get a more stable state driven by different interactions (Blundell and Fernández-Recio, 2006). The whole process behaves like a funnel-shaped energy landscape where different sequential rearrangements are differential pathways toward the bottom of the funnel (Tsai et al., 1999), which indicates that binding information is not only restricted to the interaction surface, but also contained in the protein surface morphology (Wass et al., 2011). Although the surface morphology information from a protein structure might not be enough to reveal the native interface, this information may be enough to identify a real interaction when comparing it with the other unlikely interacting pairs.
The docking problem is more complicated using predicted models because this is a “double model” situation, with both protein models and complex models being predicted. This situation is confounded the higher the docking resolution (Vakser, 2014), leading to false negatives. To fix this problem, one solution would be to use docking algorithms that perform better at lower resolution, such as HADDOCK (Dominguez et al., 2003), RosettaDock (Lyskov and Gray, 2008), and SwarmDock (Moal and Bates, 2010). In this study, we chose HEX as the docking algorithm for two reasons: HEX dock has been proven to be able to separate the real interactors from the background (Wass et al., 2011), and it requires fewer computational resources, which is crucial when performing a million docking simulations. Another solution would be to use high-quality predicted models, which we have done, but at the cost of greatly reducing the number of models we could use for docking predictions. Most of the protein model prediction algorithms are homology based, and 30% identity would be considered as a cutoff for successful homology modeling (Xiang, 2006). When a protein has an identity of over 30% to a known structure, the accuracy for the structural prediction is equivalent to a low-resolution x-ray structure. When the identity is over 50%, 90% of the backbone atoms will be correctly predicted with an RMSD of < 1 Å (Sanchez and Sali, 1997). In this study, we used the identity threshold of 50% to the template to get a more faithful representation of the actual structures.
Among the top 1% ranked S-PPIs, we found a dramatic enrichment of interactions where both of the interactors are located in nucleus (from 87 expected interactions to 330 observed interactions; Fig. 5B). The biggest contribution of the enrichment comes from 18 histone H2A and H2B variants, which encompass 108 interactions. Although some of those histone variants are functionally redundant (Yi et al., 2006), different histone variants can go through different posttranslational modifications, like methylation, which will directly affect their interaction specificity with their chaperones (Zhou et al., 2015); thus, we did not treat those 108 interactions as being the same. Aside from those 108 H2A/H2B interactions, there are 222 more observed S-PPIs where many previously reported interactions were successfully predicted, such as the interactions between histone H3 and RNA polymerase II (Stasevich et al., 2014). In light of just 87 expected interactions, there is still significant enrichment of interactions in the nucleus/nucleus location combination, even discounting the histone S-PPIs.
In this study, we compared the accuracy of the structural-based interaction predictions with interolog-based interaction predictions and found a comparable rate of positives in our Y2H validation tests (∼30%). Although both interaction prediction methods have a seemingly low positive rate in the Y2H test (yet still 3-fold better than randomly picked “background” pairs, which are assumed to be noninteractors), the true interaction rate for our S-PPIs may be considerably higher due to the low sensitivity of the Y2H system. Braun et al. (2009) and Chen et al. (2010) both reported a Y2H assay sensitivity of 25%, which indicates that not all the interactions that occur in a plant cell can be detected by Y2H and that there may be an underestimation of the true interaction rate in our “top” categories. There is some similarity shared between these two prediction methods. They both rely on the experimentally determined results from other organisms, those results being either experimentally determined structures that can be used as templates for structure modeling for docking input or experimentally determined interactions that can be used as templates to search for the corresponding orthologs in the target organism. That said, there is an overlap of just 55 interaction pairs between the 9,065 S-PPI set and our earlier interolog prediction work (Geisler-Lee et al., 2007), indicating a complementarity of the two prediction methods. Both methods will improve in the future as data encompassing more and more experimentally determined protein structures and interactions are generated and structure modeling and docking algorithms become better. In the future, these two methods could be further combined to get more reliable PPI predictions based both on structural and functional information.
We made our 9,065 S-PPIs available on the BAR’s new AIV, along with BioGRID’s extensive collection of 42,605 Arabidopsis interactions, thereby almost doubling the number of Arabidopsis PPIs available in one tool (the AIV database now contains 62,626 unique pairs of experimentally supported interactions, as in some cases both groups curated the same interaction). The predicted structure-ome is accessible through the BAR’s ePlant app (Waese et al., 2017) at http://bar.utoronto.ca, which is freely accessible by the plant community.
MATERIALS AND METHODS
Arabidopsis Proteome-wide Predicted Structure-ome
The Arabidopsis (Arabidopsis thaliana) TAIR10 protein sequences were used as input for Phyre2 (this project started before the Araport11 build was available). A total of 29,180 protein models were generated, and 1,346 of them were considered reliable as follows. TAIR10 sequences corresponding to the protein sequences in the predicted models were retained. The identity score was computed by aligning the sequences used to predict the models with the sequences of the corresponding structural templates. Predicted models with an amino acid sequence completeness score over 0.8 and an identity score over 0.5 were considered reliable, encompassing 1,346 models in total. The RMSD values between experimentally determined and predicted structures were calculated by the structural alignment function in PyMol (pymol.org).
Docking Analysis and Statistical Testing
The HEX 8.0.0 (Ritchie and Kemp, 2000) docking algorithm was used in our analysis with a shape complementarity as the only scoring function (without electrostatics function, as per Wass et al., 2011). All the structures were randomized in their orientations prior to docking. The top 500 scores of each docking interaction and their docking poses in PDB format were retained for later analysis.
The Wilcoxon rank-sum test (Wilcoxon, 1946) was used to assess the statistical difference between the score distributions of the two kinds of docking interactions: test interactions versus random pair sets. For each test interaction in the Hwang et al. (2010) data set of 174 benchmark complexes, from the Negatome data set of 1,629 protein pairs (Blohm et al., 2014) or from the 0.91 M pairs generated from 1,346 reliable predicted structure models, an individual Wilcoxon test was performed against each of the 50,000 background pairs created using 988 real or 1,346 predicted structures, depending on the kind of structures (experimentally determined or predicted) being tested for interaction by docking. The percentage of the background interactions where the test interactions exhibited a score better than P < 0.01 was recorded.
ROC curves were used to evaluate the performance of HEX in distinguishing the test interactions from background, randomly picked pairs. The rank information of the test interactions among the background based on score distribution was used as input for ROC analysis, and the AUC was calculated. All the statistical tests were done using R version 3.2.4 (R Development Core Team, 2008).
Interface Analysis and Residue Propensity Calculation
The interaction interface is defined as any residue on one of the interacting partners with its nonhydrogen atoms having a distance of less than 5 Å from any nonhydrogen atoms on the other interacting partner. The true interface sites are residues found at the interface of proteins in the benchmark complexes. Putative interface sites were mapped onto the benchmark structures with different colors indicating the frequency of each residue showing up on the interface among the top 500 complexes of each docked protein.
The exposed and core area are distinguished based on the solvent accessibility. Residues are classified as core residues if the relative accessible surface area (ASA) is less than 7% and as exposed residues if the ASA is more than 7% (Bickerton et al., 2011). The ASA of each residue was calculated using the get_area function in PyMol. The propensities of 20 amino acids in different environments (exposed, core, and interface) were calculated specifically. The average amino acid propensities in the interface of the top 500 predicted complexes were used as the residue propensities in the predicted interface. The Pearson correlation coefficient score between the residue propensities in the real interface and other environments was calculated.
Statistical Test for Coenrichment Analysis
nαβ is the observed number of interactions with one protein located in α and another protein located in β. The expected number ( ) of interactions is given by
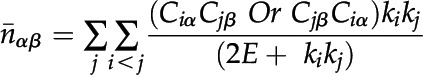 |
where k is the degree of protein (the numbers of proteins that interact with it) and E is the total number of interacting pairs. For protein i, Ciα equals 1 if protein i is in location α and 0 if not.
The P value for the observed and expected number of interactions was calculated using a Poisson distribution:
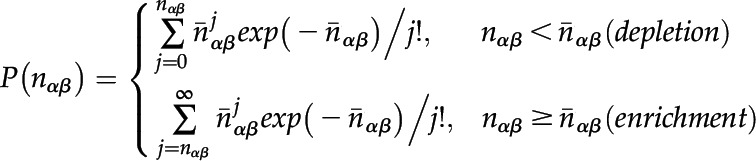 |
The final P value was determined by a multiple-testing correction:
P is the single-test P value, and m stands for the number of αβ pairs. For enrichment, m equals the number of αβ pairs with at least one edge in the observed network and for depletion, m equals the number of αβ pairs possible in the randomized networks.
Y2H Validation
The DupLEX-A Y2H system (Origene) was used in the biological validation step. Approximately 400 expression clones for Arabidopsis sequences were ordered from the Arabidopsis Biological Resource Center through TAIR (www.arabidopsis.org). The coding sequences without their stop codons were cloned into prey (pJG4-5 with TPR1, Ampr, and an inducible GAL1 promoter; the fusion gene product contains a B42-HA tag) and bait (pEG202 with HIS3, Ampr, and a constitutive ADH promoter expressing LexA) plasmids through a standard Gateway LR clone process (Gateway LR clonase II, Thermo Fisher). The bait and prey plasmids carrying the sequences for both interacting partners were cotransformed into yeast strain Saccharomyces cerevisiae EGY48 (MAT alpha trp1 his3 ura3 leu2::6 LexAop-LEU2) carrying a reporter pSH-18-34 (URA3, Ampr, LacZ) plasmid. Yeast colony PCR was performed to ensure the target sequences were correctly cloned into the bait and prey plasmids and transformed into yeast strains. The primers for the amplification of the target sequences in pEG202 plasmids were 5′-AGGGCTGGCGGTTGGGGTTATTCGC-3′ and 5′-GAGTCACTTTAAAATTTGTATACAC-3′. The primers for the PCR amplification of the target genes in pJG4-5 plasmids were 5′-AATATACCTCTATACTTTAACGTC-3′ and 5′-GAGTCACTTTAAAATTTGTATACAC-3′. A yeast strain carrying a prey plasmid (pJG4-5::hopF2), a bait plasmid (pEG202::shcF), and a reporter plasmid (pSH18-34) was used as a positive control, and a yeast strain carrying empty prey and bait plasmids together with a reporter gene was used as negative control.
All the strains were spotted onto three different medium plates: YNB(gal)-his-ura-trp+leu for positive growth control, YNB(gal)-his-ura-trp-leu for LEU activation test, and YNB(gal)-his-ura-trp+leu+Xgal for reporter gene activation test. The Y2H validation process was done in three experimenter-blinded repeats, and the identity of colonies showing blue staining was recorded for each repeat.
Accession Numbers
The AGI ID pairs for the S-PPIs described in this article may be found in Supplemental Table S6.
Supplemental Data
The following supplemental materials are available.
Supplemental Figure S1. Binding site comparison between real complex and predicted complex using unbound structures.
Supplemental Figure S2. Residue propensity comparison between different environments.
Supplemental Figure S3. Molecular function and biological process coenrichment analysis for the top 1% ranked S-PPIs (9,065 interactions).
Supplemental Table S1. List of 1,346 reliable Phyre2-predicted models.
Supplemental Table S2. List of 174 benchmark complexes.
Supplemental Table S3. List of 1,629 Negatome pairs.
Supplemental Table S4. List of 128 AIV_confirmed interactions.
Supplemental Table S5. List of 1,724 AIV_predicted interactions.
Supplemental Table S6. List of top 1% ranked S-PPIs.
Supplemental Table S7. List of interactions tested in Y2H.
Acknowledgments
Docking computations ere performed on the GPC supercomputer at the SciNet HPC Consortium. SciNet is funded by the Canada Foundation for Innovation under the auspices of Compute Canada; the Government of Ontario; Ontario Research Fund - Research Excellence; and the University of Toronto.
Footnotes
This work was supported by grants from the Natural Sciences and Engineering Research Council of Canada and Genome Canada/Ontario Genomics to NJP, and a U.S. National Institutes of Health Office of Research Infrastructure Programs R01OD010929 grant to K.D. and M.T.
Articles can be viewed without a subscription.
References
- Arabidopsis Interactome Mapping Consortium (2011) Evidence for network evolution in an Arabidopsis interactome map. Science 333: 601–607 [DOI] [PMC free article] [PubMed] [Google Scholar]
- Aranda B, Blankenburg H, Kerrien S, Brinkman FSL, Ceol A, Chautard E, Dana JM, De Las Rivas J, Dumousseau M, Galeota E, et al. (2011) PSICQUIC and PSISCORE: Accessing and scoring molecular interactions. Nat Methods 8: 528–529 [DOI] [PMC free article] [PubMed] [Google Scholar]
- Bickerton GR, Higueruelo AP, Blundell TL (2011) Comprehensive, atomic-level characterization of structurally characterized protein-protein interactions: The PICCOLO database. BMC Bioinformatics 12: 313. [DOI] [PMC free article] [PubMed] [Google Scholar]
- Blohm P, Frishman G, Smialowski P, Goebels F, Wachinger B, Ruepp A, Frishman D (2014) Negatome 2.0: A database of non-interacting proteins derived by literature mining, manual annotation and protein structure analysis. Nucleic Acids Res 42: D396–D400 [DOI] [PMC free article] [PubMed] [Google Scholar]
- Blundell TL, Fernández-Recio J (2006) Cell biology: Brief encounters bolster contacts. Nature 444: 279–280 [DOI] [PubMed] [Google Scholar]
- Brady SM, Zhang L, Megraw M, Martinez NJ, Jiang E, Yi CS, Liu W, Zeng A, Taylor-Teeples M, Kim D, et al. (2011) A stele-enriched gene regulatory network in the Arabidopsis root. Mol Syst Biol 7: 459. [DOI] [PMC free article] [PubMed] [Google Scholar]
- Braun P, Tasan M, Dreze M, Barrios-Rodiles M, Lemmens I, Yu H, Sahalie JM, Murray RR, Roncari L, de Smet A-S, et al. (2009) An experimentally derived confidence score for binary protein-protein interactions. Nat Methods 6: 91–97 [DOI] [PMC free article] [PubMed] [Google Scholar]
- Chatr-Aryamontri A, Oughtred R, Boucher L, Rust J, Chang C, Kolas NK, O’Donnell L, Oster S, Theesfeld C, Sellam A, et al. (2017) The BioGRID interaction database: 2017 update. Nucleic Acids Res 45(D1): D369–D379 [DOI] [PMC free article] [PubMed] [Google Scholar]
- Chen J, Lalonde S, Obrdlik P, Noorani Vatani A, Parsa SA, Vilarino C, Revuelta JL, Frommer WB, Rhee SY (2012) Uncovering Arabidopsis membrane protein interactome enriched in transporters using mating-based split ubiquitin assays and classification models. Front Plant Sci 3: 124. [DOI] [PMC free article] [PubMed] [Google Scholar]
- Chen YC, Rajagopala SV, Stellberger T, Uetz P (2010) Exhaustive benchmarking of the yeast two-hybrid system. Nat Methods 7: 667–668, author reply 668 [DOI] [PMC free article] [PubMed] [Google Scholar]
- Cheng CY, Krishnakumar V, Chan AP, Thibaud-Nissen F, Schobel S, Town CD (2017) Araport11: A complete reannotation of the Arabidopsis thaliana reference genome. Plant J 89: 789–804 [DOI] [PubMed] [Google Scholar]
- Christmas R, Avila-Campillo I, Bolouri H, Schwikowski B, Anderson M, Kelley R, Landys N, Workman C, Ideker T, Cerami E, et al. (2005) Cytoscape: A software environment for integrated models of biomolecular interaction networks. AACR Education Book. American Association for Cancer Research, Philadelphia, PA, pp 12–16. [Google Scholar]
- Cook A, Bono F, Jinek M, Conti E (2007) Structural biology of nucleocytoplasmic transport. Annu Rev Biochem 76: 647–671 [DOI] [PubMed] [Google Scholar]
- de Lucas M, Pu L, Turco G, Gaudinier A, Morao AK, Harashima H, Kim D, Ron M, Sugimoto K, Roudier F, Brady SM (2016) Transcriptional regulation of Arabidopsis polycomb repressive complex 2 coordinates cell-type proliferation and differentiation. Plant Cell 28: 2616–2631 [DOI] [PMC free article] [PubMed] [Google Scholar]
- Dominguez C, Boelens R, Bonvin AM (2003) HADDOCK: A protein-protein docking approach based on biochemical or biophysical information. J Am Chem Soc 125: 1731–1737 [DOI] [PubMed] [Google Scholar]
- Franz M, Lopes CT, Huck G, Dong Y, Sumer O, Bader GD (2016) Cytoscape.js: A graph theory library for visualisation and analysis. Bioinformatics 32: 309–311 [DOI] [PMC free article] [PubMed] [Google Scholar]
- Fu H, Doelling JH, Arendt CS, Hochstrasser M, Vierstra RD (1998) Molecular organization of the 20S proteasome gene family from Arabidopsis thaliana. Genetics 149: 677–692 [DOI] [PMC free article] [PubMed] [Google Scholar]
- Fukao Y. (2012) Protein-protein interactions in plants. Plant Cell Physiol 53: 617–625 [DOI] [PubMed] [Google Scholar]
- Gaudinier A, Zhang L, Reece-Hoyes JS, Taylor-Teeples M, Pu L, Liu Z, Breton G, Pruneda-Paz JL, Kim D, Kay SA, et al. (2011) Enhanced Y1H assays for Arabidopsis. Nat Methods 8: 1053–1055 [DOI] [PMC free article] [PubMed] [Google Scholar]
- Geisler-Lee J, O’Toole N, Ammar R, Provart NJ, Millar AH, Geisler M (2007) A predicted interactome for Arabidopsis. Plant Physiol 145: 317–329 [DOI] [PMC free article] [PubMed] [Google Scholar]
- Hooper CM, Tanz SK, Castleden IR, Vacher MA, Small ID, Millar AH (2014) SUBAcon: A consensus algorithm for unifying the subcellular localization data of the Arabidopsis proteome. Bioinformatics 30: 3356–3364 [DOI] [PubMed] [Google Scholar]
- Hwang H, Vreven T, Janin J, Weng Z (2010) Protein-protein docking benchmark version 4.0. Proteins 78: 3111–3114 [DOI] [PMC free article] [PubMed] [Google Scholar]
- Ito T, Chiba T, Ozawa R, Yoshida M, Hattori M, Sakaki Y (2001) A comprehensive two-hybrid analysis to explore the yeast protein interactome. Proc Natl Acad Sci USA 98: 4569–4574 [DOI] [PMC free article] [PubMed] [Google Scholar]
- Kelley LA, Mezulis S, Yates CM, Wass MN, Sternberg MJ (2015) The Phyre2 web portal for protein modeling, prediction and analysis. Nat Protoc 10: 845–858 [DOI] [PMC free article] [PubMed] [Google Scholar]
- Kerrien S, Aranda B, Breuza L, Bridge A, Broackes-Carter F, Chen C, Duesbury M, Dumousseau M, Feuermann M, Hinz U, et al. (2012) The IntAct molecular interaction database in 2012. Nucleic Acids Res 40: D841–D846 [DOI] [PMC free article] [PubMed] [Google Scholar]
- Klopffleisch K, Phan N, Augustin K, Bayne RS, Booker KS, Botella JR, Carpita NC, Carr T, Chen JG, Cooke TR, et al. (2011) Arabidopsis G-protein interactome reveals connections to cell wall carbohydrates and morphogenesis. Mol Syst Biol 7: 532. [DOI] [PMC free article] [PubMed] [Google Scholar]
- Kutay U, Bischoff FR, Kostka S, Kraft R, Görlich D (1997) Export of importin alpha from the nucleus is mediated by a specific nuclear transport factor. Cell 90: 1061–1071 [DOI] [PubMed] [Google Scholar]
- Levy ED. (2010) A simple definition of structural regions in proteins and its use in analyzing interface evolution. J Mol Biol 403: 660–670 [DOI] [PubMed] [Google Scholar]
- Li B, Gaudinier A, Tang M, Taylor-Teeples M, Nham NT, Ghaffari C, Benson DS, Steinmann M, Gray JA, Brady SM, et al. (2014) Promoter-based integration in plant defense regulation. Plant Physiol 166: 1803–1820 [DOI] [PMC free article] [PubMed] [Google Scholar]
- Liu X, Bushnell DA, Kornberg RD (2013) RNA polymerase II transcription: Structure and mechanism. Biochim Biophys Acta 1829: 2–8 [DOI] [PMC free article] [PubMed] [Google Scholar]
- Luger K, Mäder AW, Richmond RK, Sargent DF, Richmond TJ (1997) Crystal structure of the nucleosome core particle at 2.8 A resolution. Nature 389: 251–260 [DOI] [PubMed] [Google Scholar]
- Lyskov S, Gray JJ (2008) The RosettaDock server for local protein-protein docking. Nucleic Acids Res 36: W233–W238 [DOI] [PMC free article] [PubMed] [Google Scholar]
- Moal IH, Bates PA (2010) SwarmDock and the use of normal modes in protein-protein docking. Int J Mol Sci 11: 3623–3648 [DOI] [PMC free article] [PubMed] [Google Scholar]
- Mosca R, Pons C, Fernández-Recio J, Aloy P (2009) Pushing structural information into the yeast interactome by high-throughput protein docking experiments. PLOS Comput Biol 5: e1000490. [DOI] [PMC free article] [PubMed] [Google Scholar]
- Mukhtar MS, Carvunis A-R, Dreze M, Epple P, Steinbrenner J, Moore J, Tasan M, Galli M, Hao T, Nishimura MT, et al. ; European Union Effectoromics Consortium (2011) Independently evolved virulence effectors converge onto hubs in a plant immune system network. Science 333: 596–601 [DOI] [PMC free article] [PubMed] [Google Scholar]
- Murphy E, Vu LD, Van den Broeck L, Lin Z, Ramakrishna P, van de Cotte B, Gaudinier A, Goh T, Slane D, Beeckman T, et al. (2016) RALFL34 regulates formative cell divisions in Arabidopsis pericycle during lateral root initiation. J Exp Bot 67: 4863–4875 [DOI] [PMC free article] [PubMed] [Google Scholar]
- Murzin AG, Brenner SE, Hubbard T, Chothia C (1995) SCOP: A structural classification of proteins database for the investigation of sequences and structures. J Mol Biol 247: 536–540 [DOI] [PubMed] [Google Scholar]
- O’Malley RC, Huang SC, Song L, Lewsey MG, Bartlett A, Nery JR, Galli M, Gallavotti A, Ecker JR (2016) Cistrome and epicistrome features shape the regulatory DNA landscape. Cell 165: 1280–1292 [DOI] [PMC free article] [PubMed] [Google Scholar]
- Popescu SC, Popescu GV, Bachan S, Zhang Z, Seay M, Gerstein M, Snyder M, Dinesh-Kumar SP (2007) Differential binding of calmodulin-related proteins to their targets revealed through high-density Arabidopsis protein microarrays. Proc Natl Acad Sci USA 104: 4730–4735 [DOI] [PMC free article] [PubMed] [Google Scholar]
- Porco S, Larrieu A, Du Y, Gaudinier A, Goh T, Swarup K, Swarup R, Kuempers B, Bishopp A, Lavenus J, et al. (2016) Lateral root emergence in Arabidopsis is dependent on transcription factor LBD29 regulation of auxin influx carrier LAX3. Development 143: 3340–3349 [DOI] [PubMed] [Google Scholar]
- R Development Core Team (2008). R: A language and environment for statistical computing. R Foundation for Statistical Computing, Vienna, Austria. http://www.R-project.org
- Ritchie DW, Kemp GJ (2000) Protein docking using spherical polar Fourier correlations. Proteins 39: 178–194 [PubMed] [Google Scholar]
- Sanchez R, Sali A (1997) Comparative protein structure modeling as an optimization problem. Theochem 398-399: 489–496 [Google Scholar]
- Shannon P, Markiel A, Ozier O, Baliga NS, Wang JT, Ramage D, Amin N, Schwikowski B, Ideker T (2003) Cytoscape: A software environment for integrated models of biomolecular interaction networks. Genome Res 13: 2498–2504 [DOI] [PMC free article] [PubMed] [Google Scholar]
- Shneiderman B. (1996) The eyes have it: a task by data type taxonomy for information visualizations. Proceedings of the 1996 IEEE Symposium on Visual Languages. IEEE Symposium on Visual Languages and Human-Centric Computing, Boulder, CO, pp 336–343. [Google Scholar]
- Sparks EE, Drapek C, Gaudinier A, Li S, Ansariola M, Shen N, Hennacy JH, Zhang J, Turco G, Petricka JJ, et al. (2016) Establishment of expression in the SHORTROOT-SCARECROW transcriptional cascade through opposing activities of both activators and repressors. Dev Cell 39: 585–596 [DOI] [PMC free article] [PubMed] [Google Scholar]
- Stasevich TJ, Hayashi-Takanaka Y, Sato Y, Maehara K, Ohkawa Y, Sakata-Sogawa K, Tokunaga M, Nagase T, Nozaki N, McNally JG, et al. (2014) Regulation of RNA polymerase II activation by histone acetylation in single living cells. Nature 516: 272–275 [DOI] [PubMed] [Google Scholar]
- Szklarczyk D, Franceschini A, Wyder S, Forslund K, Heller D, Huerta-Cepas J, Simonovic M, Roth A, Santos A, Tsafou KP, et al. (2015) STRING v10: Protein-protein interaction networks, integrated over the tree of life. Nucleic Acids Res 43: D447–D452 [DOI] [PMC free article] [PubMed] [Google Scholar]
- Tanz SK, Castleden I, Hooper CM, Vacher M, Small I, Millar HA (2013) SUBA3: a database for integrating experimentation and prediction to define the SUBcellular location of proteins in Arabidopsis. Nucleic Acids Res 41: D1185–D1191 [DOI] [PMC free article] [PubMed] [Google Scholar]
- Taylor-Teeples M, Lin L, de Lucas M, Turco G, Toal TW, Gaudinier A, Young NF, Trabucco GM, Veling MT, Lamothe R, et al. (2015) An Arabidopsis gene regulatory network for secondary cell wall synthesis. Nature 517: 571–575 [DOI] [PMC free article] [PubMed] [Google Scholar]
- Thimm O, Bläsing O, Gibon Y, Nagel A, Meyer S, Krüger P, Selbig J, Müller LA, Rhee SY, Stitt M (2004) MAPMAN: A user-driven tool to display genomics data sets onto diagrams of metabolic pathways and other biological processes. Plant J 37: 914–939 [DOI] [PubMed] [Google Scholar]
- Tsai CJ, Kumar S, Ma B, Nussinov R (1999) Folding funnels, binding funnels, and protein function. Protein Sci 8: 1181–1190 [DOI] [PMC free article] [PubMed] [Google Scholar]
- Vakser IA. (2014) Protein-protein docking: from interaction to interactome. Biophys J 107: 1785–1793 [DOI] [PMC free article] [PubMed] [Google Scholar]
- Van Leene J, Stals H, Eeckhout D, Persiau G, Van De Slijke E, Van Isterdael G, De Clercq A, Bonnet E, Laukens K, Remmerie N, et al. (2007) A tandem affinity purification-based technology platform to study the cell cycle interactome in Arabidopsis thaliana. Mol Cell Proteomics 6: 1226–1238 [DOI] [PubMed] [Google Scholar]
- Waese J, Fan J, Pasha A, Yu H, Fucile G, Shi R, Cumming M, Kelley LA, Sternberg MJ, Krishnakumar V, et al. (2017) ePlant: Visualizing and exploring multiple levels of data for hypothesis generation in plant biology. Plant Cell 29: 1806–1821 [DOI] [PMC free article] [PubMed] [Google Scholar]
- Wass MN, Fuentes G, Pons C, Pazos F, Valencia A (2011) Towards the prediction of protein interaction partners using physical docking. Mol Syst Biol 7: 469. [DOI] [PMC free article] [PubMed] [Google Scholar]
- Wilcoxon F. (1946) Individual comparisons of grouped data by ranking methods. J Econ Entomol 39: 269. [DOI] [PubMed] [Google Scholar]
- Winter D, Vinegar B, Nahal H, Ammar R, Wilson GV, Provart NJ (2007) An “Electronic Fluorescent Pictograph” browser for exploring and analyzing large-scale biological data sets. PLoS One 2: e718. [DOI] [PMC free article] [PubMed] [Google Scholar]
- Xiang Z. (2006) Advances in homology protein structure modeling. Curr Protein Pept Sci 7: 217–227 [DOI] [PMC free article] [PubMed] [Google Scholar]
- Yang T, Poovaiah BW (2000) Arabidopsis chloroplast chaperonin 10 is a calmodulin-binding protein. Biochem Biophys Res Commun 275: 601–607 [DOI] [PubMed] [Google Scholar]
- Yang Y, Qin Y, Xie C, Zhao F, Zhao J, Liu D, Chen S, Fuglsang AT, Palmgren MG, Schumaker KS, et al. (2010) The Arabidopsis chaperone J3 regulates the plasma membrane H+-ATPase through interaction with the PKS5 kinase. Plant Cell 22: 1313–1332 [DOI] [PMC free article] [PubMed] [Google Scholar]
- Yi H, Sardesai N, Fujinuma T, Chan C-W, Veena, Gelvin SB (2006) Constitutive expression exposes functional redundancy between the Arabidopsis histone H2A gene HTA1 and other H2A gene family members. Plant Cell 18: 1575–1589 [DOI] [PMC free article] [PubMed] [Google Scholar]
- Zhang Y, Gao P, Yuan JS (2010) Plant protein-protein interaction network and interactome. Curr Genomics 11: 40–46 [DOI] [PMC free article] [PubMed] [Google Scholar]
- Zhou W, Zhu Y, Dong A, Shen WH (2015) Histone H2A/H2B chaperones: From molecules to chromatin-based functions in plant growth and development. Plant J 83: 78–95 [DOI] [PubMed] [Google Scholar]