

Abstract
When vertebrates face acute stressors, their bodies rapidly undergo a repertoire of physiological and behavioral adaptations, which is termed the stress response. Rapid changes in heart rate and blood glucose levels occur via the interaction of glucocorticoids and their cognate receptors following hypothalamic‐pituitary‐adrenal axis activation. These physiological changes are observed within minutes of encountering a stressor and the rapid time domain rules out genomic responses that require gene expression changes. Although behavioral changes corresponding to physiological changes are commonly observed, it is not clearly understood to what extent hypothalamic‐pituitary‐adrenal axis activation dictates adaptive behavior. We hypothesized that rapid locomotor response to acute stressors in zebrafish requires hypothalamic‐pituitary‐interrenal (HPI) axis activation. In teleost fish, interrenal cells are functionally homologous to the adrenocortical layer. We derived eight frameshift mutants in genes involved in HPI axis function: two mutants in exon 2 of mc2r (adrenocorticotropic hormone receptor), five in exon 2 or 5 of nr3c1 (glucocorticoid receptor [GR]) and two in exon 2 of nr3c2 (mineralocorticoid receptor [MR]). Exposing larval zebrafish to mild environmental stressors, acute changes in salinity or light illumination, results in a rapid locomotor response. We show that this locomotor response requires a functioning HPI axis via the action of mc2r and the canonical GR encoded by nr3c1 gene, but not MR (nr3c2). Our rapid behavioral assay paradigm based on HPI axis biology can be used to screen for genetic and environmental modifiers of the hypothalamic‐pituitary‐adrenal axis and to investigate the effects of corticosteroids and their cognate receptor interactions on behavior.
Keywords: assay development, behavioral genetics, cortisol, custom nuclease, glucocorticoid receptor, HPA axis
1. INTRODUCTION
The stress response (SR) is an organism's response to actual or perceived threats to homeostasis.1, 2 Intense acute stress or prolonged stress that overwhelms the body's SR system is detrimental to an organism's health3 and associated with the onset or aggravation of a broad spectrum of psychiatric disorders such as major depressive disorder and post‐traumatic stress disorder.4, 5, 6, 7 The SR is mediated primarily by the hypothalamic‐pituitary‐adrenocortical (HPA) axis. Not only are alterations in HPA axis activity one of the most consistent findings among people with psychiatric disorders, but also normalization of HPA axis activity is a critical parameter that determines patients' prognoses and risk of relapse.8, 9, 10, 11, 12 To devise effective therapeutic strategies for complex psychiatric disorders, it is essential to advance our understanding regarding the pathways and genes that regulate the HPA axis and, in turn, how alterations in HPA axis activity may lead to psychiatric illness.
Evolved and conserved in vertebrates, activation of the HPA axis leads to the secretion of glucocorticoids (GCs) from the adrenal gland cortical layer in tetrapods13, 14 and from the interrenal cells (HPI axis) in teleost fish.15 GCs, such as cortisol in humans and zebrafish or corticosterone in rodents, are effector molecules that modulate the SR.16, 17, 18 GC signaling via cognate receptors (corticosteroid receptors [CRs]) mediates pleiotropic effects of SR in a tissue‐specific manner. CRs include type I (mineralocorticoid receptor [MR] encoded by nr3c2 [nuclear receptor subfamily 3 group c member 2]) and type II (glucocorticoid receptor [GR] encoded by nr3c1) receptors. There is a potentially yet‐to‐be‐identified group of membrane‐associated G‐protein‐coupled receptors (GPCRs).19, 20, 21 As members of nuclear receptor family transcription factors, GR and MR have been most extensively investigated as agents of gene expression changes. However, the temporal characteristics of GC activity point to biphasic actions of GC‐CR interactions. Slower responses involving changes in gene expression usually take more than 30 minutes to manifest and are known as the genomic response. Rapid nongenomic responses occur within minutes and involve various downstream signaling pathways.22, 23, 24 Mounting evidence suggests that nuclear receptor family transcription factors (GR and MR), as well as putative membrane‐associated receptors, play a role in rapid nongenomic GC signaling that is transcription‐independent.25, 26, 27
Although decades of research have provided fundamental understandings on HPA axis regulation, we still lack a sensitive behavioral assay paradigm that we can correlate the changes at the molecular level to those in behavior. The lack of investigative tools is particularly unmistakable in the rapid time domain where acute stressors evoke behavioral changes in living animals within seconds to minutes. Our group previously reported that larval zebrafish respond to hyperosmotic stress (application of sodium chloride [NaCl]) with increased frequencies of locomotion.28 The zebrafish, a teleost with conserved cortisol‐synthetic pathways and SR genes, serves as an effective model system for genetic and pharmacological manipulations to investigate the SR. Building on our prior findings, we have developed a sensitive behavioral assay that captures alterations in HPA axis activity with a quantifiable readout in order to establish a causal relationship between perturbed HPA axis activity and altered locomotion in response to mild salinity or light illumination changes. Here we show, using larval zebrafish, that rapid locomotor response to acute stressors requires cortisol secretion via the action of melanocortin receptor type 2 (mc2r; adrenocorticotropic hormone [ACTH] receptor) and depends on the canonical CR type II (GR) encoded by nr3c1. As such locomotor changes occur within minutes of stressor applications, our assay system provides an effective platform to screen for genetic, pharmacological or environmental modifiers of rapid responses of the HPA axis and will contribute to a better understanding of the role that rapid GC signaling plays in behavioral adaptation.
2. MATERIALS AND METHODS
2.1. Materials and equipment
All the materials and equipment used for this study are listed in the Supporting Information, Table S1.
2.2. Zebrafish husbandry
Wild‐type (WT) zebrafish (Danio rerio) were purchased from Segrest Farm and maintained in the Zebrafish Core Facility. Fish are handled following standard practices29 and guidelines from the Institutional Animal Care and Use Committee (IACUC) in the Mayo Clinic (A34513‐13‐R16, A8815‐15). Adult zebrafish are kept in a 9 L (25‐35 fish) or 3 L housing tanks (10‐15) at 28.5°C with a light/dark cycle of 14/10 hours. Zebrafish gonads begin developing around 15 dpf (day‐post fertilization).30 A multifactorial sexual differentiation process involving multiple genes and environmental factors takes place around 25 dpf and is considered completed around 60 dpf.31, 32, 33 Sexes are not determined in larval fish (5 dpf) in this study.
2.3. Production of custom light boxes
Light boxes are designed to provide illumination from the bottom (Mayo Clinic Division of Engineering). Light sources are LED diodes on a strip with white or infrared light emission. Light is diffused through white acrylic board to minimize reflection and maximize recording efficiency from a video camcorder (HDR‐CX560V, Sony Corp., New York) mounted at the top of the assay chamber. The dimension of a light box is 18.25″ × 20.625″. Multiple units of light boxes were purchased from Super Bright LEDs Inc. (St. Louis, Missouri) and engineered to have dual light sources and a control panel to adjust the intensity. White light illumination was adjusted to high (dual light assays) or medium (NaCl/cinnamon oil assays). The wavelength of white light is between 430 and 710 nm while that of infrared light was between 790 and 880 nm (Figure S1).
2.4. Locomotor behavioral assays: Light
The dual light assay takes advantage of fish visual responses and downstream behavior (Figure 1B). Data from De Marco et al, suggested that nontransgenic control fish that were first dark acclimated and then exposed to blue or yellow light, like transgenics with an optogenetically induced proopiomelanocortin (pomc) gene, resulted in increased locomotion and cortisol release.34 We applied these observations to our understanding that zebrafish are essentially blind in an environment illuminated only with infrared (IR) light,35, 36 hypothesizing that changing light illumination increases locomotion through activation of the HPI axis.
Figure 1.
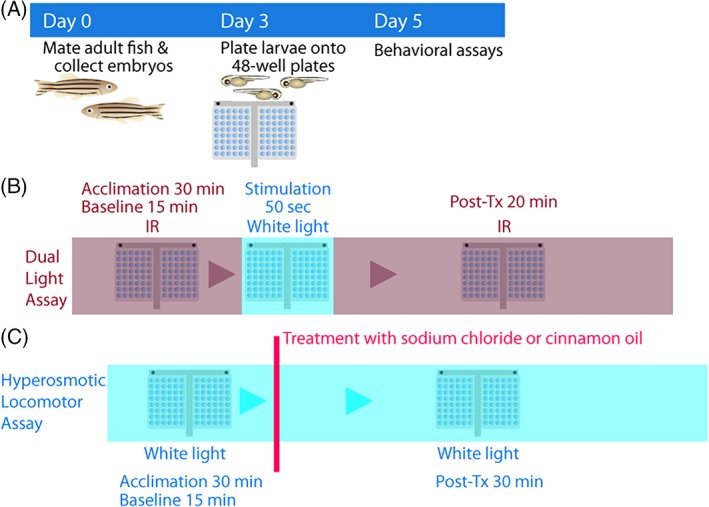
Stress assay paradigms. A, Experimental flow. Embryos are collected from natural spawning on day 0. Dead embryos are cleaned up and fresh embryo media is provided on 0 and 1 dpf. On 3 dpf, morphologically normal larval fish are plated onto 48‐well plates. On 5 dpf, stress assays are performed. B, Dual light assays. Larvae are acclimated for 30 minutes in infrared (IR) light. Baseline locomotor activity is recorded in IR for 15 minutes, followed by 50 seconds of white light stimulation. Posttreatment locomotor activity is recorded in IR for 20 minutes. C, Hyperosmotic stress assays. Larvae are acclimated for 30 minutes in white light. Baseline locomotor activity is recorded for 15 minutes, followed by addition of NaCl or cinnamon oil (noxious stimulant control). Posttreatment locomotor activity is recorded for 30 minutes. Initial 10 minutes were used for statistical analysis for cinnamon oil assays
Embryos are obtained through natural breeding and maintained in 100 × 15 mm petri dishes at 28.5°C in a light/dark cycle of 14/10 hours. Unfertilized embryos are eliminated on the same day (0 dpf) and any morphologically abnormal embryos the following day (1 dpf). Fresh 0.5× embryo media is provided (1 dpf).29 A single larva is placed into each well of a 48‐well plate with 500 μL of embryo media on 3 dpf. On 5 dpf, behavioral assays are performed because cortisol response to exogenous stimuli begins on 4 dpf (Figure 1A).37, 38 Larval zebrafish are acclimated in a pair of 48‐well plates in IR (850 nm) for 30 minutes, exposed to a brief illumination in white light (50 seconds), and then back in IR for 30 minutes (Figure 1B). The duration of white light illumination (50 seconds) was determined based on our experiments that 50 seconds of white light illumination consistently elicited a significantly increased locomotor response (Figure 2A). Their locomotor activity (total distance moved) is video‐recorded in IR for 15 minutes (baseline), white light for 50 seconds (treatment) and IR for 30 minutes (posttreatment). While the posttreatment recording is done for 30 minutes, the initial 20 minutes is used for analysis because the activity returns to baseline levels within 20 minutes. Video recordings (30 fps) in infrared light are performed in the “Nightshot” mode in the video camcorder without using its own infrared beam to eliminate glaring. Video recordings (30 fps) during white light treatment are performed with a regular recording mode. The recording modes were manually changed by pressing the button on the camcorder. The difference in locomotion after abrupt light change (IR‐white‐IR) during the posttreatment period (IR) is quantified with an in‐house developed locomotor tracking software.39 The output of the software is a CSV (comma separated values) file with locomotor response information, which was analyzed using R (R Foundation, Vienna, Austria) or IBM SPSS (IBM, Armonk, New York).
Figure 2.
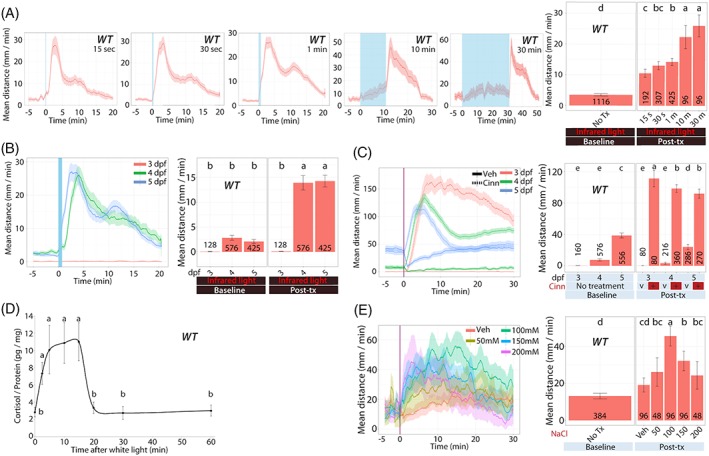
Wild‐type larval zebrafish response to acute stressors. We examined the acute response of larvae derived from natural crosses of WT zebrafish in several assays. A, Dual light assays with varied lengths of white light illumination (shown as blue bar with times 15, 30, 60, 600 or 1800 seconds). All larvae were 5 dpf. B, Dual light assays with larvae at different developmental stages (3, 4 or 5 dpf) after a 50‐second white light illumination. C, Cinnamon oil control assays on (3, 4 or 5 dpf) larvae. D, Whole‐body cortisol levels in larvae (5 dpf) after a 50‐second white light illumination. E, NaCl assays with varying NaCl concentrations on 5 dpf larvae (5 dpf). Line graphs in A, B, C and E show the rolling mean of the larval distance moved. The locomotor activity at each second is the mean distance fish moved during the preceding 60 seconds (mean ± 95%CI [shading]). Bar graphs in A, B, C and E show the mean distance larvae moved over the time course (mm/min; mean ± 95%CI) (baseline: 5 minutes; posttreatment: 20 minutes [light assays], 30 minutes [NaCl assays] or 10 minutes [cinnamon oil control assays]). The line graph in D shows pg cortisol per mg of total protein over time following a 50‐second white light exposure at time 0. In bar graphs, different letters indicate a significant difference between groups (Tukey's honest significant difference test, P < 0.05). The number of individual larvae measured is shown at the base of each bar graph
2.5. Locomotor behavioral assays: Sodium chloride and cinnamon oil
The hyperosmotic stress assay (application of NaCl) is based on fish osmoregulation (Figure 1C). Zebrafish, a freshwater teleost, depend primarily on cortisol signaling for osmoregulation.40, 41 We previously reported that WT larval zebrafish (4 dpf) display increased frequencies of locomotion (number of movement/min) in response to hyperosmotic stress28 and that knockouts of endocannabinoid signaling genes cnr1 and faah2a and several novel genetic loci discovered in a pilot forward genetic screen show altered locomotor response to hyperosmotic stress.42, 43 Others have observed that larval zebrafish swim away from an area with an increased osmolarity.44
A noxious stimulant assay, using cinnamon oil (7.4 μg/mL), has been used as a control paradigm to show that changes in locomotion are not due to a simple loss of locomotor capacity (Figure 1C). Cinnamon oil is a natural product that is detected by transient receptor potential ion channel ankyrin 1 (TRPA1) in mammals that responds to pain inducing noxious stimuli such as the active ingredients in garlic and wasabi.45 Cinnamon oil is a chemical irritant to zebrafish, detected by trpa1b expressed in sensory neurons that innervate skin cells, and elicits rapid escape response leading to increased locomotion.39, 46, 47
All preparation protocols are the same as the description in light assays. Larval zebrafish (5 dpf) are acclimated in a pair of 48‐well plates (400 μL embryo media/ell) in white light for 30 minutes and challenged with 100 mM NaCl by adding 100 uL of 500 mM NaCl (similarly, 5× working stock for cinnamon oil assays) (final volume of 500 uL; Figure 1C). Their locomotion is video‐recorded as baseline (15 minutes) and posttreatment (30 minutes) before and after NaCl (or cinnamon oil) application. As the purpose of cinnamon oil assay is to show that fish have locomotor response capacity, the initial 10 minutes are used for statistical analysis of cinnamon oil control assays. The final concentration of NaCl is 100 mM, and 7.41 μg/mL (~50 μM) for cinnamon oil. A matching vehicle (VEH) treatment is used: embryo media for NaCl and DMSO (dimethyl sulfoxide; 0.1% DMSO in embryo media; Sigma, St. Louis, Missouri) for cinnamon oil.
2.6. Statistical analysis
All data are reported as means ± 95% confidence interval (CI) unless otherwise stated. Statistical analysis is performed using R language and IBM SPSS Version 22. For multiple statistical comparisons among several treatment conditions, two‐way or three‐way mixed analysis of variance (mixed ANOVA) was used. In two‐way mixed ANOVA, there were a between‐subjects factor and a within‐subjects factor. For example, in dual‐light assays, the genotype (WT, het or hom) was a between‐subjects factor and the two time‐points of locomotor response measurement (labeled as exposure), obtained before or after the white light illumination exposure, were a within‐subjects factor. In three‐way mixed ANOVA, there were two between‐subjects factors and a within‐subjects factor. In hyperosmotic stress (NaCl) assays, the genotype (WT, het or hom) and the treatment condition (VEH vs NaCl) were two between‐subjects factors. The two time‐points of locomotor response measurement (labeled as exposure) obtained before or after the chemical treatment exposure were a within‐subjects factor. ANOVA analyses were followed by post‐hoc analysis (Tukey's honest significant difference test). For statistical comparisons involving two treatment groups, the Student's t test was used.
3. RESULTS
3.1. Conception of an acute stress assay paradigm
The behavioral assay comprises two stress paradigms and a noxious stimulant locomotor control paradigm. Acute stressors are chosen to capitalize on zebrafish biology that they are diurnal, freshwater fish. One stressor includes abrupt changes in light and the other includes an acute increase in salinity. A noxious stimulant, cinnamon oil, is used as a positive control for locomotor activity (Figure 1).
3.2. Abrupt light change increases locomotor response in WT larvae
Because larval zebrafish display clear phototaxic behaviors and wavelength preference,34, 48, 49 we hypothesized that abrupt changes in light illumination are unexpected disruptions that are interpreted as a stressor to induce HPI axis activity and locomotor response. To test the hypothesis, we challenged WT larvae (5 dpf) with abrupt changes in light conditions (IR‐white‐IR) with varying lengths of white light (15, 30, 60, 600 or 1800 seconds). Significant differences in locomotor response were observed based on the duration of (15, 30, 60, 600 or 1800 seconds) and exposure to (pre‐ vs postillumination) white light (two‐factor interaction; two‐way ANOVA; F 4,1111 = 15.45, P < 0.0005; Figure 2A). Locomotor response significantly increased post‐light exposure (single factor main effect; F 1,1111 = 796.41, P < 0.0005) and significantly differed based on the durations of white light (single factor; F 4,1111 = 42.33, P < 0.0005). After this set of experiments, 50 seconds of white light illumination were used throughout the project because it consistently elicited significantly increased locomotion.
In the ensuing experiments with 50‐seconds of white light illumination, we explored the effect of developmental stages. WT larvae on 4 and 5 dpf, but not on 3 dpf, showed a significantly increased locomotor activity during the postexposure period in infrared light (Figure 2B). Locomotor response significantly differed by the two‐factor interaction of the larval age (3, 4 or 5 dpf) and exposure (pre‐ vs postillumination) (F 2,1126 = 38.32, P < 0.0005). Locomotion was significantly different based solely on larval age (single factor; F 2,1126 = 52.99, P < 0.0005) or on exposure (single factor; F 1,1126 = 227.62, P < 0.0005).
When larval zebrafish on 3, 4 or 5 dpf were challenged with cinnamon oil, all age groups showed significantly increased locomotor response post cinnamon oil treatment (Figure 2C). Larval age resulted in significantly different locomotor response to treatment and exposure (three‐way interaction among larval age, treatment [VEH vs cinn], and the exposure [pre‐ vs postexposure to the treatment]; F 2,1286 = 16.29, P < 0.0005). All two‐way interactions were significant (time and treatment [F 1,1286 = 1037.71, P < 0.0005], time and larval age [F 2,1286 = 61.85, P < 0.0005] or larval age and treatment [F 2,1286 = 20.21, P < 0.0005]).
3.3. Abrupt light change increases whole‐body cortisol levels in WT larvae
After observing that abrupt light change increases locomotion in larval zebrafish from 4 dpf on, we tested whether such an increase is correlated with increased whole‐body cortisol levels. After a 50‐second white light illumination, larval fish (5 dpf) samples are collected at 2.5, 5, 10, 15, 20, 30 and 60 minutes after the white light illumination was initiated. The whole‐body cortisol levels were significantly increased at 2.5, 5, 10 and 15 minutes time points compared with that of the control group (0 minutes) (one‐way ANOVA; F 7,28 = 22.76, P < 0.0005; Figure 2D). The increased whole‐body cortisol levels returned to a value equivalent to that of control samples by 20 minutes. The significant increase in whole‐body cortisol levels from 2.5 to 15 minutes coincides with the increased locomotor activity that begins within 2 minutes of light stimulation and lasts for about 15 minutes (Figure 2A,B).
3.4. Salinity change increases locomotor response in WT larvae
Larvae (5 dpf) treated with NaCl display significantly increased locomotor activities and the response is concentration‐dependent (Figure 2E). Locomotor response significantly differed based on the salt concentration (VEH, 50, 100, 150 or 200 mM) and exposure (pre‐ vs postexposure to the treatment) (two‐way ANOVA; F 4,379 = 12.76, P < 0.0005). Locomotor response was significantly different based on the salt concentration (single factor; F 4,379 = 11.28, P < 0.0005) or on the exposure (single factor; F 1,379 = 135.55, P < 0.0005).
3.5. Rapid locomotor response to acute stressors is decreased in mc2r −/− mutant larvae
The association between increased locomotion and increased whole‐body cortisol levels suggests a link between cortisol signaling and the observed rapid locomotor response. We tested this hypothesis by blocking systemic GC synthesis by knocking out mc2r (ACTH receptor). We produced three mc2r exon 2 mutant zebrafish alleles (mc2r mn57, mc2r mn58 or mc2r mn59) (Table S2). All three alleles are frame‐shift mutations, two 4‐ and one 5‐base pair deletion, which occur at amino acid residue M106 (mn57), C105 (mn58) or M106 (mn59), resulting in scrambled amino acids after this position until truncating with a premature stop codon at amino acid residue 108, 108 or 123, respectively. When 5‐dpf larval zebrafish, obtained by in‐crossing heterozygous parents, were subject to abrupt light changes (15 minutes in IR, 50 seconds in white light, and 20 minutes in IR), mc2r homozygous mutant siblings showed a significantly decreased locomotor response compared with that of WT siblings (Figure 3A). Locomotor response was significantly different based on the genotype (WT, het or hom) and exposure (two‐way ANOVA; F 2,286 = 18.82, P < 0.0005). Locomotor response was significantly different based on the genotype (single factor; F 2,286 = 4.88, P = 0.008) or on the exposure (single factor; F 1,286 = 166.07, P < 0.0005). WT and het siblings showed the peak response within a 5‐minute window and a smaller peak between 10‐ and 15‐minute window after a 50‐second of white light illumination (Figure 3B). Both observed peaks are impacted by loss of mc2r.
Figure 3.
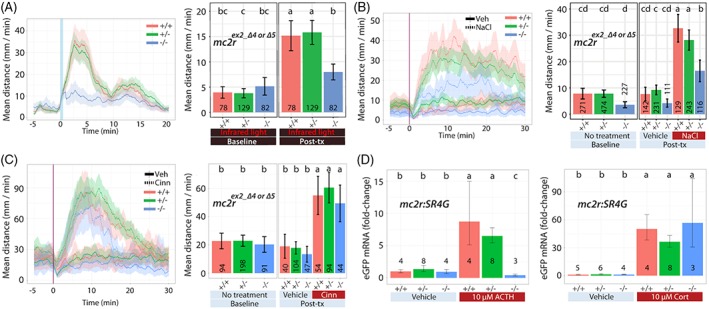
mc2r larvae: Locomotor response to acute stressors. We examined the acute response of larvae derived from natural crosses of mc2r +/− fish (WT [+/+], heterozygous [+/−] or homozygous [−/−]) in several assays. (A) Dual light assays, (B) NaCl assays, (C) cinnamon oil control assays and (D) treatment with ACTH or cortisol. The larvae in (D) carried a single copy of the SR4G transgene. Line graphs in A, B and C show the rolling mean of the larval distance moved (5 dpf). The locomotor activity at each second is the mean distance fish moved during the preceding 60 seconds (mean ± 95%CI [shading]). Bar graphs in A, B and C show the mean larval distance moved over the time course (mm/min; mean ± 95%CI) (baseline: 5 minutes; posttreatment: 20 minutes [light assays], 30 minutes [NaCl assays] or 10 minutes [cinnamon oil control assays]). Bar graphs in (D) show relative EGFP transcript levels compared with WT treated with vehicle. In bar graphs, different letters indicate a significant difference between groups (Tukey's honest significant difference test, P < 0.05). The number of individual larvae measured is shown at the base of each bar graph. SR4G: Stress responsive 4‐hour half‐life GFP
The necessity of mc2r‐driven systemic GC synthesis for rapid locomotor response was examined in the context of sudden salinity changes. When we challenged mc2r fish (WT, het or hom) with 100 mM NaCl, mc2r homozygous mutant siblings showed a severely decreased, near significant (P = 0.054), locomotor response compared with that of WT siblings (Figure 3B). Locomotor response was near significantly different based on the genotype, treatment (VEH vs NaCl) and exposure (three‐way ANOVA; F 2,966 = 2.93, P = 0.054). There were significant two‐way interactions in all combinations of two factors (genotype and exposure [F 2,966 = 3.89, P = 0.021], treatment and exposure [F 1,966 = 129.47, P < 0.0005] or genotype and treatment [F 2,966 = 4.13, P = 0.016]). These findings further show that GC synthesis and HPA axis output are critical factors for locomotor response to acute stressors.
To assure that the decrease in locomotion observed in mc2r homozygous mutants is a function of the acute SR rather than skeletomuscular defects, we performed cinnamon oil assays. Upon cinnamon oil challenge, mc2r homozygous mutants showed a comparable locomotor response to that of WT siblings for the first 10‐minute window, showing preservation of their locomotor capacity (Figure 3C). Locomotor response did not significantly differ based on the genotype, treatment (VEH vs cinn), and exposure (three‐way ANOVA; F 2,377 = 0.20, P = 0.821). Treatment effect on locomotor response was significant pre‐ or postexposure (two‐way ANOVA; F 1,377 = 41.53, P < 0.0005). Locomotor response was not significantly modified by other two way interactions (genotype and exposure [F 2,377 = 0.40, P = 0.668] or genotype and treatment [F 2,377 = 0.72, P = 0.489]). This shows that there was no difference in locomotor response across genotypes in response to the treatment (VEH vs cinn) pre‐ or postexposure during the initial 10‐minute window.
Since mc2r is the key receptor for on‐demand cortisol synthesis in response to ACTH signaling, we hypothesized that HPI axis activation in mc2r homozygous mutant fish is compromised due to decreased cortisol synthesis. To test the hypothesis, we generated an mc2r +/−:SR4G+/− transgenic zebrafish strain (mc2r heterozygous:SR4G transgene carrier) by crossing mc2r mn57 heterozygous fish with the stress reporter SR4G zebrafish strain (stress responsive 4‐hour half‐life green fluorescent protein [GFP]), which we have previously characterized and reported.50 Briefly, expression of short half‐life enhanced green fluorescent protein (EGFP) is driven by transcriptionally active GRs binding to synthetic glucocorticoid response elements (GREs). As a result, when stressed, SR4G fish produce EGFP and transcript levels can be used as a surrogate for HPI axis activation and activated GRs. We treated 5‐dpf larvae, obtained by in‐crossing mc2r mn57:SR4G+/− fish, with ACTH (10 μM) or cortisol (10 μM) and quantified the levels of EGFP transcripts with quantitative reverse transcription polymerase chain reaction (qRT‐PCR). Following ACTH treatment, EGFP transcript levels were significantly different based on the genotype (WT, het or hom) and treatment (VEH vs ACTH) (two‐way ANOVA; F 2,25 = 56.02, P < 0.0005; Figure 3D). In addition, ACTH‐treated WT siblings had a significantly higher level of EGFP transcripts compared with ACTH‐treated homozygotes (t test; genotype [WT]:treatment [ACTH] vs genotype [hom]:treatment [ACTH]; t = 16.34, P < 0.0005). On the contrary, in the cortisol experiment, whereas there was a significant two‐way interaction of genotype and treatment (VEH vs cortisol) (two‐way ANOVA; F 2,24 = 3.87, P = 0.035), there was no significant difference between WT and homozygous siblings in two group comparison (t test; genotype [WT]:treatment [CORT] vs genotype [hom]:treatment [CORT]; t = −0.73, P = 0.51).
3.6. Rapid locomotor response to abrupt light change is decreased in nr3c1 mutant zebrafish
After confirming that increased locomotor response to acute stressors is dependent, significantly or near significantly, on HPI axis activation via mc2r and subsequent GC signaling, we asked whether or not GC signal transmission requires the canonical GR (nr3c1). We generated canonical GR (nr3c1; CR type II) mutant zebrafish strains by targeting exon 2 (nr3c1 mn61 and nr3c1 mn62) or exon 5 (nr3c1 mn63, nr3c1 mn64 and nr3c1 mn65) of the nr3c1 gene with Transcription activator‐like effector nucleases (TALENs) (Table S2). Exon designation is based on transcript variant isoform 1. The frame‐shift mutations occur at amino acid residue A311 (mn61) or G305 (mn62), resulting in scrambled amino acids after the frame‐shift and a premature stop codon at amino acid residue 327 or 318 for exon 2 alleles, respectively. Exon 5 frameshifts occur at amino acid residue P495 (mn63), Q496 (mn64) or Q496 (mn65) and result in scrambled amino acids until reaching a premature stop at position 504, 504 or 507 for exon 5 alleles, respectively, when using the canonical transcription and start codon.
When 5‐dpf larvae were subject to abrupt light changes, nr3c1 homozygous mutant siblings (both exons 2 and 5) showed a significantly decreased locomotor response compared with that of WT siblings (Figure 4A,B). Locomotor response differed significantly based on the genotype and exposure (nr3c1 mn61 and nr3c1 mn62; exon 2; two‐way ANOVA; F 2,449 = 21.93, P < 0.0005). Locomotor response was significantly different based on the genotype (single factor; F 2,449 = 12.06, P < 0.0005) or exposure (single factor; F 1,449 = 779.59, P < 0.0005). Likewise, locomotor response (nr3c1 mn63, nr3c1 mn63 and nr3c1 mn63; exon 5) was significantly different based on the genotype and exposure (two‐way ANOVA; F 2,934 = 11.46, P < 0.0005). Locomotor response significantly differed based on the genotype (single factor; F 2,934 = 11.22, P < 0.0005) or exposure (single factor; F 1,934 = 606.71, P < 0.0005). The increase in locomotion in WT and het siblings occurs within 5 minutes after a 50‐second exposure to white light (Figure 4A,B). This observation supports that locomotor response to abrupt light change requires rapid GC‐GR signaling via the canonical GR (nr3c1).
Figure 4.
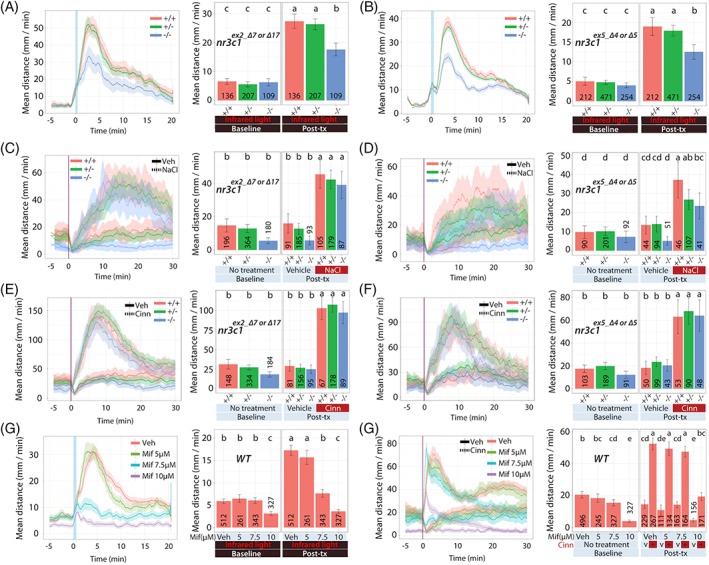
nr3c1 larvae: Locomotor response to acute stressors. We examined the acute response of larvae derived from natural crosses of nr3c1 +/− fish (WT [+/+], heterozygous [+/−] or homozygous [−/−]) in several assays. Dual light assays for (A) nr3c1 ex2 and (B) nr3c1 ex5. NaCl assays for (C) nr3c1 ex2 and (D) nr3c1 ex5. Cinnamon oil control assays for (E) nr3c1 ex2 and (F) nr3c1 ex5. (G) Dual light assays and (H) cinnamon oil assays following incubation with mifepristone, a GR antagonist. Line graphs in (A) to (H) show the rolling mean of the larval distance moved (5 dpf). The locomotor activity at each second is the mean distance fish moved during the preceding 60 seconds (mean ± 95%CI [shading]). Bar graphs in (A) to (H) show the mean distance larvae moved over the time course (mm/min; mean ± 95%CI) (baseline: 5 minutes; posttreatment: 20 minutes [light assays], 30 minutes [NaCl assays] or 10 minutes [cinnamon oil control assays]). In bar graphs, different letters indicate a significant difference between groups (Tukey's honest significant difference test, P < 0.05). The number of individual larvae measured is shown at the base of each bar graph
While the canonical GR (nr3c1) is required to respond to sudden light changes, it does not as dramatically impact changes measured following sudden salinity changes. When 5‐dpf larvae were challenged with 100 mM NaCl, nr3c1 ex5 homozygous mutants showed a near significant decrease in locomotor response compared with that of WT siblings, whereas nr3c1 ex2 homozygous siblings showed a moderate, but nonsignificant, reduction in locomotor response (Figure 4C,D). Locomotor response (nr3c1 ex2) did not differ based on the genotype, treatment (VEH vs NaCl), and exposure (three‐way ANOVA; F 2,734 = 0.1, P = 0.907). Locomotor response significantly differed based on treatment and exposure (two‐way ANOVA; F 1,734 = 185.94, P < 0.0005). Other factors did not significantly alter locomotor response (two‐way ANOVA; genotype and exposure [F 2,734 = 0.34, P = 0.713] or genotype and treatment [F 2,734 = 0.23, P = 0.80]). However, albeit not significant, locomotor response (nr3c1 ex5) differences were near significant based on the genotype, treatment and exposure (three‐way ANOVA; F 2,377 = 2.45, P = 0.088). Locomotor response significantly differed based on the treatment and exposure (two‐way ANOVA; F 1,377 = 62.14, P < 0.0005). Other factors did not significantly modify locomotor response (two‐way ANOVA; genotype and exposure [near significant; F 2,377 = 2.82, P = 0.061] or genotype and treatment [F 2,377 = 0.67, P = 0.51]). Locomotor response in nr3c1 exon 5 differed with a greater magnitude based on the genotype, treatment and exposure compared with that in nr3c1 exon 2.
Upon cinnamon oil challenge, nr3c1 homozygous mutants (both exons 2 and 5) showed a comparable locomotor response to that of WT siblings within the initial 10‐minute window, showing their locomotor capacity was preserved (Figure 4E,F). Locomotor response (nr3c1 ex2) to cinnamon oil challenges did not differ based on the genotype, treatment and exposure (three‐way ANOVA; F 2,660 = 2.06, P = 0.128). Locomotor response significantly differ based on the treatment and exposure (F 1,660 = 296.57, P < 0.0005). Other factors did not modify locomotor response (two‐way ANOVA; genotype and exposure [F 2,660 = 0.94, P = 0.392] or genotype and treatment [F 2,660 = 0.07, P = 0.932]). Similarly, locomotor response (nr3c1 ex5) did not differ based on the genotype, treatment and exposure (three‐way ANOVA; F 2,377 = 0.14, P = 0.869). Locomotor response significantly differed based on the treatment and exposure (two‐way ANOVA; F 1,377 = 87.91, P < 0.0005). Other factors did not modify locomotor response (two‐way ANOVA; genotype and exposure [F 2,377 = 0.61, P = 0.542] or genotype and treatment [F 2,377 = 0.15, P = 0.861]). The cinnamon oil assays for the alleles on nr3c1 ex2 and nr3c1 ex5 show that there was no difference in locomotion due to genotype in response to the treatment at pre‐ or postexposure, and that the locomotor capacity of these mutants was not impaired.
We hypothesized that, if decreased locomotor response to abrupt light change in nr3c1 homozygotes is dependent on nr3c1, a canonical GR antagonist, mifepristone (RU38486), would block the stressor stimulated locomotion in WT fish replicating our findings with nr3c1 loss‐of‐function alleles. Treating WT fish (5 dpf) with varying doses of mifepristone (5, 7.5 or 10 μM) resulted in significantly decreased locomotor responses at 7.5 μM, a dose that still maintained a rapid responsiveness to cinnamon oil (Figure 4G,H). At 5 μM, locomotor response was comparable to VEH‐treated fish whereas 10 μM mifepristone significantly decreased locomotion in both abrupt light change and cinnamon oil challenge.
In light assays, locomotor response significantly differed based on the mifepristone dose (VEH, 5, 7.5 or 10 μM) and exposure (two‐way ANOVA; F 3,1439 = 132.50, P < 0.0005). In addition, locomotion significantly differed based on the mifepristone dose (single factor; F 3,1439 = 107.82, P < 0.0005) or exposure (single factor; F 1,1439 = 508.30, P < 0.0005). Similarly, in cinnamon oil assays, locomotor response significantly differed based on the mifepristone dose, treatment (VEH vs cinn) and exposure (three‐way ANOVA; F 3,1387 = 16.30, P < 0.0005). Locomotion significantly differed based on all combinations of two‐way interactions (treatment and exposure [F 1,1387 = 561.21, P < 0.0005], mifepristone dose and exposure [F 3,1387 = 6.38, P < 0.0005] or mifepristone dose and treatment [F 3,1387 = 11.6, P < 0.0005]).
These outcomes show that 7.5 μM mifepristone, a dose that does not impact locomotor response to cinnamon oil challenges as compared with VEH‐treated fish (t test; mif dose [VEH]:treatment [cinn]:exposure [post] vs mif dose [7.5 μM]:treatment [cinn]:exposure [post]; t = −0.12, P = 0.91), inhibits locomotor response to light illumination changes (t test; mif dose [VEH]:exposure [post] vs mif dose [7.5 μM]:exposure [post], t = −13.24, P < 0.0005). These results show that genetic loss‐of‐function of the canonical nr3c1 and nr3c1 antagonist (mifepristone) treatment led to a similar behavioral response to acute light changes.
3.7. Rapid locomotor response to acute stressors is not decreased in nr3c2 mutants
We tested whether or not MR (CR type I) is required for rapid locomotor response. Using TALENs, we generated MR mutant zebrafish strains in exon 2 (nr3c2 mn66 and nr3c2 mn67) of the nr3c2 gene (Table S2). The frame‐shift mutations occur at amino acid residue E445 (mn66) or T444 (mn67), resulting in scrambled amino acids after the frame‐shift and a premature stop codon at amino acid residue 449 or 453, respectively, when using the canonical transcript and start codon. When 5‐dpf larvae were subject to abrupt light changes, nr3c2 homozygous mutant siblings showed a comparable locomotor response to that of WT siblings (Figure 5A). Locomotor response did not differ based on the genotype and exposure (two‐way ANOVA; F 2,431 = 0.22, P = 0.805). Locomotor response significantly increased across all genotype postexposure to white light (single factor; F 1,431 = 500.53, P < 0.0005). Locomotor response did not differ based on the genotype (single factor; F 2,431 = 0.65, P = 0.524).
Figure 5.
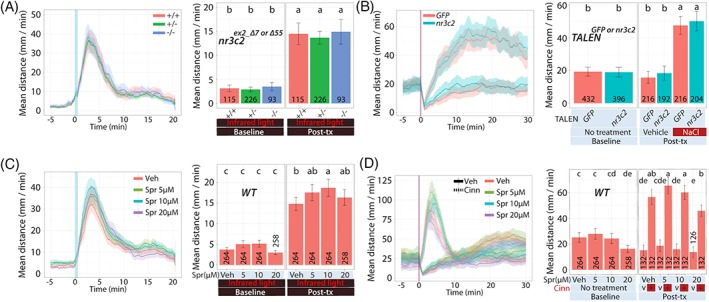
nr3c2 larvae: Locomotor response to acute stressors. We examined the acute response of larvae derived from natural crosses of nr3c2 +/− fish (WT [+/+], heterozygous [+/−] or homozygous [−/−]) or injected with high efficiency, bi‐allelic TALENs targeting GFP sequences or nr3c2 exon 2 in several assays. (A) Dual light assays for nr3c2 larvae. (B) NaCl assays for TALEN‐injected WT larvae. (C) Dual light assays or (D) cinnamon oil assays following incubation with spironolactone, a MR antagonist. Line graphs in (A) to (D) show the rolling mean of the larval distance moved (5 dpf). The locomotor activity at each second is the mean distance fish moved during the preceding 60 seconds (mean ± 95%CI [shading]). Bar graphs in (A) to (D) show the mean distance larvae moved over the time course (mm/min; mean ± 95%CI) (baseline: 5 minutes; posttreatment: 20 minutes [light assays] or 30 minutes [NaCl assays]). In bar graphs, different letters indicate a significant difference between groups (Tukey's honest significant difference test, P < 0.05). The number of individual larvae measured is shown at the base of each bar graph
Consistent with the results of germline mutant fish in dual‐light assays, when 5‐dpf WT larvae injected with high‐efficiency, biallelic TALENs targeting nr3c2 exon 2 were challenged with 100 mM NaCl, nr3c2 ex2_TALEN_inj fish showed a comparable locomotor response to that of WT siblings sham‐injected with GFP sequence targeting TALENs (Figure 5B). Locomotor response did not differ based on the injection reagent (VEH vs nr3c2‐targeting TALEN), treatment (VEH vs NaCl) and exposure (three‐way ANOVA; F 1,824 = 0.09, P = 0.77). Locomotor response significantly differed based on the treatment and exposure (two‐way ANOVA; F 1,824 = 163.72, P < 0.0005). Other factors did not alter locomotor response (two‐way ANOVA; injection reagent and exposure [F 1,824 = 1.44, P = 0.231] or injection reagent and treatment [F 1,824 = 0.027, P = 0.87]).
We hypothesized that, if locomotor response to abrupt light change does not require nr3c2, an MR antagonist, spironolactone, would not block the locomotion in WT fish replicating the finding. Treating WT larval fish (5 dpf) with varying doses of spironolactone (5, 10 or 20 μM) resulted in a slight, but significantly increased locomotor response at 10 μM that did not significantly change responsiveness to cinnamon oil (Figure 5C).
In light assays, locomotor response did not differ based on the drug dose (VEH, 5, 10 or 20 μM) and exposure (two‐way ANOVA; F 3,1046 = 1.57, P = 0.196). However, locomotor response differed based on the drug dose (single factor; F 3,1046 = 5.05, P = 0.002) or exposure (single factor; F 1,1046 = 788.06, P < 0.0005). In cinnamon oil assays, locomotor response significantly differed based on the drug dose, treatment and exposure (three‐way ANOVA; F 3,1042 = 2.94, P = 0.032). Locomotor response significantly differed based on the treatment and exposure (two‐way ANOVA; F 1,1042 = 471.83, P < 0.0005). Other two‐way interactions did not alter locomotor response (drug dose and exposure [F 3,1042 = 0.64, P = 0.587] or drug dose and treatment [F 3,1042 = 1.46, P = 0.224]).
At 5 through 20 μM of spironolactone applications, locomotor response to light illumination changes was comparable or slightly increased compared with that of VEH‐treated fish. Locomotor response to cinnamon oil challenges produced similar outcomes except that, at 20 μM, the locomotor response was significantly decreased (Figure 5C,D). This observation supports that nr3c2 is not necessary for locomotor response to abrupt light change at the doses that do not produce more generalized effects on locomotion (shown by response to cinnamon oil challenge comparable to VEH‐treated fish). These results show that genetic loss‐of‐function of the canonical nr3c2 and nr3c2 antagonist (spironolactone) treatment led to a similar behavioral response pattern to acute light changes in that the locomotion is not affected or slightly increased (Figure 5A,C).
4. DISCUSSION
We showed that locomotor response to abrupt changes in light illumination or salinity requires HPI axis function, including activation of GC synthesis via mc2r (ACTH receptor) and canonical GR (nr3c1) activity. The locomotor response did not require MR (nr3c2). Knocking out MR leads to a slightly increased locomotor trend in nr3c2 exon 2 homozygous siblings. The locomotor response phenotypes of homozygous mutant fish in CR type II (GR) or I (MR) are replicated in mifepristone (GR antagonist) or spironolactone (MR antagonist) treatment, respectively, leading to a significant decrease or increase in locomotion. The behavioral assay in this study sensitively reflects perturbations in HPI axis. Thus, the assay paradigm may be useful to screen for genetic or environmental modifiers of rapid responses of the HPI axis and investigate the role that rapid GC signaling plays in behavioral adaptation.
4.1. Different variables produce diverse locomotor profiles, including developmental stage, modality of the stressor and intensity of the stressor
Locomotor response varied depending on the developmental stages. Whereas larval fish at 3 dpf did not show increased locomotion following white light illumination, larvae at 4 or 5 dpf responded to the changes with significantly increased locomotion (Figure 2B). This agrees with the finding that zebrafish do not robustly respond to exogenous stimuli with cortisol secretion until 4 dpf on (96 hpf) even though the HPI axis begins developing after 2 dpf.37, 38 However, when larvae on 3 dpf were challenged with cinnamon oil, they showed the most robust locomotor response compared with larvae on 4 and 5 dpf (Figure 2C). Such difference shows that locomotor response to different stimuli may develop at different schedules.
Different environmental stressors (light or salinity) produced distinct locomotor profiles. While abrupt light changes elicited a faster increase in locomotion peaking in 5 minutes after light change, abrupt salinity changes led to increased locomotion that peaked at about 15 minutes. Different sensory pathways are likely to determine the response profile. Changes in illumination are detected through the visual system while those in osmolarity are via osmoregulatory systems.41, 51 Whereas sensing changes in illumination can be immediate, the time domain required to sense changes in osmolarity outside and inside the body and to initiate physiological and behavioral responses such as ion filtration changes and locomotion takes longer. A noxious stimulus (cinnamon oil) produces a distinct locomotor profile to those produced by light illumination and salinity change. While illumination or mild salinity changes are not threatening to zebrafish survival, stimulations by cinnamon oil may be perceived threatening as it is sensed through the trpa1b channel that mediates noxious and painful stimuli in mammals (TRPA1).45 A unique feature of locomotor responses to cinnamon oil challenges is that the response quickly rose regardless of the genotype and more rapidly subsided in homozygous mutants. For instance, whereas the locomotor response of all homozygous mutants (mc2r or nr3c1 ex5) to cinnamon oil challenge was comparable to that of WT and het siblings for the first 10 to 15 minutes periods following treatment, the locomotor response in homozygous mutants did not last as long as that of WT or het siblings did (Figure 3C,F). This quicker tapering of locomotor response in homozygotes may be indicative of a potential involvement of HPA axis activation and GC signaling in the continued response to a noxious stimulus. Robust locomotor response to cinnamon oil during the early window (initial 10 minutes) shows that mc2r or nr3c1 homozygous mutant siblings have intact locomotor capability.
Varying lengths of white light illumination produced distinct locomotor profiles. Longer illuminations (10 or 30 minutes) produced increased locomotion compared with shorter illuminations (15, 30 or 60 seconds) (Figure 2A). Varying concentrations of NaCl produce quantitatively (more or less) and temporally (quicker or slower) different responses. The stimulus that we chose was 100 mM NaCl. Seawater is at about 600 mM and freshwater in rivers is at about 1 mM NaCl.52, 53 The salinity in a zebrafish body is about 150 mM, which is similar to that in humans.54, 55 Although the concentration (100 mM) in our stimulation is higher than that of freshwater, it is far less than that of seawater and below the physiological salinity in zebrafish body. This would not reverse the normal physiology of zebrafish in which the animal maintains osmotic homeostasis in hypotonic environments.56, 57 Such concentration of 100 mM salt is not likely to be overwhelming. In NaCl dose curve experiments, 200 mM NaCl challenge induced a quicker response reaching the peak response before 10 minutes (Figure 2E). NaCl concentrations greater than or equal to 150 mM led to a decreased total locomotor response, compared with those challenged with 100 mM NaCl, which may indicate physiologically detrimental effects at those higher concentrations (150 or 200 mM).
4.2. Whole‐body cortisol levels are congruent with locomotor response profiles
The temporal profiles of locomotion coincided with changes in whole‐body cortisol levels. Light changes induced significantly increased cortisol levels from 5 to 15 minutes after the white light illumination (Figure 2) while 100 mM NaCl application led to peak cortisol levels at 20 minutes.50 In addition, the rapid decrease in cortisol levels between 15 and 20 minutes in dual light assays (Figure 2C) implies that there is a mechanism that quickly degrades or excretes cortisol enabling a tight regulation of cortisol availability. In light assays that utilized varying lengths of white light illumination, locomotor response peak was significantly higher when longer illuminations occurred (Figure 2A). It will be of interest to test cortisol levels or mutant behavior following longer light exposures. After high levels of cortisol are detected, gradual decrease in cortisol levels is reported in zebrafish that takes between 30 minutes and 2 hours in larval or adult zebrafish.58, 59 The rate of cortisol degradation in vivo is not well established due to the differences in cortisol quantification (eg, amount per embryo or amount in the trunk of an adult fish). In our studies, the hyperosmotic stress assays with 100 mM NaCl showed a degradation rate of about 25 pg body cortisol per min50 while the dual assays showed approximately 2.5 pg body cortisol per min (Figure 2D). The mechanisms that regulate cortisol bioavailability may be an important area of research in the context of neuropsychiatric disorders.
4.3. mc2r knockouts show more pronounced phenotypes compared with those of CR knockouts
mc2r homozygous knockouts showed severely decreased locomotor responses when challenged with acute stressors (Figure 3A,B). On the other hand, nr3c1 sibling embryos showed more nuanced outcomes. In light assays, significant interactions between the genotype (WT, het or hom) and exposure (pre‐ vs postexposure) were found in both nr3c1 ex2 and nr3c1 ex5. However, in hyperosmotic stress assays, there was no significant three‐way interaction among the genotype (WT, het or hom), treatment type (VEH vs NaCl) or exposure (pre‐ vs postexposure) in both nr3c1 ex2 and nr3c1 ex5. However, the P values were 0.088 for nr3c1 ex5 and 0.907 for nr3c1 ex2, showing that there is a stronger interaction effect in nr3c1 ex5.
The difference between mc2r and nr3c1 knockouts may result from the fact that mc2r is the primary receptor for systemic on‐demand cortisol synthesis. mc2r is a member of melanocortin receptor family, expressed in interrenal cells at high levels and detectable in adipose tissue.17, 60 mc2r gene products specifically bind to ACTH while other melanocortin receptor members (eg, mc1r, mc3r‐mc5r) bind to melanocyte stimulating hormone as well as ACTH.61, 62, 63 mc2r initiates corticosteroid synthesis by increasing cyclic adenosine monophosphate (cAMP) levels, which in turn increases free cholesterol levels available for mitochondrial transport where corticosteroid synthesis occurs.64 Thus, significant loss of cortisol may result in decreased locomotor phenotype.
However, this ACTH‐mc2r‐cAMP‐dependent signaling is not the only biosynthetic pathway for cortisol. There are multiple pathways and hormones that stimulate cortisol synthesis in distinct contexts. For osmoregulation, atrial natriuretic peptide, urotensin I and II, renin and angiotensin I and II have shown to result in increased cortisol levels,65, 66, 67 each of which appears to perform its biological functions in coordination with or independent of the HPI axis. For example, angiotensin II modulates osmoregulatory processes (ie, sodium uptake) with or without cortisol, indicating redundant pathways and complex regulatory landscape.68, 69, 70, 71 For local immunomodulation, extra‐adrenal cortisol synthesis has been found in various tissues such as the skin and intestine.72, 73, 74 Thus, it is likely that mc2r homozygous mutants still have certain levels of cortisol. However, HPI axis activation via mc2r appears to be indispensable in rapid locomotor response to acute stressors based on our findings that decreased locomotor phenotypes of mc2r are reproduced in two distinct stressors (light illumination vs salinity changes) mediated through different biological processes (visual system vs osmoregulation). Therefore, quantifying cortisol levels in mc2r, nr3c1 and nr3c2 homozygous mutants in future investigations will be important to elucidate the extent to which cortisol levels contribute to behavioral response to acute stressors.
Another possible explanation for the observed difference between mc2r and nr3c1 knockouts is that the mc2r gene has a simpler regulatory environment than nr3c1 does. mc2r has two exons and only exon 2 is protein coding. The Mc2r protein is a trans‐membrane protein with only one known transcript and translational isoform.62, 75, 76 In contrast, NR3C1 in humans has eight translated exons (exon 2 through 9) and nine untranslated alternative first exons, each with a different promoter. There are also two exon 9s producing the 3′ splice variants, GRα or GRβ transcript.77, 78 Each GRα or GRβ has seven known alternative translational isoforms.79, 80 The GR gene product forms a cytoplasmic complex with chaperone proteins, is involved in various signaling pathways, and functions as a transcription factor.81, 82 The complex environment regulating GR function points to the possibility that diverse Nr3c1 isoforms may play differential roles in distinct tasks, tissues or neural circuits. Although all the transcriptional and translational isoforms are not investigated in zebrafish yet, nr3c1 has a strong homology to NR3C1 and produces alternative α and β transcripts.83 In this context, our frame‐shift mutations in either exon 2 or 5 might not completely eliminate all the gene products. For example, alternative translational isoforms downstream of a premature stop codon may still produce functional proteins that play a role in our behavioral assays. This line of thought is supported by the fact that three‐way interaction was close to statistical significance in nr3c1 ex5 (P = 0.088) compared with that in nr3c1 ex2 (P = 0.907) in our hyperosmotic assays. Moreover, in addition to alternative promoters, genes often have alternative splicing that results in skipping of an exon(s) with an indel, which is a possibility considering that there is a GR‐P transcript in humans that skips exons 8 and 9.78 Still, it is also likely that hyperosmotic assays that use salinity changes as the stimulant may involve more organ systems, physiologic processes, and signaling pathways involved in osmotic homeostasis, making the locomotor response to NaCl more variable compared with dual‐light assays.
4.4. GR may play a role during development, signaling or both
When GR (nr3c1) is genetically knocked out or pharmacologically blocked (mifepristone) between 4 and 5 dpf, the locomotion is significantly attenuated in light assays. Two alternative hypotheses for this observation may be proposed. One is that GR is needed during development to establish the tone of the HPA axis and the other being GR is needed for direct and rapid signaling while the locomotor response is occurring. In rodent models, GR knockout animals often display depression‐like behavioral changes, as well as neuroendocrine abnormalities.84, 85 In general, when GR is knocked out, feedback inhibition by GC is impaired and a constitutively high secretion of CRH, ACTH and cortisol ensues, which in turn leads to downregulation of GC receptors, GC resistance and blunted SR to external stimuli.3 In our assay paradigm, the subject fish are 5 dpf, and are naive to stress. Loss of GR in these fish during the development of the HPI axis may result in altered functions of the axis and SR. To test the developmental hypothesis against the alternative hypothesis that GR is needed for direct and rapid signaling during the locomotor response, conditional zebrafish strains would be useful to knockout or rescue GR at specific time points before or after day 5 to investigate the effects of loss of GR during HPI axis development.
4.5. Absence of phenotypes in MR knockouts calls for in‐depth investigations
When MR is genetically knocked out or pharmacologically blocked (spironolactone; Spr) between 4 and 5 dpf, the locomotion is comparable to that of WT or significantly increased in light assays, respectively. The small but significantly increased locomotor response in Spr treatment (Figure 5C) indicates that there is a possibility that the MR knockout allele that we generated might not be a complete loss‐of‐function allele. The current MR homozygous mutants (nr3c2 −/−) are generated from frameshift mutations (7 or 55 del) in exon 2. There may be some residual gene function remaining from alternative transcripts or translational isoforms, like other steroid hormone receptor family members including membrane progesterone receptors,86, 87 membrane thyroid hormone receptors88 and nr3c1.80 As Spr treatment yielded an increased locomotor phenotype, we hypothesize that a complete deletion or loss of nr3c2 gene function would result in significantly increased locomotor response in homozygous mutants.
On the other hand, increased locomotion per se does not fully ascertain the nature of Spr action on MR. Spr has been shown to be a zebrafish MR agonist in cell culture studies where a reporter construct was used to quantify the activity levels, while being an antagonist for human MR.89, 90 Still, in primary trout gill epithelium culture, Spr showed MR antagonist properties.91 Spr effects are also species dependent. In gill explants, Spr could inhibit cortisol‐stimulated Na+‐K+‐ATPase mRNA expression in ionocytes in Atlantic salmon92 and in striped bass, but not in tilapia.93 In these studies, the action of Spr on various teleost MRs was characterized in the context of osmoregulation. However, in teleost fish, MR is highly expressed in the brain but not in osmoregulatory organs such as the gill, kidney and gut.94, 95 In addition to such expression patterns, it has been well established that cortisol in teleosts functions as both GC and mineralocorticoid, governing both metabolism and osmoregulation through GR and MR.41, 71, 96, 97 Therefore, it is difficult to draw any conclusions on what the absence of phenotypes in MR genetic knockout or what increased locomotion in response to Spr treatment means. Currently, more investigations are needed to determine whether Spr increased locomotor response through agonistic or antagonistic interactions with MR. In tetrapods, MR is highly expressed in the limbic areas of the brain, has a 10‐fold higher affinity for GCs than the canonical GR, and may be plasma membrane associated in mammals.98, 99 Membrane‐localized MRs display 10‐ to 20‐fold lower affinity to cortisol compared with nuclear MR despite encoded by the same gene, Nr3c2, in mice,100, 101 implying isoforms or differential conformations of the same gene product. It is tempting to speculate that Spr effects on MR may be different depending on the isoforms or conformational arrangements of the MR. Similarly, high expression of MR in the brain in teleosts implies its critical roles in the nervous system including the SR.102, 103 It will be important to look into whether or not there are any compensatory mechanisms that mask the loss of MR functions using our assay platform.
4.6. Studying rapid GC signaling in animals may provide insights into SR
Nongenomic GC signaling drives rapid behavioral changes via the central nervous system within minutes of stimulation, which range from reproductive behavior to response to novel environments. These behavioral changes are observed in a variety of vertebrate species such as amphibians,104, 105 birds106, 107 and rodents108, 109 and exemplify the conserved nature of rapid action of GCs and their cognate receptors in animal behaviors. In amphibians (rough‐skinned newts), GC signaling that rapidly reduces male reproductive behavior is mediated via a population of medullary neurons in the brainstem.110 In many species, neural tissues and pathways driving those adaptive behavioral changes remain to be identified. We investigated the essential role of rapid GC signaling in the context of locomotor responses to acute changes in the environment. Our findings show that rapid locomotor response is an adaptive response dependent on HPI axis activation and the canonical GR.
At the cellular level, nongenomic GC‐CR signaling rapidly alters various aspects of neuronal physiology and functions. GC signaling swiftly (seconds‐minutes) modulates membrane potential, firing rates,111, 112 ion conductance and intracellular Ca2+ levels.111, 113, 114 GC signaling decreases glutamatergic inputs and increases GABAergic inputs to postsynaptic peptidergic neurons in the paraventricular nucleus (PVN) of the hypothalamus. Such decrease and increase of glutamatergic and GABAergic inputs are mediated by retrograde release of endocannabinoid and neuronal nitric oxide, respectively.115, 116, 117 Some of these findings have been replicated in animal models, yet it needs to be investigated what the neuronal changes observed in vitro mean in the context of adaptive SR. Our assay system and what we are learning from modeling stress in zebrafish will be a useful platform to screen for such neural pathways and molecular components. In fact, we have identified several genetic loci that alter the rapid locomotor response to salt challenge including novel genes discovered in a pilot screen of random insertional mutants43 and targeted knockouts of cannabinoid receptor 1 (cnr1) or fatty acid amide hydrolase 2a (faah2a).42
4.7. Multiple mutant strains validate observed phenotypes
Customizable nucleases generated frameshift mutations at target loci. Three different mc2r mutant alleles, five different nr3c1 mutant alleles (two in exon 2 and three in exon 5), and two different nr3c2 mutant alleles were isolated (Table S2). Each mutant strain was independently maintained as a heterozygous allele for more than four generations because zebrafish do not tolerate inbreeding and resulting homozygosity well. Homozygous siblings were only produced by in‐crossing heterozygous parents for each experiment. The observed behavioral phenotypes of homozygotes in each gene were reproduced in each allele and in trans‐heterozygotes. In addition, the majority of the behavioral assays were performed after three generations of out‐breeding (F4 generation or later) except for a few hyperosmotic stress assays conducted with mc2r F2's or nr3c2 TALEN‐injected somatic mutants. The multiple alleles and extensive outbreeding in this study render strong support that the phenotypes result from the loss of function of the targeted gene and not from any off target or genetic bystander effects.
CONFLICTS OF INTEREST
The authors declare no conflicts of interest.
Author contributions
K.J.C. conceived research; K.J.C., H.B.L., T.L.S., and A.N.S. designed experiments; H.B.L., T.L.S., A.N.S., J.L.G., M.R.S., R.P.C., and R.M.U. performed behavioral assays; H.B.L., T.L.S., A.N.S., J.L.G., R.G.K.II, D.C.J., R.P.C., B.D., M.O.P., C.L.D., and B.C.B. performed molecular biology; H.B.L., T.L.S., and A.N.S. performed all other experiments; H.B.L., T.L.S., A.N.S., and K.J.C. analyzed data; H.B.L. and K.J.C. wrote the manuscript.
Supporting information
Appendix S1. Supplementary materials and methods.
Table S1. Materials
Table S2. Zebrafish mutant variants in the paper
Table S3. Transcription activator‐like effector nuclease target sequences
Table S4. Reagents for restriction fragment length polymorphism (RFLP) genotyping and allele specific qPCR (ASQ) genotyping
Table S5. Locomotor response statistics of larval zebrafish: Light assays and NaCl assays
Table S6. Locomotor response statistics of larval zebrafish: Cinnamon oil assays
Table S7. Whole‐body cortisol level statistics after 50‐second white light illumination
Table S8. Statistics of activated glucocorticoid receptor transcripts (EGFP transcript levels)
Figure S1. Spectrograms of light illumination. The intensities of white or infrared light were measured at each wavelength using a miniature spectrometer (STS‐VIS or STS‐NIR; Ocean Optics, Inc.). The graphs were generated by OceanView spectroscopy software (ver. 1.5.0; Ocean Optics, Inc.). (A) White light at the high intensity setting of the Light Box shows the wavelength distribution between approximately 430 to 710 nm with the peak intensity level at around 1300. White light at the high intensity was used for white light illumination during the dual light assays. (B) White light at the medium intensity setting in the Light Box shows the same wavelength distribution with the decreased peak intensity at around 650. White light at the medium intensity was used as white light illumination during the hyperosmotic (NaCl) or cinnamon oil assays. (C) Infrared light at the high intensity shows the wavelength distribution between approximately 790 and 880 nm with the peak intensity level at around 450. Infrared light was used during the dual light assay
ACKNOWLEDGMENTS
We thank for their advice on experiments: Thesis advisory committee (Stephen C. Ekker, PhD, John R. Henley, PhD, Joseph A. Murray, MD, Robin Patel, MD, Susannah J. Tye, PhD) for Han B. Lee, zebrafish model seminar group (Christopher K. Pierret, PhD, Lisa A. Schimmenti, MD, Caroline R. Sussman, PhD, Shizhen [Jane] Zhu, MD, PhD), and Neuroscience Program (Allan J. Bieber, PhD, DooSup Choi, PhD, John D. Fryer, PhD, Pamela J. McLean, PhD, Owen A. Ross, PhD, Isobel A. Scarisbrick, PhD). For zebrafish husbandry: Mayo Clinic Zebrafish Core Facility (Tammy M. Greenwood, MS, MBA, Danielle E. Hunter, Devin B. Copley, Casey M. Phillips), Mayo Clinic Gene Editing Core (Camden L. Daby, Melissa S. McNulty, MS). For engineering light boxes: Mayo Clinic Division of Engineering (Allen K. Rech, PMP, Shaun A. Herring, Roger J. Mahon, Daniel J. [Clay] Mangiameli). For literature search: Julie A. Swenson and other Mayo Clinic Library staff. For funding this project: National Institute of General Medical Sciences (GM63904), National Institute of Diabetes and Digestive and Kidney Diseases (DK84567), National Institute on Drug Abuse (DA032194) and Mayo Clinic Center for Cell Signaling in Gastroenterology Pilot and Feasibility Award. For reviewing the manuscript: Louis El Khoury, PhD, Noriko Ichino, PhD, and Jennifer M. Reiman, PhD.
Lee HB, Schwab TL, Sigafoos AN, et al. Novel zebrafish behavioral assay to identify modifiers of the rapid, nongenomic stress response. Genes, Brain and Behavior. 2019;18:e12549. 10.1111/gbb.12549
Present address Biswadeep Das, School of Biotechnology, KIIT University, Odisha, India.
Funding information National Institute of Diabetes and Digestive and Kidney Diseases, Grant/Award Number: DK84567; National Institute of General Medical Sciences, Grant/Award Number: GM63904; National Institute on Drug Abuse, Grant/Award Number: DA032194; Mayo Clinic
Han B. Lee and Tanya L. Schwab contributed equally to this study.
REFERENCES
- 1. Selye H. A syndrome produced by diverse nocuous agents. Nature. 1936;138(3479):32‐32. 10.1038/138032a0. [DOI] [PubMed] [Google Scholar]
- 2. Selye H. Stress and the general adaptation syndrome. Br Med J. 1950;1(4667):1383‐1392. [DOI] [PMC free article] [PubMed] [Google Scholar]
- 3. Chrousos GP. Stress and disorders of the stress system. Nat Rev Endocrinol. 2009;5(7):374‐381. 10.1038/nrendo.2009.106. [DOI] [PubMed] [Google Scholar]
- 4. Shin LM, Liberzon I. The Neurocircuitry of fear, stress, and anxiety disorders. Neuropsychopharmacology. 2009;35(1):169‐191. 10.1038/npp.2009.83. [DOI] [PMC free article] [PubMed] [Google Scholar]
- 5. Gold PW. The organization of the stress system and its dysregulation in depressive illness. Mol Psychiatry. 2015;20(1):32‐47. 10.1038/mp.2014.163. [DOI] [PubMed] [Google Scholar]
- 6. Lupien SJ, McEwen BS, Gunnar MR, Heim C. Effects of stress throughout the lifespan on the brain, behaviour and cognition. Nat Rev Neurosci. 2009;10(6):434‐445. 10.1038/nrn2639. [DOI] [PubMed] [Google Scholar]
- 7. Yehuda R, Hoge CW, McFarlane AC, et al. Post‐traumatic stress disorder. Nat Rev Dis Primers. 2015;1:15057 10.1038/nrdp.2015.57. [DOI] [PubMed] [Google Scholar]
- 8. Heuser I, Yassouridis A, Holsboer F. The combined dexamethasone/CRH test: a refined laboratory test for psychiatric disorders. J Psychiatr Res. 1994;28(4):341‐356. [DOI] [PubMed] [Google Scholar]
- 9. Holsboer F. The corticosteroid receptor hypothesis of depression. Neuropsychopharmacology. 2000;23(5):477‐501. 10.1016/S0893-133X(00)00159-7. [DOI] [PubMed] [Google Scholar]
- 10. de Kloet ER, Joels M, Holsboer F. Stress and the brain: from adaptation to disease. Nat Rev Neurosci. 2005;6(6):463‐475. 10.1038/nrn1683. [DOI] [PubMed] [Google Scholar]
- 11. Pariante CM, Lightman SL. The HPA axis in major depression: classical theories and new developments. Trends Neurosci. 2008;31(9):464‐468. 10.1016/j.tins.2008.06.006. [DOI] [PubMed] [Google Scholar]
- 12. Otte C, Gold SM, Penninx BW, et al. Major depressive disorder. Nat Rev Dis Primers. 2016;2:16065 10.1038/nrdp.2016.65. [DOI] [PubMed] [Google Scholar]
- 13. Grassi Milano E, Basari F, Chimenti C. Adrenocortical and adrenomedullary homologs in eight species of adult and developing teleosts: morphology, histology, and immunohistochemistry. Gen Comp Endocrinol. 1997;108(3):483‐496. 10.1006/gcen.1997.7005. [DOI] [PubMed] [Google Scholar]
- 14. Herman JP, McKlveen JM, Ghosal S, et al. Regulation of the hypothalamic‐pituitary‐adrenocortical stress response. Compr Physiol. 2016;6(2):603‐621. 10.1002/cphy.c150015. [DOI] [PMC free article] [PubMed] [Google Scholar]
- 15. Wendelaar Bonga SE. The stress response in fish. Physiol Rev. 1997;77(3):591‐625. [DOI] [PubMed] [Google Scholar]
- 16. Hanke W, Kloas W. Comparative aspects of regulation and function of the adrenal complex in different groups of vertebrates. Horm Metab Res. 1995;27(9):389‐397. 10.1055/s-2007-979986. [DOI] [PubMed] [Google Scholar]
- 17. To TT, Hahner S, Nica G, et al. Pituitary‐interrenal interaction in zebrafish interrenal organ development. Mol Endocrinol. 2007;21(2):472‐485. 10.1210/me.2006-0216. [DOI] [PubMed] [Google Scholar]
- 18. Xiong F, Zhang L. Role of the hypothalamic‐pituitary‐adrenal axis in developmental programming of health and disease. Front Neuroendocrinol. 2013;34(1):27‐46. 10.1016/j.yfrne.2012.11.002. [DOI] [PMC free article] [PubMed] [Google Scholar]
- 19. Orchinik M, Murray TF, Franklin PH, Moore FL. Guanyl nucleotides modulate binding to steroid receptors in neuronal membranes. Proc Natl Acad Sci USA. 1992;89(9):3830‐3834. 10.1073/pnas.89.9.3830. [DOI] [PMC free article] [PubMed] [Google Scholar]
- 20. Guo Z, Chen YZ, Xu RB, Fu H. Binding characteristics of glucocorticoid receptor in synaptic plasma membrane from rat brain. Funct Neurol. 1995;10(4–5):183‐194. [PubMed] [Google Scholar]
- 21. Haller J, Mikics É, Makara GB. The effects of non‐genomic glucocorticoid mechanisms on bodily functions and the central neural system. A critical evaluation of findings. Front Neuroendocrinol. 2008;29(2):273‐291. 10.1016/j.yfrne.2007.10.004. [DOI] [PubMed] [Google Scholar]
- 22. Tasker JG, Di S, Malcher‐Lopes R. Rapid glucocorticoid signaling via membrane‐associated receptors. Endocrinology. 2006;147(12):5549‐5556. 10.1210/en.2006-0981. [DOI] [PMC free article] [PubMed] [Google Scholar]
- 23. de Kloet ER, Karst H, Joels M. Corticosteroid hormones in the central stress response: quick‐and‐slow. Front Neuroendocrinol. 2008;29(2):268‐272. 10.1016/j.yfrne.2007.10.002. [DOI] [PubMed] [Google Scholar]
- 24. Hill MN, Tasker JG. Endocannabinoid signaling, glucocorticoid‐mediated negative feedback, and regulation of the hypothalamic‐pituitary‐adrenal axis. Neuroscience. 2012;204:5‐16. 10.1016/j.neuroscience.2011.12.030. [DOI] [PMC free article] [PubMed] [Google Scholar]
- 25. Groeneweg FL, Karst H, de Kloet ER, Joels M. Mineralocorticoid and glucocorticoid receptors at the neuronal membrane, regulators of nongenomic corticosteroid signalling. Mol Cell Endocrinol. 2012;350(2):299‐309. 10.1016/j.mce.2011.06.020. [DOI] [PubMed] [Google Scholar]
- 26. Nahar J, Haam J, Chen C, et al. Rapid nongenomic glucocorticoid actions in male mouse hypothalamic neuroendocrine cells are dependent on the nuclear glucocorticoid receptor. Endocrinology. 2015;156(8):2831‐2842. 10.1210/en.2015-1273. [DOI] [PMC free article] [PubMed] [Google Scholar]
- 27. Solomon MB, Loftspring M, de Kloet AD, et al. Neuroendocrine function after hypothalamic depletion of glucocorticoid receptors in male and female mice. Endocrinology. 2015;156(8):2843‐2853. 10.1210/en.2015-1276. [DOI] [PMC free article] [PubMed] [Google Scholar]
- 28. Clark KJ, Boczek NJ, Ekker SC. Stressing zebrafish for behavioral genetics. Rev Neurosci. 2011;22(1):49‐62. 10.1515/RNS.2011.007. [DOI] [PMC free article] [PubMed] [Google Scholar]
- 29. Nüsslein‐Volhard CC, Dahm R. In: Nüsslein‐Volhard C, Dahm R, eds. Zebrafish: A Practical Approach. Oxford, England: Oxford University Press; 2002. [Google Scholar]
- 30. Takahashi H. Juvenile hermaphroditism in the zebrafish, Brachydanio rerio . Bull Fac Fish Hokkaido Univ. 1977;28(2):57‐65. [Google Scholar]
- 31. Lau ES‐W, Zhang Z, Qin M, Ge W. Knockout of Zebrafish Ovarian Aromatase Gene (cyp19a1a) by TALEN and CRISPR/Cas9 leads to all‐male offspring due to failed ovarian differentiation. Sci Rep. 2016;6:37357 10.1038/srep37357. [DOI] [PMC free article] [PubMed] [Google Scholar]
- 32. Orban L, Sreenivasan R, Olsson P‐E. Long and winding roads: testis differentiation in zebrafish. Mol Cell Endocrinol. 2009;312(1–2):35‐41. 10.1016/j.mce.2009.04.014. [DOI] [PubMed] [Google Scholar]
- 33. Uchida D, Yamashita M, Kitano T, Iguchi T. Oocyte apoptosis during the transition from ovary‐like tissue to testes during sex differentiation of juvenile zebrafish. J Exp Biol. 2002;205(Pt 6:711‐718. [DOI] [PubMed] [Google Scholar]
- 34. De Marco RJ, Groneberg AH, Yeh C‐M, Castillo Ramírez LA, Ryu S. Optogenetic elevation of endogenous glucocorticoid level in larval zebrafish. Front Neural Circuits. 2013;7:82 10.3389/fncir.2013.00082. [DOI] [PMC free article] [PubMed] [Google Scholar]
- 35. Guggiana‐Nilo DA, Engert F. Properties of the visible light phototaxis and UV avoidance behaviors in the larval zebrafish. Front Behav Neurosci. 2016;10(104):413‐410. 10.3389/fnbeh.2016.00160. [DOI] [PMC free article] [PubMed] [Google Scholar]
- 36. Neuhauss SCF. Behavioral genetic approaches to visual system development and function in zebrafish. J Neurobiol. 2002;54(1):148‐160. 10.1002/neu.10165. [DOI] [PubMed] [Google Scholar]
- 37. Alsop D, Vijayan MM. Molecular programming of the corticosteroid stress axis during zebrafish development. Comp Biochem Physiol A Mol Integr Physiol. 2009;153(1):49‐54. 10.1016/j.cbpa.2008.12.008. [DOI] [PubMed] [Google Scholar]
- 38. Alsop D, Vijayan MM. Development of the corticosteroid stress axis and receptor expression in zebrafish. Am J Physiol Regul Integr Comp Physiol. 2008;294(3):R711‐R719. 10.1152/ajpregu.00671.2007. [DOI] [PubMed] [Google Scholar]
- 39. Cousin MA, Ebbert JO, Wiinamaki AR, et al. Larval zebrafish model for FDA‐approved drug repositioning for tobacco dependence treatment. PLoS One. 2014;9(3):e90467 10.1371/journal.pone.0090467. [DOI] [PMC free article] [PubMed] [Google Scholar]
- 40. Utida S, Hirano T, Oide H, Ando M, Johnson DW, Bern HA. Hormonal control of the intestine and urinary bladder in teleost osmoregulation. Gen Comp Endocrinol. 1972;3:317‐327. 10.1016/0016-6480(72)90161-X. [DOI] [Google Scholar]
- 41. McCormick SD. Endocrine control of osmoregulation in teleost fish. Am Zool. 2001;41(4):781‐794. 10.1668/0003-1569(2001)041[0781:ecooit]2.0.co;2. [DOI] [Google Scholar]
- 42. Krug RG, Lee HB, Khoury El LY, Sigafoos AN, Petersen MO, Clark KJ. The endocannabinoid gene faah2a modulates stress‐associated behavior in zebrafish. PLoS One. 2018;13(1):e0190897 10.1371/journal.pone.0190897. [DOI] [PMC free article] [PubMed] [Google Scholar]
- 43. Gerlai R, Poshusta TL, Rampersad M, et al. Forward genetic screening using behavioral tests in zebrafish: a proof of concept analysis of mutants. Behav Genet. 2017;47(1):125‐139. 10.1007/s10519-016-9818-y. [DOI] [PubMed] [Google Scholar]
- 44. De Marco RJ, Groneberg AH, Yeh C‐M, Treviño M, Ryu S. The behavior of larval zebrafish reveals stressor‐mediated anorexia during early vertebrate development. Front Behav Neurosci. 2014;8:367 10.3389/fnbeh.2014.00367. [DOI] [PMC free article] [PubMed] [Google Scholar]
- 45. Vriens J, Nilius B, Vennekens R. Herbal compounds and toxins modulating TRP channels. Curr Neuropharmacol. 2008;6(1):79‐96. 10.2174/157015908783769644. [DOI] [PMC free article] [PubMed] [Google Scholar]
- 46. Prober DA, Zimmerman S, Myers BR, et al. Zebrafish TRPA1 channels are required for chemosensation but not for thermosensation or mechanosensory hair cell function. J Neurosci. 2008;28(40):10102‐10110. 10.1523/JNEUROSCI.2740-08.2008. [DOI] [PMC free article] [PubMed] [Google Scholar]
- 47. Petzold AM, Balciunas D, Sivasubbu S, et al. Nicotine response genetics in the zebrafish. Proc Natl Acad Sci USA. 2009;106(44):18662‐18667. 10.1073/pnas.0908247106. [DOI] [PMC free article] [PubMed] [Google Scholar]
- 48. Krauss A, Neumeyer C. Wavelength dependence of the optomotor response in zebrafish (Danio rerio). Vision Res. 2003;43(11):1275‐1284. 10.1016/S0042-6989(03)00090-7. [DOI] [PubMed] [Google Scholar]
- 49. Burgess HA, Schoch H, Granato M. Distinct retinal pathways drive spatial orientation behaviors in zebrafish navigation. Curr Biol. 2010;20(4):381‐386. 10.1016/j.cub.2010.01.022. [DOI] [PMC free article] [PubMed] [Google Scholar]
- 50. Krug RGII, Poshusta TL, Skuster KJ, Berg MR, Gardner SL, Clark KJ. A transgenic zebrafish model for monitoring glucocorticoid receptor activity. Genes Brain Behav. 2014;13(5):478‐487. 10.1111/gbb.12135. [DOI] [PMC free article] [PubMed] [Google Scholar]
- 51. Cruz SA, Lin C‐H, Chao P‐L, Hwang P‐P. Glucocorticoid receptor, but not mineralocorticoid receptor, mediates cortisol regulation of epidermal ionocyte development and ion transport in zebrafish (Danio rerio). PLoS One. 2013;8(10):e77997‐e77913. 10.1371/journal.pone.0077997. [DOI] [PMC free article] [PubMed] [Google Scholar]
- 52. Pawlowicz R. Key physical variables in the ocean: temperature, salinity, and density. Nature Educ Knowledge. 2013;4:13 https://www.nature.com/scitable/knowledge/library/key-physical-variables-in-the-ocean-temperature-102805293. Accessed March 1, 2018. [Google Scholar]
- 53. Sharqawy MH. New correlations for seawater and pure water thermal conductivity at different temperatures and salinities. Desalination. 2013;313:97‐104. 10.1016/j.desal.2012.12.010. [DOI] [Google Scholar]
- 54. Wang X, Kültz D. Osmolality/salinity‐responsive enhancers (OSREs) control induction of osmoprotective genes in euryhaline fish. Proc Natl Acad Sci USA. 2017;114(13):E2729‐E2738. 10.1073/pnas.1614712114. [DOI] [PMC free article] [PubMed] [Google Scholar]
- 55. Lawrence C. The husbandry of zebrafish (Danio rerio): a review. Aquaculture. 2007;269:1):1‐1):20. 10.1016/j.aquaculture.2007.04.077. [DOI] [Google Scholar]
- 56. Hwang P‐P, Chou M‐Y. Zebrafish as an animal model to study ion homeostasis. Pflugers Arch. 2013;465(9):1233‐1247. 10.1007/s00424-013-1269-1. [DOI] [PMC free article] [PubMed] [Google Scholar]
- 57. Hill AJ, Bello SM, Prasch AL, Peterson RE, Heideman W. Water permeability and TCDD‐induced edema in zebrafish early‐life stages. Toxicol Sci. 2004;78(1):78‐87. 10.1093/toxsci/kfh056. [DOI] [PubMed] [Google Scholar]
- 58. Nesan D, Vijayan MM. Maternal cortisol mediates hypothalamus‐pituitary‐interrenal axis development in zebrafish. Sci Rep. 2016;6:22582 10.1038/srep22582. [DOI] [PMC free article] [PubMed] [Google Scholar]
- 59. Pavlidis M, Theodoridi A, Tsalafouta A. Neuroendocrine regulation of the stress response in adult zebrafish, Danio rerio . Prog Neuro‐Psychopharmacol Biol Psychiatry. 2015;60(C):121‐131. 10.1016/j.pnpbp.2015.02.014. [DOI] [PubMed] [Google Scholar]
- 60. Agulleiro MJ, Roy S, nchez ES, Puchol S, Gallo‐Payet N, Reverter JMC. Role of melanocortin receptor accessory proteins in the function of zebrafish melanocortin receptor type 2. Mol Cell Endocrinol. 2010;320(1–2):145‐152. 10.1016/j.mce.2010.01.032. [DOI] [PubMed] [Google Scholar]
- 61. Caruso V, Lagerström MC, Olszewski PK, Fredriksson R, Schiöth HB. Synaptic changes induced by melanocortin signalling. Nat Publ Group. 2014;15(2):98‐110. 10.1038/nrn3657. [DOI] [PubMed] [Google Scholar]
- 62. Agulleiro MJ, Sánchez E, Leal E, et al. Molecular characterization and functional regulation of Melanocortin 2 Receptor (MC2R) in the sea bass. A putative role in the adaptation to. PLoS One. 2013;8(5):e65450‐e65459. 10.1371/journal.pone.0065450. [DOI] [PMC free article] [PubMed] [Google Scholar]
- 63. Roy S, Roy SJ, Pinard S, et al. The C‐terminal domains of melanocortin‐2 receptor (MC2R) accessory proteins (MRAP1) influence their localization and ACTH‐induced cAMP production. Gen Comp Endocrinol. 2012;176(2):265‐274. 10.1016/j.ygcen.2012.02.003. [DOI] [PubMed] [Google Scholar]
- 64. Miller WL. Steroid hormone synthesis in mitochondria. Mol Cell Endocrinol. 2013;379(1–2):62‐73. 10.1016/j.mce.2013.04.014. [DOI] [PubMed] [Google Scholar]
- 65. Decourt C, Lahlou B. Evidence for the direct intervention of angiotensin II in the release of cortisol in teleost fishes. Life Sci. 1987;41(12):1517‐1524. 10.1016/0024-3205(87)90717-X. [DOI] [PubMed] [Google Scholar]
- 66. Arnold‐Reed DE, Balment RJ. Peptide hormones influence in vitro interrenal secretion of cortisol in the trout, Oncorhynchus mykiss . Gen Comp Endocrinol. 1994;96(1):85‐91. 10.1006/gcen.1994.1161. [DOI] [PubMed] [Google Scholar]
- 67. Arnold‐Reed DE, Balment RJ. Atrial natriuretic factor stimulates in‐vivo and in‐vitro secretion of cortisol in teleosts. J Endocrinol. 1991;128(3):R17‐R20. 10.1677/joe.0.128R017. [DOI] [PubMed] [Google Scholar]
- 68. van der Lubbe N, Lim CH, Fenton RA, et al. Angiotensin II induces phosphorylation of the thiazide‐sensitive sodium chloride cotransporter independent of aldosterone. Kidney Int. 2011;79(1):66‐76. 10.1038/ki.2010.290. [DOI] [PubMed] [Google Scholar]
- 69. van der Lubbe N, Lim CH, Meima ME, et al. Aldosterone does not require angiotensin II to activate NCC through a WNK4–SPAK–dependent pathway. Pflugers Arch. 2012;463(6):853‐863. 10.1007/s00424-012-1104-0. [DOI] [PMC free article] [PubMed] [Google Scholar]
- 70. Kumai Y, Bernier NJ, Perry SF. Angiotensin‐II promotes Na+ uptake in larval zebrafish, Danio rerio, in acidic and ion‐poor water. J Endocrinol. 2014;220(3):195‐205. 10.1530/JOE-13-0374. [DOI] [PubMed] [Google Scholar]
- 71. Kumai Y, Nesan D, Vijayan MM, Perry SF. Cortisol regulates Na+ uptake in zebrafish, Danio rerio, larvae via the glucocorticoid receptor. Mol Cell Endocrinol. 2012;364(1–2):113‐125. 10.1016/j.mce.2012.08.017. [DOI] [PubMed] [Google Scholar]
- 72. Cima I, Corazza N, Dick B, et al. Intestinal epithelial cells synthesize glucocorticoids and regulate T cell activation. J Exp Med. 2004;200(12):1635‐1646. 10.1084/jem.20031958. [DOI] [PMC free article] [PubMed] [Google Scholar]
- 73. Mueller M, Cima I, Noti M, et al. The nuclear receptor LRH‐1 critically regulates extra‐adrenal glucocorticoid synthesis in the intestine. J Exp Med. 2006;203(9):2057‐2062. 10.1084/jem.20060357. [DOI] [PMC free article] [PubMed] [Google Scholar]
- 74. Kostadinova FI, Hostettler N, Bianchi P, Brunner T. Extra‐adrenal glucocorticoid synthesis in mucosal tissues and its implication in mucosal immune homeostasis and tumor development Glucocorticoids ‐ New Recognition of our Familiar Friend. London, England: IntechOpen; 2012. 10.5772/52788. [DOI] [Google Scholar]
- 75. Logan DW, Bryson‐Richardson RJ, Taylor MS, Currie P, Jackson IJ. Sequence characterization of teleost fish melanocortin receptors. Ann N Y Acad Sci. 2003;994:319‐330. [DOI] [PubMed] [Google Scholar]
- 76. Aluru N, Vijayan MM. Molecular characterization, tissue‐specific expression, and regulation of Melanocortin 2 Receptor in rainbow trout. Endocrinology. 2008;149(9):4577‐4588. 10.1210/en.2008-0435. [DOI] [PMC free article] [PubMed] [Google Scholar]
- 77. Encío IJ, Detera‐Wadleigh SD. The genomic structure of the human glucocorticoid receptor. J Biol Chem. 1991;266(11):7182‐7188. [PubMed] [Google Scholar]
- 78. Alt SR, Turner JD, Klok MD, et al. Differential expression of glucocorticoid receptor transcripts in major depressive disorder is not epigenetically programmed. Psychoneuroendocrinology. 2010;35(4):544‐556. 10.1016/j.psyneuen.2009.09.001. [DOI] [PubMed] [Google Scholar]
- 79. Lu NZ, Cidlowski JA. Translational regulatory mechanisms generate N‐terminal glucocorticoid receptor isoforms with unique transcriptional target genes. Mol Cell. 2005;18(3):331‐342. 10.1016/j.molcel.2005.03.025. [DOI] [PubMed] [Google Scholar]
- 80. Oakley RH, Cidlowski JA. Cellular processing of the glucocorticoid receptor gene and protein: new mechanisms for generating tissue‐specific actions of glucocorticoids. J Biol Chem. 2011;286(5):3177‐3184. 10.1074/jbc.R110.179325. [DOI] [PMC free article] [PubMed] [Google Scholar]
- 81. Conway‐Campbell BL, Pooley JR, Hager GL, Lightman SL. Molecular dynamics of ultradian glucocorticoid receptor action. Mol Cell Endocrinol. 2012;348(2):383‐393. 10.1016/j.mce.2011.08.014. [DOI] [PubMed] [Google Scholar]
- 82. Busillo JM, Cidlowski JA. The five Rs of glucocorticoid action during inflammation: ready, reinforce, repress, resolve, and restore. Trends Endocrinol Metab. 2013;24(3):109‐119. 10.1016/j.tem.2012.11.005. [DOI] [PMC free article] [PubMed] [Google Scholar]
- 83. Schaaf MJM, Champagne D, van Laanen IHC, et al. Discovery of a functional glucocorticoid receptor β‐isoform in zebrafish. Endocrinology. 2008;149(4):1591‐1599. 10.1210/en.2007-1364. [DOI] [PubMed] [Google Scholar]
- 84. Boyle MP, Brewer JA, Funatsu M, et al. Acquired deficit of forebrain glucocorticoid receptor produces depression‐like changes in adrenal axis regulation and behavior. Proc Natl Acad Sci USA. 2005;102(2):473‐478. 10.1073/pnas.0406458102. [DOI] [PMC free article] [PubMed] [Google Scholar]
- 85. Ridder S, Chourbaji S, Hellweg R, et al. Mice with genetically altered glucocorticoid receptor expression show altered sensitivity for stress‐induced depressive reactions. J Neurosci. 2005;25(26):6243‐6250. 10.1523/JNEUROSCI.0736-05.2005. [DOI] [PMC free article] [PubMed] [Google Scholar]
- 86. Zhu Y, Rice CD, Pang Y, Pace M, Thomas P. Cloning, expression, and characterization of a membrane progestin receptor and evidence it is an intermediary in meiotic maturation of fish oocytes. Proc Natl Acad Sci USA. 2003;100(5):2231‐2236. 10.1073/pnas.0336132100. [DOI] [PMC free article] [PubMed] [Google Scholar]
- 87. Zhu Y, Bond J, Thomas P. Identification, classification, and partial characterization of genes in humans and other vertebrates homologous to a fish membrane progestin receptor. Proc Natl Acad Sci USA. 2003;100(5):2237‐2242. 10.1073/pnas.0436133100. [DOI] [PMC free article] [PubMed] [Google Scholar]
- 88. Kalyanaraman H, Schwappacher R, Joshua J, et al. Nongenomic thyroid hormone signaling occurs through a plasma membrane‐localized Receptor. Sci Signal. 2014;7(326):ra48‐ra48. 10.1126/scisignal.2004911. [DOI] [PMC free article] [PubMed] [Google Scholar]
- 89. Pippal JB, Cheung CMI, Yao Y‐Z, Brennan FE, Fuller PJ. Characterization of the zebrafish (Danio rerio) mineralocorticoid receptor. Mol Cell Endocrinol. 2011;332(1–2):58‐66. 10.1016/j.mce.2010.09.014. [DOI] [PubMed] [Google Scholar]
- 90. Katsu Y, Oka K, Baker ME. Evolution of human, chicken, alligator, frog, and zebrafish mineralocorticoid receptors: allosteric influence on steroid specificity. Sci Signal. 2018;11(537):eaao1520. 10.1126/scisignal.aao1520. [DOI] [PubMed] [Google Scholar]
- 91. Kelly SP, Chasiotis H. Glucocorticoid and mineralocorticoid receptors regulate paracellular permeability in a primary cultured gill epithelium. J Exp Biol. 2011;214(14):2308‐2318. 10.1242/jeb.055962. [DOI] [PubMed] [Google Scholar]
- 92. Kiilerich P, Kristiansen K, Madsen SS. Cortisol regulation of ion transporter mRNA in Atlantic salmon gill and the effect of salinity on the signaling pathway. J Endocrinol. 2007;194(2):417‐427. 10.1677/JOE-07-0185. [DOI] [PubMed] [Google Scholar]
- 93. Kiilerich P, Tipsmark CK, Borski RJ, Madsen SS. Differential effects of cortisol and 11‐deoxycorticosterone on ion transport protein mRNA levels in gills of two euryhaline teleosts, Mozambique tilapia (Oreochromis mossambicus) and striped bass (Morone saxatilis). J Endocrinol. 2011;209(1):115‐126. 10.1530/JOE-10-0326. [DOI] [PubMed] [Google Scholar]
- 94. Takahashi H, Sakamoto T. The role of 'mineralocorticoids' in teleost fish: relative importance of glucocorticoid signaling in the osmoregulation and “central” actions of mineralocorticoid receptor. Gen Comp Endocrinol. 2013;181(C):223‐228. 10.1016/j.ygcen.2012.11.016. [DOI] [PubMed] [Google Scholar]
- 95. Sturm A, Bury N, Dengreville L, et al. 11‐Deoxycorticosterone is a potent agonist of the rainbow trout (Oncorhynchus mykiss) mineralocorticoid receptor. Endocrinology. 2005;146(1):47‐55. 10.1210/en.2004-0128. [DOI] [PubMed] [Google Scholar]
- 96. Gilmour KM. Mineralocorticoid receptors and hormones: fishing for answers. Endocrinology. 2005;146(1):44‐46. 10.1210/en.2004-1390. [DOI] [PubMed] [Google Scholar]
- 97. McCormick SD, Bradshaw D. Hormonal control of salt and water balance in vertebrates. Gen Comp Endocrinol. 2006;147(1):3‐8. 10.1016/j.ygcen.2005.12.009. [DOI] [PubMed] [Google Scholar]
- 98. Joëls M, de Kloet ER. Mineralocorticoid and glucocorticoid receptors in the brain. Implications for ion permeability and transmitter systems. Prog Neurobiol. 1994;43(1):1‐36. 10.1016/0301-0082(94)90014-0. [DOI] [PubMed] [Google Scholar]
- 99. Levin ER, Hammes SR. Nuclear receptors outside the nucleus: extranuclear signalling by steroid receptors. Nat Rev Mol Cell Biol. 2016;17:783‐797. 10.1038/nrm.2016.122. [DOI] [PMC free article] [PubMed] [Google Scholar]
- 100. Karst H, Berger S, Turiault M, Tronche F, Schütz G, Joels M. Mineralocorticoid receptors are indispensable for nongenomic modulation of hippocampal glutamate transmission by corticosterone. Proc Natl Acad Sci USA. 2005;102(52):19204‐19207. 10.1073/pnas.0507572102. [DOI] [PMC free article] [PubMed] [Google Scholar]
- 101. Joels M, Karst H, DeRijk R, de Kloet ER. The coming out of the brain mineralocorticoid receptor. Trends Neurosci. 2008;31(1):1‐7. 10.1016/j.tins.2007.10.005. [DOI] [PubMed] [Google Scholar]
- 102. Sakamoto T, Mori C, Minami S, et al. Corticosteroids stimulate the amphibious behavior in mudskipper: potential role of mineralocorticoid receptors in teleost fish. Physiol Behav. 2011;104(5):923‐928. 10.1016/j.physbeh.2011.06.002. [DOI] [PubMed] [Google Scholar]
- 103. Sakamoto T, Hyodo S, Takagi W. A possible principal function of corticosteroid signaling that is conserved in vertebrate evolution: lessons from receptor‐knockout small fish. J Steroid Biochem Mol Biol. 2018;184:57‐61. 10.1016/j.jsbmb.2018.02.011. [DOI] [PubMed] [Google Scholar]
- 104. Moore FL, Miller LJ. Stress‐induced inhibition of sexual behavior: corticosterone inhibits courtship behaviors of a male amphibian (Taricha granulosa). Horm Behav. 1984;18(4):400‐410. 10.1016/0018-506X(84)90026-6. [DOI] [PubMed] [Google Scholar]
- 105. Orchinik M, Murray TF, Moore FL. A corticosteroid receptor in neuronal membranes. Science. 1991;252(5014):1848‐1851. [DOI] [PubMed] [Google Scholar]
- 106. Breuner CW, Greenberg AL, Wingfield JC. Noninvasive corticosterone treatment rapidly increases activity in Gambel's white‐crowned sparrows (Zonotrichia leucophrys gambelii). Gen Comp Endocrinol. 1998;111(3):386‐394. 10.1006/gcen.1998.7128. [DOI] [PubMed] [Google Scholar]
- 107. Breuner CW, Orchinik M. Pharmacological characterization of intracellular, membrane, and plasma binding sites for corticosterone in house sparrows. Gen Comp Endocrinol. 2009;163(1–2):214‐224. 10.1016/j.ygcen.2009.01.027. [DOI] [PubMed] [Google Scholar]
- 108. Sandi C, Venero C, Guaza C. Novelty‐related rapid locomotor effects of corticosterone in rats. Eur J Neurosci. 1996;8(4):794‐800. [DOI] [PubMed] [Google Scholar]
- 109. Mikics É, Barsy B, Barsvári B, Haller J. Behavioral specificity of non‐genomic glucocorticoid effects in rats: effects on risk assessment in the elevated plus‐maze and the open‐field. Horm Behav. 2005;48(2):152‐162. 10.1016/j.yhbeh.2005.02.002. [DOI] [PubMed] [Google Scholar]
- 110. Rose JD, Moore FL, Orchinik M. Rapid neurophysiological effects of corticosterone on medullary neurons: relationship to stress‐induced suppression of courtship clasping in an amphibian. Neuroendocrinology. 1993;57(5):815‐824. 10.1159/000126440. [DOI] [PubMed] [Google Scholar]
- 111. Hua SY, Chen YZ. Membrane receptor‐mediated electrophysiological effects of glucocorticoid on mammalian neurons. Endocrinology. 1989;124(2):687‐691. 10.1210/endo-124-2-687. [DOI] [PubMed] [Google Scholar]
- 112. Chen YZ, Hua SY, Wang CA, Wu LG, Gu Q, Xing BR. An electrophysiological study on the membrane receptor‐mediated action of glucocorticoids in mammalian neurons. Neuroendocrinology. 1991;53(suppl 1):25‐30. 10.1159/000125791. [DOI] [PubMed] [Google Scholar]
- 113. Ffrench‐Mullen JM. Cortisol inhibition of calcium currents in Guinea pig hippocampal CA1 neurons via G‐protein‐coupled activation of protein kinase C. J Neurosci. 1995;15(1 pt 2):903‐911. [DOI] [PMC free article] [PubMed] [Google Scholar]
- 114. Sato S, Osanai H, Monma T, et al. Acute effect of corticosterone on N‐methyl‐D‐aspartate receptor‐mediated Ca2+ elevation in mouse hippocampal slices. Biochem Biophys Res Commun. 2004;321(2):510‐513. 10.1016/j.bbrc.2004.06.168. [DOI] [PubMed] [Google Scholar]
- 115. Malcher‐Lopes R, Di S, Marcheselli VS, et al. Opposing crosstalk between leptin and glucocorticoids rapidly modulates synaptic excitation via endocannabinoid release. J Neurosci. 2006;26(24):6643‐6650. 10.1523/JNEUROSCI.5126-05.2006. [DOI] [PMC free article] [PubMed] [Google Scholar]
- 116. Di S, Maxson MM, Franco A, Tasker JG. Glucocorticoids regulate glutamate and GABA synapse‐specific retrograde transmission via divergent nongenomic signaling pathways. J Neurosci. 2009;29(2):393‐401. 10.1523/JNEUROSCI.4546-08.2009. [DOI] [PMC free article] [PubMed] [Google Scholar]
- 117. Evanson NK, Tasker JG, Hill MN, Hillard CJ, Herman JP. Fast feedback inhibition of the HPA Axis by glucocorticoids is mediated by endocannabinoid signaling. Endocrinology. 2010;151(10):4811‐4819. 10.1210/en.2010-0285. [DOI] [PMC free article] [PubMed] [Google Scholar]
Associated Data
This section collects any data citations, data availability statements, or supplementary materials included in this article.
Supplementary Materials
Appendix S1. Supplementary materials and methods.
Table S1. Materials
Table S2. Zebrafish mutant variants in the paper
Table S3. Transcription activator‐like effector nuclease target sequences
Table S4. Reagents for restriction fragment length polymorphism (RFLP) genotyping and allele specific qPCR (ASQ) genotyping
Table S5. Locomotor response statistics of larval zebrafish: Light assays and NaCl assays
Table S6. Locomotor response statistics of larval zebrafish: Cinnamon oil assays
Table S7. Whole‐body cortisol level statistics after 50‐second white light illumination
Table S8. Statistics of activated glucocorticoid receptor transcripts (EGFP transcript levels)
Figure S1. Spectrograms of light illumination. The intensities of white or infrared light were measured at each wavelength using a miniature spectrometer (STS‐VIS or STS‐NIR; Ocean Optics, Inc.). The graphs were generated by OceanView spectroscopy software (ver. 1.5.0; Ocean Optics, Inc.). (A) White light at the high intensity setting of the Light Box shows the wavelength distribution between approximately 430 to 710 nm with the peak intensity level at around 1300. White light at the high intensity was used for white light illumination during the dual light assays. (B) White light at the medium intensity setting in the Light Box shows the same wavelength distribution with the decreased peak intensity at around 650. White light at the medium intensity was used as white light illumination during the hyperosmotic (NaCl) or cinnamon oil assays. (C) Infrared light at the high intensity shows the wavelength distribution between approximately 790 and 880 nm with the peak intensity level at around 450. Infrared light was used during the dual light assay