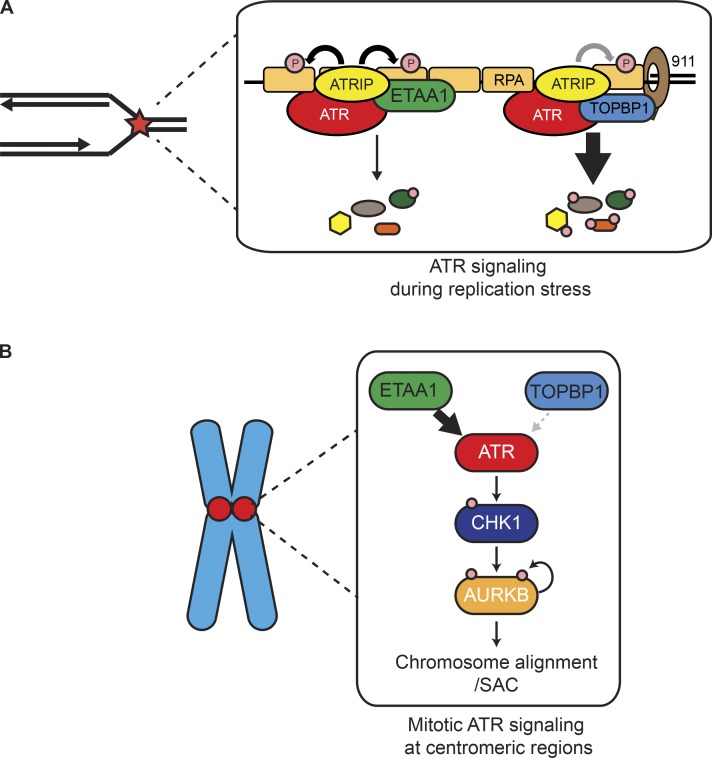
Bass and Cortez use comparative quantitative mass spectrometry analyses of cells lacking either ATR activator, ETAA1 or TOPBP1. They identify a role for ETAA1 and ATR activation in the regulation of chromosome alignment and segregation in mitosis through Aurora B activity.
Abstract
The ATR kinase controls cell cycle transitions and the DNA damage response. ATR activity is regulated through two ATR-activating proteins, ETAA1 and TOPBP1. To examine how each activator contributes to ATR signaling, we used quantitative mass spectrometry to identify changes in protein phosphorylation in ETAA1- or TOPBP1-deficient cells. We identified 724, 285, and 118 phosphosites to be regulated by TOPBP1, ETAA1, or both ATR activators, respectively. Gene ontology analysis of TOPBP1- and ETAA1-dependent phosphoproteins revealed TOPBP1 to be a primary ATR activator for replication stress, while ETAA1 regulates mitotic ATR signaling. Inactivation of ATR or ETAA1, but not TOPBP1, results in decreased Aurora B kinase activity during mitosis. Additionally, ATR activation by ETAA1 is required for proper chromosome alignment during metaphase and for a fully functional spindle assembly checkpoint response. Thus, we conclude that ETAA1 and TOPBP1 regulate distinct aspects of ATR signaling with ETAA1 having a dominant function in mitotic cells.
Introduction
ATR is an apical DNA damage response kinase that promotes genome stability by regulating the cell division cycle and cellular stress responses (Saldivar et al., 2017). ATR signaling coordinates the DNA replication stress response, controls the S/G2 and G2/M transitions to ensure completion of DNA replication before mitosis, and ensures proper chromosome separation during mitosis (Zachos et al., 2007; Cimprich and Cortez, 2008; Kabeche et al., 2018; Saldivar et al., 2018).
In budding yeast there are at least three activators of the ATR orthologue, Mec1, that regulate timing of Mec1 activation and direct what substrates are phosphorylated (Mordes et al., 2008; Navadgi-Patil and Burgers, 2008, 2009; Kumar and Burgers, 2013; Bastos de Oliveira et al., 2015). The cell cycle–specific utilization of each Mec1 activator allows for temporal regulation of Mec1 throughout the process of cell division (Navadgi-Patil and Burgers, 2011). Additionally, Mec1 activators direct Mec1 to phosphorylate substrates proximal to the activator promoting localization-dependent Mec1 signaling (Lanz et al., 2018).
In mammalian cells, ATR kinase activity is regulated by at least two ATR-activating proteins ETAA1 and TOPBP1 (Kumagai et al., 2006; Bass et al., 2016; Haahr et al., 2016; Lee et al., 2016). Although ETAA1 and TOPBP1 share similar ATR activation domains (AADs) and may interact with ATR similarly (Bass et al., 2016), they are recruited to DNA via different mechanisms. ETAA1 is recruited by a direct interaction with RPA bound to single-stranded DNA (Bass et al., 2016; Feng et al., 2016; Haahr et al., 2016; Lee et al., 2016), whereas TOPBP1 is recruited to the 5′ junction of single- and double-stranded DNA by the RAD9/RAD1/HUS1 (9-1-1) complex with assistance from RHINO and the MRE11/RAD50/NBS1 complex (Delacroix et al., 2007; Lee et al., 2007; Cotta-Ramusino et al., 2011; Duursma et al., 2013; Lindsey-Boltz et al., 2015).
Loss of ETAA1 or TOPBP1 differentially affect phosphorylation of ATR substrates such as CHK1 and RPA in cells exposed to replication stress (Bass et al., 2016). ETAA1 also appears especially important for the newly described function of ATR in controlling the S/G2 transition in unstressed cells (Saldivar et al., 2018). To more globally determine how ETAA1 and TOPBP1 influence ATR signaling, we used quantitative phosphoproteomics to identify changes in protein phosphorylation in cells deficient for each ATR activator. These data indicated that ETAA1 might be particularly important for the mitotic functions of ATR. Indeed, ETAA1-dependent activation of ATR during mitosis promotes Aurora B kinase signaling, prevents chromosomal misalignment during metaphase, and maintains the spindle assembly checkpoint. Thus, ETAA1 may be the primary ATR activator to control cell division in unstressed cells, while TOPBP1 has a dominant function in response to replication stress.
Results
Generation of cell lines deficient for ATR activators
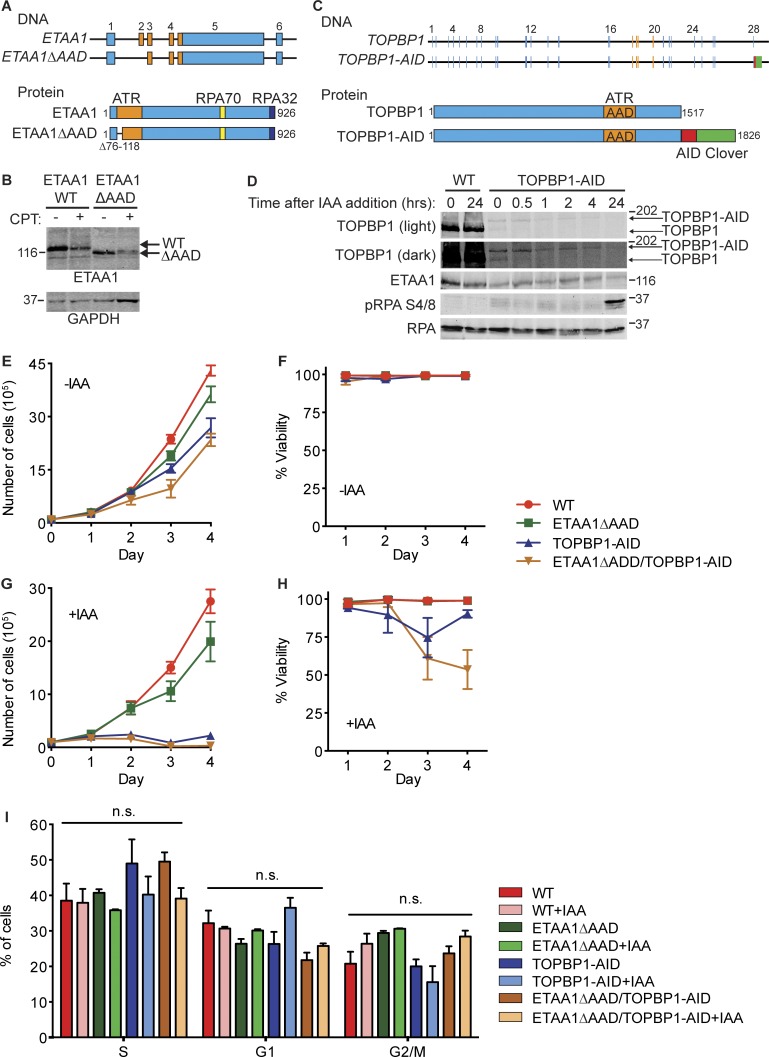
To interrogate the unique functions of ETAA1 and TOPBP1, we used CRISPR-Cas9 genome editing to generate HCT116 cells deficient for each ATR activator. ETAA1 function was disrupted by targeting the 5′ splice junction of exon 2, resulting in an in-frame deletion of ETAA1 that removes part of the AAD containing a tryptophan residue required to activate ATR (Fig. 1, A and B). These ETAA1ΔAAD cells express a mutant ETAA1 protein that can bind RPA and localize to sites of DNA damage, but is incapable of binding and activating ATR (Bass et al., 2016).
Figure 1.
Production and characterization of ETAA1 and TOPBP1-deficient cell lines. (A) Schematic of the ETAA1ΔAAD gene and protein. (B) HCT116 and HCT116 ETAA1ΔAAD cells were lysed and immunoblotted with ETAA1 antibodies. ETAA1 electrophoretic mobility is altered following CPT treatment. (C) Schematic of the TOPBP1-AID gene and protein. (D) HCT116 WT and TOPBP1-AID cells were treated with 500 µM IAA for the indicated times. Cells were lysed and immunoblotted with the indicated antibodies. Upper band is full-length TOPBP1-AID, and lower band is TOPBP1. (E–H) HCT116 WT, ETAA1ΔAAD, TOPBP1-AID, and ETAA1ΔAAD/TOPBP1-AID cells were left untreated (E and F) or treated (G and H) with 500 µM IAA. Viable cells numbers were measured by staining with trypan blue. Data points and error bars are mean and standard deviation of three experiments. (I) HCT116 WT, ETAA1ΔAAD, TOPBP1-AID, and ETAA1ΔAAD/TOPBP1-AID cells were left untreated or treated with 500 µM IAA for 2 h before examining cell cycle distribution by flow cytometry. Data points and error bars are the mean and standard deviation of three experiments. n.s., not significant. Molecular weight is given in kilodaltons.
Unlike ETAA1, TOPBP1 is required for cell viability and has essential functions during the initiation of DNA replication (Garcia et al., 2005). We attempted to mutate the TOPBP1-AAD in HCT116 cells using CRISPR-Cas9, but were unsuccessful, consistent with the observation that inactivation of the TOPBP1-AAD results in cell death in mice (Zhou et al., 2013). To circumvent these obstacles, we tagged endogenous TOPBP1 with an auxin-inducible degron (AID; Fig. 1, C and D). The tag itself reduced TOPBP1 expression significantly, but yielded viable cell lines that retained proliferative capacity (Fig. 1, D–F). Addition of the auxin indole-3-acetic acid (IAA) resulted in specific and rapid degradation of TOPBP1, cell death, and block to proliferation (Fig. 1, D, G, and H). However, short treatments with IAA did not cause a significant difference in the cell cycle distribution of the TOPBP1-AID cells, which were similar to the parental and ETAA1 mutant cells (Fig. 1 I). Thus, this approach provides a rapid method of inactivating TOPBP1.
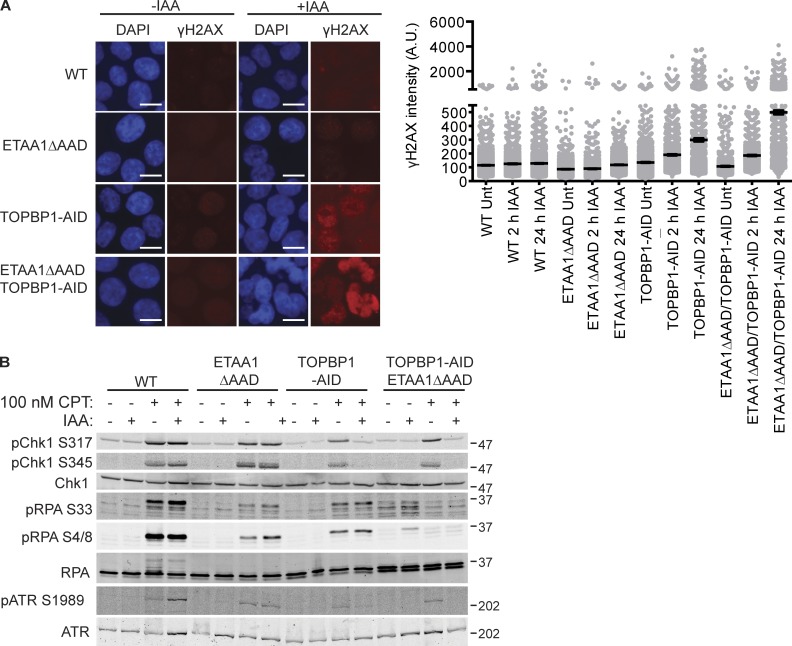
In addition to producing cell lines defective for ETAA1 or TOPBP1, we generated ETAA1ΔAAD/TOPBP1-AID cells that were conditionally deficient for both ATR-activating proteins. Prolonged IAA treatment in WT or ETAA1ΔAAD cells did not increase γH2AX levels, a biomarker for DNA damage (Fig. 2 A). However, cells containing the TOPBP1-degron stopped growing and began to accumulate DNA damage, as indicated by induction of γH2AX and phosphorylated RPA (Fig. 1, D and G; and Fig. 2 A). Cells deficient for both ETAA1 and TOPBP1-AID exhibited much more severe genomic instability, evident by fragmented nuclei and high levels of γH2AX, consistent with the conclusion that these ATR activators function in separate pathways (Fig. 2 A).
Figure 2.
ATR signaling in ETAA1 and TOPBP1-deficient cell lines. (A) HCT116 (WT), ETAA1ΔAAD, TOPBP1-AID, and ETAA1ΔAAD/TOPBP1-AID cells were treated with DMSO or IAA for 2 or 24 h and γH2AX induction measured by immunofluorescence imaging. Representative images and quantification of two independent experiments are show. Displayed is mean and SEM for each sample with >1,000 cells measured for each condition. Bar, 10 µm. (B) Cells were treated with 100 nM CPT for 4 h following a 2-h pretreatment with IAA or DMSO as indicated, then lysed and immunoblotted with the indicated antibodies. Molecular weight is given in kilodaltons.
To examine replication stress signaling, cells were treated with 100 nM camptothecin (CPT) for 4 h following a 2-h pretreatment with IAA. As previously observed in other cell types (Bass et al., 2016), loss of ETAA1-dependent ATR activation resulted in a reduction in RPA phosphorylation, but did not strongly affect CHK1 phosphorylation (Fig. 2 B). While addition of the AID tag lowered endogenous TOPBP1 levels, these cells remained capable of activating ATR and only showed reduced ATR signaling after treatment with IAA to degrade TOPBP1 (Fig. 2 B). Cells deficient for both ETAA1 and TOPBP1 exhibited more severe defects in RPA and ATR phosphorylation than the single mutants, further demonstrating that ETAA1 and TOPBP1 function in separate pathways to activate ATR (Fig. 2 B).
Quantitative phosphoproteomics identifies ETAA1 and TOPBP1-dependent phosphosites
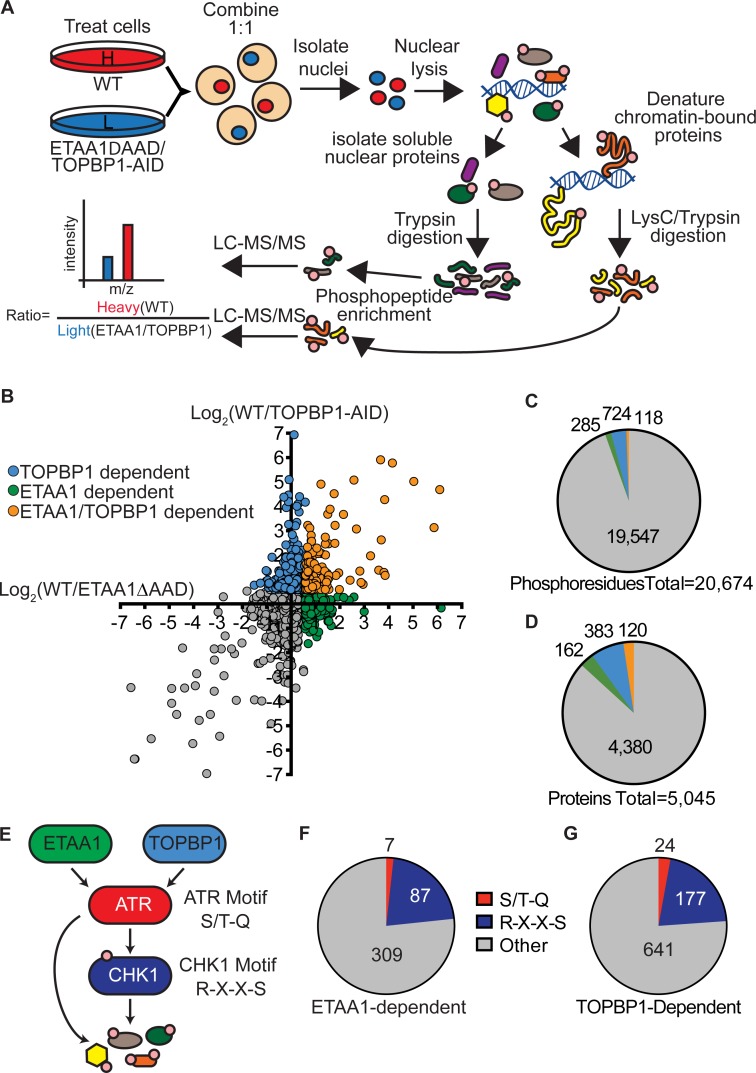
To examine how each ATR activator differentially regulates ATR signaling responses, we compared the nuclear phosphoproteomes of WT cells to cells deficient for each ATR activator using stable isotope labeling using amino acids in cell culture (SILAC)–mass spectrometry (Fig. 3 A). WT, ETAA1ΔADD, and TOPBP1-AID cells labeled with heavy (13C) or light (12C) arginine and lysine were treated for 4 h with 100 nM CPT following a 2-h pretreatment with IAA. Cells were harvested, combined in a 1:1 ratio, nuclei isolated, lysed, and fractionated into soluble nuclear extract (NE) and insoluble/chromatin-bound proteins. The nuclear-soluble proteins were proteolyzed by treatment with trypsin, while chromatin-bound proteins were denatured in 8 M urea and subsequently proteolyzed by LysC and trypsin. Phosphopeptides from each fraction were enriched using TiO2 beads and identified and quantified by liquid chromatography–tandem mass spectrometry. The abundance of each phosphopeptide in WT compared with the ATR activator–deficient cell line was measured. Three replicates of TOPBP1-AID cells and four replicates of ETAA1ΔAAD cells were analyzed.
Figure 3.
Quantitative phosphoproteomics identifies ETAA1- and TOPBP1-dependent phosphorylation sites. (A) Schematic of SILAC-phosphoproteomics approach. (B) Scatter plot of phosphoproteomic data. Each point represents a phosphosite, and the x and y value corresponds to the log2 transformed ratios of ETAA1- and TOPBP1-dependent phosphorylation events. Higher ratio values correspond to more phosphorylation in WT cells than in ETAA1ΔAAD or TOPBP1-AID cells. (C and D) Number of phosphosites (C) and phosphoproteins (D) dependent on ETAA1, TOPBP1, or both ATR activators. (E) Diagram of ATR signaling pathway with preferred phosphorylation motifs of ATR and CHK1. (F and G) Abundance of ATR and CHK1 motifs in ETAA1- and TOPBP1-dependent phosphorylation sites.
Using this approach, we identified a total of 20,674 unique phosphosites on 4,045 proteins. Phosphosites that were observed at least twice with a median decrease in abundance in activator-deficient cells of at least 1.5-fold in either the nuclear-soluble or chromatin fractions were considered as dependent on that activator (Fig. 3 B). Using these criteria, 285 phosphosites were ETAA1 dependent, 724 phosphosites were TOPBP1 dependent, and 118 phosphosites were dependent on both ATR activators (Fig. 3 C). These phosphorylation sites were located on 162 proteins unique to ETAA1, 383 proteins unique to TOPBP1, and 120 proteins regulated by both ETAA1 and TOPBP1 (Fig. 1 D). Using a more restrictive criterion of a twofold change yielded 86 phosphosites that were ETAA1 dependent, 264 TOPBP1 dependent, and 13 phosphosites dependent on both ATR activators. Tables S1 and S2 contain a complete list of all phosphoproteomic data as well as specific ETAA1- and TOPBP1-dependent phosphosites.
While ATR can phosphorylate a variety of sequences, it preferentially phosphorylates serine or threonines followed by a glutamine (S/T-Q; Kim et al., 1999). CHK1 preferentially phosphorylates serine with an arginine in the -3 position (Fig. 3 E; R-X-X-S; O’Neill et al., 2002). Of the 403 ETAA1-dependent phosphorylation sites, only 7 corresponded to the preferred ATR motif, while 87 had a CHK1 phosphorylation motif. Of the 842 TOPBP1-dependent phosphorylation sites, 24 contained an ATR motif, while 177 had a CHK1 phosphorylation motif (Fig. 3, F and G). Thus, most of these phosphorylation events are likely to be indirectly targeted downstream of ATR by CHK1 or other ATR-regulated kinases.
Gene ontology (GO) analysis of ETAA1- and TOPBP1-dependent phosphorylation
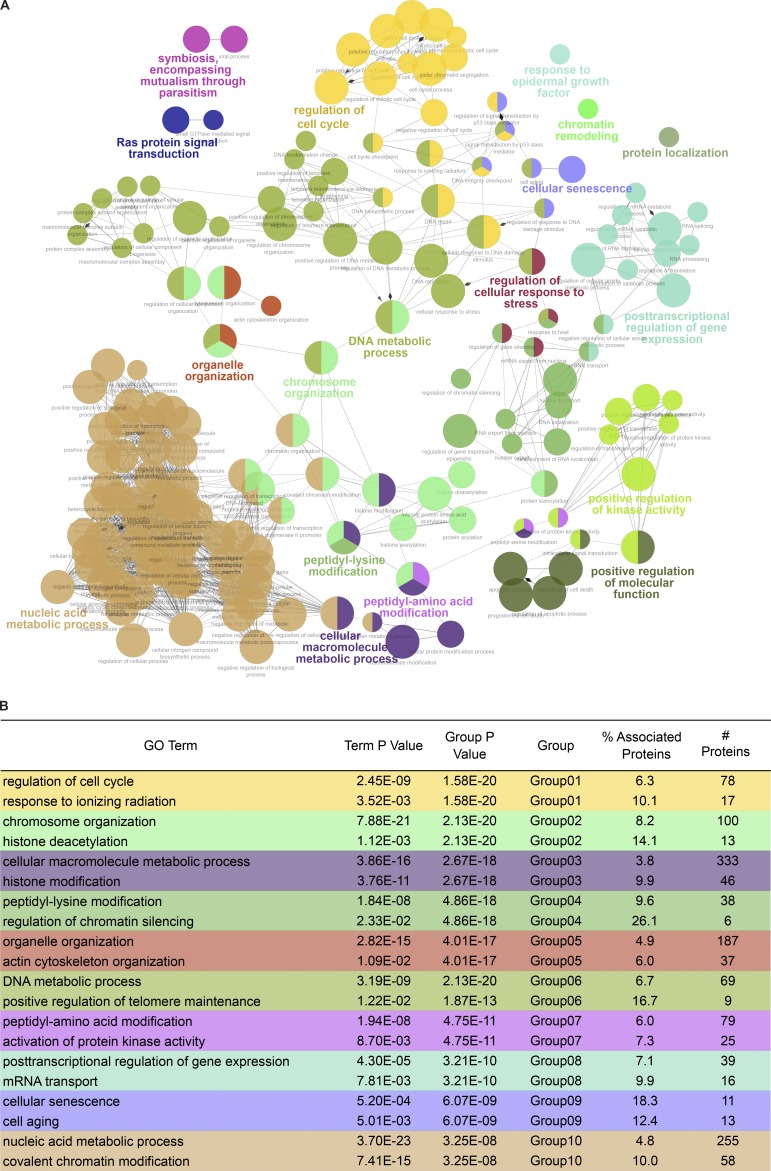
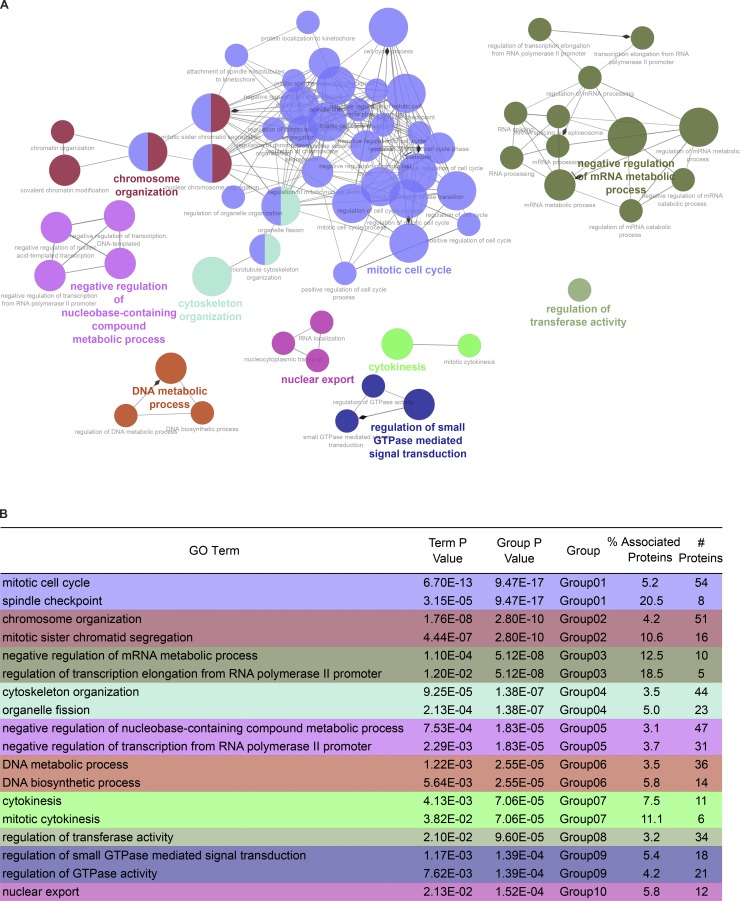
To determine if ETAA1 or TOPBP1 regulate specific biological processes, we performed a GO enrichment analysis on the phosphoproteins regulated by each ATR activator. To consolidate similar GO terms and easily visualize the relationship between terms, ClueGO was used to generate a functionally organized GO term network (Bindea et al., 2009). Phosphoproteins and their corresponding GO terms were assigned functional groups based on a kappa score that compares the observed events with those expected by random chance and iterative merging of groups containing 50% of the same proteins. The complete GO analysis is provided in Table S3, while Fig. 4 A and Fig. 5 A display the resulting GO networks for TOPBP1- and ETAA1-dependent phosphoproteins, respectively.
Figure 4.
TOPBP1-dependent phosphorylation GO analysis. (A) Functional GO network displaying grouping of GO terms enriched in TOPBP1-dependent phosphoproteins. Phosphoproteins and their corresponding GO terms were assigned functional groups after iterative merging of groups containing 50% of the same proteins. Each node in the network represents a GO term with a P value <0.05. A larger node size corresponds to more significant enrichment. Functional groups are indicated by color and represented in colored text by the most significant term in that group. Nodes with multiple colors belong to multiple groups. (B) Table displaying the 10 most highly enriched GO groups. The first term for each group represents the GO term with the highest significant enrichment. The second term for each group had the highest percentage of associated proteins for that GO group.
Figure 5.
ETAA1-dependent phosphorylation GO analysis. (A) Functional GO network displaying grouping of GO terms enriched in ETAA1-dependent phosphoproteins. Network parameters are same as described in Fig. 2 A. (B) Table displaying the 10 most highly enriched GO groups. The first term for each group represents the GO term with the highest significant enrichment. The second term for each group had the highest percentage of associated genes for that GO group.
Listed in Fig. 4 B and Fig. 5 B are the 10 most significantly enriched functional GO groups for TOPBP1 and ETAA1, along with the GO term with the highest percentage of associated genes from each group. The most highly enriched functional group for TOPBP1 (colored yellow) contained the GO terms: regulation of cell cycle, mitotic cell cycle, and DNA integrity checkpoint. The GO term from this group with the highest percentage of represented proteins is response to ionizing radiation. Other functional GO groups that TOPBP1 regulated include chromosome organization, cellular macromolecule metabolic process, and nucleic acid metabolic process. GO terms found in GO Group 1 (yellow), Group 6 (green), and Group 9 (blue), such as DNA integrity checkpoint, response to ionizing radiation, DNA repair, DNA replication, and cellular response to DNA damage stimulus, are all consistent with the known functions for TOPBP1-dependent activation of ATR in response to DNA damage and replication stress. These terms were not highly enriched in ETAA1-dependent phosphorylation events, suggesting TOPBP1 is the primary activator of ATR during DNA damage and replication stress signaling.
In contrast to TOPBP1, the most enriched functional GO group for ETAA1 contained the GO terms mitotic cell cycle, nuclear chromosome segregation, cell cycle process, and cell cycle checkpoint. The GO term with the highest percentage of represented genes from this group was spindle checkpoint. Other ETAA1-dependent GO groups were chromosome organization, negative regulation of mRNA metabolic process, cytoskeleton organization, and DNA metabolic process.
ETAA1 regulates and interacts with mitotic proteins
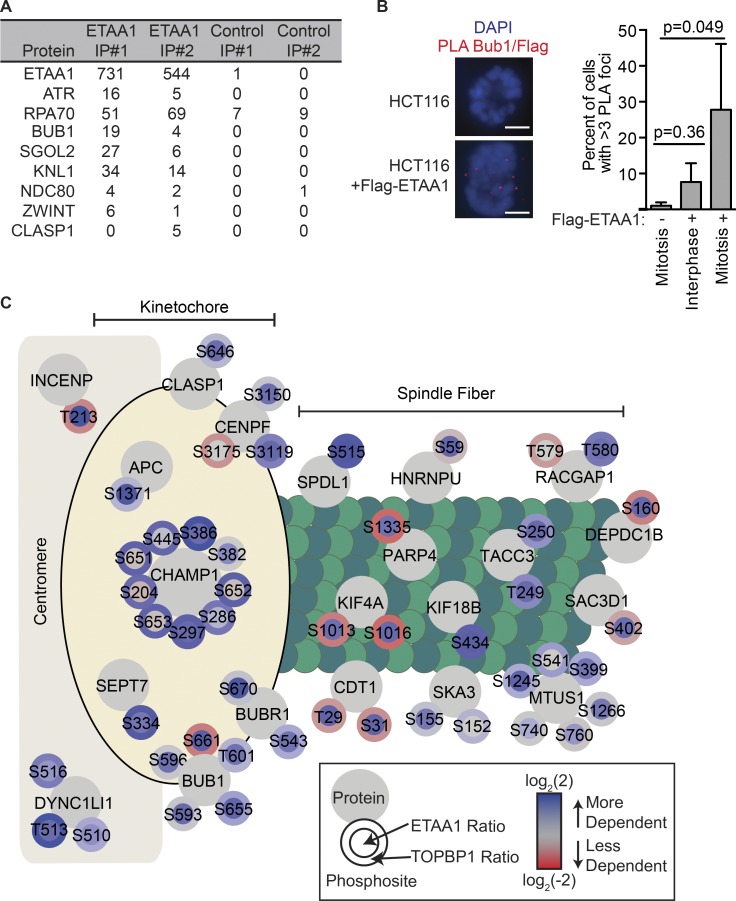
The significant enrichment of multiple mitotic GO terms in the phosphoproteome of ETAA1ΔAAD cells was striking, since the experiment was not designed to identify mitotic ATR targets. Supporting a role in mitosis, our mass spectrometry analysis of ETAA1 protein complexes indicates that multiple mitotic proteins copurify with ETAA1 including kinetochore and spindle-localized proteins such as BUB1, SGO2, KNL1, and NDC80 (Fig. 6 A). ETAA1 does not exhibit a distinct pattern of localization in mitotic cells (Fig. S1, A and B); however, ETAA1 is localized in proximity to BUB1 based on proximity ligation assays (PLAs) in cells arrested in mitosis with taxol (Fig. 6 B).
Figure 6.
ETAA1 regulates phosphoproteins at kinetochores and spindles. (A) Flag-ETAA1 was exogenously expressed in 293T cells, immunopurified, and copurifying proteins were identified by mass spectrometry. Shown are the peptide counts for two experiments with two negative controls and two Flag purifications from parental cells lacking Flag-ETAA1. (B) HCT116 cells with or without stable expression of Flag-ETAA1 were treated with 100 nM taxol for 2 h and fixed, and Flag/BUB1 PLA signals were measured in mitotic and interphase cells. Bar, 5 µm. Quantification is the mean and standard deviation of three independent experiments in which at least 100 cells were analyzed for each condition. Significance was determined by ANOVA with a Dunnett multiple comparison post-test. (C) Diagram depicting the kinetochore- and spindle-associated phosphoproteins and sites detected in the ETAA1-dependent phosphoproteome. Each large gray circle contains the protein name with the smaller surrounding circles containing the observed phosphosites. The inner and outer phosphosite circle colors indicates the quantitative dependency on ETAA1 and TOPBP1, respectively.
Although both ETAA1- and TOPBP1-regulated phosphoproteins were enriched for the GO term mitotic cell cycle, only 21 (19.6%) of the 107 mitotic proteins identified were dependent on both activators suggesting they might regulate different subpathways during mitosis (Fig. S2 A). Further analysis of these mitotic proteins revealed ETAA1-dependent phosphoproteins had a significant enrichment for proteins localizing to the kinetochore-centromere attachment site and mitotic spindle (Fig. S2, B–D), some of which are also ETAA1-interactors such as BUB1 and CLASP1. Notably, most of the kinetochore- and spindle-localized proteins were phosphorylated in an ETAA1-dependent but not TOPBP1-dependent manner (Fig. 6 C).
ETAA1 regulates Aurora B Kinase activity through an ATR pathway
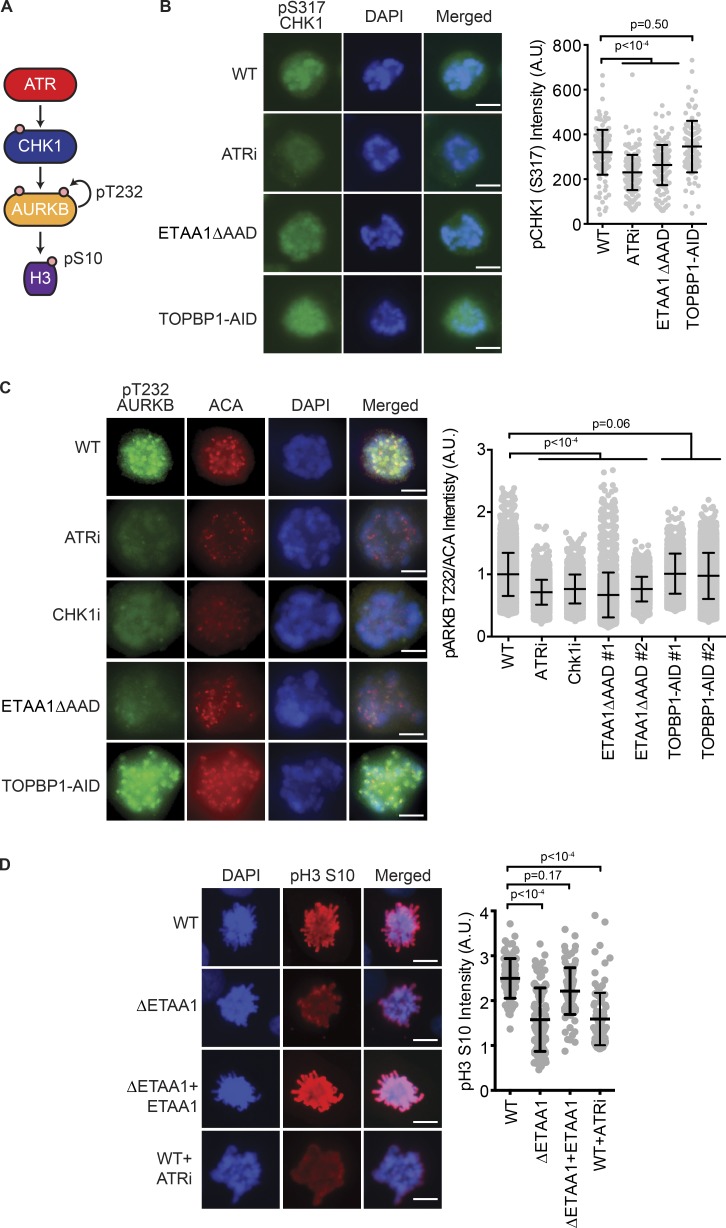
ATR, via its downstream effector CHK1, regulates the mitotic kinase Aurora B to control cell division (Fig. 7 A; Zachos et al., 2007; Peddibhotla et al., 2009; Petsalaki et al., 2011). To examine if ETAA1 or TOPBP1 regulates ATR activation of this pathway, we first asked which activator is needed to phosphorylate CHK1 in mitotic cells. In contrast to replication stress–induced CHK1 phosphorylation, mitotic CHK1 phosphorylation is largely ETAA1 dependent (Fig. 7 B).
Figure 7.
ETAA1-dependent ATR activation regulates Aurora B kinase activity. (A) Diagram of mitotic ATR signaling to Aurora B (AURKB). (B and C) CHK1 pS317 (B) or Aurora B (C) pT232 levels were measured by imaging of mitotic cells. To avoid induction of replication stress, cells were arrested in G2 by the addition of the CDK1 inhibitor (RO-3306; 10 µM) for 16 h before addition of ATRi or IAA for 2 h and then release into fresh media containing taxol. Cells were fixed 1 h after release. ACAs were used to confirm kinetochore localization of Aurora B. Shown are representative immunofluorescent images and quantification of three independent experiments with at least 100 cells analyzed per condition. Error bars represent standard deviation. (D) pH3 S10 was measured in synchronized U2OS WT, ETAA1-null (ΔETAA1), and ΔETAA1 cells stably complemented with an ETAA1 expression vector. Shown are representative immunofluorescent images and quantification of three independent experiments with at least 100 cells analyzed per condition. Error bars represent standard deviation. Significance for B–D was determined by ANOVA with a Dunnett multiple comparison post-test. Bars: 5 µm (B–D).
Next we measured Aurora B kinase activity by examining Aurora B autophosphorylation on threonine 232 and phosphorylation of its downstream substrate, histone 3 (H3) on serine 10 (S10). Comparable to inhibition of ATR or CHK1, ETAA1ΔAAD cells had reduced autophosphorylation of Aurora B at T232 in mitotic cells, whereas cells lacking TOPBP1 exhibited WT phosphorylation levels (Fig. 7 C). The decrease in Aurora B autophosphorylation was not due to a reduction in Aurora B protein levels (Fig. S3 A), nor did we observe an alteration of BUB1 levels in ETAA1- or TOPBP1-deficient cells (Fig. S3 B). Furthermore, complete knockout of ETAA1 resulted in decreased H3 S10 phosphorylation, which could be rescued by restoring expression of ETAA1 from a cDNA expression vector in ΔETAA1 cells, indicating that the regulation of Aurora B is dependent on ETAA1 (Fig. 7 D).
Loss of mitotic ETAA1-ATR signaling results in chromosome alignment defects
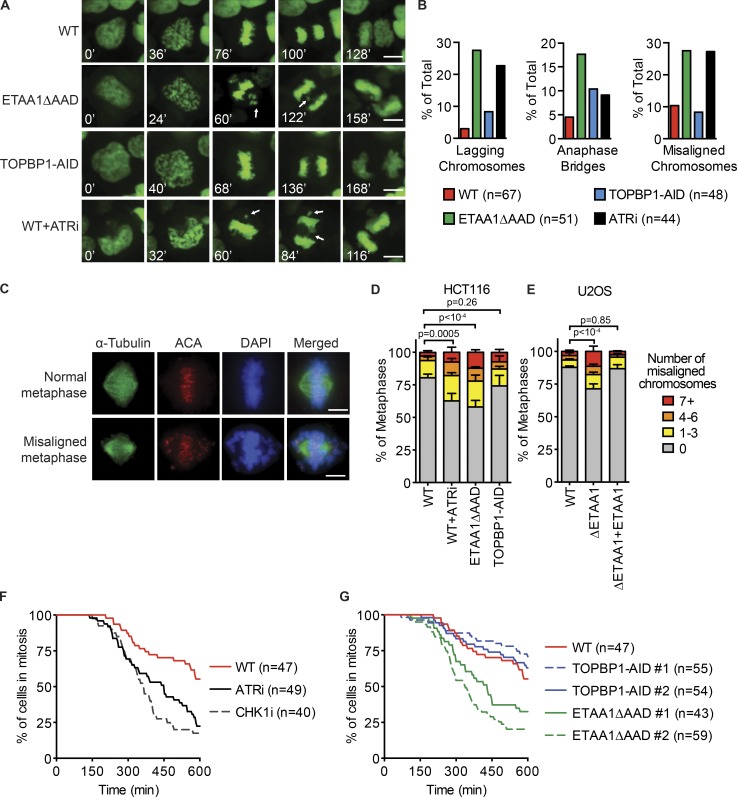
To examine the functional effects of mitotic ETAA1- and TOPBP1-dependent ATR signaling, we used live cell imaging to monitor progression of cells deficient for each ATR activator through mitosis. Cells expressing GFP-tagged histone 2B for chromatin visualization were synchronized using double thymidine block and released into fresh media. After 7 h, cells had completed DNA replication, and IAA was added at that point to degrade TOPBP1. Alternatively, we used a selective ATR inhibitor (ATRi), VE822, to inactivate ATR in G2 phase cells. As cells progressed through mitosis each cell was scored for mitotic defects such as misaligned chromosomes during metaphase and the formation of lagging chromosomes or chromatin bridges during anaphase (Fig. 8, A and B). There was no significant difference between cell lines in the time from nuclear envelope breakdown (NEB) to the onset of anaphase (Fig. S4 A). Loss of ETAA1, TOPBP1, or inhibition of ATR kinase activity all resulted in an approximately twofold increase in the frequency of anaphase bridges, which can form due to incomplete DNA replication or failure to decatenate separating chromosomes. Interestingly, the number of metaphases with misaligned chromosomes more than doubled in ETAA1ΔAAD- and ATR-inhibited cells, and the number of lagging chromosomes was >10-fold higher than in WT cells (Fig. 8, A and B; and Videos 1, 2, and 3). Many of the misaligned chromosomes in these cells became lagging chromosomes during anaphase and later formed micronuclei (Videos 2 and 3). TOPBP1-AID cells showed only a small increase in lagging chromosomes and did not display an increase in the number of metaphases with misaligned chromosomes (Fig. 8, A and B; and Video 4).
Figure 8.
ETAA1 activation of ATR is required for proper chromosome alignment and a fully functional SAC. (A and B) HCT116 WT, ETAA1ΔAAD, and TOPBP1-AID cells expressing GFP-H2B for chromatin visualization were examined by live cell imaging and scored for defects during mitosis. ATRi or IAA was added 1.5 h before beginning imaging. Representative time-lapse images are shown in A. White arrows indicate anaphase bridges and misaligned or lagging chromosomes. (B) Quantification of mitotic defects from live cell imaging experiments. Total number of cells examined for each cell type from three independent experiments is indicated in parentheses. (C) Representative immunofluorescence images of normal and misaligned chromosomes during metaphase. (D) HCT116 WT, ETAA1ΔAAD, and TOPBP1-AID cells were arrested for 16 h with CDK1i, treated with IAA or ATRi for 2 h, released from CDK1i, and fixed. Metaphase cells were scored for the number of misaligned chromosomes. (E) U2OS WT, ΔETAA1, and ΔETAA1 cells stably expressing ETAA1 were examined for chromosome misalignment as in D. D and E display the mean and standard deviation of three independent experiments in which at least 100 metaphases were examined per condition. (F) Synchronized HCT116 cells expressing H2B-GFP were released from a double thymidine block, and taxol, ATRi, or CHK1i were added 1.5 h before starting imaging. (G) Same as in F, but HCT116 WT and two clones of ETAA1ΔAAD and TOPBP1-AID cells were examined for ability to sustain mitotic arrest during taxol treatment. (F and G) The total number of cells examined for each cell type from three independent experiments is listed in parentheses. Bars: 5 µm (A and C).
To examine the severity of chromosome misalignment during metaphase, ETAA1ΔAAD-, TOPBP1-AID–, and ATRi-treated cells were stained with anti-centromere antibodies (ACAs) and scored for the number of chromosomes that were not aligned at the metaphase plate. There was a significant increase in both the frequency and severity of misalignment in ETAA1ΔAAD- and ATRi-treated cells, but not in TOPBP1-AID cells (Fig. 8, C and D). U2OS ETAA1 knockout cells also displayed an increase in the number of misaligned chromosomes, and addition of an ETAA1 cDNA to the ΔETAA1 cells rescued the misalignment defect (Fig. 8 E). These results suggest that ETAA1-ATR signaling is needed for proper chromosomes alignment in unstressed cells.
To further ensure that these mitotic phenotypes are not due to unresolved issues from S-phase arising from ETAA1 deficiency, ETAA1 was endogenously tagged with an AID using CRISPR-Cas9 to generate a degron allele. As expected, ETAA1-AID cells exhibited reduced RPA phosphorylation in response to CPT following a pretreatment with IAA (Fig. S5 A). Additionally, addition of IAA after completion of DNA replication resulted in increased misaligned chromosomes and decreased H3 S10 phosphorylation, compared with mock-treated cells, demonstrating that this phenotype is dependent on mitotic ETAA1 function (Fig. S5, B and C).
Having observed that loss of ETAA1-dependent ATR signaling causes lower Aurora B kinase activity, decreased phosphorylation of kinetochore-/spindle-associated proteins, and defects in chromosome alignment, we examined if ETAA1 and ATR are required for a fully functioning spindle assembly checkpoint (SAC). The SAC ensures genome stability by preventing the onset of anaphase until all chromosomes are properly attached via kinetochores to the spindle (Lara-Gonzalez et al., 2012). H2B-GFP–expressing cells deficient for ETAA1 and TOPBP1 were examined for their ability to maintain mitotic arrest in the presence of nocodazole by using live cell imaging. Entry into mitosis was determined by NEB and plotted as time zero. Exit from mitosis was determined by chromosome decondensation. Following treatment with 1 µM nocodazole, >90% of all WT, ETAA1ΔAAD, TOPBP1-AID, and ATRi-treated cells maintained a mitotic arrest during the 10-h observation period. Inactivation of ATR, ETAA1, or TOPBP1 also did not cause premature exit from mitosis in nocodazole-treated cells, even in the presence of 250 nM reversine (Fig. S5 D), which inhibits MPS1 and partially inactivates the SAC (Santaguida et al., 2010; Ikeda and Tanaka, 2017).
In contrast, both ATR and CHK1 inhibitors caused defects in the SAC in when cells were challenged with taxol. 10 h after NEB, only 22% of ATRi-treated and 18% of CHK1i-treated cells maintained mitotic arrest, compared with 55% of untreated cells (Fig. 8 F). This result is consistent with previous findings that the mitotic ATR signaling pathway functions in response to taxol, but not nocodazole (Zachos et al., 2007). To examine if ETAA1 or TOPBP1 primarily contributes to ATR regulation of the SAC, two ETAA1ΔAAD and TOPBP1-AID cell lines were examined for ability to maintain taxol-induced mitotic arrest. Both ETAA1ΔAAD clones showed an inability to sustain mitotic arrest with only 33% and 20% of cells remaining in mitosis 10 h after NEB (Fig. 8 G). In contrast, mitotic arrest of TOPBP1-AID cells was comparable to those of control cells. Therefore, we conclude that ETAA1 is the primary regulator of ATR activation in mitosis to promote SAC activity in response to taxol.
Discussion
We used quantitative phosphoproteomics to define ETAA1- and TOPBP1-dependent signaling. These data identified ETAA1 as the primary regulator of ATR during mitosis at centromeric regions. ETAA1-dependent ATR signaling during mitosis promotes robust Aurora B kinase activity, proper separation of chromosomes, and a fully functioning SAC.
These data also indicate that TOPBP1 regulates more of the ATR response to replication stress than ETAA1, since more than twice as many phosphosites depend on TOPBP1 than ETAA1, and replication-related proteins were much more highly enriched in the TOPBP1-dependent versus the ETAA1 phosphoproteomes. Together, these results suggest that TOPBP1 is a principle ATR activator during replication stress, while ETAA1 has important functions during the unstressed cell division cycle (Fig. 9 A).
Figure 9.
Models for ATR activation. (A) ATR is primarily activated by TOPBP1 in response to replication stress leading to phosphorylation of hundreds of proteins. ETAA1 contributes to ATR activation in response to replication stress, but regulates a smaller fraction of ATR substrates. (B) ETAA1 activates ATR localized to centromeric regions promoting full Aurora B activity, correct chromosome alignment, and a fully functional SAC.
While we quantitated >20,000 phosphosites, the phosphoproteomes lacked a large number of known direct ATR phosphorylation targets. Thus, further phosphorylation studies using additional strategies to enrich for direct targets are needed. Nonetheless, analysis of ETAA1-dependent phosphorylation events and interaction partners revealed ETAA1 functions at centromeric regions as a regulator of mitotic ATR activity (Fig. 9 B). Loss of ETAA1- but not TOPBP1-dependent ATR activation phenocopies the mitotic defects caused by inhibiting ATR or CHK1 using small molecules. CHK1 inactivation impairs the spindle assembly checkpoint through deregulation of Aurora B and Bub proteins (Zachos et al., 2007; Peddibhotla et al., 2009; Petsalaki et al., 2011), both of which exhibit reduced phosphorylation in ETAA1ΔAAD cells. Additionally, ATR can localize to RPA-coated centromeric R-loops, where it prevents the formation of lagging chromosomes (Kabeche et al., 2018), an anaphase defect observed in ETAA1ΔAAD cells. Thus, we speculate that the ability of ETAA1 to bind directly to RPA may make it the preferred ATR activator in mitosis, since TOPBP1 requires the 9-1-1 complex and a 5′-DNA junction to activate ATR (Saldivar et al., 2017).
A previous study indicates that TOPBP1 does function during mitosis at sites of under-replication, but that it is independent of ATR signaling (Pedersen et al., 2015). Additionally, TOPBP1 localizes to ultra-fine anaphase bridges and promotes their resolution through direct recruitment of topoisomerase IIα (Germann et al., 2014; Broderick et al., 2015). Therefore, while TOPBP1 is active during mitosis, its functions do not appear tied to ATR activation.
Using cells deficient for each ATR activator, we were able to separate the functions of ATR during replication stress and a normal cell cycle. These findings expand the requirement for ETAA1 to enforce normal cell cycle progression as ETAA1 was recently found to activate ATR during an unperturbed S phase to control the S/G2 transition (Saldivar et al., 2018). This separation of function parallels how different Mec1ATR activators work in yeast, where the TOPBP1 orthologue Dpb11 activates Mec1-Rad53 signaling during replication stress, while the other Mec1 activators, Dna2 and Ddc1, activate Mec1 during an unperturbed cell cycle (Bastos de Oliveira et al., 2015). In conclusion, ETAA1 and TOPBP1 promote genome stability through regulation of different ATR signaling pathways, with ETAA1 having a dominant function in controlling chromosome segregation during mitosis.
Materials and methods
Cell culture
U2OS and HEK293T cells were cultured in DMEM + 7.5% FBS, and HCT116 cells were cultured in McCoy’s 5A media + 10% FBS. HCT116 SILAC cells were cultured in DMEM + 10% dialyzed FBS supplemented with light (12C) or heavy (13C) arginine and lysine. Plasmid transfections were performed by polyethylenimine. U2OS ETAA1-null cells and complemented ETAA1-null cells were produced and described previously (Bass et al., 2016). ETAA1ΔAAD cells were produced in HCT116 cells using the gRNAs previously used to generate U2OS and HEK293T ΔAAD cells (Bass et al., 2016). All cell lines were verified by PCR, sequencing, and immunoblotting.
TOPBP1-AID and ETAA1-AID cells were produced following the protocol outlined in (Natsume et al., 2016). First, HCT116 cells were transfected with pMK232 (CMV-OsTIR1-PURO; Addgene plasmid 72834) and pX330 (AAVS1-T2-CRIPR; Addgene plasmid 72833) and cells stably expressing TIR1 selected for with 2 µg/ml puromycin. Next, homology arms surrounding the stop codon of TOPBP1 and ETAA1 were cloned into pBluescriptII separated by a BamH1 restriction site. The AID degron with neomycin (Neo) and hygromycin (Hygro) selectable markers was removed from pMK289 (AID-mClover-NeoR; Addgene plasmid 72827) and pMK290 (AID-mClover-Hygro; Addgene plasmid 72828) by BamH1 digest and inserted between the TOPBP1 or ETAA1 homology arms. Both neomycin- and hygromycin-encoding template plasmids were cotransfected with pSpCas9(BB)-2A-Puro (Addgene plasmid 48139) containing a guide RNA proximal to the stop codon of TOPBP1 (gRNA: 5′-GGACTGGATTATCACAAAAGAGG-3′) or ETAA1 (gRNA: 5′-CTTTTTCTCTGAATTTCTTCAGG-3′). Cells with homozygous editing were selected by 700 µg/ml G418 and 100 µg/ml HygroGold and confirmed by DNA sequencing and SDS-PAGE immunoblotting.
The following drugs were used: ATRi (VX970; 1 µM), CHK1i (MK-8776), CDK1i (RO-3306; 10 µM), IAA (500 µM), nocodazole (1 µM), reversine (250 mM), taxol (100 nM), and thymidine (2 mM).
Cell growth and viability assays
Cells were plated in a 35-mm dish and left untreated or treated with 500 µM IAA. Cells were counted every 24 h for 4 d. Cell number and percent viable cells were measured after trypan blue staining, using a Countess II automated cell counter.
Preparation of samples for phosphoproteomics
For each condition 4.5 × 10⁷ HCT116-WT and HCT116-ETAA1ΔAAD or TOPBP1-AID cells were grown in heavy (13C) and light (12C) SILAC DMEM with 10% dialyzed FBS. The following day, cells were treated with 100 nM CPT following a 2-h pretreatment with 500 µM IAA. Approximately 7 × 10⁷ cells were harvested for each labeling condition, counted, and combined in a 1:1 ratio. Cells were resuspended in hypotonic buffer (10 mM Hepes, pH 7.9, 1.5 mM MgCl2, 10 mM KCl, 0.2 mM PMSF, and 0.5 mM DTT) for 10 min at 4°C and lysed via dounce homogenization. Nuclei were pelleted at 3,300 RCF for 15 min at 4°C and then resuspended in low salt buffer (20 mM Hepes, pH 7.9, 25% glycerol, 1.5 mM MgCl2, 20 mM KCl, 0.2 mM EDTA, 0.2 mM PMSF, and 0.5 mM DTT) followed by mixing with an equal amount of high salt buffer (same as low salt buffer but with 1.6 mM KCl). Following a 30-min incubation at 4°C, NEs were centrifuged for 20 min at 16,000 RCF.
The supernatant contained nuclear-soluble proteins which were dialyzed (20 mM Hepes, pH 7.9, 10% glycerol, 100 mM KCl, 0.2 mM EDTA, 0.2 mM PMSF, and 0.5 mM DTT) for 1 h at 4°C. Following dialysis, DTT was added to 20 mM, and NE was incubated for 30 min at room temperature. Denatured proteins were alkylated by addition of 50 mM chloroacetamide and incubated for 40 min at room temperature. Phosphoproteins were subsequently proteolyzed by treatment with trypsin. The chromatin pellet was resuspended in denaturation buffer (8 M Urea, 100 mM Tris, pH 8.0, and 20 mM DTT) and incubated for 30 min at room temperature. Denatured proteins were alkylated by addition of 50 mM chloroacetamide and incubated for 40 min at room temperature. Proteins were then proteolyzed by LysC (1:100; mg:mg) and incubated overnight at 30°C. Phosphopeptides were then diluted 1:4 with ammonium bicarbonate and then trypsinized.
Phosphoproteomics analysis
Prior to analysis, the outputs from MaxQuant were filtered to remove reverse sequences and known contaminants. The SILAC ratios for each experiment were log2-transformed using Perseus. The median value for each phosphosite was calculated for the NE and chromatin pellet fractions. Phosphosites that were observed at least twice with a median change in abundance in activator-deficient cells of at least 1.5-fold in either the nuclear-soluble or chromatin fractions are reported as dependent on that activator. ATR and CHK1 phosphorylation motifs were analyzed using Icelogo (Colaert et al., 2009). Comparison of ETAA1 and TOPBP1 phosphorylation sites at kinetochores was performed using Phosphopath, a Cytoscape application (Shannon et al., 2003; Raaijmakers et al., 2015).
Antibodies, immunoprecipitation, and immunofluorescence
The following antibodies were used at 1:1,000 dilution for Western blotting or 1:200 for immunofluorescence unless otherwise noted: γH2AX (2577, Cell Signaling, rabbit), RPA32 (ab2175, 9H8, Abcam, mouse), pRPA32 S4/8 (A300-245A2, Bethyl, rabbit), pRPA32 S33 (A300-246A, Bethyl, rabbit), Flag (F-3165, M2, Sigma, mouse), ATR (SC-1887, N-19, Santa Cruz, goat), CHK1 (1:750, sc-8408, G4, Santa Cruz, mouse), CHK1 pS317 (2344S, Cell Signaling, rabbit), TOPBP1 (A300-111A-1, BL893, Bethyl, rabbit), BUB1 (A300-373A-M, Bethyl, rabbit), pH3 S10 (3377, Cell signaling, rabbit), Aurora B (A300-431A, Bethyl, rabbit), Aurora B pT232 (600-401-677, Roche, rabbit), α-tubulin (sc-5286, Santa Cruz, mouse), and anti-centromere antibodies (15-234-0001, Antibodies Inc., human). Custom ETAA1 antibodies were produced by Covance and were previously described (Bass et al., 2016). Alexa Fluor 488– or Alexa Fluor 594–conjugated secondary antibodies were purchased from ThermoFisher.
Immunoprecipitation and mass spectrometry were performed as previously described (Bass et al., 2016). For immunofluorescence experiments, cells were plated on polylysine-coated slides and fixed in 3% paraformaldehyde. Slides were blocked with 5% BSA in PBS and incubated with antibody at room temperature. ProLong Gold (Invitrogen) was used as mounting media. Immunofluorescent images were obtained with a Nikon Eclipse microscope, Plan Fluor 40× oil immersion objective (1.30 NA; WD 0.20 mm), with a DS-Qi2 camera set for fixed exposure times. pH3 S10 and Aurora B pT232 intensities were determined using Nikon NIS Elements software. PLA and γH2AX signal intensities were measured using Cell Profiler software. The number of misaligned kinetochores was scored manually from >100 metaphase cells per condition per experiment.
GO analysis
ETAA1 and TOPBP1 proteins were analyzed using the ClueGO plugin for Cytoscape (Shannon et al., 2003; Bindea et al., 2009). For grouping of GO terms, the kappa score was set to 0.4 and the number of overlapping genes to combine groups was set to 50%.
Proximity ligation assay
Cells were plated and fixed as described for other immunofluorescence experiments. PLA was completed according to manufacturer’s instructions (Duolink, Sigma).
Live cell imaging
Cells expressing H2B-GFP were generated by lentiviral infection. Cells were plated in an 8-well chamber and synchronized by double thymidine block then released from thymidine into FluoroBrite DMEM for 7 h to allow completion of DNA replication before addition of 1 µM ATRi or 500 µM IAA for 1.5-h before starting imaging. Cells were mounted on a Nikon Eclipse microscope and imaged using a Plan Fluor 40× oil immersion objective (1.30 NA; WD 0.20 mm) with an Andor DU-897 EM charge-coupled device camera. Images were taken continuously for 14–16 h with 4-min intervals and z stacks of 25 µM at 37°C. The time in mitosis was measured from NEB to completion of anaphase. Cells were scored manually for mitotic defects, such as misaligned or lagging chromosomes and chromatin bridges.
For SAC assays, cells were synchronized by double thymidine block followed by addition of 100 nM taxol or 1 µM nocodazole plus 1 µM ATRi, 2 µM CHK1i, 250 mM reversine, or 500 µM IAA 7 h after release. Cells were imaged for 16 h as described above. Entry into mitosis was determined by NEB and plotted as time zero. Exit from mitosis was determined by chromosome decondensation.
Statistical analysis
All statistical analyses were completed using Prism, and the statistical test is indicated in the figure legend.
Online supplemental material
Fig. S1 shows the localization of ETAA1 in mitotic cells. Fig. S2 shows a summary of the mitotic proteins identified in the phosphoproteomics datasets. Fig. S3 presents an analysis of Aurora B kinase and BUB1 levels in ETAA1- and TOPBP1-deficient cells. Fig. S4 shows the time to complete mitosis in ETAA1- and TOPBP1-deficient cells. Fig. S5 examines the mitotic phenotypes associated with degrading ETAA1 protein using an AID. Videos 1, 2, 3, and 4 are examples of cells WT, ATR-inhibited, ETAA1-, and TOPBP1-deficient cells progressing through mitosis. Table S1 contains all of the phosphoproteomic data. Table S2 presents lists of ETAA1- and TOPBP1-dependent phosphorylation sites. Table S3 presents the complete GO analysis of ETAA1- and TOPBP1-dependent phosphoproteomes.
Supplementary Material
Acknowledgments
We thank Dr. Todd Stukenberg for critically reading the manuscript and providing advice and reagents. We also thank Kristie Rose and Salisha Hill for processing the mass spectrometry samples.
This work was funded by National Institutes of Health grants R01CA102729 and R01CA239161 to D. Cortez.
The authors declare no competing financial interests.
Author contributions: T.E. Bass designed the study, completed the experiments, analyzed the results, and wrote the manuscript. D. Cortez designed the study, analyzed results, wrote the manuscript, and provided funding.
References
- Bass T.E., Luzwick J.W., Kavanaugh G., Carroll C., Dungrawala H., Glick G.G., Feldkamp M.D., Putney R., Chazin W.J., and Cortez D.. 2016. ETAA1 acts at stalled replication forks to maintain genome integrity. Nat. Cell Biol. 18:1185–1195. 10.1038/ncb3415 [DOI] [PMC free article] [PubMed] [Google Scholar]
- Bastos de Oliveira F.M., Kim D., Cussiol J.R., Das J., Jeong M.C., Doerfler L., Schmidt K.H., Yu H., and Smolka M.B.. 2015. Phosphoproteomics reveals distinct modes of Mec1/ATR signaling during DNA replication. Mol. Cell. 57:1124–1132. 10.1016/j.molcel.2015.01.043 [DOI] [PMC free article] [PubMed] [Google Scholar]
- Bindea G., Mlecnik B., Hackl H., Charoentong P., Tosolini M., Kirilovsky A., Fridman W.-H., Pagès F., Trajanoski Z., and Galon J.. 2009. ClueGO: a Cytoscape plug-in to decipher functionally grouped gene ontology and pathway annotation networks. Bioinformatics. 25:1091–1093. 10.1093/bioinformatics/btp101 [DOI] [PMC free article] [PubMed] [Google Scholar]
- Broderick R., Nieminuszczy J., Blackford A.N., Winczura A., and Niedzwiedz W.. 2015. TOPBP1 recruits TOP2A to ultra-fine anaphase bridges to aid in their resolution. Nat. Commun. 6:6572 10.1038/ncomms7572 [DOI] [PMC free article] [PubMed] [Google Scholar]
- Cimprich K.A., and Cortez D.. 2008. ATR: an essential regulator of genome integrity. Nat. Rev. Mol. Cell Biol. 9:616–627. 10.1038/nrm2450 [DOI] [PMC free article] [PubMed] [Google Scholar]
- Colaert N., Helsens K., Martens L., Vandekerckhove J., and Gevaert K.. 2009. Improved visualization of protein consensus sequences by iceLogo. Nat. Methods. 6:786–787. 10.1038/nmeth1109-786 [DOI] [PubMed] [Google Scholar]
- Cotta-Ramusino C., McDonald E.R. III, Hurov K., Sowa M.E., Harper J.W., and Elledge S.J.. 2011. A DNA damage response screen identifies RHINO, a 9-1-1 and TopBP1 interacting protein required for ATR signaling. Science. 332:1313–1317. 10.1126/science.1203430 [DOI] [PMC free article] [PubMed] [Google Scholar]
- Delacroix S., Wagner J.M., Kobayashi M., Yamamoto K., and Karnitz L.M.. 2007. The Rad9-Hus1-Rad1 (9-1-1) clamp activates checkpoint signaling via TopBP1. Genes Dev. 21:1472–1477. 10.1101/gad.1547007 [DOI] [PMC free article] [PubMed] [Google Scholar]
- Duursma A.M., Driscoll R., Elias J.E., and Cimprich K.A.. 2013. A role for the MRN complex in ATR activation via TOPBP1 recruitment. Mol. Cell. 50:116–122. 10.1016/j.molcel.2013.03.006 [DOI] [PMC free article] [PubMed] [Google Scholar]
- Feng S., Zhao Y., Xu Y., Ning S., Huo W., Hou M., Gao G., Ji J., Guo R., and Xu D.. 2016. Ewing Tumor-associated Antigen 1 Interacts with Replication Protein A to Promote Restart of Stalled Replication Forks. J. Biol. Chem. 291:21956–21962. 10.1074/jbc.C116.747758 [DOI] [PMC free article] [PubMed] [Google Scholar]
- Garcia V., Furuya K., and Carr A.M.. 2005. Identification and functional analysis of TopBP1 and its homologs. DNA Repair (Amst.). 4:1227–1239. 10.1016/j.dnarep.2005.04.001 [DOI] [PubMed] [Google Scholar]
- Germann S.M., Schramke V., Pedersen R.T., Gallina I., Eckert-Boulet N., Oestergaard V.H., and Lisby M.. 2014. TopBP1/Dpb11 binds DNA anaphase bridges to prevent genome instability. J. Cell Biol. 204:45–59. 10.1083/jcb.201305157 [DOI] [PMC free article] [PubMed] [Google Scholar]
- Haahr P., Hoffmann S., Tollenaere M.A.X., Ho T., Toledo L.I., Mann M., Bekker-Jensen S., Räschle M., and Mailand N.. 2016. Activation of the ATR kinase by the RPA-binding protein ETAA1. Nat. Cell Biol. 18:1196–1207. 10.1038/ncb3422 [DOI] [PubMed] [Google Scholar]
- Ikeda M., and Tanaka K.. 2017. Plk1 bound to Bub1 contributes to spindle assembly checkpoint activity during mitosis. Sci. Rep. 7:8794 10.1038/s41598-017-09114-3 [DOI] [PMC free article] [PubMed] [Google Scholar]
- Kabeche L., Nguyen H.D., Buisson R., and Zou L.. 2018. A mitosis-specific and R loop-driven ATR pathway promotes faithful chromosome segregation. Science. 359:108–114. 10.1126/science.aan6490 [DOI] [PMC free article] [PubMed] [Google Scholar]
- Kim S.T., Lim D.S., Canman C.E., and Kastan M.B.. 1999. Substrate specificities and identification of putative substrates of ATM kinase family members. J. Biol. Chem. 274:37538–37543. 10.1074/jbc.274.53.37538 [DOI] [PubMed] [Google Scholar]
- Kumagai A., Lee J., Yoo H.Y., and Dunphy W.G.. 2006. TopBP1 activates the ATR-ATRIP complex. Cell. 124:943–955. 10.1016/j.cell.2005.12.041 [DOI] [PubMed] [Google Scholar]
- Kumar S., and Burgers P.M.. 2013. Lagging strand maturation factor Dna2 is a component of the replication checkpoint initiation machinery. Genes Dev. 27:313–321. 10.1101/gad.204750.112 [DOI] [PMC free article] [PubMed] [Google Scholar]
- Lanz M.C., Oberly S., Sanford E.J., Sharma S., Chabes A., and Smolka M.B.. 2018. Separable roles for Mec1/ATR in genome maintenance, DNA replication, and checkpoint signaling. Genes Dev. 32:822–835. 10.1101/gad.308148.117 [DOI] [PMC free article] [PubMed] [Google Scholar]
- Lara-Gonzalez P., Westhorpe F.G., and Taylor S.S.. 2012. The spindle assembly checkpoint. Curr. Biol. 22:R966–R980. 10.1016/j.cub.2012.10.006 [DOI] [PubMed] [Google Scholar]
- Lee J., Kumagai A., and Dunphy W.G.. 2007. The Rad9-Hus1-Rad1 checkpoint clamp regulates interaction of TopBP1 with ATR. J. Biol. Chem. 282:28036–28044. 10.1074/jbc.M704635200 [DOI] [PubMed] [Google Scholar]
- Lee Y.-C., Zhou Q., Chen J., and Yuan J.. 2016. RPA-Binding Protein ETAA1 Is an ATR Activator Involved in DNA Replication Stress Response. Curr. Biol. 26:3257–3268. 10.1016/j.cub.2016.10.030 [DOI] [PMC free article] [PubMed] [Google Scholar]
- Lindsey-Boltz L.A., Kemp M.G., Capp C., and Sancar A.. 2015. RHINO forms a stoichiometric complex with the 9-1-1 checkpoint clamp and mediates ATR-Chk1 signaling. Cell Cycle. 14:99–108. 10.4161/15384101.2014.967076 [DOI] [PMC free article] [PubMed] [Google Scholar]
- Mordes D.A., Nam E.A., and Cortez D.. 2008. Dpb11 activates the Mec1-Ddc2 complex. Proc. Natl. Acad. Sci. USA. 105:18730–18734. 10.1073/pnas.0806621105 [DOI] [PMC free article] [PubMed] [Google Scholar]
- Natsume T., Kiyomitsu T., Saga Y., and Kanemaki M.T.. 2016. Rapid Protein Depletion in Human Cells by Auxin-Inducible Degron Tagging with Short Homology Donors. Cell Reports. 15:210–218. 10.1016/j.celrep.2016.03.001 [DOI] [PubMed] [Google Scholar]
- Navadgi-Patil V.M., and Burgers P.M.. 2008. Yeast DNA replication protein Dpb11 activates the Mec1/ATR checkpoint kinase. J. Biol. Chem. 283:35853–35859. 10.1074/jbc.M807435200 [DOI] [PMC free article] [PubMed] [Google Scholar]
- Navadgi-Patil V.M., and Burgers P.M.. 2009. The unstructured C-terminal tail of the 9-1-1 clamp subunit Ddc1 activates Mec1/ATR via two distinct mechanisms. Mol. Cell. 36:743–753. 10.1016/j.molcel.2009.10.014 [DOI] [PMC free article] [PubMed] [Google Scholar]
- Navadgi-Patil V.M., and Burgers P.M.. 2011. Cell-cycle-specific activators of the Mec1/ATR checkpoint kinase. Biochem. Soc. Trans. 39:600–605. 10.1042/BST0390600 [DOI] [PubMed] [Google Scholar]
- O’Neill T., Giarratani L., Chen P., Iyer L., Lee C.-H., Bobiak M., Kanai F., Zhou B.-B., Chung J.H., and Rathbun G.A.. 2002. Determination of substrate motifs for human Chk1 and hCds1/Chk2 by the oriented peptide library approach. J. Biol. Chem. 277:16102–16115. 10.1074/jbc.M111705200 [DOI] [PubMed] [Google Scholar]
- Peddibhotla S., Lam M.H., Gonzalez-Rimbau M., and Rosen J.M.. 2009. The DNA-damage effector checkpoint kinase 1 is essential for chromosome segregation and cytokinesis. Proc. Natl. Acad. Sci. USA. 106:5159–5164. 10.1073/pnas.0806671106 [DOI] [PMC free article] [PubMed] [Google Scholar]
- Pedersen R.T., Kruse T., Nilsson J., Oestergaard V.H., and Lisby M.. 2015. TopBP1 is required at mitosis to reduce transmission of DNA damage to G1 daughter cells. J. Cell Biol. 210:565–582. 10.1083/jcb.201502107 [DOI] [PMC free article] [PubMed] [Google Scholar]
- Petsalaki E., Akoumianaki T., Black E.J., Gillespie D.A.F., and Zachos G.. 2011. Phosphorylation at serine 331 is required for Aurora B activation. J. Cell Biol. 195:449–466. 10.1083/jcb.201104023 [DOI] [PMC free article] [PubMed] [Google Scholar]
- Raaijmakers L.M., Giansanti P., Possik P.A., Mueller J., Peeper D.S., Heck A.J.R., and Altelaar A.F.M.. 2015. PhosphoPath: Visualization of Phosphosite-centric Dynamics in Temporal Molecular Networks. J. Proteome Res. 14:4332–4341. 10.1021/acs.jproteome.5b00529 [DOI] [PubMed] [Google Scholar]
- Saldivar J.C., Cortez D., and Cimprich K.A.. 2017. The essential kinase ATR: ensuring faithful duplication of a challenging genome. Nat. Rev. Mol. Cell Biol. 18:622–636. 10.1038/nrm.2017.67 [DOI] [PMC free article] [PubMed] [Google Scholar]
- Saldivar J.C., Hamperl S., Bocek M.J., Chung M., Bass T.E., Cisneros-Soberanis F., Samejima K., Xie L., Paulson J.R., Earnshaw W.C., et al. 2018. An intrinsic S/G2 checkpoint enforced by ATR. Science. 361:806–810. 10.1126/science.aap9346 [DOI] [PMC free article] [PubMed] [Google Scholar]
- Santaguida S., Tighe A., D’Alise A.M., Taylor S.S., and Musacchio A.. 2010. Dissecting the role of MPS1 in chromosome biorientation and the spindle checkpoint through the small molecule inhibitor reversine. J. Cell Biol. 190:73–87. 10.1083/jcb.201001036 [DOI] [PMC free article] [PubMed] [Google Scholar]
- Shannon P., Markiel A., Ozier O., Baliga N.S., Wang J.T., Ramage D., Amin N., Schwikowski B., and Ideker T.. 2003. Cytoscape: a software environment for integrated models of biomolecular interaction networks. Genome Res. 13:2498–2504. 10.1101/gr.1239303 [DOI] [PMC free article] [PubMed] [Google Scholar]
- Zachos G., Black E.J., Walker M., Scott M.T., Vagnarelli P., Earnshaw W.C., and Gillespie D.A.F.. 2007. Chk1 is required for spindle checkpoint function. Dev. Cell. 12:247–260. 10.1016/j.devcel.2007.01.003 [DOI] [PMC free article] [PubMed] [Google Scholar]
- Zhou Z.-W., Liu C., Li T.-L., Bruhn C., Krueger A., Min W., Wang Z.-Q., and Carr A.M.. 2013. An essential function for the ATR-activation-domain (AAD) of TopBP1 in mouse development and cellular senescence. PLoS Genet. 9:e1003702 10.1371/journal.pgen.1003702 [DOI] [PMC free article] [PubMed] [Google Scholar]
Associated Data
This section collects any data citations, data availability statements, or supplementary materials included in this article.


