

Summary
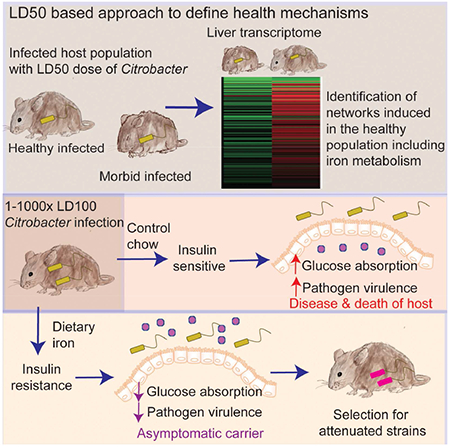
Pathogen virulence exists on a continuum. The strategies that drive symptomatic or asymptomatic infections remain largely unknown. We took advantage of the concept of lethal dose 50 (LD50) to ask which component of individual non-genetic variation between hosts defines whether they survive or succumb to infection. Using the enteric pathogen Citrobacter, we found no difference in pathogen burdens between healthy and symptomatic populations. Iron metabolism-related genes were induced in asymptomatic hosts compared to symptomatic or naïve mice. Dietary iron conferred complete protection without influencing pathogen burdens, even at 1000× the lethal dose of Citrobacter. Dietary iron induced insulin resistance, increasing glucose levels in the intestine that was necessary and sufficient to suppress pathogen virulence. A short course of dietary iron drove the selection of attenuated Citrobacter strains that can transmit and asymptomatically colonize naïve hosts, demonstrating that environmental factors and co-operative metabolic strategies can drive conversion of pathogens towards commensalism.
Graphical Abstract
In brief:
Defense strategies that are cooperative rather than antagonistic can promote asymptomatic infection and select for reduced virulence in a bacterial pathogen
Introduction
Host-microbe interactions can rarely be defined strictly as pathogenic, benign, or beneficial, but rather the ability of a microbe to cause disease (i.e., virulence) exists as a continuum. Where a microbe lies on this continuum is dependent on the context in which the host-microbe interaction occurs. This is best appreciated in cases for which disease is a direct function of microbial burden, for example with opportunistic infections in immunocompromised individuals, and infections in individuals who have traits restricting growth (Elguero et al., 2015; Luzzatto, 2012). What is less well understood are the contexts in which pathogens are capable of infecting, replicating and persisting in their hosts but do not cause disease, such as with subclinical or latent infections and “healthy” carriers that harbor “pathogenic” microbes (Bruner et al., 2015; Chen et al., 2016; Furuya-Kanamori et al., 2016; Ganguly et al., 2013; Marineli et al., 2013; Riggs et al., 2007). The mechanisms that mediate such relationships are not universally known, however, environmental effects likely dictate whether a microbe will or will not behave as a pathogen within its host.
The ability of a pathogen to cause disease, in part, is dependent on direct effects of the pathogen on host physiologies. Pathogens are equipped with virulence factors enabling the pathogen to achieve specialized niches where they can replicate and be transmitted to new hosts, ultimately resulting in disease. While virulence factors are adaptation factors to promote pathogen fitness, their expression must be tightly regulated to achieve the optimal balance between pathology and fitness, as too much pathology could ultimately compromise both the host and the pathogen (Ayres, 2016; Rao et al., 2017). For pathogens that asymptomatically and persistently infect hosts, it appears a new equilibrium has been reached between the host and the pathogen in which pathogen fitness is achieved, without the need for employing virulence factors, and resulting in an otherwise healthy host.
Host adaptations will also dictate whether disease will occur in host-pathogen interactions. Defense against infections can be divided into two broad strategies, categorized by their effects on pathogen fitness (Ayres, 2016). Antagonistic strategies include resistance and avoidance mechanisms that protect the host by having a negative impact on pathogen fitness (Medzhitov et al., 2012; Schneider and Ayres, 2008). In turn, these strategies drive the oscillation of attack and counterattack adaptations in microbial populations; the Red Queen Effect (Ayres, 2016). Disease typically results from antagonistic interactions. A second strategy of host defense that is co-operative by nature, protects the host while having a neutral to positive impact on microbial fitness (Ayres, 2016). Co-operative strategies include disease tolerance mechanisms, which act to prevent and alleviate physiological damage that occurs during infection, without killing the pathogen (Medzhitov et al., 2012; Schneider and Ayres, 2008). In addition, it has been proposed that the host has evolved anti-virulence physiological responses that protect the host during infection and promote pathogen fitness by dampening pathogen virulent behavior without affecting pathogen burdens (Ayres, 2016). So long as the pathology that is alleviated is not needed for pathogen transmission, co-operative strategies can promote microbial fitness through sustaining host health. The concept of co-operative defenses and the mechanisms contributing to this defense strategy provides an opportunity to understand variations in host susceptibility to infections and the contexts in which pathogens do not behave as pathogens.
Here, we describe a new approach to define the physiological circuitry of the host that is associated with co-operative defenses during infections. We demonstrate how this approach can be used to mechanistically define how asymptomatic carriage of a pathogen can be favored by host adaptations. Using the naturally occurring mouse – Citrobacter rodentium (CR) host-pathogen system, we found a previously unappreciated role for host iron metabolism in triggering physiological changes in the host, leading to attenuation of CR virulence and promoting asymptomatic persistent infection with the pathogen. Dietary iron led to insulin resistance (IR) in the host that was necessary and sufficient to reduce absorption of glucose from the intestine, increasing availability of glucose to the pathogen in the gut and suppressing virulence factor expression. Dietary iron and IR resulted in long term asymptomatic carriage of CR and the selection for attenuated CR strains that were capable of infecting and persisting in new hosts without causing disease. Our study provides a mechanism for how co-operative host metabolic adaptations factors can induce a physiological response in the host that operates as an anti-virulence mechanism, promoting long term carriage and selection for attenuated pathogens.
Results
Systems approaches to elucidate co-operative defense mechanisms in host-pathogen interactions.
Lethal dose 50 (LD50) describes the microbe dose that kills 50% of a host population. We hypothesized that this system would be useful for defining co-operative defenses mechanistically. We used CR to test our hypothesis because co-operative mechanisms can be revealed in systems in which there has been co-evolution between the host and the pathogen (Ayres, 2016), as is the case with this naturally occurring microbe. Oral infection of C3H/HeJ mice with CR at the LD100 dose results in 100% lethality and is associated with quantifiable clinical symptoms including weight loss, diarrhea and morbidity (Figure 1A-E). By dose titration we revealed an LD50 dose of CR for C3H/HeJ mice, resulting in 50% mortality of the host population (Figure 1A). The living and dying populations of LD50-challenged mice followed two different clinical trajectories that correlated with the outcome of infection (Figure 1B-E). To determine the relationship between the fates of the healthy and dying populations and pathogen burdens, we challenged animals with an LD50 dose of CR, assigned them daily clinical scores and assessed pathogen burdens at day 8 post-infection, when the dying population reached maximum morbidity. We found equivalent levels of CR between the two different host populations in all target tissues of the pathogen (Figure 1F). By our definitions, the differences in infection outcome are due to disease tolerance or anti-virulence mechanisms (co-operative defenses).
Figure 1. LD50 analysis reveals physiologies associated with co-operative defenses.
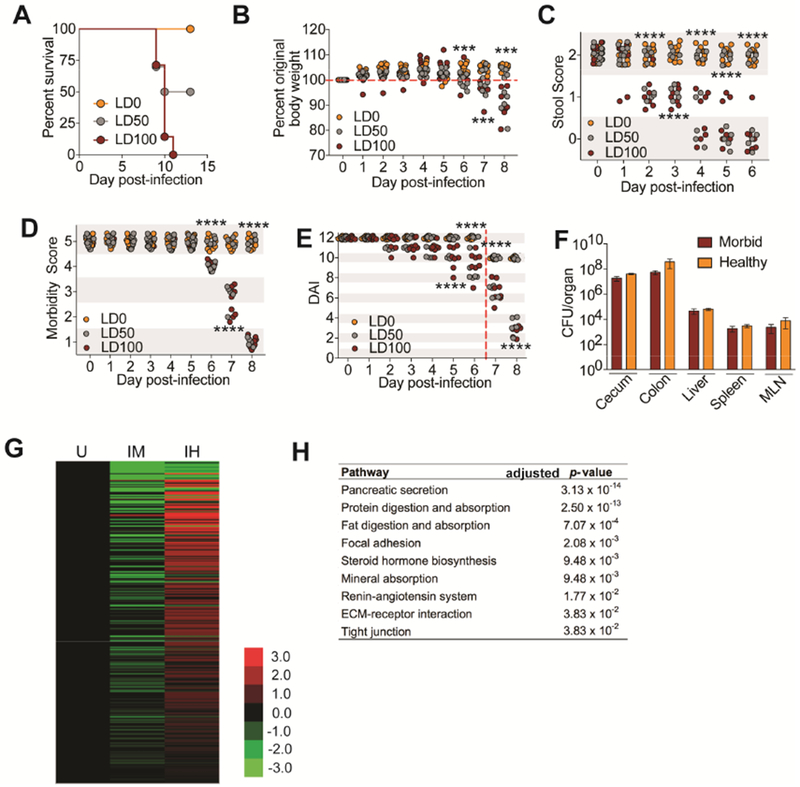
(A-E) C3H/HeJ mice orally infected with an LD0 (n=10), LD50 (n=10) or LD100 (n=8) dose of CR. (A) Survival (B) Weight loss (C) Stool scores (D) Morbidity scores (E) Daily disease activity index scores. Beginning at day 7 post-infection, stool score was no longer used to generate a DAI because sick animals stopped pooping. Red dashed line indicates this. (F) CFU analysis of from healthy and morbid mice challenged with an LD50 dose of CR at day 8 post-infection. n=5 per condition. (G) Average log2fold FPKM expression of genes significantly up in livers from infected healthy (IH) compared to infected morbid (IM) (log2fold > 1, FDR < 0.01) normalized to uninfected (U) control, n=3 mice per condition. (H) Top KEGG pathways showing overrepresentation of genes up in IH compared to IM. Data from (A-F) ***p<.001, ****p<0.0001. In (B) asterisk indicate significance between LD50 animals with >100% original weight compared to LD50 animals <100% original weight. In (C) asterisks indicate significance between LD50 animals with 2 stool score compared to LD50 animals with <2 stool score. In (D) asterisk indicate LD50 mice with morbidity score of 5 compared to LD50 mice with score <5. In (E) asterisk indicate LD50 mice with DAI of 12 (or 10 beginning day 7) compared to LD50 mice <12 (or 10). Error bars +/− SEM.
We analyzed the liver transcriptome of the infected hosts that survived and those that were on the trajectory to lethality at day 8 post-infection to identify networks associated with survival or death during infection. Pathways induced in the living population (IH), versus dying (IM) and uninfected (U) populations were reflected in our analysis, demonstrating that a healthy infected host does not resemble an uninfected healthy host and that there is an induction of pathways induced in the healthy infected state (Figure 1G). We found enrichment of physiologies within the living infected populations including various metabolic and nutrient pathways instead of the expected immune and inflammatory pathways (Figure 1H). Taken together, our data demonstrate that the LD50 approach can be used to define host physiologies that are associated with a healthy host and co-operative defenses during pathogenic infections.
Dietary iron promotes co-operative defenses
From our LD50 analysis, we found an enrichment in genes upregulated in the healthy infected hosts important for iron metabolism compared to the infected dying and uninfected control mice (Figure 2A). Our results suggest that host iron metabolism may induce a co-operative defense mechanism. We orally infected C3H/HeJ mice with an LD100 dose of CR and fed them chow supplemented with 2% carbonyl iron, a common dietary iron or control chow . We found that administration of dietary iron conferred 100% protection from infection while infected mice fed control chow succumbed to the infection (Figure 2B). We next employed a pairwise feeding technique in which we eliminated differences in consumption of the different diets over the course of the infection (Figure S1A). Dietary iron still conferred 100% protection from CR induced lethality using pairwise feeding, demonstrating that the protection afforded by dietary iron was due to iron and not food consumption differences (Figure 2C). Iron-fed animals had increased liver levels of total, ferric and ferrous forms of iron (Figure 1SB-D). Dietary iron induced a similar liver gene expression program of iron metabolism genes of infected mice as revealed from our LD50 RNAseq analysis (Figure 2A,D). We performed a time course analysis and determined that administration of dietary iron six days post infection with an LD100 dose was able to confer 60% protection from lethality (Figure S1E).
Figure 2. Dietary iron promotes co-operative defenses against lethal doses of CR.
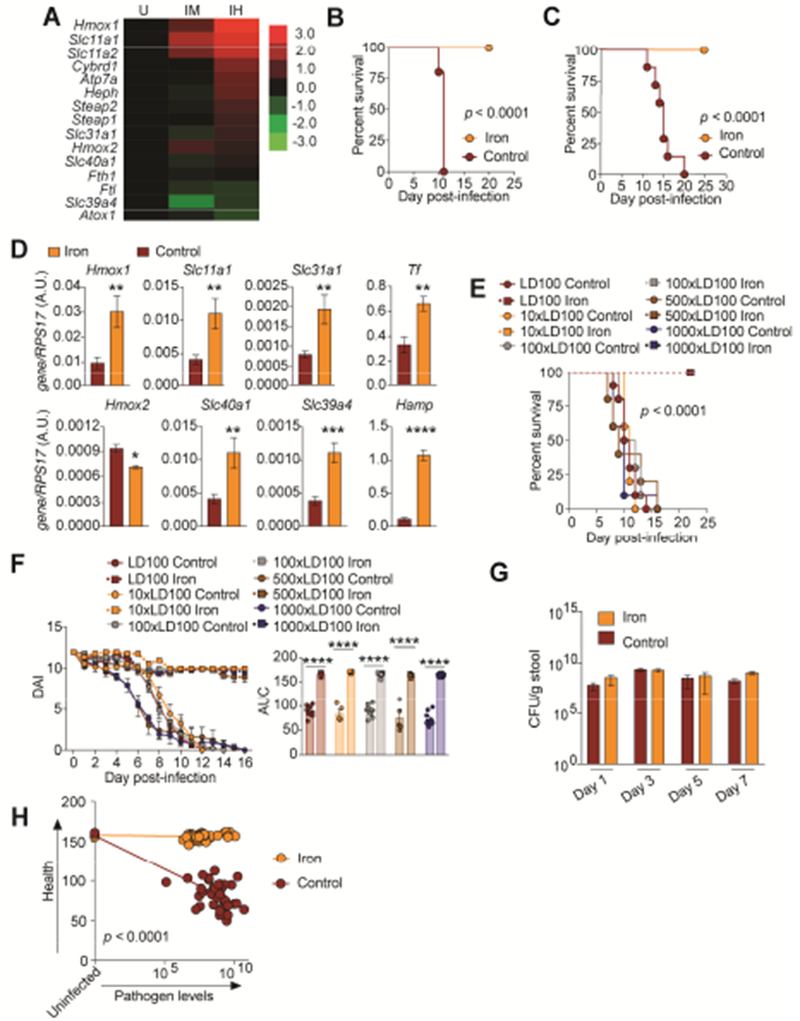
(A) Average log2fold FPKM expression of iron metabolism genes from livers of healthy infected (IH) and infected dying (IM) mice challenged with an LD50 dose of CR in Figure 1 normalized to uninfected (U) control. n=3 per condition. (B) Survival of C3H/HeJ mice orally infected with an LD100 dose of CR and given 2% carbonyl iron for 14 days n=5/condition. (C) Survival of C3H/HeJ mice orally infected with an LD100 dose of CR and given 2% carbonyl iron or control chow by pairwise feeding. n=10/condition. (D) qPCR analysis of iron regulated genes in the liver of CR infected mice fed 2% carbonyl iron or control diet n=9-10 mice/condition. (E) Survival of mice orally infected with 1×-1000× the LD100 dose of CR and given 2% carbonyl iron for 14 days or control diet. n=5-15 mice/condition. (F) Daily DAI of mice from (E) and area under the curve analysis for each individual mouse. (G) Levels of CR in feces of mice infected with an LD100 dose of CR. n=5 mice/condition. (H) The integral of DAI curves and fecal shedding curves were taken for each mouse in (E) and plotted against each other. *p<0.05, **p<0.01, ***p<0.0005, ****p<0.0001. Error bars +/− SEM. Related to Figure S1.
We next determined the relationship between host health and pathogen fitness when animals were administered dietary iron. This is determined by challenging the host with different doses of pathogen and generating a dose response curve to examine how host health is affected by the different doses of pathogen under dietary iron and control diet conditions (Raberg et al., 2007). We found that dietary iron provided 100% protection from death and associated co-morbidities when animals were challenged with 1-1000× the LD100 dose of CR (Figure 2E,F and Figure S1F-H). A time course analysis of the levels of CR in the cecum, colons and feces over the course of the infection showed that there were no significant differences in pathogen burdens under the different diet conditions (Figure 2G, S1I-J). An examination of the relationship between host health (DAIs) against pathogen levels (fecal shedding) of mice challenged with 1-1000× the LD100 dose of CR over the course of the infection revealed that dietary iron enabled mice to maintain their health across a range pathogen levels compared to animals fed control chow (Figure 2H). Thus, consistent with our LD50 analysis, dietary iron promotes host survival by maintaining host health via co-operative defenses.
Dietary iron prevents CR induced intestinal pathology
CR colonization of the intestinal mucosa causes colonic damage, inflammation, increased permeability and increased extra-intestinal dissemination of the pathogen (Collins et al., 2014; Mundy et al., 2005). Iron fed animals infected with CR were protected from cecal and colonic pathology and inflammation (Figure 3A,B and Figure S2A,B). Using a FITC-dextran assay, we found CR infected animals fed dietary iron were protected from leaky gut, while infected mice given control diet exhibited similar amount of leakage of the dye as control animals given dextran sodium sulfate (DSS) (Figure 3C). Furthermore, infected mice fed dietary iron exhibited reduced extra-intestinal dissemination of CR and this was associated with reduced proinflammatory cytokine expression at extra-intestinal sites (Figure 3D-F). Thus, co-operative defenses induced by dietary iron protect the host from infection by maintaining intestinal health and barrier integrity, preventing extra-intestinal dissemination of the pathogen.
Figure 3. Dietary iron protects from CR induced intestinal damage.
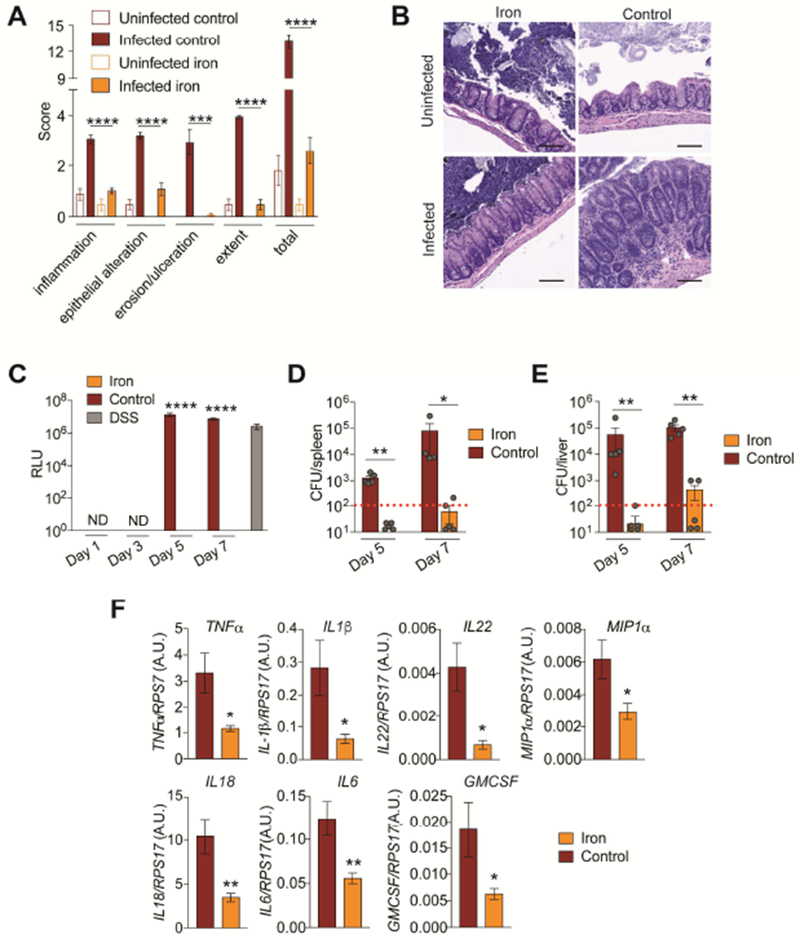
(A) Cecum pathology scores of mice infected with an LD100 dose of CR given 2% carbonyl iron or control chow at day 9 post-infection n=5 mice/condition. (B) representative images from mice in (A). Scale bar = 100 microns (C) Serum FITC-dextran levels of CR infected mice fed iron or control chow n=5 mice/condition/time point. DSS used as positive control. (D-E) CR CFUs in (D) liver and (E) spleen of iron and control chow fed mice at day 5 and 7 post-infection n=4-5 mice per condition. Red dotted line indicates limit of detection. (F) Cytokine transcript levels in livers of CR infected mice fed iron or control chow at day 7 post-infection n=5 mice per condition. *p<0.05, **p<0.01, ***p<0.005, ****p<0.0001. Error bars +/− SEM. Related to Figure S2.
Dietary iron suppresses CR virulence in vivo.
CR pathogenicity is dependent on transcriptional activation of the locus of enterocyte effacement (LEE) pathogenicity island that encodes a type three secretion system and its conserved set of core effectors (Collins et al., 2014; Mundy et al., 2005). Our analysis demonstrated that dietary iron maintains host health during infection without killing the pathogen in the primary tissues of infection, indicating that dietary iron induces a disease tolerance or an anti-virulence mechanism. To distinguish between these two possibilities, we measured the expression of CR LEE encoded virulence factors (Tir, Map and EspA) found in different operons within the pathogenicity island as well as a non LEE encoded virulence factor (EspI) over the course of the infection in animals fed dietary iron or control chow. We found that in mice fed dietary iron, CR expressed these virulence factors at significantly lower levels over the course of the infection compared to expression in mice given control chow (Figure 4A-D). Our data suggest that dietary iron promotes co-operative defenses by limiting the expression of the pathogen’s virulence program to levels that are sufficient to promote colonization without causing disease. In contrast to our in vivo data, we found that when CR was grown in iron rich media in vitro, there was a dose dependent induction of LEE- and non-LEE-encoded virulence factors (Figure 4E-H and S3A-D), suggesting that iron does not act directly on CR to inhibit virulence.
Figure 4. Iron suppresses virulence factor expression in vivo.
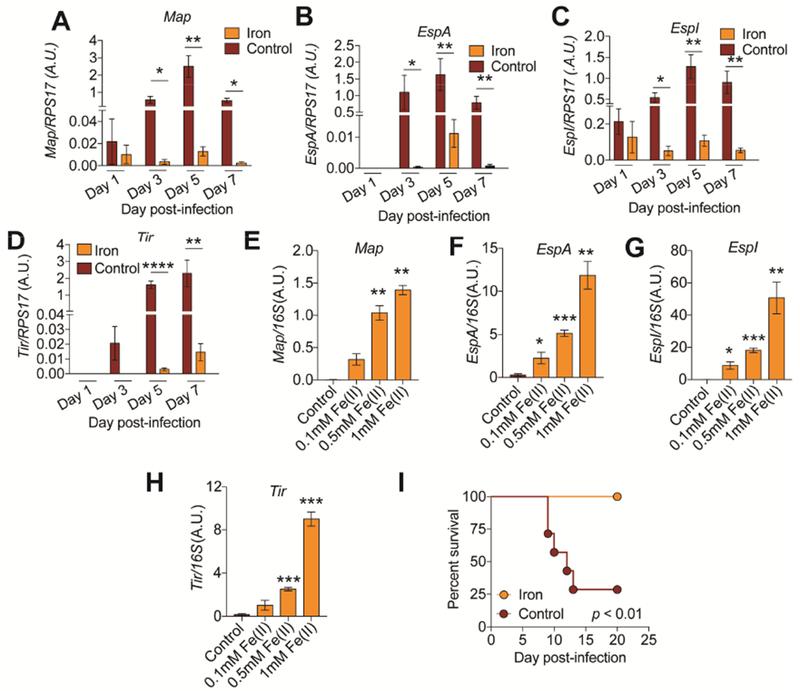
(A-D) Gene expression analysis of stated virulence factors in the intestines of mice fed 2% carbonyl iron or control chow at indicated time points. n=4-5 mice per condition per time point. (E-H) Gene expression analysis of stated virulence factors of CR grown in various concentrations of iron rich media at 6 hrs post culture inoculation. n=3 replicates per condition. (I) Survival of germ free mice infected with CR and given control or 2% carbonyl iron during infection. n=6-7 mice per condition. *p<0.05, **p<0.01., ***p<0.001, ****p<0.0001. Error bars +/− SEM. Related to Figure S3.
We next considered the possibility that the protective effects of dietary iron were dependent on the microbiota. CR virulence in germ free mice is dependent on the dose of pathogen administered to the mice and mouse strain (Buschor et al., 2017; Itoh et al., 1988). We orally infected germ-free mice with CR and fed mice 2% carbonyl chow or normal chow. Iron chow conferred protection from a lethal dose of CR in the absence of a microbiota, indicating that iron does not require the microbiota to mediate its protective effects (Figure 4I). Taken together, our data suggest that dietary iron suppresses virulent behavior of CR in vivo and these effects are not due to a direct action of iron on the pathogen and does not require the microbiota.
Dietary iron increases glucose availability in the intestine to suppress virulence
Regulation of virulence in pathogenic E. coli strains is dependent on the metabolic state of the pathogen (Njoroge et al., 2012). We found that the expression of LEE and non-LEE encoded virulence factors by CR was dependent on the sugar source available to the pathogen. Growth in d-glucose rich media, suppressed the expression of all LEE and non-LEE encoded virulence factors tested (Figure S4A-D). By contrast, growth in media supplemented with the disaccharide, lactose, caused an induction in expression (Figure S4E-H). Thus, increased glucose availability is sufficient to suppress expression of the pathogen’s virulence program.
Because of the bidirectional link between host iron metabolism and glucose homeostasis (Fargion et al., 2005), we hypothesized that dietary iron suppresses CR virulence by increasing glucose content in the intestine. Infected mice fed dietary iron had higher levels of luminal glucose in the cecum and colon, the site CR infection (Figure 5A). The concentrations of glucose found in the cecal and colonic luminal content of iron fed infected mice was sufficient to suppress virulence factor expression of CR (Figure 5B). We ruled out the possibility that this increase in luminal glucose levels was due to changes in food consumption, changes in the microbiota or changes in gut motility (Figure 2C, S1A, S4C, 4I, S4D). To determine differences in the rates of glucose absorption, we orally administered a glucose solution to fasted CR-infected animals that were fed iron or control chow as well as uninfected mice and measured the rate of increase of blood glucose levels. We found that uninfected and infected mice fed control diet absorbed approximately twice as much glucose into their bloodstream within the first five minutes post-glucose gavage as did animals fed the iron diet and this trend continued 15 minutes post glucose gavage (Figure 5C,D). As a secondary mode of validation, we employed 2-NBDG, a fluorescent glucose analog that is used to monitor glucose uptake from living cells and tissues. Oral gavage of 2-NBDG is used to assess glucose absorption from the intestine to extraintestinal sites in whole animals and co-administration with d-glucose, greatly diminishes uptake indicative of competitive uptake (Kanow et al., 2017) (Figure S4E). After oral gavage, infected mice fed dietary iron exhibited reduced absorption of 2-NBDG into the bloodstream within the first 15 minutes post-gavage compared to infected mice fed control chow and uninfected mice (Figure S4F,G). Consistent with a reduced rate of glucose absorption, we found that infected iron-fed mice had significantly more luminal glucose and 2-NBDG in their jejunums (the site of glucose absorption from the intestine) compared to uninfected control mice or CR infected mice fed control diet (Figure 5E and S4H). Thus, dietary iron increases glucose availability in the intestine during CR infection by limiting glucose absorption.
Figure 5. Iron increases glucose availability in the intestine.
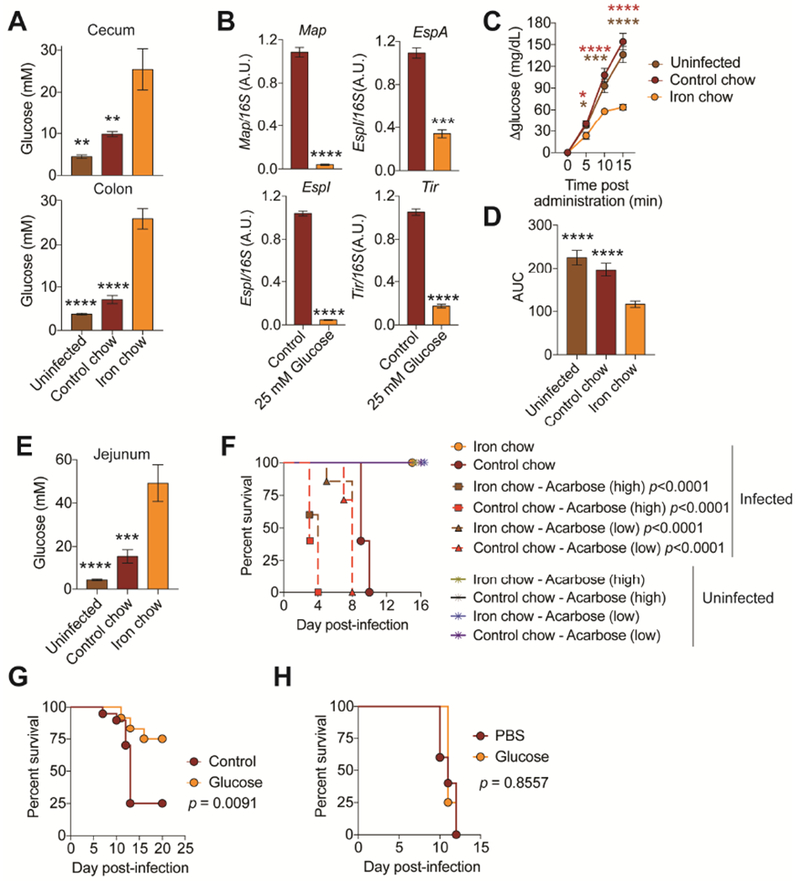
(A) Luminal levels of glucose in cecum and colon at day 3 post-infection of mice fed control (n=10) or iron chow (n=10). Uninfected (n=10). (B) Gene expression of virulence factors of CR grown in glucose rich media at 6 hrs post-culture inoculation. n=3 replicates per condition. (C) Blood glucose levels of infected mice fed control (n=20) or iron chow (n=20) after bolus glucose gavage at day 3 post-infection. Uninfected (n=20). (D) Area under the curve analysis of mice from (C). (E) Glucose levels in the jejunum of infected mice fed control (n=10) or iron (n=10) chow. Uninfected (n=10). (F) Survival of mice infected with an LD100 dose of CR and given control chow or iron chow and oral acarbose treatment n=5 mice per condition. (G) Mice were orally infected with an LD100 dose of CR and fed control chow with control water (n=20) or water supplemented with glucose (n=12). Survival shown. (H) Mice were orally infected with an LD100 dose of CR and fed control chow and injected with glucose (n=4) or PBS (n=5) over the course of the infection. Survival shown. *p<0.05, **p<0.01., ***p<0.001, ****p<0.0001. In (C) red * is iron chow compared to control chow and brown * is iron chow compared to uninfected. Error bars +/− SEM. Related to Figure S4.
To determine if increased intestinal glucose was necessary and sufficient to suppress CR virulence in vivo, we infected mice with an LD100 dose of CR and administered drinking water supplemented with acarbose, an inhibitor of alpha-amylase and alpha-glucosidase to prevent liberation of dietary glucose in the intestine. Acarbose increased CR virulence in both control fed and iron fed mice in a dose dependent manner indicating that intestinal glucose availability is necessary to suppress virulence of CR in vivo (Figure 5F). To assess sufficiency, we administered glucose to infected mice given control chow via their drinking water over the course of the infection. Infection was attenuated in animals given glucose-supplemented water compared to animals that received control drinking water but not when they received systemic glucose injections over the course of the infection (Figure 5G,H). By contrast, when mice were given lactose-supplemented water during infection, the infection was more virulent than in animals given control drinking water (Figure S4I). Thus, our data support a model in which dietary iron suppresses CR virulence by increasing luminal concentrations of glucose resulting from reduced intestinal glucose absorption.
Insulin resistance is necessary and sufficient for reduced glucose absorption and suppression of CR virulence.
Dietary iron induces systemic IR that is associated with iron overload in white adipose tissue (WAT) deposits, reduced overall mass of WAT deposits and WAT IR (Choi et al., 2013; Dongiovanni et al., 2013; Simcox and McClain, 2013). We found that animals fed 2% carbonyl iron during CR infection had WAT iron overload, reduced body fat mass and were IR (Figure 6A-D and S5A,B). Similarly, the healthy population of mice from our LD50 analysis were IR compared to the morbid population (Figure S5C,D). Consistent with previous studies (Dongiovanni et al., 2013), we found the systemic IR was associated with reduced insulin signaling in WAT deposits (Figure 6E and S5E). We found comparable levels of circulating insulin in iron and control-chow fed animals indicating that the IR was due to differences in responsiveness rather than insulin deficiency (Figure 6F).
Figure 6. Iron induced insulin resistance is necessary and sufficient for protection from CR.
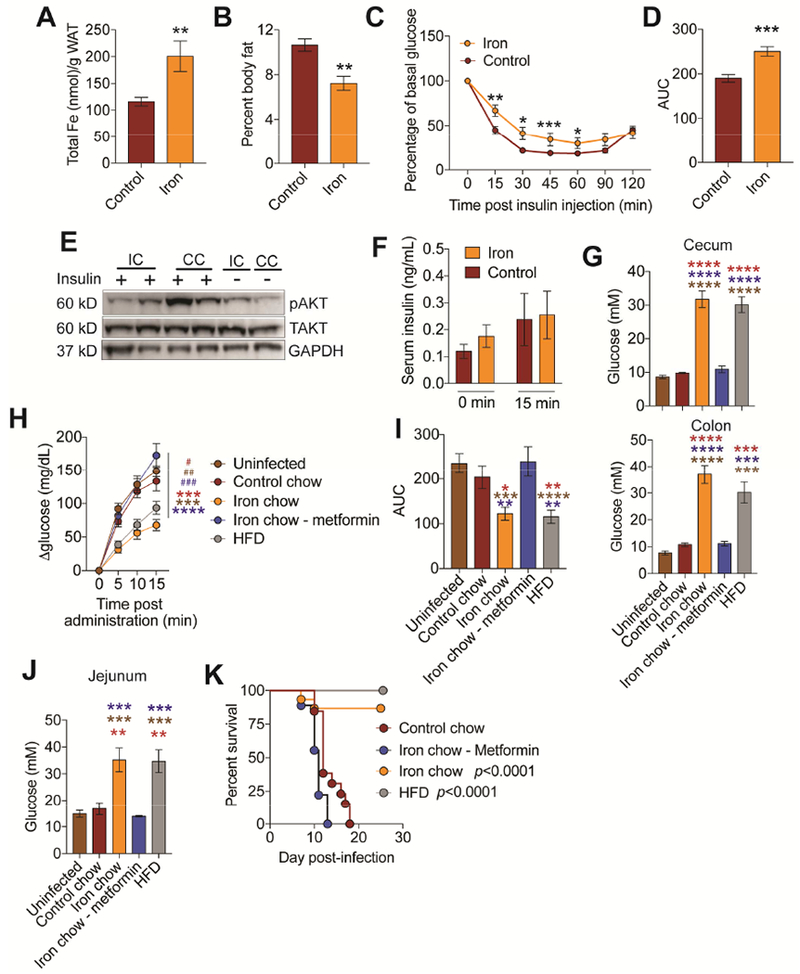
(A-F) C3H/HeJ mice were orally infected with an LD100 dose of CR and fed control or iron chow and (A) WAT iron content (n=12 mice/condition) (B) percent body fat (n=5 mice/condition) (C-D) insulin tolerance test (n=10 mice/condition) (E) insulin signaling in WAT and (F) circulating insulin levels (n=10 mice/condition) at day 3 post-infection. (G) Luminal glucose concentration of cecum and colon from mice orally infected with LD100 dose of CR and given stated diet treatment. (n=3-5 mice per condition). (H) Infected mice fed control (n=20), iron chow (n=18), iron chow plus metformin (n=21), high fat diet (HFD, n=22) were gavaged with glucose at day 3 post-infection and the change in blood glucose levels were measured. Uninfected (n=28) (I) Area under the curve analysis of mice from (H). (J) Glucose levels in the jejunum luminal content of infected and uninfected mice given stated treatment (n=3-5 mice/condition). (K) Survival of infected mice given control chow (n=13), iron chow (n=15), iron chow plus metformin (n=9) or raised on HFD and given normal chow during infection (n=15). p values in K represent iron chow compared to control chow and iron chow/metformin and HFD compared to control chow and iron chow/metformin*p<0.05, **p<0.01, ***p=0.0005, ****p<0.0001. In (G, I, J) red * indicate comparison between to control chow. brown * indicates comparison to uninfected and blue * indicates comparison to iron chow-metformin. In (H) * indicates comparison between iron and other conditions. # indicates comparison between HFD and other conditions. Related to Figure S5 and S6.
To determine if dietary iron-induced IR was necessary for the reduced intestinal glucose absorption, we used metformin to induce insulin sensitivity in infected animals given an iron diet. To test for sufficiency, we used high fat diet (HFD) to induce IR in the absence of dietary iron. We used DBA/2J mice because HFD is ineffective in C3H/HeJ mice (Figure S5F-I). HFD has been previously suggested to cause leaky gut in C57BI/6 mice and render mice more susceptible to CR extraintestinal dissemination (Thaiss et al., 2018) but does not in DBA/2J mice (Figure S6A-D). We confirmed that CR establishes a lethal infection and that dietary iron protects from a lethal CR challenge, induces IR, reduces intestinal glucose absorption and increases glucose availability in the lumen of the intestine during infection in DBA2/J mice (Figure 6G-J and S6E-J). Metformin treatment prevented the development of IR in CR-infected mice given 2% carbonyl iron during infection (Figure S6F,G), while HFD caused IR in mice (Figure S6K,L). Infected mice raised on HFD had higher levels of cecal and colonic luminal glucose, similar to what we found in infected mice given iron chow, compared to infected mice given iron chow plus metformin, infected mice given control chow and uninfected mice (Figure 6G) and this could not be explained by increased food consumption or differences in gut motility (Figure S6M,N). Upon oral gavage with a bolus of glucose or 2-NBDG, infected mice given iron diet plus metformin exhibited a similar rate of absorption into the circulation as uninfected or infected mice given control chow (Figure 6H,I and S6H,I). By contrast, infected mice raised on HFD, exhibited a slower rate of absorption similar to infected mice given iron chow (Figure 6H,I and S6H,I). Glucose levels and 2-NBDG levels were significantly higher in the luminal content of the jejunum (Figure 6J and S6J). Thus, IR was necessary and sufficient to reduce intestinal glucose absorption during CR infection.
We next used our metformin and HFD diet models to determine if IR was necessary and sufficient to suppress CR virulence. We found that metformin treatment rendered iron-fed mice more susceptible to an oral CR infection, with mice exhibiting similar death kinetics as infected mice given control chow (Figure 6J and S6J). By contrast animals raised on HFD were completely protected from an LD100 dose of CR (Figure 6J). Taken together, our data demonstrate that dietary iron-induced IR suppresses CR virulence by increasing availability of glucose in the intestine.
Dietary iron drives an enteric pathogen towards long term commensalism
We propose that co-operative defenses can yield attenuated host-pathogen relationships so long as the pathology being alleviated does not inhibit pathogen transmission (Ayres, 2016). It would then follow that: 1) the induction of co-operative defenses can lead to an apparent commensalism in the primary host in which health is maintained despite the continued presence of the pathogen and 2) there can be selection for pathogen strains within the primary host that are attenuated in secondary hosts upon transmission. To test this idea, we infected mice with 1-1000× the LD100 dose of CR and fed the mice control chow or 2% carbonyl iron chow for the first 14-days post-infection, after which the iron chow was withdrawn and animals were returned to normal chow, and survival was monitored. While the infected mice given normal chow succumbed to the infection, the animals given a 14-day course of dietary iron remained alive more than eight months post-infection (animals were still alive at the time of writing) (Figure 7A). We monitored fecal shedding of CR in these animals over the course of the infection and found that they shed CR (~106 CFU/gram stool) indicating that these mice were persistently infected with the pathogen (Figure 7B).
Figure 7. Dietary iron drives long term attenuation of an enteric pathogen.
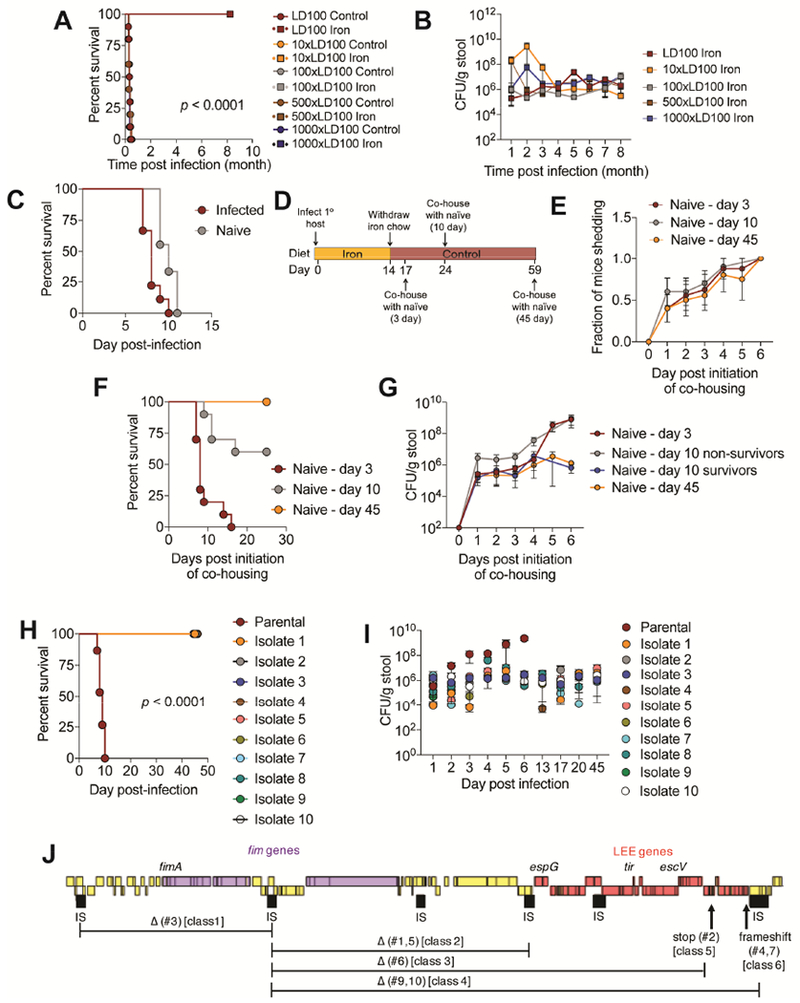
(A) Survival and (B) CR fecal shedding of mice from Figure 2E. p values were <0.0001 for each dose that received iron diet compared to the same dose that received control chow. (C) C3H/HeJ mice were orally infected with 7.5×10⁸ CFU dose of CR. Single infected mice were housed with one naïve mouse. Mice were given control chow. Survival shown. n=10/condition. (D) Schematic of experimental set up for mice in (E-G), n=10/condition. (E) Fraction of naïve mice shedding CR. (F) Survival of naïve mice that were co-housed with CR infected mice fed iron diet 3, 10 or 45 days after iron food withdrawal from infected mice as shown in (D). (G) amount of CR being shed in the feces by mice in (F). (H-I) C3H/HeJ were orally infected with 7.5×10⁸ CFU dose of parental CR or 7.5×10⁸ CFU dose of CR isolates from mice that were infected with the parental strain and fed a 14-day course of dietary iron and given control chow, n=5-10/condition. (H) Survival. p<0.0001 comparing parental to each isolate. (I) Fecal shedding of CR. (J) Mutations in the attenuated isolates from (H-I). Related to Figure S7.
We tested the hypothesis that promoting co-operative defenses with a 14-day course of dietary iron drives the selection for attenuated strains of CR. Co-housing of CR-infected mice with naïve mice results in transmission and death due to coprophagy behavior (Figure 7C). Mice were infected with an LD100 dose of the parental strain of CR and fed 2% carbonyl iron for the first 14-days post-infection, after which they were returned to normal chow. We then co-housed these mice with naïve mice at different days post-iron food withdrawal and continued to feed them control chow (Figure 7D). Using fecal shedding of naïve mice as a readout, we found no significant differences in the rate of transmission of CR to the naïve mice co-housed with the iron-fed, infected mice at different time points post iron food withdrawal (Figure 7E). Despite this, we found significant differences in the survival of the naïve mice depending on when they were co-housed with the previously iron-fed, infected mice. 100% of naïve animals co-housed with iron-fed infected mice 3-days post iron food withdrawal died. This was reduced to 40% when naïve animals were co-housed with iron-fed infected mice 10-days post food withdrawal. However, when naïve mice were co-housed with iron-fed infected mice 45-days post iron food withdrawal, no naïve mice died (Figure 7F). We measured the amount of CR shed from the naïve mice each day after initiation of co-housing with the iron-fed, infected mice and found that there were comparable levels of pathogen in all naïve mouse groups 1 day after co-housing initiation through day 4, suggesting that the amount of pathogen being transmitted and infecting the naïve mice was similar (Figure 7G). However, beginning day 5 post co-housing initiation, naïve mice housed with the infected mice 3 days after iron food withdrawal began shedding more CR and reached levels of 109 CFU/gram stool of the pathogen by day 6. Similar trends were observed with the non-survivors that were co-housed with the iron-fed, infected mice 10-days after iron food withdrawal exhibited similar levels of pathogen shedding (Figure 7G). By contrast, the surviving naïve mice housed with the iron-fed, infected mice 10-days post iron food withdrawal and the naïve mice housed with the infected mice 45 days post iron food withdrawal shed a steady amount of pathogen, at ~106 CFU/gram of stool (Figure 7G), similar to what we found in the primary hosts that were fed a 14-day course of iron and became asymptomatically, persistently colonized with CR (Figure 7B).
Our data suggests that a short course of dietary iron drives the selection for attenuated strains of CR that persistently colonize the host and that attenuation is due to a newly established colonization threshold of the pathogen. To formally test this, we isolated CR strains from C3H/HeJ mice that were orally infected with an LD100 dose of parental CR and fed 2% carbonyl iron for 14 days post-infection, approximately one month to one year after infection. Attenuated isolates did not display general replication defects in vitro in LB media (Figure S7A). We orally infected naïve mice with 7.5×10⁸ CFU of the parental CR or 7.5×10⁸ CFU of one of ten isolates and fed mice control chow. Mice infected with the parental strain succumbed to the infection. By contrast, mice infected with the CR isolates remained alive 40 days post infection (after which we terminated the experiment) (Figure 7H). Consistent with our long-term infection studies (Figure 7A, B) and our co-housing studies (Figure 7E-G), we found that while the parental strain reached approximately 109 CFU/gram stool as the infection progressed, the fecal shedding levels of mice infected with the CR isolates remained steady at approximately 106 CFU/gram stool during the infection (Figure 7I).
We performed whole genome sequencing of the 10 attenuated strains. Genomic alignment and single nucleotide polymorphism (SNP) analysis revealed 7 distinct classes of mutants (Figure 7J and Table S1, S2). Six isolates (#1,3,5,6,9 and 10) displayed >30kbp chromosomal deletions in the LEE pathogenicity island and/or adjacent regions encoding fimbriae genes (Figure 7J). All isolates possessed 1 to 6 SNPs in comparison to the parental DBS100 strain, though most SNPs resulted in synonymous mutations (Table S1, S2). Three isolates (#2,4 and 7) possessed premature-stop and frameshift mutations in LEE genes. One isolate (#8) did not have genomic rearrangements or SNPs in known virulence factors, but instead had an inframe deletion in pyruvate dehydrogenase complex dihydrolipoyllysine acetyltransferase, a missense mutations in ROD_RS08060, a gene of unknown function, and AlaE, an alanine transporter. Taken together, our data support a model in which a short course of dietary iron drives selection for attenuated strains of CR in the primary host that can persistently and asymptomatically infect naïve mice that establish a new colonization threshold.
Discussion
How host physiological responses to pathogens lead to asymptomatic infections and the evolution of attenuation is unknown. We took advantage of a well-known LD50 phenomenon to define physiological circuitry that is associated with healthy and dying fates of infected hosts. By comparing to naïve mice, we observed that there is induction of physiologies in the healthy infected host population and demonstrated that these induced pathways can be used to define mechanisms of co-operative defenses. While we focused our studies on iron, we found other physiological responses that were induced in the healthy infected population that likely contribute to co-operative defenses during CR infection. This is supported by the fact that the healthy LD50 mice had pathogen infecting systemic tissues. By contrast if iron was administered early during infection, it suppressed virulence of CR, preventing it from spreading to systemic sites. Administration of dietary iron at later time points after CR disseminates was no longer sufficient to promote 100% survival of the host. We anticipate that our LD50 approach can be applied to many other infectious disease models to understand host variation in susceptibility to disease and can provide a new perspective for treating disease.
In response to infections, the host employs mechanisms that reduce the amount of circulating iron and sequesters iron within host tissues and this has traditionally been believed to serve as an antagonistic defense mechanism (Cassat and Skaar, 2013). We found from our LD50 analysis that there was enrichment of iron metabolism pathways in the liver of the healthy infected population and that administration of dietary iron to animals infected with 1-1000× the LD100 dose of CR conferred 100% protection from infection. This protection was associated with no change in pathogen burdens in the primary tissue of infection and induced an anti-virulence mechanism in the host. Our data suggest that in addition to providing antagonistic functions, the purpose of host tissue iron sequestration is also to promote co-operative host defenses for certain infections.
The effects of oral iron supplementation on infection outcome are complex and likely context dependent. In experimental studies, iron enriched diets conferred protection against certain infections including Helicobacter pylori and Mycobacterium bovis (Agoro et al., 2017; Beckett et al., 2016) but exacerbated infections with Salmonella (Nairz et al., 2017). It is important to note that the strain of mouse used for most of these studies has been C57BI/6 mice, which has a nonfunctional allele of Nramp1, a divalent metal (iron and manganese) transporter that renders them more susceptible to infections (Canonne-Hergaux et al., 1999; Fritsche et al., 2012; Loomis et al., 2014; Powell and Frelinger, 2017; Soe-Lin et al., 2009). In humans, clinical data support our findings that dietary iron supplementation provides beneficial outcomes, especially in developing countries where low iron status may be prevalent (Loukas et al., 2016; Mwangi et al., 2017; Oppenheimer, 1989, 1998, 2001). However in malaria endemic areas, iron supplementation was associated with a negative outcome for patients (Clark et al., 2014). A better understanding is needed of the contexts in which micronutrients are essential for promoting host defense against interactions and when they will worsen infection outcome.
In agreement with experimental and clinical data (Choi et al., 2013; Fargion et al., 2005; Fernandez-Real et al., 2002; Simcox and McClain, 2013), we found that dietary iron caused IR in our infection models and this was necessary for iron mediated protection from infection. A recent study has suggested that liver iron sequestration regulates blood glucose levels by inducing ferritin to maintain liver gluconeogenesis during sepsis (Weis et al., 2017). Our study provides an alternative explanation: tissue iron sequestration regulates glycemia by inducing acute IR during infection. This is supported by a study showing that heme-oxygenase-1 (HO-1) induces IR in the context of metabolic disease (Jais et al., 2014). Indeed, from our expression analysis, we found that dietary iron and the healthy LD50 population had elevated levels of Hmoxl expression. Interestingly, HO-1 has been shown to promote co-operative defenses against Plasmodium and in sepsis models (Ferreira et al., 2011; Jeney et al., 2014; Seixas et al., 2009). The protective effects were attributed to the detoxification function of the enzyme, but our study provides an alternative explanation and suggests that the mechanism by which HO-1 promotes co-operative defenses may be by inducing IR.
Acute IR is a common response triggered during infectious diseases (Yki-Jarvinen et al., 1989), suggesting acute IR is an evolved strategy to promote host defense during infections by increasing availability of glucose to non-insulin dependent tissues. With our study, we suggest that one function of acute IR during disease is to increase the availability of glucose to resident microbes of the host to tame their virulence. This is supported by recent studies showing that feeding during infection dampens pathogen virulence during Salmonella intestinal infection and that the host fucosylation response during LPS-induced anorexia prevents the virulent behavior of the resident microbiota during sickness (Pickard et al., 2014; Rao et al., 2017).
We found that IR was necessary and sufficient to alter intestinal glucose absorption. How systemic glucose levels and insulin responsiveness feed back to the intestine to influence glucose absorption is not well understood. Intestinal glucose is taken up from the lumen into small intestinal epithelial cells via sodium-glucose linked transporter 1 (SGTL1) (Roder et al., 2014). Studies with metformin have shown that in addition to IR, metformin increases expression of SGLT1 and intestinal uptake of glucose (Bauer et al., 2018; Lenzen et al., 1996). This is supported by our studies with metformin, in which we found that treatment with metformin of iron-fed mice during infection increased intestinal absorption of glucose. Furthermore, consistent with our studies demonstrating that HFD reduced glucose absorption from the intestine, HFD has been reported to reduce SGLT1 expression (Bauer et al., 2018). It will be important to determine if dietary iron induced IR causes changes in intestinal glucose absorption by altering SGLT1 expression and/or function.
We found that a short course of dietary iron drove the selection in the primary host for attenuated strains of CR. We found that these attenuated strains asymptomatically and persistently colonized the primary host and could be transmitted and asymptomatically persistently colonize new naïve hosts that never received the iron diet. The attenuation was due to mutations in genes witin the LEE pathogenicity island and adjacent genes and a new colonization threshold that could be achieved by the pathogen. While this colonization threshold was lower than the infection levels that could be achieved by the parental strain, this may reflect trade-offs between pathogen virulence and colonization threshold within the host. By not achieving high levels of growth within the host, the host becomes a healthy reservoir for the pathogen facilitating increased transmission to new hosts, that become asymptomatic, persistent shedders and ultimately may result in pathogen strains with greater fitness than the parental strain. Trade-offs between virulence and transmission have been reported previously (Mackinnon et al., 2008; Paul et al., 2004; Rao et al., 2017). It will be important to perform population studies in the future to determine whether the attenuated strains are more fit, define the mechanism of attenuation and determine if these strains can revert back to their original phenotype and become virulent to the host again.
STAR★Methods
Contact for Reagent and Resource Sharing
Further information or requests for reagents may be directed to Lead Contact Janelle S. Ayres (jayres@salk.edu).
Experimental Model and Subject Details
Mice
Male and female mice were used for experiments. C3H/HeJ mice were purchased from Jackson Laboratories. C3H/HeJ mice are not susceptible to obesity and insulin resistance induced by high fat diet. Instead DBA/2J mice were used for metformin and HFD experiments. DBA/2J mice were obtained from Jackson Laboratories. For germ free studies, Swiss Webster mice were bred and maintained in our germ free barrier facility in sterile semi-flexible isolators and screened for bacterial, fungal, and viral contamination (Schieber et al., 2015). Germ free and specific pathogen free mice were maintained under a 12 hr light/dark cycle and given chow diet as described in diets section. Mice were used for experimentation at 6-8 weeks of age. All animal experiments were done in accordance with The Salk Institute Animal Care and Use Committee and performed in our AALAC-certified vivarium.
Bacteria
Citrobacter rodentium DBS100 was purchased from ATCC. C. rodentium isolates from iron fed mice infected with the parental strain were obtained by isolating fresh fecal pellets from mice at ~35 days postinfection (~3 weeks post withdrawal of iron diet) to one year post infection and homogenized in sterile PBS. Homogenates were diluted and plated on sterile Macconkey agar plates and incubated overnight at 37°C. The next day, fresh LB media was inoculated with individual colonies. Cultures were grown at 37°C, shaking overnight. Glycerol stocks were then made from the cultures. Colonies were confirmed to be C. rodentium by 16S rRNA PCR and sequencing of the product from the 5’ and 3’ ends as well as whole genome sequencing.
Methods Details
Bacteria cultures for mouse infections
Sterile LB cultures were inoculated with individual colonies of C. rodentium grown overnight on fresh Macconkey agar plates at 37°C and shaken overnight at 37°C. The following morning, an OD600 was taken. The appropriate amount of culture volume was pelleted by centrifugation and resuspended in the appropriate volume of sterile PBS and used immediately for infection. A portion of the inoculum was serially diluted and plated to confirm the inoculation amount for each experiment.
Mouse infection models
C3H/HeJ mice were infected with LD0 = 1×10⁵ CFU, LD50 = 1×10⁶ CFU, LD100 = 1×10⁸, or 7.8×10⁸ CFU or 10-1000× LD100 with a total gavage volume of 100ul. LD100 for DBA/2J mice was 7.5×10¹⁰ CFU, 100 ul total volume gavage. Germ free Swiss Webster dose was 7.5×10⁸ CFU. For every infection, a portion of the inoculum was serially diluted in sterile PBS and plated on sterile Macconkey agar to quantify the infection dose. For infection with C. rodentium isolates, mice were infected with 7.5×10⁸ CFU of parental C. rodentium or one of ten isolates. For co-housing experiments with the parental strain. C3H/HeJ mice were orally infected with 7.5×10⁸ CFU of parental C. rodentium. One infected mouse was placed in a cage with one naïve mouse. Mice were fed control chow. For co-housing with iron fed mice, C3H/HeJ mice were orally infected with 7.5×10⁸ CFU of parental C. rodentium and given 2% carbonyl iron for 14 days. After 14 days, the iron chow was removed and animals were placed on control chow for the rest of the experiment. At 3, 10 and 45 days post withdrawal of iron chow, an individual iron chow-fed/infected mouse was placed in a new cage with a naïve mouse that has only been fed control chow. Mice were given control chow and survival and fecal shedding were monitored.
Stool Score
Fresh fecal pellets were collected from mice and scored as follows:
Normal = 2
Loose = 1
Diarrhea = 0
Weight score
Animals were weighed daily and percent weight loss was determined and scored as follows:
None = 5
1-5% = 4
5-10% = 3
10-15% = 2
>15% = 1
Grading system for monitoring morbidity
Grading system for monitoring clinical symptoms in mice:
5. Normal. Normal exploratory behavior, rearing on bind limbs, and grooming.
4. Mild. Reduced exploratory behavior, rearing on bind limbs, and grooming. Slower and/or less stead gait, but free ambulation throughout the cage.
3. Moderate. Limited voluntary movement. Slow, unsteady gait for <5 seconds.
2. Severe. No voluntary movement, but mouse can generate slow, unsteady, gait for >5 seconds.
1. Moribund. Mouse does not move away from stimulation by research, but can still right itself.
Disease Activity Index (DAI)
Daily scores of weight loss, stool and morbidity were added together for each animal to generate a DAI. For calculation of area under the curve, we plotted the DAI score for an individual mouse against time postinfection and determined the area under the curve. We then took the average of the AUC for mice of each condition.
Percent body fat measurements
Total body fat was measured using an EchoMRI machine. Total fat was normalized to total body weight to determine the percent body fat.
Mouse Diets
For the effects of dietary iron on infection, animals were fed 2% carbonyl iron supplemented diet or control diet (Envigo) given immediately after infection. For time course analysis, mice were given control chow immediately after infection and on day 3, 6 or 8 post infection were switched to iron chow. Iron diet was withdrawn after 14 days and animals were given control diet for the remainder of the experiment. For high fat diet, we used DBA/2J mice because C3H/HeJ mice are resistance to HFD (Figure S5). We received DBA/2J mice at 3 weeks of age and placed on HFD (Research Diets 60 kcal% fat). After 4 weeks we performed ITTs to confirm that the animals were insulin resistant. For infections, mice were put on control chow for the entire duration of the experiment. For metformin assays, mice were given drinking water supplemented with 5g/L metformin on the day of infection and was replaced every other day. Mice also received a daily i.p. injection of metformin 100 mg/kg body weight. For survival assays with sugar supplemented drinking water, animals were infected with an LD100 dose of pathogen and immediately given drinking water with 50% lactose or 100% glucose that was replaced every other day.
Acarbose survival
Mice were infected with an LD100 dose of C. rodentium or left uninfected and given control or iron chow. Mice were orally given acarbose (1mg/kg or 0.05mg/kg) daily and survival was monitored.
Pairwise feeding
We measured the daily food intake of single housed mice infected with an oral LD100 dose of C. rodentium and given iron or control chow for multiple experiments and averaged the amount of food consumed each day per mouse per diet group. For pairwise feeding, we infected single housed mice with an LD100 dose of pathogen and each day mice were administered an equivalent amount of control or iron chow based on the historical data.
Quantification of Citrobacter in mouse tissues and feces
Tissues and feces were harvested at the indicated time points from infected mice and were homogenized in 1mL PBS containing 1% Triton X-100 using a BeadMill 24 bench top bead-based homogenizer (Fisher Scientific). Organ homogenates were serially diluted and plated on Mackonkey agar to quantify bacterial burden. Mouse feces samples were collected into 2ml collection tubes and 1ml of PBS was added to each tube. The plunger side of a syringe was used to homogenize the fecal pellet into the PBS, and mixtures were allowed to settle for 5 minutes. Supernatants were serially diluted and plated on Mackonkey agar to quantify Citrobacter colony forming units in the feces.
Generation of dose response curve
C3H/HeJ mice were orally infected with 1-1000× the LD100 dose of C. rodentium. Everyday postinfection, the DAI was determined for each mouse and fecal pellets were collected for C. rodentium quantification. We determined from our CFU analysis that the amount of pathogen being shed was representative of the amount of pathogen infecting the cecum and colons. The DAI was plotted against time postinfection for each mouse and the area under the curve was determined. The amount of pathogen shed in the feces each day was plotted against day postinfection and the area under the curve was determined. These values were then plotted against each other and non-linear regression analysis was done and slopes were compared.
Histology
Cecums and colons were harvested from mice, inflated with 10% formalin, cassetted (colon was swiss rolled prior to cassetting) and fixed in 10% formalin for 24 hrs before transfer to 70% ethanol. Tissues were embedded in paraffin, sectioned and stained with hematoxylin and eosin. Colon and cecum were scored for inflammation (0: absent, 1: minimal in mucosa; 2: mild affecting mucosa and sub-mucosa; 3: moderate affecting mucosa, sub-mucosa and sometimes transmural; 4: severe: often transmural), epithelial hyperplasia (0: none; 1: mild; 2: mild with minimum goblet cell loss; 3: moderate with mild goblet cell loss; 4) marked with moderate to marked goblet cell loss), erosion and ulceration (0: none; 1: rare erosions; 2: some erosions; 3: multiple erosions and ulcerations with cryptitis and crypt abscesses; 4: ulcers associated with necrosis and fibrosis) and extent of lesion (0: less 10%; 1: 10-25%, 2: 25-50%, 3: 50-75%, 4: over 75%). The maximum total histological score was 16.
FITC dextran gut permeability assay
Mice were orally gavaged with FITC-dextran 4000 (Sigma), a nonmetabolizable macromolecule that is used as a permeability probe. All mice were gavaged with (40mg/100g mouse weight) and sacrificed 4 hrs later for serum harvest. FITC-dextran was quantified using a fluorometer and measured at 485 nm. As a positive control, mice that were given 3% dextran sulfate sodium in their drinking water for 7 days were used.
Iron Assay
100mgs of snap frozen and ground liver were homogenized in 500 ul Iron Assay Buffer mixed with protease inhibitor coacktail (Sigma). Samples were centrifuged at 16,000 × g for 10 minutes, and 100 ul of supernatant was used for iron assay in duplicate. Serum was used directly after centrifugal isolation. WAT samples were taken from protein lysates, and used undiluted. All samples were treated with 1M SDS to reduce turbidity due to lipoproteins. Liver was diluted twofold to fit standard curve values. Colorimetric assay was performed as per manufacturers protocol.
ITT
Infected animals were fasted 16 hours, in a fresh cage. Using a razor blade, tail tips were cut to capture drops of blood throughout the test. Mice were weighed for normalization and for input into the Echo MRI for lean mass normalization, and tails were marked for stress-free identification. We performed ITTs two ways: by administering the amount of insulin based on total body weight and on lean body mass and found no differences in phenotypes. Mice were injected with 1 unit/kg of mouse body weight or lean muscle mass intraperitoneally. Injections were spaced out by 30 seconds. Measurements of blood glucose were measured at the 15, 30, 45, 60, 90, and 120 minute marks by squeezing the tail from base to tip and the second and third drops of blood were measured and averaged. Blood glucose response to insulin was plotted in Prism and the area under the curve was generated and plotted.
Insulin measurements
For Insulin ELISA analysis, tips of fasted mouse tails were cut and blood was squeezed out into microvette capillary blood collection tubes and centrifuged for 5 minutes at 10000×g. Fasting circulating Insulin pre and post IP or oral glucose bolus was evaluated using the Millipore rat/mouse Insulin ELISA kit, as per manufactures’ protocol, and diluted only as needed for samples low on volume.
Insulin signaling western blot analysis
Animals used for insulin signaling analysis were Citrobacter rodentium infected C3H/HeJ mice, fed either 2% carbonyl iron supplemented diet or control diet. At day 3 post-infection animals were fasted for 4 hrs and lean body mass was measured using the EchoMRI. Animals were injected intraperitoneally with insulin at 1 unit/kg of lean mass. Ten minutes post staggered insulin injections mice were euthanized with a steady flow of carbon dioxide and IWAT deposits were harvested and snap frozen. Ground frozen tissue was bead-beaten in Tissue Extraction Reagent II supplemented with Halt™ Protease and Phosphatase Inhibitor Cocktail. Lysates were centrifuged at 4 degrees C for 10 min at 10,000rpm and transferred to a new tube multiple times, until clear lysate without the pellet or fat cake layers was left. Samples were quantified with a BCA reaction and subjected to western analysis of phospho-AKT (Cell Signaling), AKT (Cell Signaling), GAPDH (Cell Signaling). Samples were loaded equally in 3-8% TA gels and probed for either phosphorylated or total of each protein, and normalized to each blot’s loading control. Loading control normalized phosphorylated proteins were then normalized to loading control normalized total proteins. non-insulin injected diet-matched control sample tissue were also analyzed. Nitrocellulose blots were developed using a mixture of Femto and Dura chemiluminescent reaction and visualized with a BioRad Gel Doc XR+ machine. Pictures were taken on this machine and band volume analysis was performed, adjusting for local background using the imaging software Image Lab 5.2.1. Adjusted volume was subjected to normalization describe above.
Gene expression analysis
RNA was extracted from frozen, ground, and bead-beaten tissues using the PARIS™ Kit Protein & RNA isolation system. Briefly, sample was lysed in 600 μL cell disruption buffer containing β-mercaptoethanol and centrifuged for 1 min at 6,000rpm in a microcentrifuge. Supernatant was mixed with equal parts 2× Lysis/Binding Solution and 100% ethanol. Sample mixture was transferred to a filter cartridge and centrifuged for 1m at 10,000rpm. The supernatant flow-through was discarded, and the column containing RNA was washed with 700ul Wash Solution 1 and then twice more with 500ul Wash Solution 2/3. After final wash, column was placed in a new collection tube, and RNA was eluted with 30 μL pre-heated HOT Elution Solution two times. RNA was treated with TURBO DNA-free kit by incubating RNA with turbo DNase buffer and TURBO DNase for 30 minutes at 37°C. cDNA was synthesized using the SuperScript IV kit (Invitrogen) from ~500ng RNA using oligo dT for mammalian cDNA and random hexamers for bacterial cDNA. Real-time qPCR was performed using iTaq SYBR Green Mix (BioRad) on a Quant Studio 5 by Applied Biosystems. The relative standard curve method was used to analyze gene expression relative to a pooled sample dilution series. Rps17 was used as the endogenous control for all mouse samples. For in vivo bacterial qPCR, samples were normalized to mouse RPS17. For in vitro bacterial qPCR, samples were normalized to 16S rDNA. See Table S3 for primer sequences.
Virulence gene expression of C. rodentium grown in supplemented cultures
A 5 ml culture of LB media was inoculated with a colony of C. rodentium and grown overnight at 37°C, shaking. 10 μL of the overnight culture was used to inoculate 10 mL of LB media, 0.1 mM, 0.5 mM, 1 mM Fe(II) LB media, 0.1 mM, 0.5 mM, 1 mM Fe(III) LB media, or LB media with stated concentration of glucose or lactose. Cultures were grown at 37°C, shaking. Every hour an OD600 was taken and an aliquot of cells was pelleted by centrifugation and snap frozen. RNA was extracted, cDNA synthesis and virulence factor qPCR was done as described above.
Quantification of glucose in luminal content.
Animals were fasted for 6 hrs, after which they were allowed to feed for 2hrs. We measured food consumption after this 2hr feeding period to confirm that iron fed mice did not consume more food during this period compared to other experimental conditions (Figure S4). After the 2hr feeding period, animals were sacrificed and the jejunum, cecum and colons were isolated and luminal content of each region was isolated. The Abcam Glucose Assay Kit (reducing agent compatible) was used per manufacter’s protocol. Briefly, luminal content was diluted with glucose assay buffer and de-proteinized by centrifugation with 10 kDa spin columns (ab93349). 50 ul of samples were mixed with glucose reaction mix containing glucose assay buffer, glucose enzyme mix and glucose substrate mix in a 96 well plate. Samples were incubated at room temperature for 30 minutes protected from light and absorbance was measured at 450 nm.
Glucose and 2-NBDG absorption assays
Mice were fasted for 6 hrs after which they were gavaged with 1.25mg/g body weight of D-glucose. Blood glucose levels were measured from a drop of blood from the lacerated tail using a glucometer every 5 minutes post gavage and the increase in blood glucose levels compared to time 0 minutes measurement was determined and represented as the change in blood glucose. At 15 minutes post gavage, the jejunums were harvested and glucose levels in the luminal content were determined using the Abcam Glucose Assay Kit (reducing agent compatible) as described above. For 2-NBDG absorption, mice were fasted for 6 hrs after which they were gavaged with 100ul of 50mM 2-NBDG (ThermoFisher). Blood was harvested every 5 minutes post-gavage and fluorescence intensity in the serum was measured using a fluorescence plate reader at 465/540nm. The data are shown as change in serum fluorescence intensity. At 15 minutes post-gavage, the jejunums were isolated and luminal content was harvested and fluorescence intensity was measured. A glucose competition assay was done (Figure S4) to confirm specificity of 2-NBDG intestinal absorption.
Carmine red assay
Carmine red (Sigma-Aldrich) was prepared as a 6% (w/v) solution in 0.5% methylcellulose (Sigma-aldrich). Animals were fasted for 6 hrs and then gavaged with 150ul of the carmine solution. Feces were collected every 30 minutes and streaked across a white papertowel to determine the presence of the red carmine dye.
RNAseq
For RNA-seq, libraries were prepared using a strand-specific protocol and sequenced on an Illumina HiSeq2500 Instrument. Sequenced reads were quality-tested using FASTQC (Andrews, 2010) and aligned to the mm10 mouse genome using the STAR aligner (Dobin et al., 2013) version 2.4.0k. Mapping was carried out using default parameters (up to 10 mismatches per read, and up to 9 multi-mapping locations per read). The genome index was constructed using the gene annotation supplied with the mm10 Illumina iGenomes collection (iGenomesonline) and sjdbOverhang value of 100. Uniquely mapped reads were quantified across all gene exons using the top-expressed isoform as proxy for gene expression with the HOMER (Heinz et al., 2010) analysis suite, and differential gene expression was carried out with edgeR (Robinson et al., 2010) using triplicates to compute within-group dispersion. Differentially expressed genes were defined as having a false discovery rate (FDR) <0.01 and a log2 fold change >1 when comparing two experimental conditions. HOMER was used to test for overrepresentation of differentially expressed genes within KEGG (Kanehisa and Goto, 2000) pathways corrected for multiple testing using the Benjamini and Yekutieli general correction for multiple testing (Li et al., 2015). Heatmaps were constructed with JTreeView (Saldanha, 2004).
In vitro growth curve of isolates
C. rodentium strains were grown overnight in LB cultures at 37°C then sub-cultured into transparent 96-well plates at 1:100 dilution. Bacteria were grown either in LB at 37°C with vigorous shaking. Optical dens ity of bacteria was monitored for 12 hours using a VersaMax Turnable Microplate Reader (Molecular Devices).
Genome Sequencing and Bioinformatic Analysis
Genomic DNA from our laboratory wild-type C. rodentium DBS100 and C. rodentium isolates were prepared using the DNeasy Blood and Tissue Kit (Qiagen, 69506) according to manufacturer’s instructions. DNA samples were submitted to The Sequencing Center (Fort Collins, CO) for library preparation using the Nextera XT DNA Library Preparation Kit (Illumina) and paired-end (2×150bp) shot-gun sequencing on the Illumina MiniSeq platform. The raw sequencing data was uploaded to the Galaxy Web platform (Afgan et al., 2016) (public server: https://galaxy-mel.genome.edu.au/galaxy/) for bioinformatic analysis. Sequencing libraries were mapped against the reference genome C. rodentium ICC168 to identify SNPs using Snippy (Galaxy Version 0.2.0) (https://github.com/tseemann/snippy). For whole-genome comparisons between C. rodentium ICC168, DBS100 and isolates, sequence libraries were assembled using SPAdes genome assembler (Galaxy Version 3.11.1) (Bankevich et al., 2012) then contigs were reordered and aligned against the ICC168 chromosome using MAUVE genome alignment software (version 2.4.0) (Darling et al., 2004).
Data and Software Availability
All sequencing data has been uploaded to The Gene Expression Omnibus accession GSE116597 with links to the mouse transcriptome data (GSE111097) and C. rodentium DNA sequencing and mutation analyses (GSE116595).
Quantification and Statistical Analysis
Statistical tests were done using Graphpad Prism version 7.0. Kaplan meier and Log rank analysis was used for all survival experiments. t-test or one way ANOVA with post Tukey test were used for pairwise analyses. Nonlinear regression analysis for tolerance curve. All experiments were repeated at least twice. Sample size and p values are indicated in each figure legend.
Supplementary Material
Figure S5. Dietary iron causes insulin resistance. (A-B) C3H/HeJ mice were orally infected with an LD100 dose of C. rodentium and fed control chow or iron rich chow and (A) white adipose tissue Fe(II) content and (B) white adipose tissue Fe(III) content were measured (n=12 mice per condition). (C-D) C3H/HeJ mice were orally infected with an LD50 dose of C. rodentium and assigned a daily clinical score. (C) ITT and (D) AUC of (C) are shown. n=5 mice per condition. (E) Original blots for Figure 6E. (F-I) Uninfected C3H/HeJ were put on HFD beginning at 3 weeks old. ITTs were run after 4 weeks and 8 weeks after diet. n=5 mice per condition. (F) ITT at 4 weeks. (G) AUC analysis of (F). (H) ITT at 8 weeks. (I) AUC analysis of (H). *p<0.05, **p<0.005, ***p<0.001, ****p<0.0001, Error bars +/− SEM. Related to Figure 6.
Table S2. SNP analysis of attenuated C. rodentium isolates. Related to Figure 7.
Table S3. Primers used in this study. Related to STAR Methods.
Figure S1. Dietary iron promotes co-operative defenses against C. rodentium. (A) Daily food consumption of C. rodentium infected C3H/HeJ mice (LD100 dose) given control chow or 2% carbonyl iron. n=15 mice per condition. (B-D) C3H/HeJ mice were orally infected with an LD100 dose of C. rodentium and given control chow or 2% carbonyl iron chow. At day 1, 3 and 5 post infection total, ferrous and ferric liver iron levels were measured. n=5 mice per condition. (E) Survival of C3H/HeJ mice infected with an LD100 dose of C. rodentium and given dietary iron on the days post-infection stated in figure. Day 6 iron vs control chow, p = 0.0003, Day 3 iron vs control chow, p < 0.0001. n = 5 mice per condition. (F-H) C3H/HeJ mice were orally infected with 1×(n=10 mice per diet), 10× (n=5 mice per diet), 100× (n=15 mice per diet), 500× (n=5 mice per diet) or 1000× (n=10 mice per diet) the LD100 dose of C. rodentium and given 2% carbonyl iron for 14 days or control diet and (F) weight loss, (G) stool scores and (H) morbidity scores were determined. (I) C3H/HeJ mice were orally infected with an LD100 dose of C. rodentium and at the time points indicated, cecums and colons were harvested and CFUs were determined. n=5 mice per condition per time point. (J) Fecal shedding of C. rodentium per gram of stool was measured for each mouse each day post infection. The area under the curve was determined from mice in (F-H). Once mice in the control chow groups stop generating stool samples due to disease progression, we no longer plotted samples for the iron chow groups that received the same dose of pathogen so that the AUC was calculated within the same time frame for each group. *p<0.05, **p<0.01, ***p<0.005, ****p<0.0001. Error bars +/− SEM. Related to Figure 2.
Figure S2. Dietary iron protects from C. rodentium induced intestinal damage. (A) Pathology analysis of colons of mice infected with an LD100 dose of C. rodentium given 2% carbonyl iron or control chow at day 9 post-infection n=5 mice per condition. (B) representative images from mice in (A). Scale bar = 100 microns. *p<0.05, **p<0.01, ***p<0.005, ****p<0.0001. Error bars +/− SEM. Related to Figure 3.
Figure S3. Iron does not act directly on C. rodentium to suppress virulence factor expression. (A-D) Gene expression analysis of stated virulence factors of C. rodentium grown in various concentrations of iron rich media at 6 hrs post culture inoculation. n=3 replicates per condition. *p<0.05, **p<0.01., ***p<0.001, ****p<0.0001. Error bars +/− SEM. Related to Figure 4.
Figure S4. Glucose suppresses expression of virulence factors. (A) Gene expression analysis of virulence factors of C. rodentium grown in 50mM glucose rich media at 6 hrs post culture inoculation. n=3 replicates per condition. (B) Gene expression analysis of virulence factors of C. rodentium grown in 30mM lactose rich media at 6 hrs post culture inoculation. n=3 replicates per condition. (C) At day 3 post-infection, infected mice fed control chow (n=10) or iron chow (n=10) were fasted for 6 hrs and then allowed to feed for two hours. Food consumption was measured after the two hour feeding period. Uninfected mice also shown (n=10). (D) At day 3 post-infection, infected mice fed control chow (n=5) or iron chow (n=5) were fasted for 6 hrs and then gavaged with carmine red. Rate of carmine red appearance in the feces is shown. Uninfected mice also shown (n=5). (E) Mice were orally gavaged with 2-NBDG in the presence and absence of glucose and fluorescence intensity in the serum was determined at 15 minutes post-gavage. n=3 mice per condition. (F-H) Infected mice fed control or iron chow were gavaged with 2-NBDG at day 3 post-infection after a 6 hr fast and (F) the change in fluorescence intensity in the serum was measured at indicated time points. Uninfected mice also shown (n=9 mice per condition). (G) Area under the curve analysis of mice from (F). (H) Levels of 2-NBDG in the lumens of jejunums from mice in (F) at 15 minutes post gavage. (I) Mice were orally infected with an LD100 dose of C. rodentium and given control chow and control water or water supplemented with lactose. Survival was monitored. n=5 mice per condition. *p<0.05, **p<0.01., ***p<0.001, ****p<0.0001. In (F) red * is iron comparison to control chow and brown * is comparison to uninfected. Error bars +/− SEM. Related to Figure 5.
Figure S7. Figure 7. Dietary iron drives long term attenuation of an enteric pathogen. Growth curve of attenuated C. rodentium isolates in LB media. n=4 per isolate. Related to Figure 7.
Figure S6. Insulin resistance is necessary and sufficient for reduced intestinal glucose absorption and attenuation of C. rodentium virulence. (A) DBA/2J mice were raised on HFD or control chow and at 7-8 weeks of age orally infected with 7.5×10¹⁰ CFU C. rodentium and given control chow. At day 11 post-infection, mice were gavaged with FITC dextran and 4 hrs later blood was harvested. Serum fluorescent intensity is shown. n=5 mice per condition. (B-D) DBA/2J mice were raised on HFD or control chow and at 7-8 weeks of age orally infected with 7.5×10¹⁰ CFU C. rodentium and given control chow. At day 11 post-infection, spleens, livers and MLNs were harvested and C. rodentium CFUs were determined. (E) DBA2/J mice were orally infected with 7.5×10¹⁰ CFU C. rodentium and given iron chow (n=5) or control chow (n=5) and survival was monitored. (F) DBA/2J mice were orally infected with 7.5×10¹⁰ CFU C. rodentium and given iron chow (n=27), control chow (n=36) or iron chow plus metformin (n=14) treatment and ITT was done. (G) AUC analysis for (F). (H) Serum 2-NBDG at day 3 post-infection at indicated timepoints after oral gavage. * for iron comparisons and # for HFD comparisons (I) Area under curve analysis of mice in (H) n=9-10 mice per condition. (J) Luminal 2-NBDG levels of jejunums from mice in (H). (K-L) 3 week old DBA/2J mice were given high fat diet for 5 weeks (K) ITT analysis and (L) AUC analysis of (K). n=10 mice per condition. (M) Food consumed by mice within a 2hr period after a 6hr fast. n=3-5 mice per condition. (N) Carmine red assay to measure gut motility. n=5 mice per condition. (O) Survival of uninfected DBA mice treated with iron and metformin, n=10 mice. *p<0.05, **p<0.01, ***p<0.005, ****p<0.0001. Red * or# indicates comparison to control chow, brown * or# indicates comparison to uninfected, blue * or# indicates comparison to iron chow-metformin. Error bars +/− SEM. Related to Figure 6.
Table S1. Sequence reads of attenuated C. rodentium isolates. Related to Figure 7.
Highlights.
Lethal dose 50 can be used to identify co-operative defense mechanisms
Dietary iron promotes co-operative defenses against a lethal enteric infection
Insulin resistance reduces gut glucose absorption
Co-operative defenses drives selection for attenuated pathogen strains
Acknowledgements.
This work was supported NIH grant R01AI114929 (J.S.A) and CA014195, The Nomis Foundation, Searle Scholar Award (J.S.A.), The Ray Thomas Edward Foundation (J.S.A.), DARPA Young Faculty Award YFA15 D15AP00097 (J.S.A), The Leona M. and Harry B. Helmsley Charitable Trust grant #2017-PG-MED001. We thank Sihao Liu and Emanuel Gasser for helpful discussions on metabolic phenotyping and reagents.
Footnotes
Publisher's Disclaimer: This is a PDF file of an unedited manuscript that has been accepted for publication. As a service to our customers we are providing this early version of the manuscript. The manuscript will undergo copyediting, typesetting, and review of the resulting proof before it is published in its final citable form. Please note that during the production process errors may be discovered which could affect the content, and all legal disclaimers that apply to the journal pertain.
Declaration of Interests. The authors declare no conflicts of interest.
References
- Afgan E, Baker D, van den Beek M, Blankenberg D, Bouvier D, Cech M, Chilton J, Clements D, Coraor N, Eberhard C, et al. (2016). The Galaxy platform for accessible, reproducible and collaborative biomedical analyses: 2016 update. Nucleic Acids Res 44, W3–W10. [DOI] [PMC free article] [PubMed] [Google Scholar]
- Agoro R, Benmerzoug S, Rose S, Bouyer M, Gozzelino R, Garcia I, Ryffel B, Quesniaux VFJ, and Mura C (2017). An Iron-Rich Diet Decreases the Mycobacterial Burden and Correlates With Hepcidin Upregulation, Lower Levels of Proinflammatory Mediators, and Increased T-Cell Recruitment in a Model of Mycobacterium bovis Bacille Calmette-Guerin Infection. J Infect Dis 216, 907–918. [DOI] [PubMed] [Google Scholar]
- Andrews (2010). FastQC: a quality control tool for high throughput sequence data. Available online at:http://www.bioinformatics.babraham.ac.uk/proiects/fastqc.
- Ayres JS (2016). Cooperative Microbial Tolerance Behaviors in Host-Microbiota Mutualism. Cell 165, 1323–1331. [DOI] [PMC free article] [PubMed] [Google Scholar]
- Bankevich A, Nurk S, Antipov D, Gurevich AA, Dvorkin M, Kulikov AS, Lesin VM, Nikolenko SI, Pham S, Prjibelski AD, et al. (2012). SPAdes: a new genome assembly algorithm and its applications to single-cell sequencing. J Comput Biol 19, 455–477. [DOI] [PMC free article] [PubMed] [Google Scholar]
- Bauer PV, Duca FA, Waise TMZ, Rasmussen BA, Abraham MA, Dranse HJ, Puri A, O’Brien CA, and Lam TKT (2018). Metformin Alters Upper Small Intestinal Microbiota that Impact a Glucose-SGLT1-Sensing Glucoregulatory Pathway. Cell Metab 27, 101–117 e105. [DOI] [PubMed] [Google Scholar]
- Beckett AC, Piazuelo MB, Noto JM, Peek RM Jr., Washington MK, Algood HM, and Cover TL (2016). Dietary Composition Influences Incidence of Helicobacter pylori-Induced Iron Deficiency Anemia and Gastric Ulceration. Infect Immun 84, 3338–3349. [DOI] [PMC free article] [PubMed] [Google Scholar]
- Bruner KM, Hosmane NN, and Siliciano RF (2015). Towards an HIV-1 cure: measuring the latent reservoir. Trends Microbiol 23, 192–203. [DOI] [PMC free article] [PubMed] [Google Scholar]
- Buschor S, Cuenca M, Uster SS, Scharen OP, Balmer ML, Terrazos MA, Schurch CM, and Hapfelmeier S (2017). Innate immunity restricts Citrobacter rodentium A/E pathogenesis initiation to an early window of opportunity. PLoS Pathog 13, e1006476. [DOI] [PMC free article] [PubMed] [Google Scholar]
- Canonne-Hergaux F, Gruenheid S, Govoni G, and Gros P (1999). The Nramp1 protein and its role in resistance to infection and macrophage function. Proc Assoc Am Physicians 111, 283–289. [DOI] [PubMed] [Google Scholar]
- Cassat JE, and Skaar EP (2013). Iron in infection and immunity. Cell Host Microbe 13, 509–519. [DOI] [PMC free article] [PubMed] [Google Scholar]
- Chen I, Clarke SE, Gosling R, Hamainza B, Killeen G, Magill A, O’Meara W, Price RN, and Riley EM (2016). “Asymptomatic” Malaria: A Chronic and Debilitating Infection That Should Be Treated. PLoS Med 13, e1001942. [DOI] [PMC free article] [PubMed] [Google Scholar]
- Choi JS, Koh IU, Lee HJ, Kim WH, and Song J (2013). Effects of excess dietary iron and fat on glucose and lipid metabolism. J Nutr Biochem 24, 1634–1644. [DOI] [PubMed] [Google Scholar]
- Clark MA, Goheen MM, and Cerami C (2014). Influence of host iron status on Plasmodium falciparum infection. Front Pharmacol 5, 84. [DOI] [PMC free article] [PubMed] [Google Scholar]
- Collins JW, Keeney KM, Crepin VF, Rathinam VA, Fitzgerald KA, Finlay BB, and Frankel G (2014). Citrobacter rodentium: infection, inflammation and the microbiota. Nat Rev Microbiol 12, 612–623. [DOI] [PubMed] [Google Scholar]
- Darling AC, Mau B, Blattner FR, and Perna NT (2004). Mauve: multiple alignment of conserved genomic sequence with rearrangements. Genome Res 14, 1394–1403. [DOI] [PMC free article] [PubMed] [Google Scholar]
- Dobin A, Davis CA, Schlesinger F, Drenkow J, Zaleski C, Jha S, Batut P, Chaisson M, and Gingeras TR (2013). STAR: ultrafast universal RNA-seq aligner. Bioinformatics 29, 15–21. [DOI] [PMC free article] [PubMed] [Google Scholar]
- Dongiovanni P, Ruscica M, Rametta R, Recalcati S, Steffani L, Gatti S, Girelli D, Cairo G, Magni P, Fargion S, et al. (2013). Dietary iron overload induces visceral adipose tissue insulin resistance. Am J Pathol 182, 2254–2263. [DOI] [PubMed] [Google Scholar]
- Elguero E, Delicat-Loembet LM, Rougeron V, Arnathau C, Roche B, Becquart P, Gonzalez JP, Nkoghe D, Sica L, Leroy EM, et al. (2015). Malaria continues to select for sickle cell trait in Central Africa. Proc Natl Acad Sci U S A 112, 7051–7054. [DOI] [PMC free article] [PubMed] [Google Scholar]
- Fargion S, Dongiovanni P, Guzzo A, Colombo S, Valenti L, and Fracanzani AL (2005). Iron and insulin resistance. Aliment Pharmacol Ther 22 Suppl 2, 61–63. [DOI] [PubMed] [Google Scholar]
- Fernandez-Real JM, Lopez-Bermejo A, and Ricart W (2002). Cross-talk between iron metabolism and diabetes. Diabetes 51, 2348–2354. [DOI] [PubMed] [Google Scholar]
- Ferreira A, Marguti I, Bechmann I, Jeney V, Chora A, Palha NR, Rebelo S, Henri A, Beuzard Y, and Soares MP (2011). Sickle hemoglobin confers tolerance to Plasmodium infection. Cell 145, 398–409. [DOI] [PubMed] [Google Scholar]
- Fritsche G, Nairz M, Libby SJ, Fang FC, and Weiss G (2012). Slc11a1 (Nramp1) impairs growth of Salmonella enterica serovar typhimurium in macrophages via stimulation of lipocalin-2 expression. J Leukoc Biol 92, 353–359. [DOI] [PMC free article] [PubMed] [Google Scholar]
- Furuya-Kanamori L, Cox M, Milinovich GJ, Magalhaes RJ, Mackay IM, and Yakob L (2016). Heterogeneous and Dynamic Prevalence of Asymptomatic Influenza Virus Infections. Emerg Infect Dis 22, 1052–1056. [DOI] [PMC free article] [PubMed] [Google Scholar]
- Ganguly S, Saha P, Guha SK, Biswas A, Das S, Kundu PK, and Maji AK (2013). High prevalence of asymptomatic malaria in a tribal population in eastern India. J Clin Microbiol 51, 1439–1444. [DOI] [PMC free article] [PubMed] [Google Scholar]
- Heinz S, Benner C, Spann N, Bertolino E, Lin YC, Laslo P, Cheng JX, Murre C, Singh H, and Glass CK (2010). Simple combinations of lineage-determining transcription factors prime cis-regulatory elements required for macrophage and B cell identities. Mol Cell 38, 576–589. [DOI] [PMC free article] [PubMed] [Google Scholar]
- iGenomesonline Illumina. 2015. http://support.illumina.com/sequencing/sequencing_software/igenome.html.
- Itoh K, Matsui T, Tsuji K, Mitsuoka T, and Ueda K (1988). Genetic control in the susceptibility of germfree inbred mice to infection by Escherichia coli O115a,c:K(B). Infect Immun 56, 930–935. [DOI] [PMC free article] [PubMed] [Google Scholar]
- Jais A, Einwallner E, Sharif O, Gossens K, Lu TT, Soyal SM, Medgyesi D, Neureiter D, Paier-Pourani J, Dalgaard K, et al. (2014). Heme oxygenase-1 drives metaflammation and insulin resistance in mouse and man. Cell 158, 25–40. [DOI] [PMC free article] [PubMed] [Google Scholar]
- Jeney V, Ramos S, Bergman ML, Bechmann I, Tischer J, Ferreira A, Oliveira-Marques V, Janse CJ, Rebelo S, Cardoso S, et al. (2014). Control of disease tolerance to malaria by nitric oxide and carbon monoxide. Cell Rep 8, 126–136. [DOI] [PubMed] [Google Scholar]
- Kanehisa M, and Goto S (2000). KEGG: kyoto encyclopedia of genes and genomes. Nucleic Acids Res 28, 27–30. [DOI] [PMC free article] [PubMed] [Google Scholar]
- Kanow MA, Giarmarco MM, Jankowski CS, Tsantilas K, Engel AL, Du J, Linton JD, Farnsworth CC, Sloat SR, Rountree A, et al. (2017). Biochemical adaptations of the retina and retinal pigment epithelium support a metabolic ecosystem in the vertebrate eye. Elife 6. [DOI] [PMC free article] [PubMed] [Google Scholar]
- Lenzen S, Lortz S, and Tiedge M (1996). Effect of metformin on SGLT1, GLUT2, and GLUT5 hexose transporter gene expression in small intestine from rats. Biochem Pharmacol 51, 893–896. [DOI] [PubMed] [Google Scholar]
- Li J, Shi Y, and Toga AW (2015). Controlling False Discovery Rate in Signal Space for Transformation-Invariant Thresholding of Statistical Maps. Inf Process Med Imaging 24, 125–136. [DOI] [PMC free article] [PubMed] [Google Scholar]
- Loomis WP, Johnson ML, Brasfield A, Blanc MP, Yi J, Miller SI, Cookson BT, and Hajjar AM (2014). Temporal and anatomical host resistance to chronic Salmonella infection is quantitatively dictated by Nramp1 and influenced by host genetic background. Plos One 9, e111763. [DOI] [PMC free article] [PubMed] [Google Scholar]
- Loukas A, Hotez PJ, Diemert D, Yazdanbakhsh M, McCarthy JS, Correa-Oliveira R, Croese J, and Bethony JM (2016). Hookworm infection. Nat Rev Dis Primers 2, 16088. [DOI] [PubMed] [Google Scholar]
- Luzzatto L (2012). Sickle cell anaemia and malaria. Mediterr J Hematol Infect Dis 4, e2012065. [DOI] [PMC free article] [PubMed] [Google Scholar]
- Mackinnon MJ, Gandon S, and Read AF (2008). Virulence evolution in response to vaccination: the case of malaria. Vaccine 26Suppl 3, C42–52. [DOI] [PMC free article] [PubMed] [Google Scholar]
- Marineli F, Tsoucalas G, Karamanou M, and Androutsos G (2013). Mary Mallon (1869-1938) and the history of typhoid fever. Ann Gastroenterol 26, 132–134. [PMC free article] [PubMed] [Google Scholar]
- Medzhitov R, Schneider DS, and Soares MP (2012). Disease tolerance as a defense strategy. Science 335, 936–941. [DOI] [PMC free article] [PubMed] [Google Scholar]
- Mundy R, MacDonald TT, Dougan G, Frankel G, and Wiles S (2005). Citrobacter rodentium of mice and man. Cell Microbiol 7, 1697–1706. [DOI] [PubMed] [Google Scholar]
- Mwangi MN, Prentice AM, and Verhoef H (2017). Safety and benefits of antenatal oral iron supplementation in low-income countries: a review. Br J Haematol 177, 884–895. [DOI] [PMC free article] [PubMed] [Google Scholar]
- Nairz M, Schroll A, Haschka D, Dichtl S, Tymoszuk P, Demetz E, Moser P, Haas H, Fang FC, Theurl I, et al. (2017). Genetic and Dietary Iron Overload Differentially Affect the Course of Salmonella Typhimurium Infection. Front Cell Infect Microbiol 7, 110. [DOI] [PMC free article] [PubMed] [Google Scholar]
- Njoroge JW, Nguyen Y, Curtis MM, Moreira CG, and Sperandio V (2012). Virulence meets metabolism: Cra and KdpE gene regulation in enterohemorrhagic Escherichia coli. MBio 3, e00280–00212. [DOI] [PMC free article] [PubMed] [Google Scholar]
- Oppenheimer SJ (1989). Iron and infection: the clinical evidence. Acta Paediatr Scand Suppl 361, 53–62. [DOI] [PubMed] [Google Scholar]
- Oppenheimer SJ (1998). Iron and infection in the tropics: paediatric clinical correlates. Ann Trop Paediatr 18 Suppl, S81–87. [DOI] [PubMed] [Google Scholar]
- Oppenheimer SJ (2001). Iron and its relation to immunity and infectious disease. J Nutr 131, 616S–633S; discussion 633S-635S. [DOI] [PubMed] [Google Scholar]
- Paul REL, Lafond T, Muller-Graf CDM, Nithiuthai S, Brey PT, and Koella JC (2004). Experimental evaluation of the relationship between lethal or non-lethal virulence and transmission success in malaria parasite infections. Bmc Evol Biol 4. [DOI] [PMC free article] [PubMed] [Google Scholar]
- Pickard JM, Maurice CF, Kinnebrew MA, Abt MC, Schenten D, Golovkina TV, Bogatyrev SR, Ismagilov RF, Pamer EG, Turnbaugh PJ, et al. (2014). Rapid fucosylation of intestinal epithelium sustains host-commensal symbiosis in sickness. Nature 514, 638–641. [DOI] [PMC free article] [PubMed] [Google Scholar]
- Powell DA, and Frelinger JA (2017). Efficacy of Resistance to Francisella Imparted by ITY/NRAMP/SLC11A1 Depends on Route of Infection. Front Immunol 8, 206. [DOI] [PMC free article] [PubMed] [Google Scholar]
- Raberg L, Sim D, and Read AF (2007). Disentangling genetic variation for resistance and tolerance to infectious diseases in animals. Science 318, 812–814. [DOI] [PubMed] [Google Scholar]
- Rao S, Schieber AM, O’Connor CP, Leblanc M, Michel D, and Ayres JS (2017). Pathogen-Mediated Inhibition of Anorexia Promotes Host Survival and Transmission. Cell 168, 503–516 e512. [DOI] [PMC free article] [PubMed] [Google Scholar]
- Riggs MM, Sethi AK, Zabarsky TF, Eckstein EC, Jump RL, and Donskey CJ (2007). Asymptomatic carriers are a potential source for transmission of epidemic and nonepidemic Clostridium difficile strains among long-term care facility residents. Clin Infect Dis 45, 992–998. [DOI] [PubMed] [Google Scholar]
- Robinson MD, McCarthy DJ, and Smyth GK (2010). edgeR: a Bioconductor package for differential expression analysis of digital gene expression data. Bioinformatics 26, 139–140. [DOI] [PMC free article] [PubMed] [Google Scholar]
- Roder PV, Geillinger KE, Zietek TS, Thorens B, Koepsell H, and Daniel H (2014). The role of SGLT1 and GLUT2 in intestinal glucose transport and sensing. Plos One 9, e89977. [DOI] [PMC free article] [PubMed] [Google Scholar]
- Saldanha AJ (2004). Java Treeview--extensible visualization of microarray data. Bioinformatics 20, 3246–3248. [DOI] [PubMed] [Google Scholar]
- Schieber AM, Lee YM, Chang MW, Leblanc M, Collins B, Downes M, Evans RM, and Ayres JS (2015). Disease tolerance mediated by microbiome E. coli involves inflammasome and IGF-1 signaling. Science 350, 558–563. [DOI] [PMC free article] [PubMed] [Google Scholar]
- Schneider DS, and Ayres JS (2008). Two ways to survive infection: what resistance and tolerance can teach us about treating infectious diseases. Nat Rev Immunol 8, 889–895. [DOI] [PMC free article] [PubMed] [Google Scholar]
- Seixas E, Gozzelino R, Chora A, Ferreira A, Silva G, Larsen R, Rebelo S, Penido C, Smith NR, Coutinho A, et al. (2009). Heme oxygenase-1 affords protection against noncerebral forms of severe malaria. Proc Natl Acad Sci U S A 106, 15837–15842. [DOI] [PMC free article] [PubMed] [Google Scholar]
- Simcox JA, and McClain DA (2013). Iron and diabetes risk. Cell Metab 17, 329–341. [DOI] [PMC free article] [PubMed] [Google Scholar]
- Soe-Lin S, Apte SS, Andriopoulos B Jr., Andrews MC, Schranzhofer M, Kahawita T, Garcia-Santos D, and Ponka P (2009). Nramp1 promotes efficient macrophage recycling of iron following erythrophagocytosis in vivo. Proc Natl Acad Sci U S A 106, 5960–5965. [DOI] [PMC free article] [PubMed] [Google Scholar]
- Thaiss CA, Levy M, Grosheva I, Zheng D, Soffer E, Blacher E, Braverman S, Tengeler AC, Barak O, Elazar M, et al. (2018). Hyperglycemia drives intestinal barrier dysfunction and risk for enteric infection. Science. [DOI] [PubMed] [Google Scholar]
- Weis S, Carlos AR, Moita MR, Singh S, Blankenhaus B, Cardoso S, Larsen R, Rebelo S, Schauble S, Del Barrio L et al. (2017). Metabolic Adaptation Establishes Disease Tolerance to Sepsis. Cell 169, 1263–1275 e1214. [DOI] [PMC free article] [PubMed] [Google Scholar]
- Yki-Jarvinen H, Sammalkorpi K, Koivisto VA, and Nikkila EA (1989). Severity, duration, and mechanisms of insulin resistance during acute infections. J Clin Endocrinol Metab 69, 317–323. [DOI] [PubMed] [Google Scholar]
Associated Data
This section collects any data citations, data availability statements, or supplementary materials included in this article.
Supplementary Materials
Figure S5. Dietary iron causes insulin resistance. (A-B) C3H/HeJ mice were orally infected with an LD100 dose of C. rodentium and fed control chow or iron rich chow and (A) white adipose tissue Fe(II) content and (B) white adipose tissue Fe(III) content were measured (n=12 mice per condition). (C-D) C3H/HeJ mice were orally infected with an LD50 dose of C. rodentium and assigned a daily clinical score. (C) ITT and (D) AUC of (C) are shown. n=5 mice per condition. (E) Original blots for Figure 6E. (F-I) Uninfected C3H/HeJ were put on HFD beginning at 3 weeks old. ITTs were run after 4 weeks and 8 weeks after diet. n=5 mice per condition. (F) ITT at 4 weeks. (G) AUC analysis of (F). (H) ITT at 8 weeks. (I) AUC analysis of (H). *p<0.05, **p<0.005, ***p<0.001, ****p<0.0001, Error bars +/− SEM. Related to Figure 6.
Table S2. SNP analysis of attenuated C. rodentium isolates. Related to Figure 7.
Table S3. Primers used in this study. Related to STAR Methods.
Figure S1. Dietary iron promotes co-operative defenses against C. rodentium. (A) Daily food consumption of C. rodentium infected C3H/HeJ mice (LD100 dose) given control chow or 2% carbonyl iron. n=15 mice per condition. (B-D) C3H/HeJ mice were orally infected with an LD100 dose of C. rodentium and given control chow or 2% carbonyl iron chow. At day 1, 3 and 5 post infection total, ferrous and ferric liver iron levels were measured. n=5 mice per condition. (E) Survival of C3H/HeJ mice infected with an LD100 dose of C. rodentium and given dietary iron on the days post-infection stated in figure. Day 6 iron vs control chow, p = 0.0003, Day 3 iron vs control chow, p < 0.0001. n = 5 mice per condition. (F-H) C3H/HeJ mice were orally infected with 1×(n=10 mice per diet), 10× (n=5 mice per diet), 100× (n=15 mice per diet), 500× (n=5 mice per diet) or 1000× (n=10 mice per diet) the LD100 dose of C. rodentium and given 2% carbonyl iron for 14 days or control diet and (F) weight loss, (G) stool scores and (H) morbidity scores were determined. (I) C3H/HeJ mice were orally infected with an LD100 dose of C. rodentium and at the time points indicated, cecums and colons were harvested and CFUs were determined. n=5 mice per condition per time point. (J) Fecal shedding of C. rodentium per gram of stool was measured for each mouse each day post infection. The area under the curve was determined from mice in (F-H). Once mice in the control chow groups stop generating stool samples due to disease progression, we no longer plotted samples for the iron chow groups that received the same dose of pathogen so that the AUC was calculated within the same time frame for each group. *p<0.05, **p<0.01, ***p<0.005, ****p<0.0001. Error bars +/− SEM. Related to Figure 2.
Figure S2. Dietary iron protects from C. rodentium induced intestinal damage. (A) Pathology analysis of colons of mice infected with an LD100 dose of C. rodentium given 2% carbonyl iron or control chow at day 9 post-infection n=5 mice per condition. (B) representative images from mice in (A). Scale bar = 100 microns. *p<0.05, **p<0.01, ***p<0.005, ****p<0.0001. Error bars +/− SEM. Related to Figure 3.
Figure S3. Iron does not act directly on C. rodentium to suppress virulence factor expression. (A-D) Gene expression analysis of stated virulence factors of C. rodentium grown in various concentrations of iron rich media at 6 hrs post culture inoculation. n=3 replicates per condition. *p<0.05, **p<0.01., ***p<0.001, ****p<0.0001. Error bars +/− SEM. Related to Figure 4.
Figure S4. Glucose suppresses expression of virulence factors. (A) Gene expression analysis of virulence factors of C. rodentium grown in 50mM glucose rich media at 6 hrs post culture inoculation. n=3 replicates per condition. (B) Gene expression analysis of virulence factors of C. rodentium grown in 30mM lactose rich media at 6 hrs post culture inoculation. n=3 replicates per condition. (C) At day 3 post-infection, infected mice fed control chow (n=10) or iron chow (n=10) were fasted for 6 hrs and then allowed to feed for two hours. Food consumption was measured after the two hour feeding period. Uninfected mice also shown (n=10). (D) At day 3 post-infection, infected mice fed control chow (n=5) or iron chow (n=5) were fasted for 6 hrs and then gavaged with carmine red. Rate of carmine red appearance in the feces is shown. Uninfected mice also shown (n=5). (E) Mice were orally gavaged with 2-NBDG in the presence and absence of glucose and fluorescence intensity in the serum was determined at 15 minutes post-gavage. n=3 mice per condition. (F-H) Infected mice fed control or iron chow were gavaged with 2-NBDG at day 3 post-infection after a 6 hr fast and (F) the change in fluorescence intensity in the serum was measured at indicated time points. Uninfected mice also shown (n=9 mice per condition). (G) Area under the curve analysis of mice from (F). (H) Levels of 2-NBDG in the lumens of jejunums from mice in (F) at 15 minutes post gavage. (I) Mice were orally infected with an LD100 dose of C. rodentium and given control chow and control water or water supplemented with lactose. Survival was monitored. n=5 mice per condition. *p<0.05, **p<0.01., ***p<0.001, ****p<0.0001. In (F) red * is iron comparison to control chow and brown * is comparison to uninfected. Error bars +/− SEM. Related to Figure 5.
Figure S7. Figure 7. Dietary iron drives long term attenuation of an enteric pathogen. Growth curve of attenuated C. rodentium isolates in LB media. n=4 per isolate. Related to Figure 7.
Figure S6. Insulin resistance is necessary and sufficient for reduced intestinal glucose absorption and attenuation of C. rodentium virulence. (A) DBA/2J mice were raised on HFD or control chow and at 7-8 weeks of age orally infected with 7.5×10¹⁰ CFU C. rodentium and given control chow. At day 11 post-infection, mice were gavaged with FITC dextran and 4 hrs later blood was harvested. Serum fluorescent intensity is shown. n=5 mice per condition. (B-D) DBA/2J mice were raised on HFD or control chow and at 7-8 weeks of age orally infected with 7.5×10¹⁰ CFU C. rodentium and given control chow. At day 11 post-infection, spleens, livers and MLNs were harvested and C. rodentium CFUs were determined. (E) DBA2/J mice were orally infected with 7.5×10¹⁰ CFU C. rodentium and given iron chow (n=5) or control chow (n=5) and survival was monitored. (F) DBA/2J mice were orally infected with 7.5×10¹⁰ CFU C. rodentium and given iron chow (n=27), control chow (n=36) or iron chow plus metformin (n=14) treatment and ITT was done. (G) AUC analysis for (F). (H) Serum 2-NBDG at day 3 post-infection at indicated timepoints after oral gavage. * for iron comparisons and # for HFD comparisons (I) Area under curve analysis of mice in (H) n=9-10 mice per condition. (J) Luminal 2-NBDG levels of jejunums from mice in (H). (K-L) 3 week old DBA/2J mice were given high fat diet for 5 weeks (K) ITT analysis and (L) AUC analysis of (K). n=10 mice per condition. (M) Food consumed by mice within a 2hr period after a 6hr fast. n=3-5 mice per condition. (N) Carmine red assay to measure gut motility. n=5 mice per condition. (O) Survival of uninfected DBA mice treated with iron and metformin, n=10 mice. *p<0.05, **p<0.01, ***p<0.005, ****p<0.0001. Red * or# indicates comparison to control chow, brown * or# indicates comparison to uninfected, blue * or# indicates comparison to iron chow-metformin. Error bars +/− SEM. Related to Figure 6.
Table S1. Sequence reads of attenuated C. rodentium isolates. Related to Figure 7.
Data Availability Statement
All sequencing data has been uploaded to The Gene Expression Omnibus accession GSE116597 with links to the mouse transcriptome data (GSE111097) and C. rodentium DNA sequencing and mutation analyses (GSE116595).