

Abstract
Background
The inclusion of subsyndromal forms of bipolarity in the fifth edition of the DSM has major implications for the way in which we approach the diagnosis of individuals with depressive symptoms. The aim of the present study was to use methods based on item response theory (IRT) to examine whether, when equating for levels of depression severity, there are differences in the likelihood of reporting DSM-IV symptoms of major depressive episode (MDE) between subjects with and without a lifetime history of manic symptoms.
Methods
We conducted these analyses using a large, nationally representative sample from the USA (n = 34,653), the second wave of the National Epidemiologic Survey on Alcohol and Related Conditions.
Results
The items sadness, appetite disturbance and psychomotor symptoms were better indicators of depression severity in participants without a lifetime history of manic symptoms, in a clinically meaningful way. DSM-IV symptoms of MDE were substantially less informative in participants with a lifetime history of manic symptoms than in those without such history.
Limitations
Clinical information on DSM-IV depressive and manic symptoms was based on retrospective self-report
Conclusions
The clinical presentation of depressive symptoms may substantially differ in individuals with and without a lifetime history of manic symptoms. These findings alert to the possibility of atypical symptomatic presentations among individuals with co-occurring symptoms or disorders and highlight the importance of continued research into specific pathophysiology differentiating unipolar and bipolar depression
Keywords: depression, unipolar, bipolar, symptoms, item response theory, differential item functioning
Introduction
The inclusion of subthreshold forms of bipolarity (referred to as “Other Specified Bipolar and Related Disorder”) in the fifth edition of the Diagnostic and Statistical Manual of psychiatric disorders (DSM-5) (American Psychiatric Association, 2013) has revived decades of debate regarding whether major depressive disorder and bipolar disorder are distinct and easily distinguishable diagnostic entities (Smith and Craddock, 2011). Given the depression-predominant course of illness in bipolar disorder and the risk for inadequate identification and treatment (Hirschfeld et al., 2003; Perlis, 2005; Stensland et al., 2008), determining whether there are unique features that differentiate bipolar depression from unipolar depression has potentially far-reaching implications for the clinical assessment and management of large numbers of patients with depression (Angst et al., 2011; Ghaemi et al., 2000; Hoertel et al., 2013a; McMahon et al., 2016).
Despite the clinical and research importance of this debate, there remains disagreement as to whether there are unique phenomenological differences in depression symptom expression between bipolar and unipolar depression. While some studies have suggested that unipolar and bipolar depression symptom presentations are more similar than different (Joffe et al., 1999; Robertson et al., 1996), others indicate that certain depressive features may differentiate bipolar depression from unipolar depression. Specifically, bipolar depression may be associated with higher rates of atypical features (Akiskal and Benazzi, 2005; Benazzi, 1999; Mitchell et al., 2001; Moreno et al., 2012; Perlis et al., 2006; Perugi et al., 1998), psychotic symptoms (Mitchell et al., 2001; Olfson et al., 2005; Parker et al., 2000; Solomon et al., 2006), melancholic features (Parker et al., 2000), agitation (Endicott et al., 1985; Hantouche and Akiskal, 2005; Rihmer et al., 2001), psychomotor disturbance (Hoertel et al., 2013b; Mitchell et al., 2008, 2001; Parker et al., 2000; Weinstock et al., 2009) and suicidal ideation (Hoertel et al., 2013b; Moreno et al., 2012; Weinstock et al., 2009). In contrast, individuals with unipolar depression may tend to endorse higher rates of anxiety (Bowden, 2005; Cuellar et al., 2005; Mitchell et al., 2001), insomnia (Benazzi, 1999; Hantouche and Akiskal, 2005; Mitchell et al., 2008, 1992; Mitchell and Malhi, 2004; Mitchell et al., 2001; Perlis et al., 2006), appetite loss (Mitchell et al., 1992; Mitchell and Malhi, 2004; Mitchell et al., 2001; Olfson et al., 2005) and somatic complaints (Cuellar et al., 2005; Mitchell et al., 2008; Mitchell and Malhi, 2004; Perlis et al., 2006). For example, two studies applied two different statistical approaches to the 2001–2002 National Epidemiologic Survey on Alcohol and Related Conditions (NESARC) (Moreno et al., 2012; Weinstock et al., 2009) and reached opposite conclusions regarding the presence of differences in depression symptom expression between bipolar and unipolar depression.
These mixed results may be attributed, at least in part, to methodological differences such as reliance on samples of convenience precluding extrapolation of their results to the general population, small sample sizes, incomplete assessment of full range of DSM-IV major depressive episode (MDE) criteria, absence of control for overall symptom severity in the comparisons of clinical presentations across groups, as well as the inclusion of a substantial proportion of individuals with MDD and subthreshold hypomania within the MDD diagnostic category (Hoertel et al., 2013c). This last point is critical because prior research conducted in both clinical and general population samples suggests that the prevalence of lifetime history of subthreshold hypomania in individuals with major depressive disorder (MDD) ranges from 30% to 55% (Angst et al., 2011, 2010, 2003; Fiedorowicz et al., 2011; Hoertel et al., 2013b; Judd and Akiskal, 2003; Lewinsohn et al., 1995; Merikangas et al., 2008; Zimmermann et al., 2009), supporting the existence of large overlaps between unipolar and bipolar disorders. Therefore, the change implemented in DSM-5 means that up to half of patients currently diagnosed as having MDD may qualify for an ‘other specified bipolar and related disorder’ diagnosis (Nusslock and Frank, 2011). This shift in diagnostic category has major implications for the way in which we approach the assessment, diagnosis and management of large numbers of patients presenting for help with depressive symptoms. Since individuals with MDD and subthreshold hypomania may more closely resemble to those with bipolar disorder (BD) (Nusslock and Frank, 2011), it is likely that inclusion of subthreshold bipolarity within the unipolar diagnostic category has led prior studies to underestimate differences in depression symptom expression between unipolar and bipolar depression and may explain at least partly discrepancies in results between previous studies (Hoertel et al., 2013c).
To our knowledge, no study has examined in the general population differences in depression symptom expression in individuals with a lifetime history of manic symptoms (broadly referred to as “bipolar spectrum symptom group”) versus those without such symptoms (referred to as “unipolar symptom group”).
Accordingly, our aim was to examine whether there are differences in the likelihood of reporting DSM-IV MDE symptoms between individuals with and without a lifetime history of manic symptoms, when equating for levels of depression severity using item response theory (IRT) methods. Methods based on IRT, which are rapidly becoming the gold standard for examining differential symptom expression (Aggen et al., 2005; Hoertel et al., 2015b, 2014; Peyre et al., 2014, Rivollier et al., 2015; Simon and Von Korff, 2006; Uebelacker et al., 2009, 2010; Weinstock et al., 2009, 2010), provide significant improvements over previous statistical techniques as IRT approaches allow examining the likelihood that a particular symptom will be reported given a particular level of depression severity (Lord, 1980). We hypothesized that symptom features of depression would substantially differ between individuals with and without a lifetime history of manic symptoms. To conduct these analyses, we used a large representative sample of the US population.
Materials and Methods
Sample
The National Epidemiologic Survey on Alcohol and Related Conditions (NESARC) is a survey of a nationally representative sample of the civilian adult population of the United States, described in detail elsewhere (Grant et al., 2009, 2004a, 2004b). Participants were drawn from the 2004–2005 NESARC (Grant et al., 2009), the second Wave following upon the Wave 1 NESARC. The cumulative response rate at Wave 2 was 70.2%, reflecting 34,653 completed both Wave 1 and Wave 2 interviews. Weighted Wave 2 data were adjusted to be representative of the civilian population on sociodemographic variables including region, age, race/ethnicity and sex, based on the 2000 Decennial Census. The research protocol, including informed consent procedures, received full human subjects review and approval from the US Census Bureau and the Office of Management and Budget. The present analysis consists of all individuals who completed the second wave of the NESARC (n=34,653).
Measures
Participants were interviewed face to face with the Alcohol Use Disorder and Associated Disabilities Interview Schedule, DSM-IV version (AUDADIS-IV), a fully structured diagnostic instrument designed for experienced lay interviewers (Grant et al., 2009).
Assessments of DSM-IV symptoms of MDE
All NESARC participants were asked whether they had a lifetime history of 2-week episode of depressed mood and/or anhedonia. Participants with a lifetime history of 2-week episode of depressed mood and/or anhedonia were further asked about the other DSM-IV depressive symptoms. Consistent with DSM-IV, a major depressive episode (MDE) was diagnosed when an individual reported at least 2 weeks of persistent depressed mood or anhedonia, accompanied by a total of at least 5 of the 9 DSM-IV symptoms of MDE during the episode. To reduce participants’ burden, the diagnosis of MDE focused on the most severe episode (Hasin et al., 2005). Test-retest reliability (Grant et al., 2003; Hasin et al., 2005) and validity (Canino et al., 1999; Grant et al., 2003) of the AUDADIS-IV diagnoses of MDD are good (k = 0.64–0.67), and a clinical reappraisal study (Grant et al., 2004a) of major depressive episode indicated good agreement between AUDADIS-IV and psychiatrist diagnoses (k = 0.64–0.68). Analyses for this study focused on the nine DSM-IV MDE symptoms (Table 1).
Table 1.
Prevalence of DSM-IV depressive symptoms in participants with and without a lifetime history of manic symptoms in the full NESARC sample and in the subsample of those with a lifetime diagnosis of DSM-IV MDE.
| Full Sample
|
Participants with lifetime DSM-IV MDE
|
|||||||
|---|---|---|---|---|---|---|---|---|
| History of manic symptoms (N = 6,465) |
No history of manic symptoms (N = 28,173) |
History of manic symptoms (N = 3,350) |
No history of manic symptoms (N = 4,589) |
|||||
|
|
|
|
|
|
|
|||
| DSM-IV symptoms | % | % | OR [95%CI] | p-value | % | % | OR [95%CI] | p-value |
|
|
|
|
|
|
|
|
||
| Sadness | 65.9 | 31.0 | 4.35 [4.00–4.55] | <0.001 | 93.0 | 93.3 | 1.35 [1.27–1.43] | 0.676 |
| Anhedonia | 60.2 | 23.5 | 1.72 [1.64–1.82] | <0.001 | 86.9 | 82.1 | 1.27 [1.18–1.35] | <0.001 |
| Appetite disturbance | 52.3 | 18.4 | 1.56 [1.47–1.64] | <0.001 | 79.8 | 74.7 | 1.25 [1.18–1.35] | <0.001 |
| Sleep disturbance | 58.0 | 22.0 | 1.69 [1.59–1.79] | <0.001 | 89.6 | 88.1 | 1.32 [1.23–1.41] | 0.098 |
| Fatigue | 51.9 | 19.0 | 1.61 [1.52–1.72] | <0.001 | 82.6 | 80.1 | 1.30 [1.22–1.39] | 0.025 |
| Psychomotor symptoms | 42.5 | 12.8 | 1.33 [1.25–1.43] | <0.001 | 69.0 | 59.9 | 1.16 [1.08–1.25] | <0.001 |
| Worthlessness / guilt | 46.3 | 14.0 | 1.35 [1.27–1.43] | <0.001 | 74.7 | 65.5 | 1.18 [1.09–1.27] | <0.001 |
| Concentration difficulties | 56.8 | 20.2 | 1.59 [1.49–1.67] | <0.001 | 87.9 | 84.6 | 1.28 [1.20–1.37] | 0.001 |
| Suicidality | 36.0 | 10.7 | 1.32 [1.23–1.43] | <0.001 | 57.4 | 47.9 | 1.12 [1.03–1.20] | <0.001 |
| DSM-IV diagnosis of major depressive episode | 51.0 | 15.4 | 5.88 [5.26–6.25] | <0.001 | – | – | – | – |
Percentages are weighted values.
p-values in bold are statistically significant (p < .05) after adjusting for multiple testing using the Benjamini-Hochberg procedure
Assessment of lifetime history of manic symptoms
All participants were asked for the lifetime presence of the DSM-IV criterion A for hypomania, assessed with the three following questions: (i) “In your entire life, have you ever had a time lasting at least 1 week when you felt so extremely excited, elated or hyper that other people thought you weren’t your normal self?”, (ii) “In your entire life, have you ever had a time lasting at least 1 week when you felt so extremely excited, elated or hyper that other people were concerned about you?” and (iii) “In your entire life, have you ever had a time lasting at least 1 week when you were so irritable or easily annoyed that you would shout at people, throw or break things, or start fights or arguments?”. Respondents who answered affirmatively to at least one of these questions were considered having a “lifetime history of manic symptoms”. All other responders were referred to “no lifetime history of manic symptoms”.
Analyses
Comparing prevalence of depressive symptoms
Differences in prevalence of each DSM-IV depressive symptom between participants with and without a lifetime history of manic symptoms were tested using chi-square tests in both the full NESARC sample and the subsample of participants with a lifetime DSM-IV diagnosis of MDE.
To examine differential item functioning (DIF) in the symptoms of MDE between individuals with and without a lifetime history of manic symptoms, we used a multigroup confirmatory factor analysis.
Multisample confirmatory factor analysis (MCFA) for DIF analyses
Assessing unidimensionality
Prior to item response theory modeling, including testing for differential item functioning (DIF), it is necessary to confirm the unidimensionality of the set of symptoms. Eigenvalue analysis of the tetrachoric correlation matrices of the nine DSM-IV depressive symptoms was performed separately in individuals with a lifetime history of manic symptoms and in those without such history. A scree plot with an elbow after the first eigenvalue and a well-fitting one-factor model according to standard goodness of fit tests (RMSEA<.06, TLI>.95 and CFI>.95) were used to indicate unidimensionality in both sets of analyses (Hu and Benter, 1999).
Item response theory (IRT)
Item response theory (IRT) modeling was conducted to examine whether the DSM-IV depressive symptoms were endorsed similarly in participants with and without a lifetime history of manic symptoms after adjusting for differences in underlying depression severity (Harford et al., 2013). In IRT, a severity and a discrimination parameter are estimated for each item (i.e., symptoms of MDE in this study) indicating where along the latent severity continuum a symptom has a probability of 50% of being endorsed (for the severity parameter), and how rapidly the probability of observing the symptom changes across increasing levels of the latent severity continuum (for the discrimination parameter).
All factor analyses were conducted in Mplus Version 7.0 (Muthén and Muthén, 2007) which takes into account the NESARC sampling weights and design effects in the parameter and standard error estimation as well as model fit calculations. The default estimator for the analysis was the variance adjusted weighted least squares (WLSMV), a robust estimator that provides the best option for modeling categorical or ordered data (Muthén and Muthén, 2007).
Testing differential item functioning (DIF)
Multisample confirmatory factor analysis (MCFA) was used to test DIF across groups of (a) factor loadings (i.e., item discrimination parameters) and (b) thresholds (i.e., severity parameters). The different models varied in terms of the parameters constrained to be equal across groups (Millsap and Yun-Tein, 2004). Initially, an unconstrained model was fit allowing all parameters to differ between groups (i.e., individuals with and without a lifetime history of manic symptoms) in both sets of analyses (Table 2). Following a method previously described by McBride and colleagues (McBride et al., 2010), analyses were conducted iteratively to determine which IRT parameters differ between both groups. Nested models were compared using the chi-square difference test (implemented using the DIFFTEST option in Mplus) (Peyre et al., 2014; Rivollier et al., 2015). To detect DIF in IRT parameters of each item, the discrimination and severity parameters of the others items were constrained to be equal between groups. For each item, a chi-square difference test DIF comparing models with and without the discrimination parameter of the item constrained to be equal between groups was used to identify DIF in the discrimination parameter. To identify DIF in the severity parameter, a chi-square difference test DIF was used to compare models with and without the severity parameter of the item constrained to be equal between groups.
Table 2.
Differential item functioning (DIF) of DSM-IV depressive symptoms in participants with and without a lifetime history of manic symptoms in the NESARC sample, using multigroup confirmatory factor analysis.
| History of manic symptoms (N = 6,465) |
No history of manic symptoms (N = 28,173) |
DIFFTEST a
|
DIFFTEST b
|
|||||||||
|---|---|---|---|---|---|---|---|---|---|---|---|---|
| DSM-IV symptoms | a | Rank a | b | Rank b | a | Rank a | b | Rank b | DIFa | pDifference | DIFb | pDifference |
|
|
|
|||||||||||
| Sadness | 2.28 | 7 | 0.59 | 1 | 3,84 | 9 | 0,51 | 1 | 1,57 | <0.001 | −0,08 | <0.001 |
| Anhedonia | 2.07 | 6 | 0.75 | 2 | 2,58 | 5 | 0,78 | 2 | 0,52 | <0.001 | 0,02 | 0.543 |
| Appetite disturbance | 1.71 | 3 | 0.97 | 5 | 2,26 | 4 | 0,99 | 6 | 0,55 | <0.001 | 0,01 | 0.492 |
| Sleep disturbance | 3.03 | 9 | 0.83 | 3 | 3,68 | 8 | 0,80 | 3 | 0,65 | <0.001 | −0,03 | 0.233 |
| Fatigue | 1.60 | 2 | 1.26 | 8 | 1,96 | 2 | 1,28 | 8 | 0,37 | <0.001 | 0,01 | 0.219 |
| Psychomotor symptoms | 2.04 | 5 | 0.99 | 6 | 2,71 | 6 | 0,94 | 5 | 0,67 | <0.001 | −0,05 | 0.086 |
| Worthlessness / guilt | 1.78 | 4 | 1.15 | 7 | 2,17 | 3 | 1,19 | 7 | 0,39 | <0.001 | 0,04 | 0.058 |
| Concentration difficulties | 2.66 | 8 | 0.86 | 4 | 3,21 | 7 | 0,87 | 4 | 0,55 | <0.001 | 0,02 | 0.549 |
| Suicidality | 1.18 | 1 | 1.51 | 9 | 1,50 | 1 | 1,49 | 9 | 0,32 | <0.001 | −0,02 | 0.206 |
Note:
a = discrimination parameter estimate,
b = severity parameter estimate.
p-values were adjusted for multiple testing using the Benjamini-Hochberg procedure.
Values in bold are statistically (p < .05) and clinically significant (method described in the article).
Sampling weights and design effects of the NESARC were taken into account.
DIFFTEST a = comparing models with the factor loading free and fixed for the corresponding item.
DIFFTEST b = comparing models with the threshold respectively free and fixed for the corresponding item.
To minimize the number of false positives that could derive from the multiple comparisons conducted in this study, we set alpha at 0.05 and used the Benjamini–Hochberg procedure to adjust p-values for all 1 df tests (Benjamini and Hochberg, 1995). Furthermore, small differences in severity between groups can be statistically significant but may not be clinically meaningful (Strong et al., 2009). Thus, it was decided a priori that only differences greater than 0.50 in symptom discrimination and severity would be considered as clinically meaningful (Steinberg and Thissen, 2006). Such differences in symptom severity can be interpreted as one “half of the standard unit difference between the values of the (underlying) trait necessary to have a 50–50 chance of responding positively in one group compared to another” (Steinberg and Thissen, 2006). This difference may be associated with differences as large as 10% in the probability of response (Steinberg and Thissen, 2006). Because graphical display is helpful in placing the “effect sizes in a practical and theoretical context” (Wilkinson, 1999), we present the item response curves (IRC) for all symptom parameters (see supplemental Figures S1 to S9). Minimum sample size for DIF analyses is usually considered in the range of 100–200 subjects per group (Zumbo, 1999). Based on a simulation study, Scott et al. (Scott et al., 2010) recommended a minimum of 200 participants per group to ensure adequate performance (i.e., 80% power).
Total information function (TIF)
The TIF and the standard error of measurement (SEM, which is equal to the inverse square root of the TIF) were estimated in each group. The TIF is a graphic representation of the total quantity of information yielded by a set of items at each latent trait level. The area under the TIF curve (AUC) corresponds to the total amount of information provided by the set of items. The standard error of measurement is related to the reliability of the measurement and is equal to the square root of 1 minus reliability (e.g., a SEM of 0.55 is equal to an internal consistency of 0.70) (Weiss and Davison, 1981). The TIF and the SEM represent the information and precision of a set of items across different levels of a latent trait.
Results
Sample characteristics
Of the 34,653 participants included in this study, 15 (0.03%) were excluded from our analysis because they did not answer to any question on depressive or manic symptoms in both waves. Of the 34,638 remaining participants, 6,465 reported a lifetime history of manic symptoms.
Prevalence of symptoms of MDE
Table 1 shows the prevalence of symptoms of MDE in participants with and without a lifetime history of manic symptoms in the full NESARC sample and in the subsample of respondents with a lifetime DSM-IV diagnosis of MDE. In both the full sample and the subsample of participants with a lifetime DSM-IV diagnosis of MDE, the most frequently endorsed depressive symptoms in both groups were sadness, anhedonia, sleep disturbance and concentration difficulties whereas the criterion suicidality was the least commonly reported. In the full sample, the lifetime prevalence rates of all symptoms of MDE were significantly higher in participants with a lifetime history of manic symptoms than in those without such condition. In the subsample of respondents with a lifetime DSM-IV diagnosis of MDE, the symptoms anhedonia, appetite disturbance, psychomotor disturbance, worthlessness/guilt, concentration difficulties and suicidality were significantly more prevalent in participants with a lifetime history of manic symptoms.
DIF results using multisample confirmatory factor analysis
Unidimensionality of symptoms of MDE
In both groups (i.e., individuals with and without a lifetime history of manic symptoms), fit indices indicated an excellent fit to the data in the full sample. In individuals with a lifetime history of manic symptoms, the first factor eigenvalue was 7.2, whereas the second factor eigenvalue was 0.5. For this group, the fit indices were CFI=0.998, TLI=0.997 and RMSEA=0.032. In individuals without a lifetime history of manic symptoms, the first factor eigenvalue was 7.8, whereas the second factor eigenvalue was 0.3. The scree plots are shown in supplemental Figures S1a and S1b. The fit indices were CFI=0.999, TLI=0.999 and RMSEA=0.022. We determined that these fit statistics were adequate to proceed to fitting IRT models. The item response curves (IRC) for both groups are shown in supplemental Figures S2a and S2b.
Differential item functioning (DIF)
In the full sample, after adjusting for multiple testing using the Benjamini-Hochberg procedure, all items displayed statistically significant differences between groups in symptom discrimination but only six (i.e., sadness, anhedonia, appetite disturbance, sleep disturbance, psychomotor symptoms and concentration difficulties) reached our a priori threshold for clinical significance (DIF higher than 0.50). In addition, only one item (i.e, sadness) displayed statistically significant differences between groups in symptom severity but this item did not reach our a priori threshold for clinical significance (Table 2).
Visual inspection of the item response curves (IRC) for sadness, anhedonia, appetite disturbance, sleep disturbance, psychomotor symptoms and concentration difficulties (given in supplementary material) revealed that curves of three items (i.e., sadness, appetite disturbance and psychomotor symptoms) were graphically substantially steeper in individuals without a lifetime history of manic symptoms than in those with a history of manic symptoms. These results suggest that the items sadness, appetite disturbance and psychomotor disturbance were better indicators of depression severity (i.e., provide more information about the level of the latent construct representing depression severity) in individuals without a lifetime history of manic symptoms than in those with a history of manic symptoms, in a clinically meaningful way.
Test information function (TIF)
The TIF curve of the group of individuals with a lifetime history of manic symptoms had a lower peak than the TIF curve of the group of those without a history of manic symptoms (vertical shift), indicating that DSM-IV symptoms of MDE are less informative in participants with a lifetime history of manic symptoms than in those without such history (Figure 1).
Figure 1.
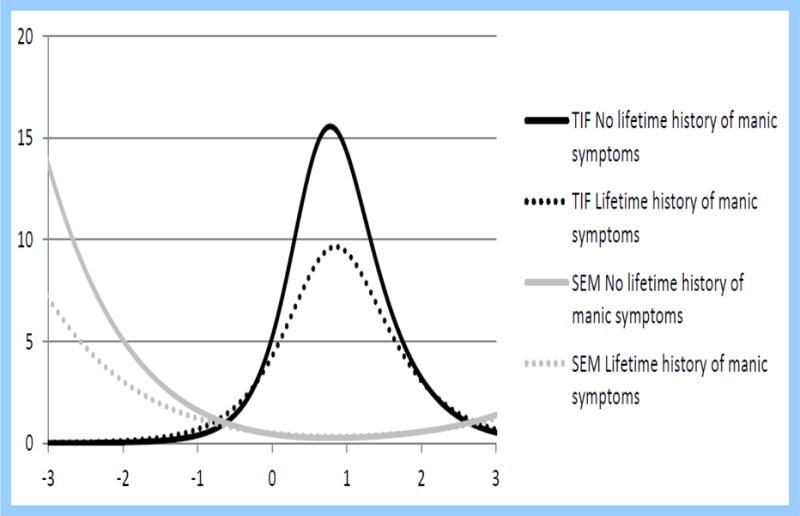
Test information function (TIF) and its standard error of measures (SEM) of DSM-IV depressive symptoms in individuals with and without a lifetime history of manic symptoms (N=34,638).
Because psychiatric comorbidities and depressive symptoms are more prevalent in individuals with bipolar spectrum disorder (Hoertel et al., 2013b; Nusslock and Frank, 2011) and might explain these results, we further examined the TIF curves for both groups 1) in the subpopulation of subjects without any lifetime mental comorbidity (i.e., without any lifetime history of anxiety disorder, substance use disorder or personality disorder) and 2) in the subpopulation of subjects with a lifetime history of 2-week episode of depressed mood and/or anhedonia and without any lifetime mental comorbidity. We found that the vertical shift was substantially reduced (Figures 2 and 3), with a group difference in the total amount of information provided by the set of depressive items (corresponding to the difference in area under the curve (AUC) between the two TIF curves) of 55% in the full sample (Figure 1), of 51% in the subpopulation of those without any lifetime history of psychiatric comorbidity (Figure 2), and of 4% in the subpopulation of those with a lifetime history of 2-week episode of depressed mood and/or anhedonia and without any lifetime history of psychiatric comorbidity (Figure 3). This result suggests that differences between groups are partly explained by differential rates of psychiatric comorbidity and history of 2-week episode of depressed mood and/or anhedonia.
Figure 2.
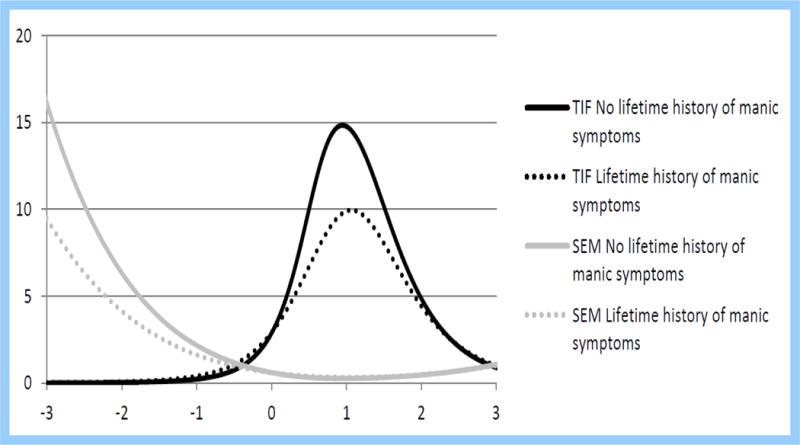
Test information function (TIF) and its standard error of measures (SEM) of DSM-IV depressive symptoms in individuals with and without a lifetime history of manic symptoms, in the subpopulation of those without any lifetime history of psychiatric comorbidity (i.e., no lifetime history of anxiety disorder, substance use disorder or personality disorder) (N=20,706).
Figure 3.
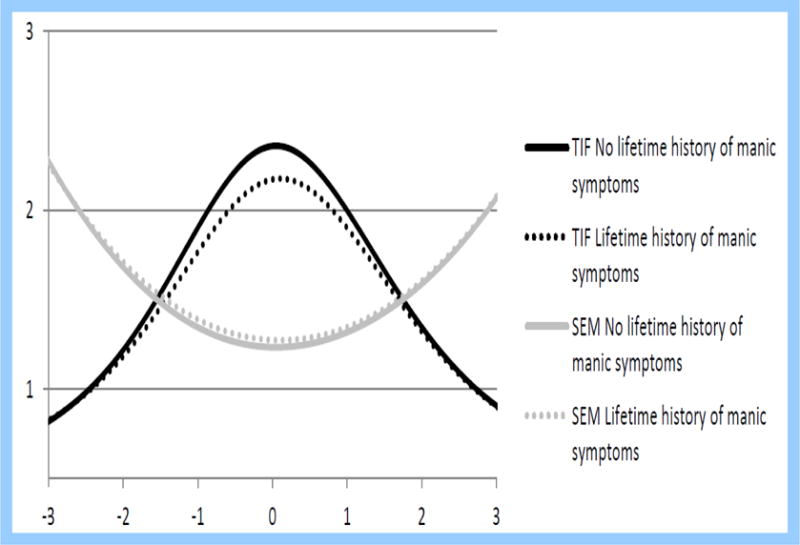
Test information function (TIF) and its standard error of measures (SEM) of DSM-IV depressive symptoms in individuals with and without a lifetime history of manic symptoms, in the subpopulation of those with a lifetime history of 2-week episode of depressed mood and/or anhedonia and without any lifetime history of psychiatric comorbidity (i.e., no lifetime history of anxiety disorder, substance use disorder or personality disorder) (N=6,444).
Discussion
To our knowledge, this is the first study to examine differences in the likelihood of reporting DSM-IV symptoms of MDE between individuals with and without a lifetime history of manic symptoms in a nationally representative sample using an IRT-based methodology. The benefit of the IRT-based approach is that it accounts for the potential confounding effect of depression severity in evaluating potential group differences in symptom expression (Asparouhov, 2005). Additional strengths of the present study include (i) the use of a large, representative community sample, (ii) the use of an a priori defined threshold of clinical significance so that emphasis was placed on differences that are substantively meaningful rather than only on statistical significance, and (iii) the incorporation in our analyses of information from the sampling methods of the survey design which has been suggested to substantially improve standard error estimates and tests of model fit (Asparouhov, 2005).
Although most prior research found only subtle differences in depressive symptoms between MDD and bipolar disorder (Cassano et al., 1989; Cuellar et al, 2005; Mitchell et al., 2011; Swann, 1994), the specific contribution of manic symptoms to the depression symptom expression in the general population had not been previously examined. The current study results revealed clinically substantial differences in symptom expression between the unipolar symptom group (those without a lifetime history of manic symptoms) and the bipolar spectrum symptom group (those with a lifetime history of manic symptoms). The data suggested that three symptoms of MDE (i.e., sadness, appetite disturbance and psychomotor symptoms) were better indicators of depression severity (i.e., provide more information about the level of the latent construct representing depression severity) in individuals without a lifetime history of manic symptoms than in those with a lifetime history of manic symptoms. Ranging in size from medium to large in magnitude, these effects suggest that there are clinically relevant differences in depression symptom presentation that may be informative in distinguishing unipolar from bipolar spectrum depression. These findings are consistent with prior research supporting phenomenological differences in depression symptom expression between bipolar and unipolar depression (Akiskal and Benazzi, 2005; Bowden, 2005, Cuellar et al., 2005; Hoertel et al, 2013b; Mitchell et al., 2008, 2001, 1992; Moreno et al., 2012; Olfson et al., 2005; Parker et al., 2000; Perlis et al., 2006; Solomon et al., 2006) and extend them because they support that considering a broader definition of bipolar disorder may allow to unmask in the general population important differences between unipolar and bipolar symptom expression in the general population that are not merely due to differences in depression severity between groups.
Our findings suggest that DSM-IV MDE symptoms, when considered in isolation, may be less informative in individuals with a lifetime history of manic symptoms than in those without such history because they may provide lower information at equal levels of depression severity. MDE symptoms (in particular sadness, appetite disturbance, and psychomotor symptoms) might less accurately reflect the pattern of depressive symptoms in individuals with a lifetime history of manic symptoms than in those without such condition. It is also possible that among individuals with a lifetime history of manic symptoms, depressive symptoms may provide less incremental information. Because individuals with a lifetime history of manic symptoms are more likely than the general population to have depressive symptoms and psychiatric comorbidity, the presence of depressive symptoms in that group may provide less additional information than among individuals without a lifetime history of manic symptoms (Alonso and Molenberghs, 2007).
Our findings have two important implications. From the nosological point of view, our findings call attention to the need to develop reliable and valid procedures to identify diagnostic thresholds for depression and mania in the absence of a gold standard and to examine whether those thresholds should vary in the presence of comorbidity (Hoertel et al., 2015a, 2015c). From the clinical point of view, our findings alert to the possibility of different symptomatic presentations among depressed individuals with co-occurring disorders, which could increase the risk of errors in diagnosis and treatment.
This study should be interpreted in light of some limitations. First, clinical information on depressive and manic symptoms was based on retrospective self-report, which could lead to recall bias. Second, participants had to endorse a 2-week period of depressed mood and/or anhedonia to be asked about other DSM-IV depressive symptoms. Therefore, we may have missed information on other depressive symptoms for some participants with lower levels or shorter durations of depressed mood. However, one third of the full NESARC sample endorsed depressed mood or anhedonia sometime in their life and our results are consistent with those of previous studies (Cooper et al., 1988; Whiffen, 1991; Whiffen and Gotlib, 1993). Finally, we identified participants with manic symptoms based on the lifetime presence during over one week of at least one of three hypomanic symptoms used for the screening of a manic or hypomanic episode. This restrictive definition could have led us to underestimate the proportion of participants with a lifetime history of manic symptoms. Alternatively, these three hypomanic symptoms could be associated with psychopathology other than mania, possibly resulting in an overestimation of participants with a history of manic symptoms. However, our approach is consistent with that of prior epidemiological and clinical studies (Angst et al., 2003; Hoertel et al., 2013b; Merikangas et al., 2008; Ramsey et al., 2013; Zimmermann et al., 2009). Furthermore, the lifetime prevalence rate of manic symptoms in our study (18.7%) is consistent with recent data from the Epidemiologic Catchment Area Study (Ramsey et al., 2013) that found that the proportion of individuals with a lifetime history of at least two manic symptoms was 15.6%. In addition, this potential misclassification would have tended to bias our results towards the null hypothesis, suggesting the robustness of our findings.
Conclusion
Despite these limitations, by addressing several constraints of prior research and using Item Response Theory (IRT), the present study supports that the clinical presentation of depressive symptoms may differ substantially between unipolar and bipolar spectrum depression, highlighting the importance of continued research into specific pathophysiology differentiating these disorders to help clinicians ensure patients benefit from a thorough diagnostic assessment and formulation that can allow the delivery of optimal, evidence-based therapeutic interventions.
Supplementary Material
Highlights.
We examined differences between unipolar and bipolar spectrum depression symptom expression.
We used item response theory (IRT) methods to equate for levels of depression severity. The clinical presentation of depressive symptoms differed substantially between the two groups.
Continued research into specific pathophysiology differentiating these conditions is needed.
Footnotes
Publisher's Disclaimer: This is a PDF file of an unedited manuscript that has been accepted for publication. As a service to our customers we are providing this early version of the manuscript. The manuscript will undergo copyediting, typesetting, and review of the resulting proof before it is published in its final citable form. Please note that during the production process errors may be discovered which could affect the content, and all legal disclaimers that apply to the journal pertain.
References
- Asparouhov T. Sampling weights in latent variable modeling. Struct Equ Modeling. 2005;12:411–434. [Google Scholar]
- Aggen SH, Neale MC, Kendler KS. DSM criteria for major depression: evaluating symptom patterns using latent-trait item response models. Psychol Med. 2005;35:475–487. doi: 10.1017/s0033291704003563. [DOI] [PubMed] [Google Scholar]
- Akiskal HS, Benazzi F. Atypical depression: a variant of bipolar II or a bridge between unipolar and bipolar II? J Affect Disord. 2005;84:209–217. doi: 10.1016/j.jad.2004.05.004. [DOI] [PubMed] [Google Scholar]
- Alonso A, Molenberghs G. Surrogate marker evaluation from an information theory perspective. Biometrics. 2007;63:180–186. doi: 10.1111/j.1541-0420.2006.00634.x. [DOI] [PubMed] [Google Scholar]
- American Psychiatric Association. Diagnostic and statistical manual of mental disorders. 5th. Arlington: VAPP; 2013. [Google Scholar]
- Angst J, Azorin JM, Bowden CL, Perugi G, Vieta E, Gamma A, et al. Prevalence and characteristics of undiagnosed bipolar disorders in patients with a major depressive episode: the BRIDGE study. Arch Gen Psychiatry. 2011;68:791–798. doi: 10.1001/archgenpsychiatry.2011.87. [DOI] [PubMed] [Google Scholar]
- Angst J, Cui L, Swendsen J, Rothen S, Cravchik A, Kessler RC, et al. Major depressive disorder with subthreshold bipolarity in the National Comorbidity Survey Replication. Am J Psychiatry. 2010;167:1194–1201. doi: 10.1176/appi.ajp.2010.09071011. [DOI] [PMC free article] [PubMed] [Google Scholar]
- Angst J, Gamma A, Benazzi F, Ajdacic V, Eich D, Rossler W. Toward a redefinition of subthreshold bipolarity: epidemiology and proposed criteria for bipolar-II, minor bipolar disorders and hypomania. J Affect Disord. 2003;73:133–146. doi: 10.1016/s0165-0327(02)00322-1. [DOI] [PubMed] [Google Scholar]
- Benazzi F. Atypical depression in private practice depressed outpatients: a 203-case study. Compr Psychiatry. 1999;40:80–83. doi: 10.1016/s0010-440x(99)90081-0. [DOI] [PubMed] [Google Scholar]
- Benjamini Y, Hochberg Y. Controlling the false discovery rate: A practical and powerful approach to multiple testing. J R Statist Soc. 1995;57:289–300. [Google Scholar]
- Bowden CL. A different depression: clinical distinctions between bipolar and unipolar depression. J Affect Disord. 2005;84:117–125. doi: 10.1016/S0165-0327(03)00194-0. [DOI] [PubMed] [Google Scholar]
- Canino G, Bravo M, Ramirez R, Febo VE, Rubio-Stipec M, Fernandez RL, et al. The Spanish Alcohol Use Disorder and Associated Disabilities Interview Schedule (AUDADIS): reliability and concordance with clinical diagnoses in a Hispanic population. J Stud Alcohol. 1999;60:790–799. doi: 10.15288/jsa.1999.60.790. [DOI] [PubMed] [Google Scholar]
- Cassano GB, Akiskal HS, Musetti L, Perugi G, Soriani A, Mignani V. Psychopathology, temperament, and past course in primary major depressions. 2. Toward a redefinition of bipolarity with a new semistructured interview for depression. Psychopathology. 1989;22:278–288. doi: 10.1159/000284608. [DOI] [PubMed] [Google Scholar]
- Cooper PJ, Campbell EA, Day A, Kennerley H, Bond A. Non-psychotic psychiatric disorder after childbirth. A prospective study of prevalence, incidence, course and nature. Br J Psychiatry. 1988;152:799–806. doi: 10.1192/bjp.152.6.799. [DOI] [PubMed] [Google Scholar]
- Cuellar AK, Johnson SL, Winters R. Distinctions between bipolar and unipolar depression. Clin Psychol Rev. 2005;25:307–339. doi: 10.1016/j.cpr.2004.12.002. [DOI] [PMC free article] [PubMed] [Google Scholar]
- Endicott J, Nee J, Andreasen N, Clayton P, Keller M, Coryell W. Bipolar II. Combine or keep separate? J Affect Disord. 1985;8:17–28. doi: 10.1016/0165-0327(85)90068-0. [DOI] [PubMed] [Google Scholar]
- Fiedorowicz JG, Endicott J, Leon AC, Solomon DA, Keller MB, Coryell WH. Subthreshold hypomanic symptoms in progression from unipolar major depression to bipolar disorder. Am J Psychiatry. 2011;168:40–48. doi: 10.1176/appi.ajp.2010.10030328. [DOI] [PMC free article] [PubMed] [Google Scholar]
- Ghaemi SN, Boiman EE, Goodwin FK. Diagnosing bipolar disorder and the effect of antidepressants: a naturalistic study. J Clin Psychiatry. 2000;61:804–808. doi: 10.4088/jcp.v61n1013. [DOI] [PubMed] [Google Scholar]
- Grant BF, Dawson DA, Stinson FS, Chou PS, Kay W, Pickering R. The Alcohol Use Disorder and Associated Disabilities Interview Schedule-IV (AUDADIS-IV): reliability of alcohol consumption, tobacco use, family history of depression and psychiatric diagnostic modules in a general population sample. Drug Alcohol Depend. 2003;71:7–16. doi: 10.1016/s0376-8716(03)00070-x. [DOI] [PubMed] [Google Scholar]
- Grant BF, Goldstein RB, Chou SP, Huang B, Stinson FS, Dawson DA, et al. Sociodemographic and psychopathologic predictors of first incidence of DSM-IV substance use, mood and anxiety disorders: results from the Wave 2 National Epidemiologic Survey on Alcohol and Related Conditions. Mol Psychiatry. 2009;14:1051–1066. doi: 10.1038/mp.2008.41. [DOI] [PMC free article] [PubMed] [Google Scholar]
- Grant BF, Stinson FS, Dawson DA, Chou SP, Dufour MC, Compton W, et al. Prevalence and co-occurrence of substance use disorders and independent mood and anxiety disorders: results from the National Epidemiologic Survey on Alcohol and Related Conditions. Arch Gen Psychiatry. 2004a;61:807–816. doi: 10.1001/archpsyc.61.8.807. [DOI] [PubMed] [Google Scholar]
- Grant BF, Stinson FS, Dawson DA, Chou SP, Ruan WJ, Pickering RP. Co-occurrence of 12-month alcohol and drug use disorders and personality disorders in the United States: results from the National Epidemiologic Survey on Alcohol and Related Conditions. Arch Gen Psychiatry. 2004b;61:361–368. doi: 10.1001/archpsyc.61.4.361. [DOI] [PubMed] [Google Scholar]
- Hantouche EG, Akiskal HS. Bipolar II vs. unipolar depression: psychopathologic differentiation by dimensional measures. J Affect Disord. 2005;84:127–132. doi: 10.1016/j.jad.2004.01.017. [DOI] [PubMed] [Google Scholar]
- Harford TC, Chen CM, Saha TD, Smith SM, Hasin DS, Grant BF. An item response theory analysis of DSM-IV diagnostic criteria for personality disorders: findings from the national epidemiologic survey on alcohol and related conditions. Personal Disord. 2013;4:43–54. doi: 10.1037/a0027416. [DOI] [PMC free article] [PubMed] [Google Scholar]
- Hasin DS, Goodwin RD, Stinson FS, Grant BF. Epidemiology of major depressive disorder: results from the National Epidemiologic Survey on Alcoholism and Related Conditions. Arch Gen Psychiatry. 2005;62:1097–1106. doi: 10.1001/archpsyc.62.10.1097. [DOI] [PubMed] [Google Scholar]
- Hirschfeld RM, Lewis L, Vornik LA. Perceptions and impact of bipolar disorder: how far have we really come? Results of the national depressive and manic-depressive association 2000 survey of individuals with bipolar disorder. J Clin Psychiatry. 2003;64:161–174. [PubMed] [Google Scholar]
- Hoertel N, de Maricourt P, Gorwood P. Novel routes to bipolar disorder drug discovery. Expert Opin Drug Discov. 2013a;8:907–918. doi: 10.1517/17460441.2013.804057. [DOI] [PubMed] [Google Scholar]
- Hoertel N, Franco S, Wall MM, Oquendo MA, Kerridge BT, Limosin F, et al. Mental disorders and risk of suicide attempt: a national prospective study. Mol Psychiatry. 2015a;20:718–726. doi: 10.1038/mp.2015.19. [DOI] [PubMed] [Google Scholar]
- Hoertel N, Le Strat Y, Angst J, Dubertret C. Subthreshold bipolar disorder in a U.S. national representative sample: prevalence, correlates and perspectives for psychiatric nosography. J Affect Disord. 2013b;146:338–347. doi: 10.1016/j.jad.2012.09.016. [DOI] [PubMed] [Google Scholar]
- Hoertel N, Le Strat Y, Limosin F, Dubertret C, Gorwood P. Prevalence of subthreshold hypomania and impact on internal validity of RCTs for major depressive disorder: results from a national epidemiological sample. PloS one. 2013c;8:e55448. doi: 10.1371/journal.pone.0055448. [DOI] [PMC free article] [PubMed] [Google Scholar]
- Hoertel N, Lopez S, Peyre H, Wall MM, Gonzalez-Pinto A, Limosin F, et al. Are symptom features of depression during pregnancy, the postpartum period and outside the peripartum period distinct? Results from a nationally representative sample using item response theory (IRT) Depress Anxiety. 2015b;32:129–140. doi: 10.1002/da.22334. [DOI] [PMC free article] [PubMed] [Google Scholar]
- Hoertel N, McMahon K, Olfson M, Wall MM, Rodríguez-Fernández JM, Lemogne C, et al. A dimensional liability model of age differences in mental disorder prevalence: evidence from a national sample. J Psychiatr Res. 2015c;64:107–113. doi: 10.1016/j.jpsychires.2015.03.017. [DOI] [PMC free article] [PubMed] [Google Scholar]
- Hoertel N, Peyre H, Wall MM, Limosin F, Blanco C. Examining sex differences in DSM-IV borderline personality disorder symptom expression using Item Response Theory (IRT) J Psychiatr Res. 2014;59:213–219. doi: 10.1016/j.jpsychires.2014.08.019. [DOI] [PubMed] [Google Scholar]
- Hu L, Benter PM. Cutoff criteria for fit indexes in covariance structure analysis: Conventional criteria versus new alternatives. Struct Equ Modeling. 1999;6:1–55. [Google Scholar]
- Joffe RT, Young LT, MacQueen GM. A two-illness model of bipolar disorder. Bipolar Disord. 1999;1:25–30. doi: 10.1034/j.1399-5618.1999.10107.x. [DOI] [PubMed] [Google Scholar]
- Judd LL, Akiskal HS. The prevalence and disability of bipolar spectrum disorders in the US population: re-analysis of the ECA database taking into account subthreshold cases. J Affect Disord. 2003;73:123–131. doi: 10.1016/s0165-0327(02)00332-4. [DOI] [PubMed] [Google Scholar]
- Lewinsohn PM, Klein DN, Seeley JR. Bipolar disorders in a community sample of older adolescents: prevalence, phenomenology, comorbidity, and course. J Am Acad Child Adolesc Psychiatry. 1995;34:454–463. [PubMed] [Google Scholar]
- Lord F. Applications of Item Response Theory to Practical Testing Problems. Erlbaum; Hillsdale, NJ: 1980. [Google Scholar]
- McBride O, Strong DR, Kahler CW. Exploring the role of a nicotine quantity-frequency use criterion in the classification of nicotine dependence and the stability of a nicotine dependence continuum over time. Nicotine Tob Res. 2010;12:207–216. doi: 10.1093/ntr/ntp196. [DOI] [PMC free article] [PubMed] [Google Scholar]
- McMahon K, Herr NR, Zerubavel N, Hoertel N, Neacsiu AD. Psychotherapeutic Treatment of Bipolar Depression. Psychiatr Clin North Am. 2016;39:35–56. doi: 10.1016/j.psc.2015.09.005. [DOI] [PubMed] [Google Scholar]
- Merikangas KR, Herrell R, Swendsen J, Rossler W, Ajdacic-Gross V, Angst J. Specificity of bipolar spectrum conditions in the comorbidity of mood and substance use disorders: results from the Zurich cohort study. Arch Gen Psychiatry. 2004;65:47–52. doi: 10.1001/archgenpsychiatry.2007.18. [DOI] [PubMed] [Google Scholar]
- Millsap RE, Yun-Tein J. Assessing factorial invariance in ordered-categorical measures. Multivariate Behav Res. 2004;39:479–515. [Google Scholar]
- Mitchell P, Parker G, Jamieson K, Wilhelm K, Hickie I, Brodaty H, et al. Are there any differences between bipolar and unipolar melancholia? J Affect Disord. 1992;25:97–105. doi: 10.1016/0165-0327(92)90072-e. [DOI] [PubMed] [Google Scholar]
- Mitchell PB, Frankland A, Hadzi-Pavlovic D, Roberts G, Corry J, Wright A, et al. Comparison of depressive episodes in bipolar disorder and in major depressive disorder within bipolar disorder pedigrees. Br J Psychiatry. 2011;199:303–309. doi: 10.1192/bjp.bp.110.088823. [DOI] [PubMed] [Google Scholar]
- Mitchell PB, Goodwin GM, Johnson GF, Hirschfeld RM. Diagnostic guidelines for bipolar depression: a probabilistic approach. Bipolar Disord. 2008;10:144–152. doi: 10.1111/j.1399-5618.2007.00559.x. [DOI] [PubMed] [Google Scholar]
- Mitchell PB, Malhi GS. Bipolar depression: phenomenological overview and clinical characteristics. Bipolar Disord. 2004;6:530–539. doi: 10.1111/j.1399-5618.2004.00137.x. [DOI] [PubMed] [Google Scholar]
- Mitchell PB, Wilhelm K, Parker G, Austin MP, Rutgers P, Malhi GS. The clinical features of bipolar depression: a comparison with matched major depressive disorder patients. J Clin Psychiatry. 2001;62:212–216. [PubMed] [Google Scholar]
- Moreno C, Hasin DS, Arango C, Oquendo MA, Vieta E, Liu S, et al. Depression in bipolar disorder versus major depressive disorder: results from the National Epidemiologic Survey on Alcohol and Related Conditions. Bipolar Disord. 2012;14:271–282. doi: 10.1111/j.1399-5618.2012.01009.x. [DOI] [PMC free article] [PubMed] [Google Scholar]
- Muthén L, Muthén BO. User’s guide. Los Angeles: 2007. Mplus: Statistical analyses with latent variables. [Google Scholar]
- Nusslock R, Frank E. Subthreshold bipolarity: diagnostic issues and challenges. Bipolar Disord. 2011;13:587–603. doi: 10.1111/j.1399-5618.2011.00957.x. [DOI] [PMC free article] [PubMed] [Google Scholar]
- Olfson M, Das AK, Gameroff MJ, Pilowsky D, Feder A, Gross R, et al. Bipolar depression in a low-income primary care clinic. Am J Psychiatry. 2005;162:2146–2151. doi: 10.1176/appi.ajp.162.11.2146. [DOI] [PubMed] [Google Scholar]
- Parker G, Roy K, Wilhelm K, Mitchell P, Hadzi-Pavlovic D. The nature of bipolar depression: implications for the definition of melancholia. J Affect Disord. 2000;59:217–224. doi: 10.1016/s0165-0327(99)00144-5. [DOI] [PubMed] [Google Scholar]
- Perlis RH. Misdiagnosis of bipolar disorder. Am J Manag Care. 2005;11:271–274. [PubMed] [Google Scholar]
- Perlis RH, Brown E, Baker RW, Nierenberg AA. Clinical features of bipolar depression versus major depressive disorder in large multicenter trials. Am J Psychiatry. 2006;163:225–231. doi: 10.1176/appi.ajp.163.2.225. [DOI] [PubMed] [Google Scholar]
- Perugi G, Akiskal HS, Lattanzi L, Cecconi D, Mastrocinque C, Patronelli A, et al. The high prevalence of “soft” bipolar (II) features in atypical depression. Compr Psychiatry. 1998;39:63–71. doi: 10.1016/s0010-440x(98)90080-3. [DOI] [PubMed] [Google Scholar]
- Peyre H, Hoertel N, Cortese S, Acquaviva E, De Maricourt P, Limosin F, et al. Attention-deficit/hyperactivity disorder symptom expression: a comparison of individual age at onset using item response theory. J Clin Psychiatry. 2014;75:386–392. doi: 10.4088/JCP.13m08638. [DOI] [PubMed] [Google Scholar]
- Ramsey CM, Spira AP, Mojtabai R, Eaton WW, Roth K, Lee HB. Lifetime manic spectrum episodes and all-cause mortality: 26-year follow-up of the NIMH Epidemiologic Catchment Area Study. J Affect Disord. 2013;151:337–342. doi: 10.1016/j.jad.2013.06.019. [DOI] [PMC free article] [PubMed] [Google Scholar]
- Rihmer Z, Szadoczky E, Furedi J, Kiss K, Papp Z. Anxiety disorders comorbidity in bipolar I, bipolar II and unipolar major depression: results from a population-based study in Hungary. J Affect Disord. 2001;67:175–179. doi: 10.1016/s0165-0327(01)00309-3. [DOI] [PubMed] [Google Scholar]
- Rivollier F, Peyre H, Hoertel N, Blanco C, Limosin F, Delorme R. Sex differences in DSM-IV posttraumatic stress disorder symptoms expression using item response theory: A population-based study. J Affect Disord. 2015;187:211–217. doi: 10.1016/j.jad.2015.07.047. [DOI] [PMC free article] [PubMed] [Google Scholar]
- Robertson HA, Lam RW, Stewart JN, Yatham LN, Tam EM, Zis AP. Atypical depressive symptoms and clusters in unipolar and bipolar depression. Acta Psychiatr Scand. 1996;94:421–427. doi: 10.1111/j.1600-0447.1996.tb09884.x. [DOI] [PubMed] [Google Scholar]
- Scott NW, Fayers PM, Aaronson NK, Bottomley A, de Graeff A, Groenvold M, et al. Differential item functioning (DIF) analyses of health-related quality of life instruments using logistic regression. Health Qual Life Outcomes. 2010;8:81. doi: 10.1186/1477-7525-8-81. [DOI] [PMC free article] [PubMed] [Google Scholar]
- Simon GE, Von Korff M. Medical co-morbidity and validity of DSM-IV depression criteria. Psychol Med. 2006;36:27–36. doi: 10.1017/S0033291705006136. [DOI] [PubMed] [Google Scholar]
- Smith DJ, Craddock N. Unipolar and bipolar depression: different of the same? Br J Psychiatry. 2011;199:272–274. doi: 10.1192/bjp.bp.111.092726. [DOI] [PubMed] [Google Scholar]
- Solomon DA, Leon AC, Maser JD, Truman CJ, Coryell W, Endicott J, et al. Distinguishing bipolar major depression from unipolar major depression with the screening assessment of depression-polarity (SAD-P) J Clin Psychiatry. 2006;67:434–442. doi: 10.4088/jcp.v67n0315. [DOI] [PubMed] [Google Scholar]
- Steinberg L, Thissen D. Using effect sizes for research reporting: examples using item response theory to analyze differential item functioning. Psychol Methods. 2006;11:402–415. doi: 10.1037/1082-989X.11.4.402. [DOI] [PubMed] [Google Scholar]
- Stensland MD, Schultz JF, Frytak JR. Diagnosis of unipolar depression following initial identification of bipolar disorder: a common and costly misdiagnosis. J Clin Psychiatry. 2008;69:749–758. doi: 10.4088/jcp.v69n0508. [DOI] [PubMed] [Google Scholar]
- Strong DR, Kahler CW, Colby SM, Griesler PC, Kandel D. Linking measures of adolescent nicotine dependence to a common latent continuum. Drug Alcohol Depend. 2009;99:296–308. doi: 10.1016/j.drugalcdep.2008.09.001. [DOI] [PMC free article] [PubMed] [Google Scholar]
- Swann A. Is bipolar depression a specific biological entity? In: Young LT, Joffe RT, editors. Bipolar Disorder: Biological Models and Their Clinical Application. New York: Dekker; 1994. pp. 225–286. [Google Scholar]
- Uebelacker LA, Strong D, Weinstock LM, Miller IW. Use of item response theory to understand differential functioning of DSM-IV major depression symptoms by race, ethnicity and gender. Psychol Med. 2009;39:591–601. doi: 10.1017/S0033291708003875. [DOI] [PMC free article] [PubMed] [Google Scholar]
- Uebelacker LA, Strong D, Weinstock LM, Miller IW. Likelihood of suicidality at varying levels of depression severity: a re-analysis of NESARC data. Suicide Life Threat Behav. 2010;40:620–627. doi: 10.1521/suli.2010.40.6.620. [DOI] [PMC free article] [PubMed] [Google Scholar]
- Weinstock LM, Strong D, Uebelacker LA, Miller IW. Differential item functioning of DSM-IV depressive symptoms in individuals with a history of mania versus those without: an item response theory analysis. Bipolar Disord. 2009;11:289–297. doi: 10.1111/j.1399-5618.2009.00681.x. [DOI] [PMC free article] [PubMed] [Google Scholar]
- Weinstock LM, Strong D, Uebelacker LA, Miller IW. DSM-IV depressive symptom expression among individuals with a history of hypomania: a comparison to those with or without a history of mania. J Psychiatr Res. 2010;44:979–985. doi: 10.1016/j.jpsychires.2010.03.010. [DOI] [PMC free article] [PubMed] [Google Scholar]
- Weiss D, Davison ML. Test Theory and Methods. Annu Rev Psychol. 1981;32:629–658. [Google Scholar]
- Whiffen VE. The comparison of postpartum with non-postpartum depression: a rose by any other name. J Psychiatry Neurosci. 1991;16:160–165. [PMC free article] [PubMed] [Google Scholar]
- Whiffen VE, Gotlib IH. Comparison of postpartum and nonpostpartum depression: clinical presentation, psychiatric history, and psychosocial functioning. J Consult Clin Psychol. 1993;61:485–494. doi: 10.1037//0022-006x.61.3.485. [DOI] [PubMed] [Google Scholar]
- Wilkinson L, Task Force on Statistical Inference Statistical methods in psychology journals: Guidelines and explanations. Am Psychol. 1999;54:595–604. [Google Scholar]
- Zimmermann P, Bruckl T, Nocon A, Pfister H, Lieb R, Wittchen HU, et al. Heterogeneity of DSM-IV major depressive disorder as a consequence of subthreshold bipolarity. Arch Gen Psychiatry. 2009;66:1341–1352. doi: 10.1001/archgenpsychiatry.2009.158. [DOI] [PubMed] [Google Scholar]
- Zumbo B. A Handbook on the Theory and Methods of Differential Item Functioning (DIF): Logistic Regression Modeling as a Unitary Framework for Binary and Likert-type (Ordinal) Item Scores. Ottawa, Canada: 1999. [Google Scholar]
Associated Data
This section collects any data citations, data availability statements, or supplementary materials included in this article.