Abstract
BACKGROUND:
Therapy for osteoarthritis (OA) with satisfactory results has not been found to date. In OA pathogenesis, RELA gene involved in cartilage degradation and MMP-13 in degrade cartilage, as a member family of NF-κβ genes, RELA serves to modulate inflammatory responses and activates pro-inflammatory cytokines.
AIM:
This study aims to identify the influence of Wharton Jelly Mesenchymal Stem Cell (MSC-WJ) on MMP-13 and RELA expression gene in synoviocyte by in vitro.
MATERIAL AND METHODS:
This research is pure experimental research. The sample used derived from synovial tissue of OA patients who underwent Total Knee Replacement (TKR) surgery. This study was divided into six groups treated with 4 replications. Group I and II (control groups) were synoviocyte of OA incubated for 24 and 48 hours, respectively. Group III and IV were MSC-WJ incubated for 24 and 48 hours, respectively. Group V and VI were Synoviocyte-MSC-WJ co-culture group incubated for 24 and 48 hours, respectively. Identification of MMP-13 and RELA gene expression in each group was performed by using qPCR.
RESULT:
The results showed that MSC-WJ reduced MMP-13 gene expression after co-culture for 24 and 48 hours in OA synoviocyte. The highest gene expression of MMP-13 was in Group I and II (1.00 ng/μl), followed by Group III (0.41 ng/μl), Group IV (0.24 ng/μl), Group V (0.13 ng/μl), and Group VI (0.04 ng/μl). MSC-WJ administration also decreased RELA gene expression. The highest gene expression of RELA gene was in Group I and II (1.00 ng/μl), Group V (0.67 ng/μl), Group III (0.58 ng/μl), Group IV (0.16 ng/μl), and Group VI (0.16 ng/μl).
CONCLUSION:
This study concluded that MSC-WJ in OA synoviocyte significantly reduced the expression of MMP-13 and RELA gene (p <0.05).
Keywords: Matrix Metalloproteinase-13, RELA, Mesenchymal Stem Cell Wharton Jelly, Co-culture
Introduction
Osteoarthritis (OA) is a local disease, caused by primary and secondary degenerative disorders due to “wear and tear” and ageing process [1]. According to the World Health Organization (2004), the prevalence of OA in the world reached 151.4 million people, and about 27.4 million people were in the Southeast Asia region. In Indonesia, 8.1% of the total population experienced OA [2].
At the molecular level, the imbalance between catabolic and anabolic in the joint cartilage causes OA [3]. The expression of several genes involved in inflammatory responses and cartilage degradation, such as IL-1 and TNF-α, is regulated predominantly by Nuclear Factor Kappa Beta (NF-κβ). NF-κβ stimulates TNF-α and IL-1β cytokines which contribute to the inflammatory process in OA. NF-κβ is also important in the transcription process of MMP-13 gene [4], [5]. RELA is a subunit of the NF-κβ p65 gene which plays an important role in the pathogenesis of OA.
In the last decade, stem cell research has shown rapid progress. The stem cells were employed to identify growth and development process of human body tissues, and the pathogenesis of diseases suffered.
This study aims to investigate the influence of Wharton Jelly Mesenchymal Stem Cell (MSC-WJ) on Matrix Metalloproteinase-13 and RELA gene expression in synoviocyte by in vitro.
Material and Method
A pure experimental study was divided into six treatment groups with four replications. Group I and II (control groups) were synoviocyte of OA incubated for 24 and 48 hours, respectively. Group III and IV were Mesenchymal Stem Cell-Wharton Jelly incubated for 24 and 48 hours, respectively. Group V and VI were synoviocyte- Mesenchymal Stem Cell-Wharton Jelly co-culture group incubated for 24 and 48 hours, respectively. Each treatment group consisted of 105 cells, each for synoviocyte and Mesenchymal Stem Cell-Wharton Jelly cells. Mesenchymal Stem Cell-Wharton Jelly derived from IMERI (Indonesian Medical Education and Research Institute) Faculty of Medicine, University of Indonesia. Synoviocyte is derived from synovial tissue of OA grade IV underwent Total Knee Replacement (TKR) surgery at Public Hospital Dr M. Djamil Padang, Indonesia. The experimental synoviocyte were the results of the 3rd passage cell culture. The samples taken did not use informed consent because the samples used were stored biologically after post-knee joint surgery Osteoarthritis Grade IV. Samples were taken from six patients with male sex aged 40-70 years.
Isolation of OA primary cells
Synovial tissue and search are obtained from OA patients after Total Knee Replacement (TKR). Ten samples were used for experiments. Synovial tissue is planted in the well plate with 10% Fetal Bovine Serum (FBS), 1% penicillin/streptomycin and 1% fungizone in Dulbecco’s Modified Eagle’s Medium (DMEM, Life Technologies) which is planted with an explant planting system. Cells were sub-cultured three times, and and the result of 3rd sub-culture was used for treatment. Each experiment was repeated for three times.
Coculture of stem cells with OA primary cells
OA primary cells were cultured with 50–60% confluence, then cultured together with mesenchymal stem cells from Wharton Jelly. The cells were observed for 24 and 48 hours and calculated with Haemocytometer with 105 cells/well.
RNA extraction and cDNA synthesis
RNA was extracted from the isolates of synovial tissue grade IV from OA patients with TRIzol® (Invitrogen, USA) according to the manufacturer’s protocol. The quantity of RNA was calculated by NanoDrop. Synthesis of cDNA was performed by using iScript cDNA Synthesis Kit (BioRad, USA) on thermal cycler C1000 (BioRad, USA) Reverse Transcriptase PCR (RT-PCR) devices. The reaction of cDNA synthesis was 5 μg total RNA, 1 x RT buffer, 20 pmol oligodT, 4 mM dNTP, 10 mM DTT, 40 U TMII RTase and H2O-DEPC SuperScript enzymes with a total volume of 20 μl. The cDNA synthesis was performed at 52°C for 50 min according to the manual kit protocol (Biorad, USA).
PCR Gradient Amplification
DNA was amplified with SYBR Green amplification kits. The PCR program was 95°C pre-denaturation for 30 sec, followed by 5-sec denaturation, gradient annealing at 55°C for 5 sec for 50 cycles, additional melting curve 65-95°C with an increase of 0.5°C every 5 sec.
Measurement of gene concentration
The measurement of gene concentration in this study was the relative quantification method (Livak-Schmittgen, 2001) [5].
ΔCT experiment = CT experiment target –experiment housekeeping
ΔCT control = CT control target –control housekeeping
ΔΔCT experiment = ΔCT experiment– ΔCTcontrol
The comparison of gene expression levels = 2ΔΔCT. The measurement of gene concentration was by using LightCycler® software program referred to Livak formula (concentration in picogram size). HPRT1 gene was a housekeeping gene, and calibrator gene was from the control group.
Research Ethics
This study was already passed the ethics clearance and has been approved by the Ethics Committee of the Faculty of Medicine, Andalas University, Padang with registration number: 550/KEP/FK/2017 (Attached).
Statistical analysis
Normality test for MMP-13 and RELA gene expression was performed using Saphiro Wilk Test and homogeneity test with Levene test. The data is normally distributed if p-value > 0.05 and homogenous if p-value > 0.05. For MMP-13 gene expression, normally distributed and homogeneous data were analysed with ANOVA Test and Tukey’s HSD Post hoc Test. For RELA gene expression, the data were not normally distributed, and homogeneous were analysed with a non-parametric test (Kruskal Wallis test) then followed by Mann Whitney Test) [6].
Results
Sample Characteristics
The result of synoviocyte isolation from synovial tissue was fibroblast-shaped cells, cultured in a plate. The morphology of synoviocyte is presented in Figure 1.
Figure 1.
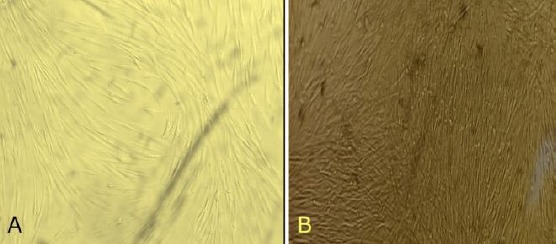
Morphology cells (A) Cell synoviocyte and (B) MSC-WJ
In each passage, cell morphology is like a fibroblast cell, a nucleus located in the middle of the cell and attaches to the base of the flask containing a complete medium.
Figure 2.
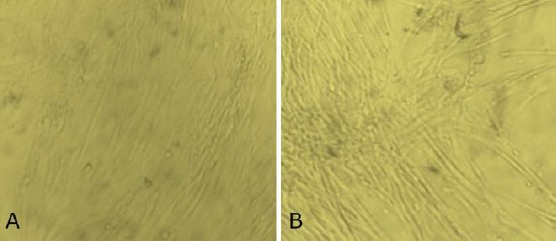
Morphology of synoviocyte co-culture MSC-WJ (A) Co-culture 24 hour and (B) Co-culture 48 hour
The optimisation of RT-PCR was presented in Figure 4. The MMP-13 target gene is well-amplified (Figure 4A). The melting peak graph (Figure 4B) of MMP-13 primer optimisation was sharp and homogeneous peaks.
Figure 4.

qPCR primer optimisation results of MMP-13 gene (A) Amplification curve results on qPCR and (B) Homogeneous melting peak graphs from the results of qPCR
Figure 3.
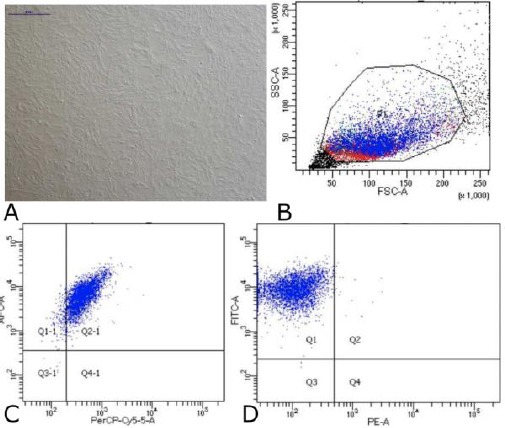
Data on Characteristics of Mesenchymal Stem Cells Wharton Jelly. (A) Cells MSC-WJ reach confluence. Scale bar: 500 µM. Photographs of cells taken using a Nikon Ti-S microscope. (B) Data flow cytometry. Forward scatter (FCS) plot & side scatter (SSC) plot. Population gated events (P1): 20,000. (C) Cell surface markers expression: CD73-APC 99.8% and CD105- PerCP-Cy5.5 95%. (D) Cell surface markers expression: CD90-FITC 99.9% and Lin (-) - PE 0.4%
Electrophoresis was performed to confirm the result of primer optimisation in Figure 5. The results of RT- PCR optimisation for RELA genes and HPRT1 as the housekeeping gene, as shown in Figure 6 and confirmed with electrophoresis on agarose gel 0.5% in Figure 7.
Figure 5.
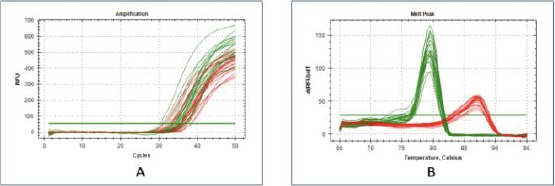
qPCR primer optimisation results of RELA gene (A) Amplification curve results on qPCR and (B) Homogeneous melting peak graphs from the results of qPCR
Figure 6.
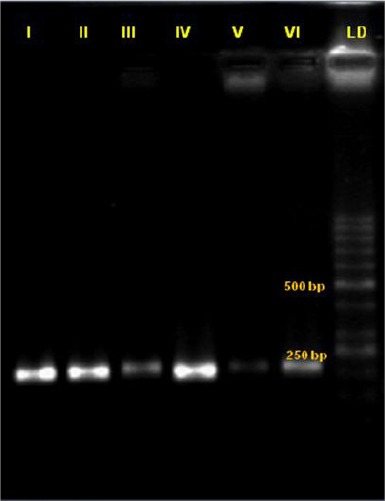
Results of the primer optimisation on electrophoresis of the MMP-113 gene
Figure 7.
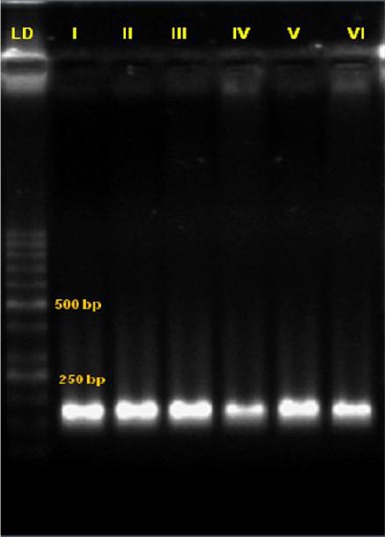
Results of the primer optimisation on electrophoresis of the RELA gene
MMP-13 gene expression
A preliminary analysis (normality and homogeneity tests) was performed before the ANOVA test. Normality test with Saphiro Wilk Test showed a significant result (≥ 0.05, data was normally distributed) in all treatment group.
Descriptive analysis with Skewness ratio < 2 in all treatment groups. Homogeneity test with the Levene test was 0.18 ≥ 0.05, showed that data of MMP-13 have the same (homogeneous) variant.
The analysis was continued to ANOVA test and then Post Hoc Tukey’s HSD Test. Anova test for MMP-13 gene expression was F = 5.963 with a significance value (0.002 ≤ 0.05). There are significant differences between treatment groups. Based on the results, analysis of Tukey’s HSD Post Hoc Test was continued to find the differences between groups.
Table 1 summarises the results of the ANOVA test and the differences between treatment groups summarised in Table 2.
Table 1.
Primer Design
| No. Primer Nucleotide Sequence NM Amplicon | NCBI Accession Size | Number Gene |
|---|---|---|
| 1. MMP-13F 5’-CACTTTATGCTTACTGATGACG-3’ | NM_002427.3 | 154 bp |
| 2. MMP-13R 5’-TCCTCGGAGACTGGTAATGG-3’ | NM_002427.3 | 154 bp |
| 3. RELA F 5’-CGCATCCAGACCAACAACAA-3’ | NM_001243984.1 | 154 bp |
| 4. RELA R 5’-AGATGGGATGAGAAAGGACAGG-3’ | NM_001243984.1 | 154 bp |
| 5. HPRT1 5’-CCTGGCGTCGTGATTAGTGAT-3’ | NM_000194.2 | 158 bp |
| 6. HPRT1 5’-CCCATCTCCTTCATCACATCTC-3’. | NM_000194.2 | 158 bp |
Table 1.
MMP-13 gene expression level toward several treatment groups in OA
| Groups | MMP-13 gene expression (ng/µl) | |
|---|---|---|
| Average | p-value | |
| Group I | 1.00 ± 0.00 | 0.002 |
| Group II | 1.00 ± 0.00 | |
| Group III | 0.41 ± 0.13 | |
| Group IV | 0.24 ± 0.03 | |
| Group V | 0.13 ± 0.04 | |
| Group VI | 0.04 ± 0.01 | |
Description: Group I = Synoviocyte control incubated for 24 hours; Group II = Synoviocyte control incubated for 48 hours; Group III= Mesenchymal Stem Cell Wharton Jelly (MSC-WJ) incubated for 24 hours; Group IV = Mesenchymal Stem Cell Wharton Jelly (MSC-WJ) incubated for 48 hours; Group V = Synoviocyte MSC-WJ co-culture incubated for 24 hours; Group VI = Synoviocyte MSC-WJ co-culture incubated for 48 hours.
Figure 8.
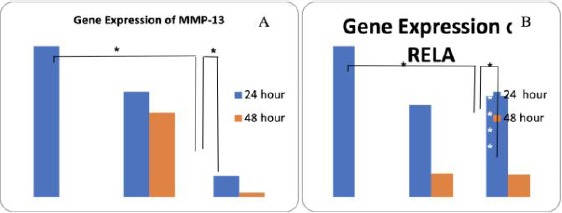
Gene Expression (A) MMP-13 and (B) RELA
The highest gene expression of MMP-13 was in Group I and II (1.00 ng/μl), followed by Group III (0.41 ng/μl), Group IV (0.24 ng/μl), Group V (0.13 ng/μl), and Group VI (0.04 ng/μl).
Description: Group I = Synoviocyte control incubated for 24 hours; Group II = Synoviocyte control incubated for 48 hours; Group III= Mesenchymal Stem Cell Wharton Jelly (MSC-WJ) incubated for 24 hours; Group IV = Mesenchymal Stem Cell Wharton Jelly (MSC-WJ) incubated for 48 hours; Group V = Synoviocyte MSC-WJ co-culture incubated for 24 hours; Group VI= Synoviocyte MSC-WJ co-culture incubated for 48 hours.
The treatment group shows significant differences in MMP-13 gene expression between groups I, III, IV, V and VI, whereas there was no significant difference between groups I and II (p < 0.05).
RELA Gene Expression
A normality and homogeneity tests were performed before the ANOVA test. Normality test with Saphiro Wilk Test showed a significant result (≥ 0.05, data was normally distributed) in all treatment group. Descriptive analysis with Skewness ratio < 2 in all treatment groups. Homogeneity test with Levene test was 0.013 ≥ 0.05, showed that data of MMP-13 were not homogeneous. The analysis was continued to non-parametric test (Kruskal Wallis test), Mann Whitney test was done if the different was significant.
The highest gene expression of RELA gene was in Group I and II (1.00 ng/μl), Group V (0.67 ng/μl), Group III (0.58 ng/μl), Group IV (0.16 ng/μl), and Group VI (0.16 ng/μl) (Table 3). Analysis of MSC-WJ administration toward RELA gene expression among treatment groups was presented in Table 3.
Table 2.
Analysis of the effect of MSC-WJ administration toward MMP-13 gene expression (ng/µl)
| Groups | MMP-13 gene expression (ng/µl) | |||||
|---|---|---|---|---|---|---|
| I | II | III | IV | V | VI | |
| I | - | 1.00 | 0.00 | 0.00 | 0.00 | 0.00 |
| II | 1.00 | - | 0.00 | 0.00 | 0.00 | 0.00 |
| III | 0.00 | 0.00 | - | 0.11 | 0.00 | 0.00 |
| IV | 0.00 | 0.00 | 0.11 | - | 0.06 | 0.00 |
| V | 0.00 | 0.00 | 0.00 | 0.06 | - | 0.00 |
| VI | 0.00 | 0.00 | 0.00 | 0.06 | 0.00 | - |
*) Significantly different (p < 0.05).
There were significant different in RELA gene expression between groups I with groups III, IV, V and VI (p < 0.05), whereas there was no significant different (p > 0.05) between groups I and II (MSC-WJ administration no affected RELA gene expression in 24 and 48-hour synoviocyte group (p > 0.05). The expression of RELA gene between group II and group III, IV, V, VI was significantly different (p < 0.05) [6] RELA gene expression in group II was higher than group III, IV, V and VI as shown in Table 4.
Table 3.
Analysis of the effect of MSC-WJ administration toward RELA gene expression (ng/µl) with Mann Whitney test
| Groups | RELA gene expression (ng/µl) | |||||
|---|---|---|---|---|---|---|
| I | II | III | IV | V | VI | |
| I | - | 1.00 | 0.01 | 0.01 | 0.01 | 0.01 |
| II | 1.00 | - | 0.01 | 0.01 | 0.01 | 0.01 |
| III | 0.01 | 0.01 | - | 0.02 | 0.25 | 0.02 |
| IV | 0.01 | 0.01 | 0.02 | - | 0.02 | 1.00 |
| V | 0.01 | 0.01 | 0.25 | 0.02 | - | 0.02 |
| VI | 0.01 | 0.01 | 0.02 | 1.00 | 0.02 | - |
*) Significantly different (p < 0.05)
Table 4.
Analysis of the effect of MSC-WJ administration toward MMP-13 gene expression (ng/µl)
| Groups | RELA gene expression (ng/µl) (ng/µl) | |
|---|---|---|
| Average | p-value | |
| Group I | 1.00 ± 0.00 | 0.001 |
| Group II | 1.00 ± 0.00 | |
| Group III | 0.58 ± 0.04 | |
| Group IV | 0.16 ± 0.04 | |
| Group V | 0.67 ± 0.10 | |
| Group VI | 0.16 ± 0.01 | |
Description: Group I = Synoviocyte control incubated for 24 hours; Group II = Synoviocyte control incubated for 48 hours; Group III = Mesenchymal Stem Cell Wharton Jelly (MSC-WJ) incubated for 24 hours; Group IV = Mesenchymal Stem Cell Wharton Jelly (MSC-WJ) incubated for 48 hours; Group V = Synoviocyte MSC-WJ co-culture incubated for 24 hours; Group VI = Synoviocyte MSC-WJ co-culture incubated for 48 hours.
The expression of RELA gene between group III and group V was not significantly different (p > 0.005), whereas between group III and groups I, II, IV and VI, the expression of RELA was significantly different (p < 0.05). The expression of RELA gene in group III was higher than groups IV and VI, but lower than groups I, II and V.
There was a significantly different (p < 0.05) between group IV with groups I, II, III and V. RELA gene expression between group IV and group VI was not significant (p > 0.05), expression level in group IV was lower than group I, II, III and V, but similar to group VI (Table 4). RELA gene expression between group V with groups I, II, IV and VI was significantly different (p < 0.05), but not for group III (p > 0.05). RELA gene expression level in group V was higher than groups III, IV and VI, but lower than groups I and II. RELA gene expression between group VI and groups I, II, III and V were statistically different (p < 0.05). The gene expression in group VI was lower than groups I, II, III and V, while group IV was not significantly different (p > 0.05). The expression in group VI was lower than groups I, II, III and V. The expression level of RELA genes in groups IV and VI was similar.
Discussion
In the present study, the lowest MMP-13 gene expression was shown in group VI (48 hours synoviocyte MSC-WJ co-culture group). The results of this study showed that MSC-WJ culture in synoviocyte OA after 48 hours reduced MMP-13 gene expression by 0.04 times compared to the control group, whereas in group V (24 hours MSC-WJ cell culture) synoviocyte culture) reduced gene expression MMP-13 in OA synoviocyte cells was 0.13 times compared to the control group (p < 0.05).
From the results of Tukey’s Test, HSD in Table 1, there were not significantly different between 24 and 48 hours synoviocyte control groups. MMP-13 is released in synoviocyte of OA when inflammation occurs. According to Li, et al., 2011 it is said that when compared with other types of MMP, MMP-13 is an important target gene during the development of OA because MMP-13 gene expression is specifically found in cartilages and no MMP-13 expression is found in normal patient cartilages [7].
In MSC-WJ culture group for 24 and 48 hours, the MMP-13 gene was expressed (the result of electrophoresis). Almaki and Agrawal (2016) revealed that MMP plays an important role in the process of proliferation, migration, angiogenesis and differentiation of mesenchymal stem cells. MMP-13 gene expression increases in the process of chondrogenic and osteogenic differentiation of Mesenchymal Stem Cell [8]. The previous study conducted by Mannello et al., (2006) investigated the role and function of MMP in the process of differentiation and characterisation of Mesenchymal Stem Cell, MMP-13 is also involved in the initial phase of the differentiation process from MSC [9]. In the differentiation process of MSC into chondrocytes, MMP-13 gene expression increases, but the specific mechanism is still unknown [10].
The results of the Tukey test for 24- and 48-hour synoviocyte-MSC-WJ co-culture groups showed significantly different compared to the control of synoviocyte. Weiss et al., (2017) found that meniscus cells co-cultured with MSC significantly reduce MMP-13 gene expression. The results of the study found that MMP-13 gene expression in 48 hours synoviocyte MSC-WJ co-culture group was lower than 48 hours synoviocyte MSC-WJ co-culture group [11].
RELA gene expression
In the current study, the lowest gene expression of RELA was in group VI (a treatment group of synoviocyte and MSC-WJ co-culture for 48 hours). The result was by the initial hypothesis that MSC-WJ decreases the expression of RELA gene. RELA gene expression in 48-hour synoviocyte and MSC-WJ co-culture group decreased 0.16 times relatively lower compared to the control group, whereas in group V which was the co-culture treatment group of synoviocyte and MSC-WJ cells during 24 hours decreased by 0.67 times relatively lower than the control group.
In the initial inflammatory process, RELA gene as a sub-family of NF-κβ is involved in the expression of several genes that play a role in the inflammatory response. The transcription of NF-κβ is stimulated by pro-inflammatory cytokines and chemokines. Activation of NF-κβ triggers the expression of genes to induce articular joint damage resulting in osteoarthritis. In line with Tortatore et al., (2012) reported that low value of ΔCq in synoviocyte OA control group increases RELA gene expression [12]. NFKβ activity will be high during the initial formation of new bones, including cartilage, but will decrease after the bones become mature [13]. High expression levels of RELA gene in 24-hour MSC-WJ co-culture group showed that NF-κβ plays a role in the differentiation and self-renewal processes of MSC-WJ [14]. Most of the pro-inflammatory effects of interferon γ and TNF-α are induced through NF-κβ translocation; the pathway is also modulated by MSC. Wen et al., (2014) stated that the expression of NF-κβ p-65 gene (RELA) increased significantly in the first 24 hours and 48 hours [15]. NF-κβ activity is high during the initial formation of new bone, including cartilage, but will decrease after the bone is mature [13].
The relative expression of RELA gene in 48-hour synoviocyte MSC-WJ co-culture group was significantly lower than the 24-hour synoviocyte MSC-WJ co-culture group. The result was due to the effect of MSC-WJ immunomodulatory which has begun to work on synoviocyte OA to control NF-κβ gene. Wen et al. (2014) reported that bone marrow-derived Mesenchymal Stem Cells modulate the effects of pro-inflammatory cytokines on human corneal epithelial cells. This study explained that the influence of MSC-WJ on synoviocyte of OA toward the parameters of MMP-13 and RELA genes expression as a subfamily of NF-κβ gene sub-unit p65. In general, MSC-WJ can reduce the expression of MMP-13 and RELA genes which are pro-inflammatory cytokines in osteoarthritis. The results of the study are useful as a reference for the use of stem cells, especially for MSC-WJ as a promising OA therapy in the future [15].
This study concluded that MSC-WJ in OA synoviocyte significantly reduced the expression of MMP-13 and RELA gene (p < 0.05).
Acknowledgement
The authors thank Andalas Cancer Research Center and Stem Cell (ACRC) and Biomedical Laboratory, Faculty of Medicine, Andalas University and Indonesian Medical Education and Research Institute (IMERI), Faculty of Medicine, University of Indonesia.
Footnotes
Funding: This research did not receive any financial support
Competing Interests: The authors have declared that no competing interests exist
References
- 1.Price SA, Wilson LM. Patofisiologi konsep klinis proses-proses penyakit. ed VI. Jakarta: EGC; 2013. [Google Scholar]
- 2.WHO. The global burden of disease 2004 Update. Switzerland: WHO Press; 2004. [Google Scholar]
- 3.Ahmed S, Anuntiyo J, Malemud CJ, Haqqi TM. Biological basis for the use of botanicals in osteoarthritis and rheumatoid arthritis:a review. Evid Based Complement Alternat Med. 2005;2(3):301–8. doi: 10.1093/ecam/neh117. https://doi.org/10.1093/ecam/neh117 PMid:16136208 PMCid:PMC1193557. [DOI] [PMC free article] [PubMed] [Google Scholar]
- 4.Roman-Blas JA, Jimenez SA. NF-κB as a potential therapeutic target in osteoarthritis and rheumatoid arthritis. Osteoarthritis and cartilage. 2006;14(9):839–48. doi: 10.1016/j.joca.2006.04.008. https://doi.org/10.1016/j.joca.2006.04.008 PMid:16730463. [DOI] [PubMed] [Google Scholar]
- 5.Livak KJ, Schmittgen TD. Analysis of relative gene expression data using real-time quantitative PCR and the 2- ΔΔCT method. methods. 2001; 25(4):402–8. doi: 10.1006/meth.2001.1262. https://doi.org/10.1006/meth.2001.1262 PMid:11846609. [DOI] [PubMed] [Google Scholar]
- 6.Razali NM, Wah YB. Faculty of Computer and Mathematical Science. University Technology MARA; 2017. Power comparison of Saphiro Wilk, Kolmogorov- Smirnov, Lilefors and Anderson Drling-test. [Google Scholar]
- 7.Li NG, Shi ZH, Tang YP, Wang ZJ, Song SL, Qian LH, Qian DW, Duan JA. New hope for the treatment of osteoarthritis through selective inhibition of MMP-13. Current medicinal chemistry. 2011;18(7):977–1001. doi: 10.2174/092986711794940905. https://doi.org/10.2174/092986711794940905. [DOI] [PubMed] [Google Scholar]
- 8.Almalki SG, Agrawal DK. Effects of matrix metalloproteinases on the fate of mesenchymal stem cells. Stem cell research &therapy. 2016;7(1):129. doi: 10.1186/s13287-016-0393-1. https://doi.org/10.1186/s13287-016-0393-1 PMid:27612636 PMCid:PMC5016871. [DOI] [PMC free article] [PubMed] [Google Scholar]
- 9.Manello F, Tonti GAM, Bagnara GP, Papa S. Role and function matrix metalloproteinases in the differentiation and biological characterization of mesenchymal stem cells. The stem cell niche :Consise Review. 2006;24:475–481. doi: 10.1634/stemcells.2005-0333. https://doi.org/10.1634/stemcells.2005-0333 PMid:16150919. [DOI] [PubMed] [Google Scholar]
- 10.Li H, Wang D, Yuan Y, Min J. New insights on the MMP-13 regulatory network in the pathogenesis of early osteoarthritis. Arthritis research &therapy. 2017;19(1):248. doi: 10.1186/s13075-017-1454-2. https://doi.org/10.1186/s13075-017-1454-2 PMid:29126436 PMCid:PMC5681770. [DOI] [PMC free article] [PubMed] [Google Scholar]
- 11.Weiss WM, Mulet-Sierra A, Kunze M, Jomha NM, Adesida AB. Coculture of meniscus cells and mesenchymal stem cells in simulated microgravity. NPJ Microgravity. 2017;3(1):28. doi: 10.1038/s41526-017-0032-x. https://doi.org/10.1038/s41526-017-0032-x PMid:29147680 PMCid:PMC5681589. [DOI] [PMC free article] [PubMed] [Google Scholar]
- 12.Tornatore L, Thotakura AK, Benrett J, Morelti M, Franzoso G. The nuclear factor kappa beta signaling pathway:Integrating metabolism with inflammation;Trends in Cell Biology. 2012; 22(11):557–566. doi: 10.1016/j.tcb.2012.08.001. https://doi.org/10.1016/j.tcb.2012.08.001 PMid:22995730. [DOI] [PubMed] [Google Scholar]
- 13.Krum SA, Chang J, Miranda-Carboni G, Wang CY. Novel functions for NFκB:inhibition of bone formation. Nature Reviews Rheumatology. 2010;6(10):607–611. doi: 10.1038/nrrheum.2010.133. https://doi.org/10.1038/nrrheum.2010.133 PMid:20703218 PMCid:PMC3078572. [DOI] [PMC free article] [PubMed] [Google Scholar]
- 14.Yang ZX, Han ZB, Ji YR, Wang YW, Liang L, Chi Y, et al. CD106 identifies a subpopulation of mesenchymal stem cells with unique immunomodulatory properties. PLoS One. 2013;8(3):e59354. doi: 10.1371/journal.pone.0059354. https://doi.org/10.1371/journal.pone.0059354 PMid:23555021 PMCid:PMC3595282. [DOI] [PMC free article] [PubMed] [Google Scholar]
- 15.Wen I, Zhu M, Petsoglou C. Differentiation and immunomodulatory effects of bone marro-derived mesenchymal stem cellon human corneal epithelium. Chin J Cell. 2014;4:105–15. [Google Scholar]


